Sample Category Title
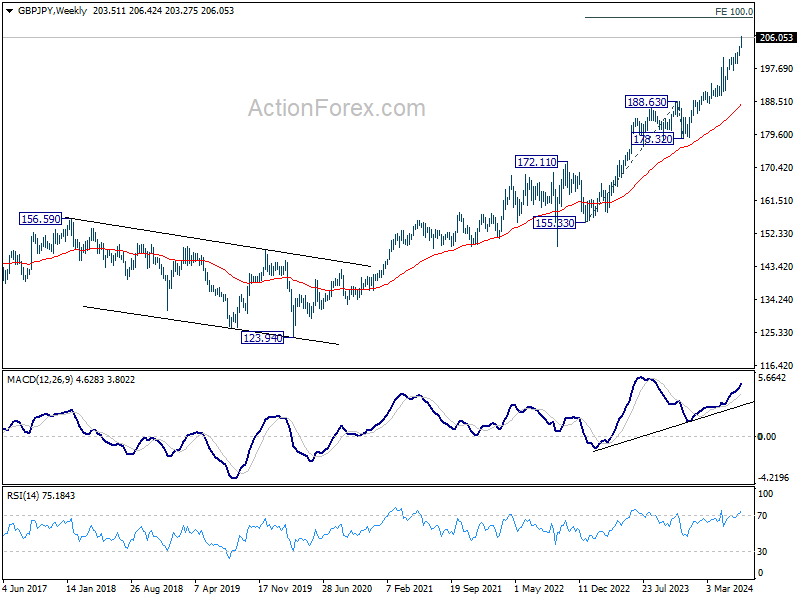
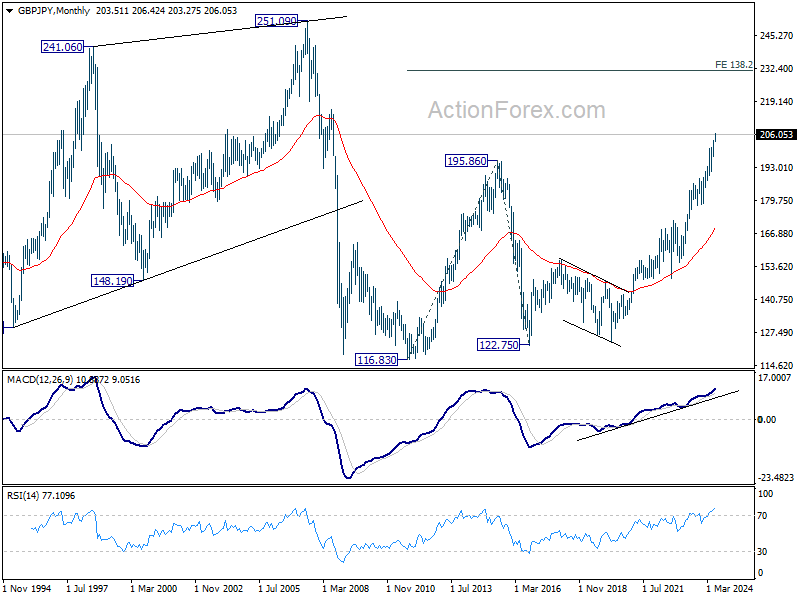
GBP/JPY Weekly Outlook
GBP/JPY's up trend continued last week and hit as high as 206.42. Initial bias is on the upside this week for further rally. Firm break of 100% projection of 191.34 to 200.72 from 197.18 at 206.56 will target 138.2% projection at 210.17. On the downside, below 204.97 minor support will turn bias to the downside for deeper pull back.
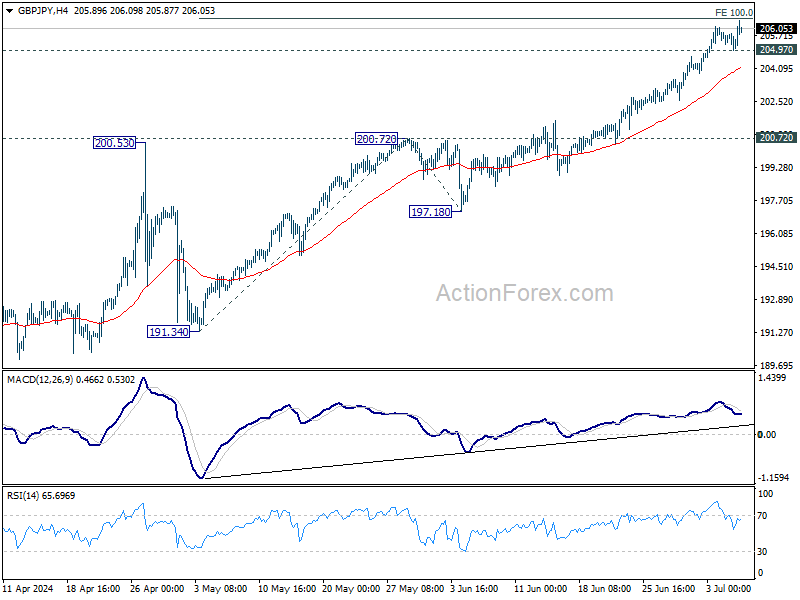
In the bigger picture, long term up trend is still in progress. Next target is 100% projection of 155.33 to 188.63 from 178.32 at 211.62. Outlook will stay bullish as long as 197.18 support holds, even in case of deep pullback.
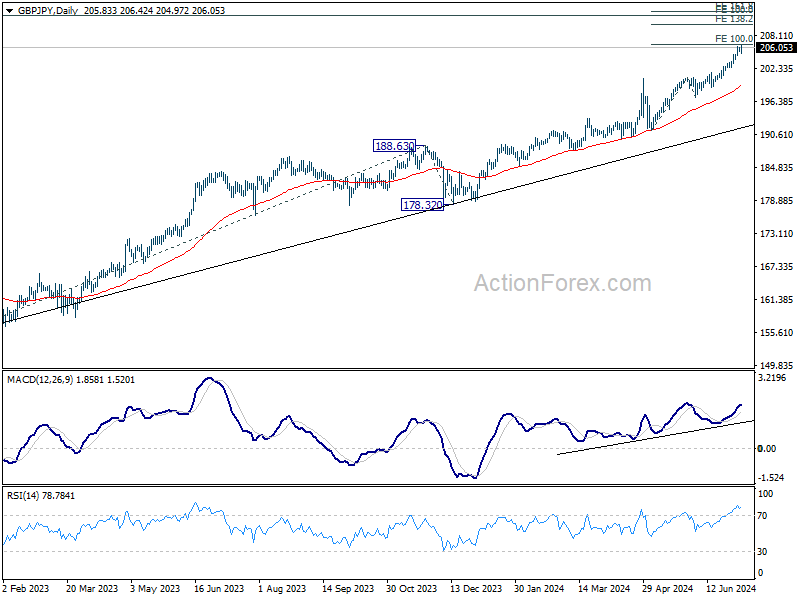
In the longer term picture, rise from 122.75 (2016 low) is seen as the third leg of the pattern from 116.83 (2011 low). Next target is 138.2% projection of 116.83 to 195.86 from 122.75 at 231.96. Outlook will stay bullish as long as 178.32 support holds, or until a clear reversal pattern forms.
Pound Outshines as Dollar Sinks, Yen Stabilizing
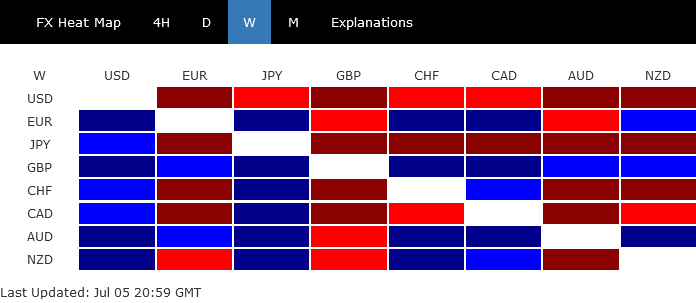
The past week marked a significant downturn for Dollar, which found itself at the bottom of the currency performance chart. A slew of unfavorable economic reports has highlighted the tangible effects of sustained high interest rates on the American economy, fostering a growing consensus that Fed may begin to ease these rates as soon as September. This expectation, in turn, fueled a surge in investor confidence, propelling stocks to new record highs. The positive ripple effects through equity markets contributed to a risk-on sentiment that exerted additional downward pressure on the Dollar.
In contrast to Dollar's plight, Japanese Yen, although still underperforming as the second worst, showed signs of slowing its decline against the greenback, hinting at some stabilization or reduced selling momentum in the near future. Canadian Dollar also faced challenges, ranking as the third weakest performer following disappointing job data that cast shadows on the strength of Canada's economic recovery.
On the more positive side of the spectrum, British Pound emerged as the standout performer last week. This strength was partly fueled by a broader market shift towards riskier assets and was significantly bolstered by the political stability anticipated following the UK's general elections. Australian Dollar and Euro also saw appreciable gains, driven by similar dynamics of returning investor confidence and a favorable shift in market sentiment. Meanwhile, Swiss Franc and New Zealand Dollar occupied the middle ground.
Fed Rate Cut Prospects Rise as US Economy Encounters Growing Headwinds
Dollar was sold off broadly last week, as an array of disappointing economic data for June suggested that the prolonged period of high interest rates is starting to profoundly affect the US economy. July could be the point for the economy to start to turn south.
This emerging evidence of a slowdown has sharply realigned market expectations, with a growing expectations that Fed would be ready commence interest rate reductions in September. This shift in market sentiment was emphatically reflected across major financial indices, with S&P 500 and NASDAQ both soaring to record highs. Meanwhile, 10-year Treasury yield, which initially spiked up, reversed dramatically to close the week noticeably lower.
The industrial sector's struggles were highlighted in the latest ISM indexes, which confirmed the recessionary state of US manufacturing. The manufacturing PMI has remained in contraction territory almost continuously since the end of 2022, with a fleeting moment of expansion this past May.
Equally concerning is the downturn in the services sector, which has been a pillar of strength during manufacturing sector's weakness. ISM services PMI showed contraction for the second time in three months, signaling a possible turn in the sector's trend.
Additionally, Non-Farm Payrolls reported job growth of 206k, which, while respectable, was slightly below the average monthly gain of 220,000 observed over the previous year. More alarmingly, significant downward revisions for April and May, totaling -111k, suggest that the labor market was way less robust in the second quarter than previously reported.
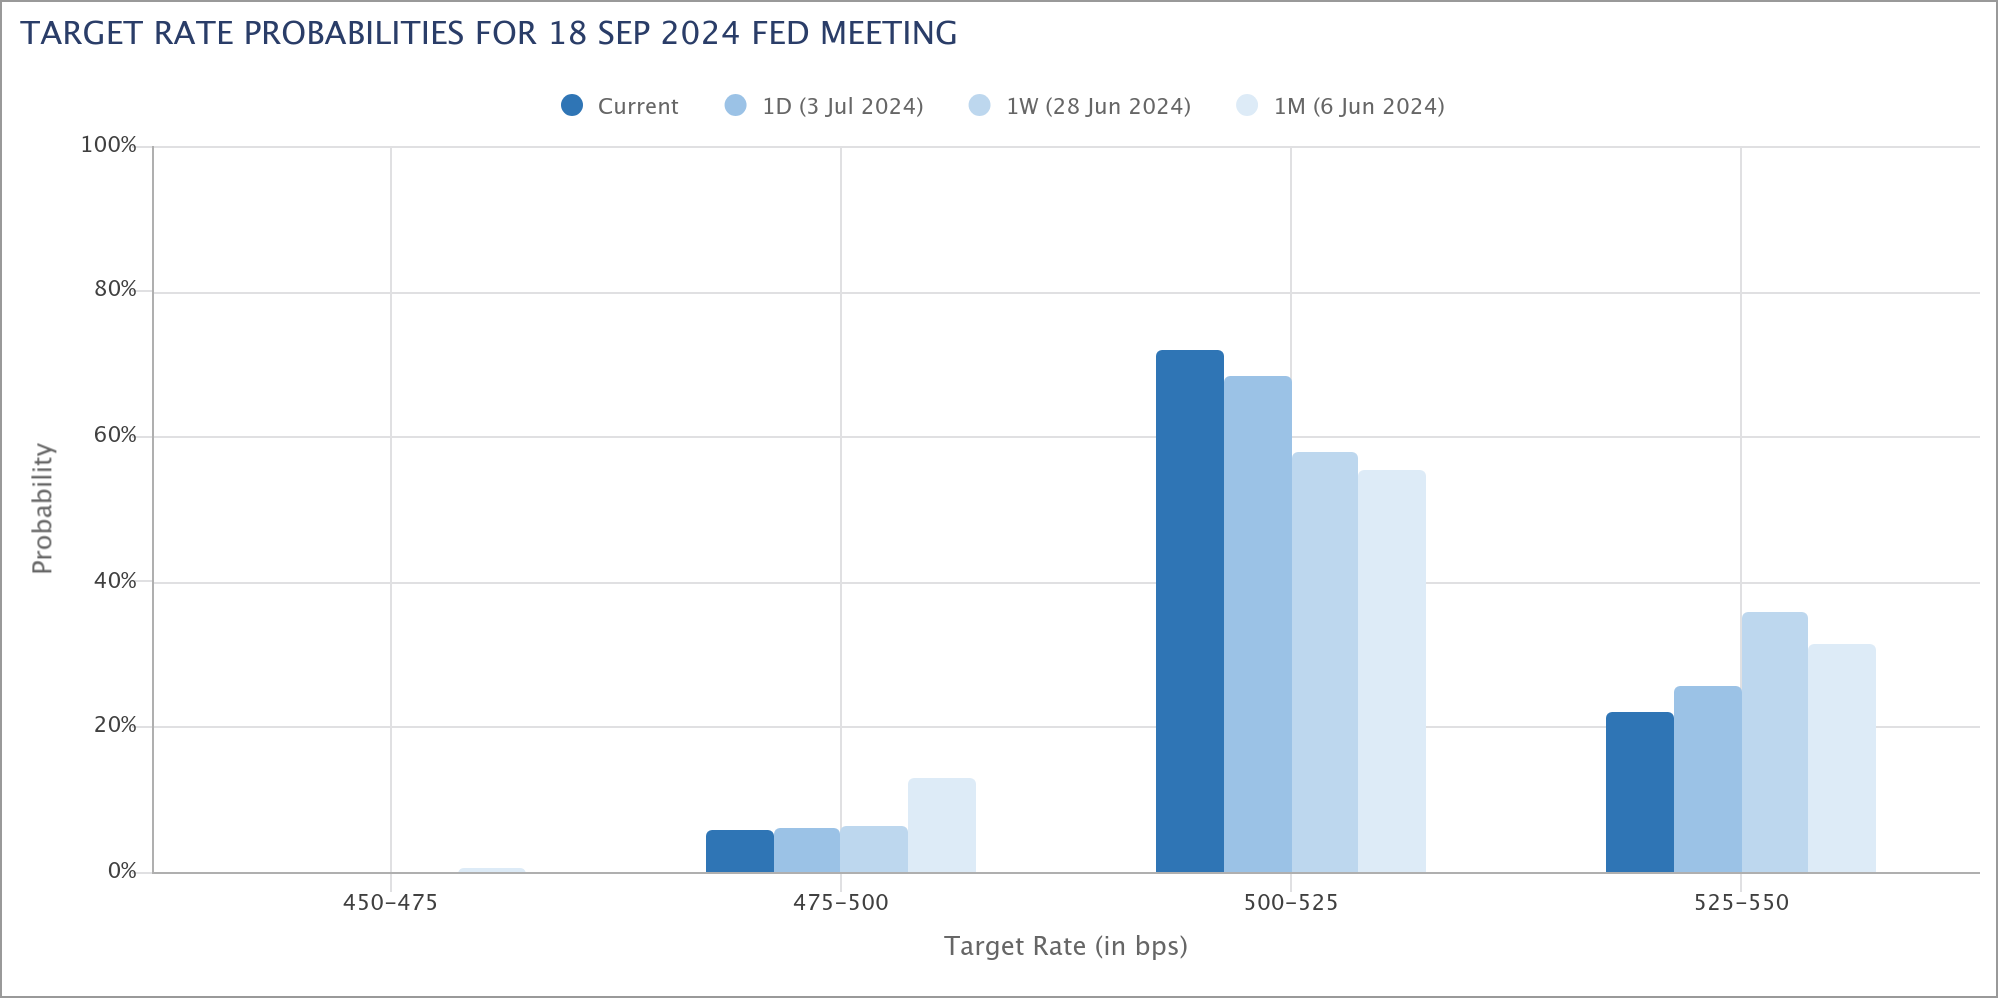
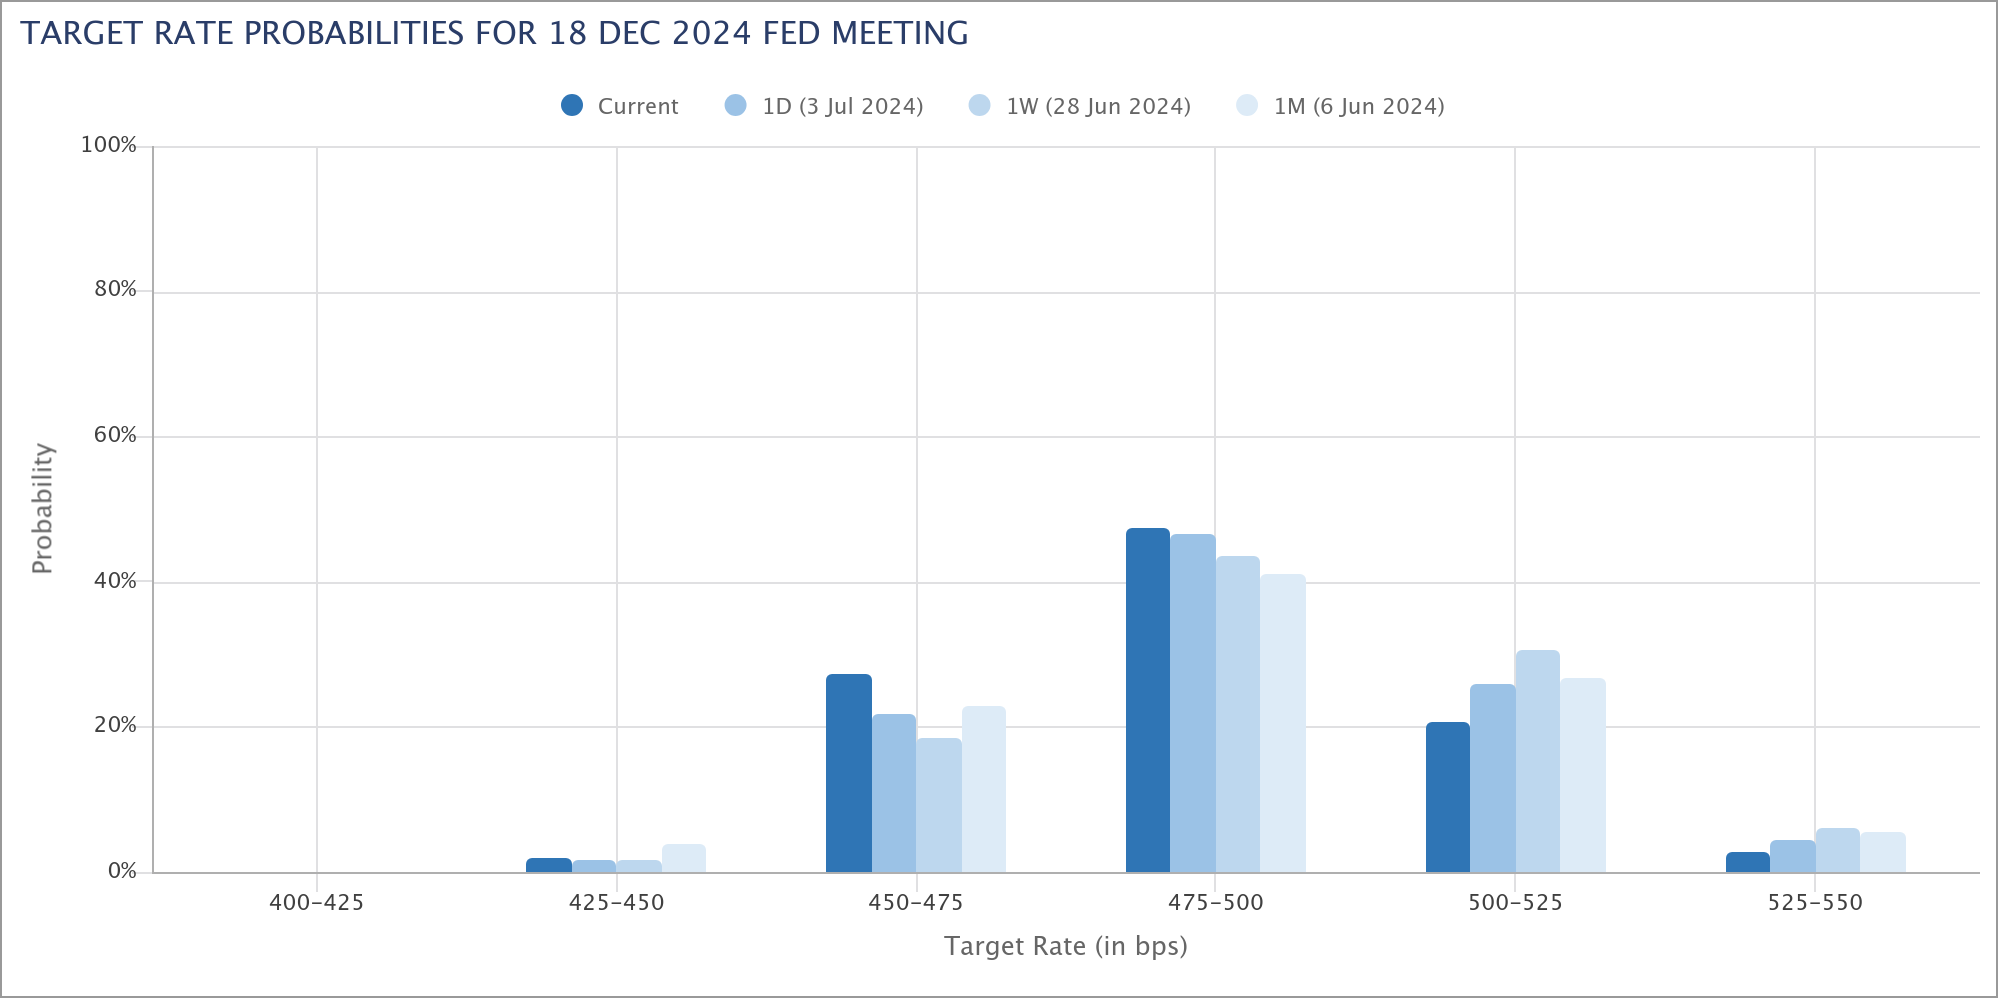
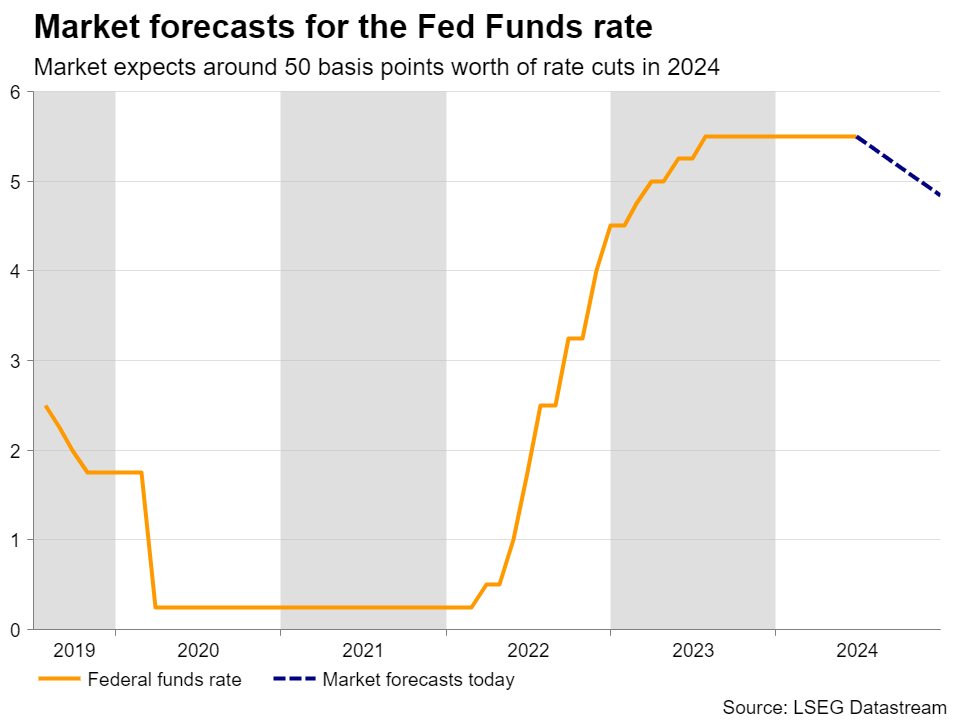
In response to these developments, the likelihood of a 25 bps rate cut by Fed to 5.00-5.25% in September surged to approximately 78%, up from 64% just a week earlier. Moreover, by the end of the year, market expectations for a total of two rate cuts, bringing rates down to between 4.75% and 5.00%, have risen to 77% from 63%.
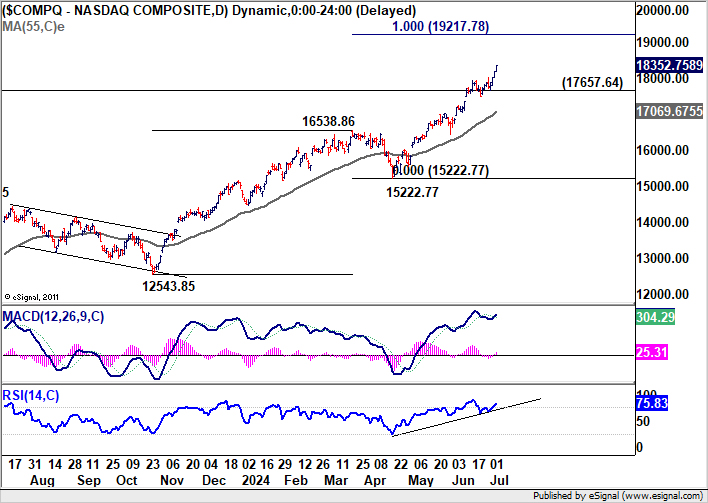
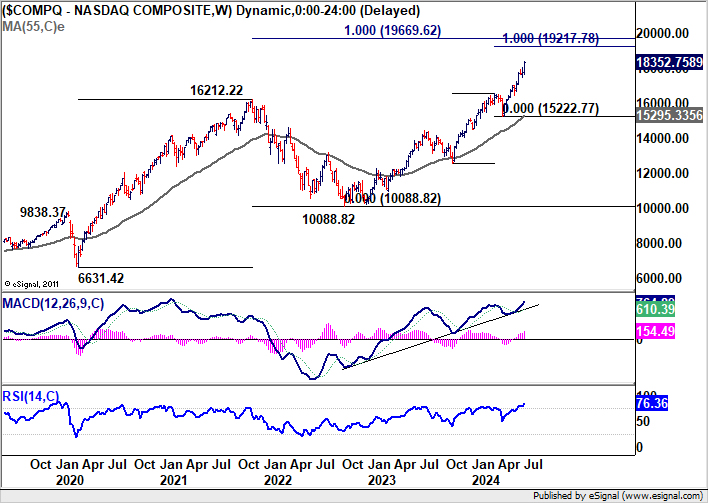
NASDAQ Hits New Record, Heading towards 20k
Both S&P 500 and NASDAQ achieved new record highs last week. S&P 500's impressive rally has now accumulated a year-to-date gain of 16.7%, while NASDAQ has outpaced this with a substantial 22.3% increase since the beginning of the year.
Technically, near term outlook in NASDAQ will stay bullish as long as 17657.64 support holds. Next target is 100% projection of 12543.85 to 16538.86 from 15222.77 at 19217.78. That would also be close to long term target of 100% projection of 6631.42 to 16212.22 from 10088.82 at 19669.62.
These two levels lie just ahead of the psychologically significant 20k mark. Together with overbought conditions in both daily and week chart, significant resistance might be seen there to bring a corrective phase first, as traders might start to take profits.
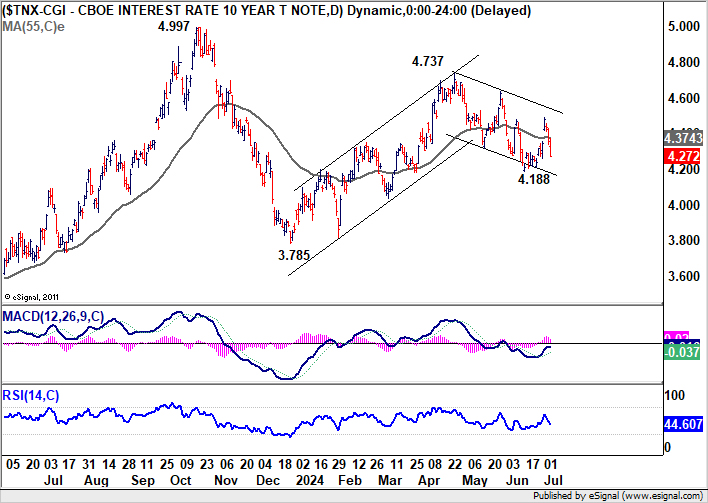
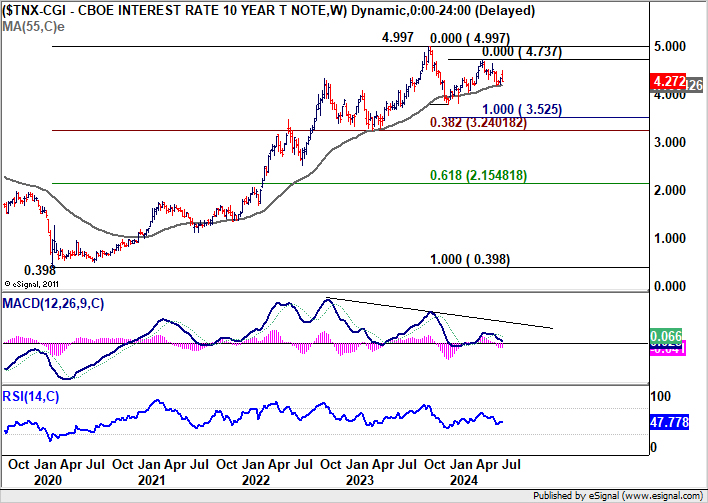
US 10-Year Yield Reverses After Initial Spike, Dollar Index Under Pressure
US 10-year Yield initially gapped higher to 4.493 but reversed to close sharply lower at 4.272. While the spike was brief, the driving force is important to note.
The initial surge in TNX was influenced notably by the political scene, particularly after Donald Trump's perceived strong performance in a televised debate against Joe Biden. The resurgence of the "Trump trade" has stirred market speculations. According to Morgan Stanley strategists, a Trump victory in November could reshape economic expectations, forecasting steeper yield curve due to anticipated policies on immigration and tariffs, alongside fiscal expansion leading to increased bond issuances.
Despite this, markets are currently much more occupied by optimism about cooling inflation and impending Fed policy easing. Nevertheless, the potential impact of Trump trade effect should not be overlooked, at least in the lead-up to the November election.
Technically, 10-year yield remain confined within the near term falling channel after the brief bounce faltered. Outlook is mixed for now with focus on 4.188 support, and 55 W EMA (now at 4.186). Sustained break of these levels will argue that fall from 4.737 is already the third leg of the corrective pattern from 4.997 (2023 high). That would open up deeper medium term decline through 3.785, likely aligning with Fed's rate cut and falling inflation. However, strong bounce from the 55 W EMA would keep the rise from 3.785 alive for another push through 4.737 at a later stage.
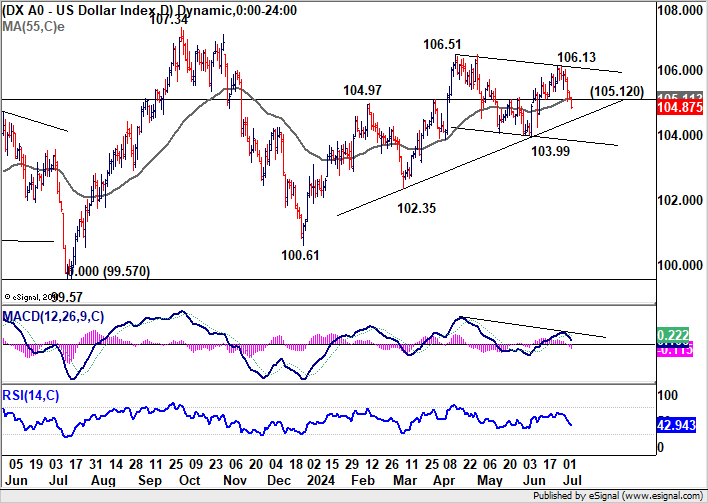
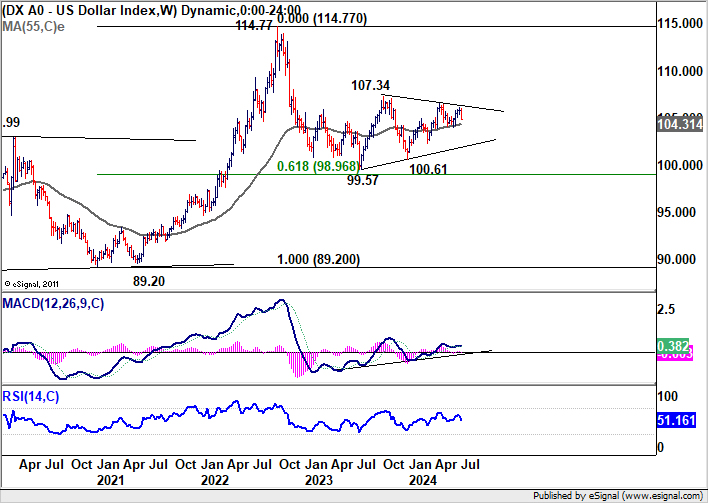
Dollar index's firm break of 105.12 support and 55 D EMA (now at 105.11) suggests that rebound from 103.99 has completed at 106.13 already. Fall from there is seen as the third leg of the pattern from 106.51 and would extend to 103.99 support. 55 W EMA (now at 104.31) would be the key level to defend. Sustained break there will argue that whole rise from 100.61 has completed, and open up deeper medium term decline back to this support. Nevertheless, strong bounce from 103.99 and the 55 W EMA will keep the rise from 100.61 alive for another attempt on 107.34 resistance later.
Sterling Climbs Following Labour's Electoral Success, Stocks Show Limited Enthusiasm
The UK's general election has culminated in a substantial victory for the Labour Party, but elicited varied reactions across different market segments. The British Pound and government bonds received a noticeable boost. While FTSE index also enjoyed a brief uptick, it failed to keep those gains.
On the positive side, this election outcome promises a phase of stability, given Labour's commanding majority in Parliament—a development that could bring much-needed predictability following years of political turmoil since Brexit, which had its crescendo during Liz Truss's historically short stint as Prime Minister.
There are also anticipations surrounding new Prime Minister Keir Starmer's to reinforce ties with the EU, specifically through amendments to the EU/UK Trade and Cooperation Agreement and introduction of a UK-EU defense pact. Such initiatives are expected to favorably impact the Pound.
However, despite Labour's significant parliamentary majority, a closer examination of the election results reveals a more complex picture. Labour's victory added over 200 seats, yet their share of the popular vote increased by less than two percentage points to 34%. This modest increase contrasts sharply with the Conservative Party's loss of vote share, which plummeted 20 points to 24%, culminating in a loss of 251 seats.
Meanwhile, the Liberal Democrats made modest gains in vote shares to 12% but claimed 71 seats. The far-right Reform Party increased its vote share notably by 12% to 14%, although this did not translate significantly into seats.
These dynamics suggest that the election outcome may be more indicative of Conservative losses rather than a strong mandate for Labour, which could present challenges for Starmer's policy agenda.
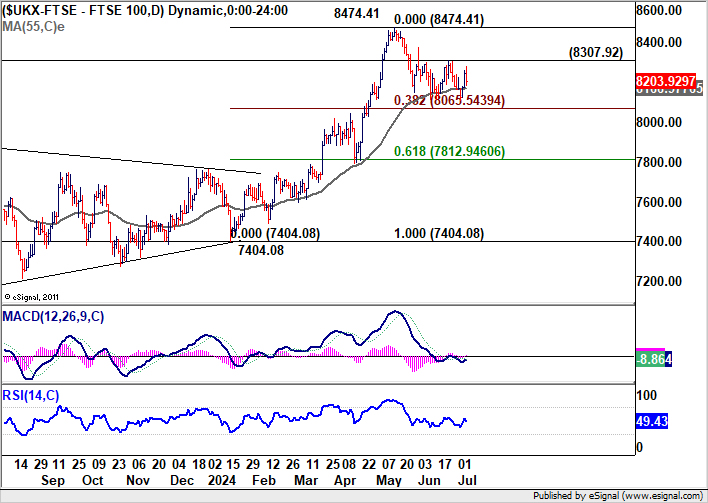
Technically, FTSE is still extending the corrective pattern from 8474.41. But in case of another dip, downside would likely be supported by 38.2% retracement of 7404.08 to 8474.41 at 8065.54. Break of 8307.92 resistance will be the first sign that larger up trend is ready to resume, and should bring retest of 8474.41 high next.
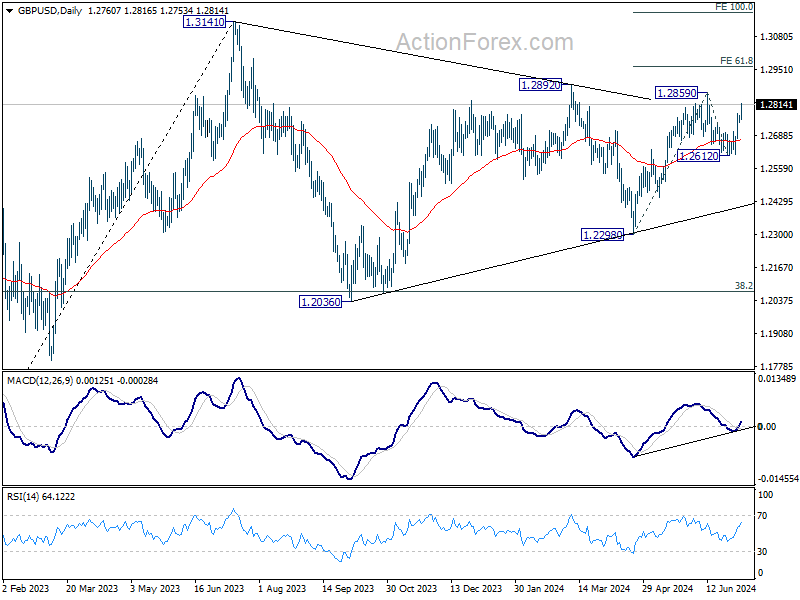
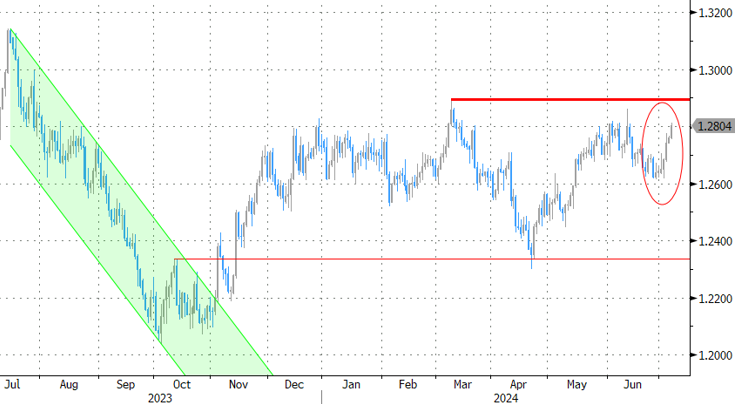
GBP/USD's focus is now back on 1.2859 resistance after last week's strong rally. Firm break there will firstly resume the rise from 1.2298. More importantly, that would revive that case that corrective pattern from 1.3141 has completed at 1.2298. Next target would be 61.8% projection of 1.2298 to 1.2859 from 1.2612 at 1.2959. Decisive break there would prompt upside acceleration through 1.3141 to 100% projection at 1.3173.
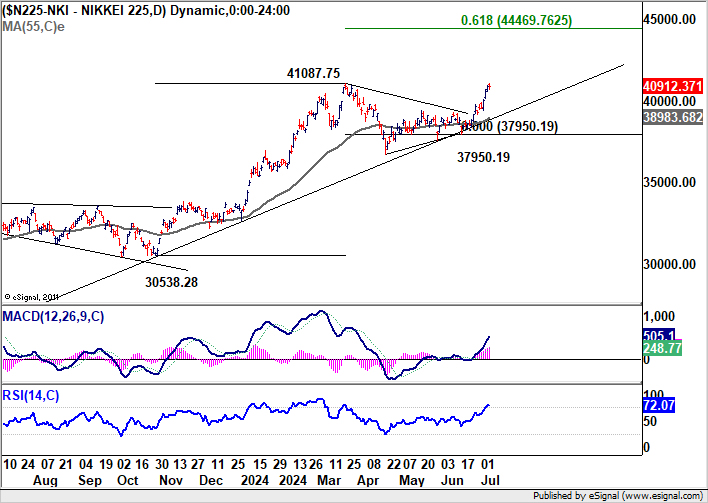
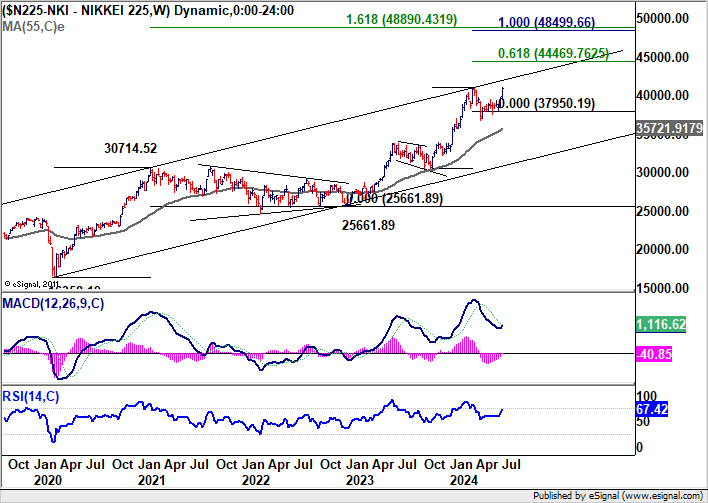
Japanese Stocks Hit New Peaks Amid Yen's Continued Decline
Mood in the Japanese financial markets was buoyantly optimistic, with Nikkei surging past 40k mark again to set a new record high. Additionally, the broader Topix also reached new heights, surpassing its historical peak from the bubble era of 1989. This jubilation in the stock market occurred concurrently with Yen's drop to multi-decade lows against Dollar, although it did recover slightly later.
Recent depreciation of Yen, surprisingly met with minimal verbal intervention from Japanese authorities, has been a significant catalyst for the stock market rally. The weaker Yen is generally viewed as bullish for Japanese stocks, particularly for exporters, as it raises the value of profits repatriated to Japan. The government's apparent acquiescence to Yen's decline through 160 level has injected additional optimism into the market.
However, several factors suggest caution is warranted. First, Yen's rapid selloff against Dollar seems to be losing momentum, indicating a potential upcoming rebound. Second, it remains to be seen how this year's strong wage growth from the annual Shunto will translate into increased domestic consumption, which is crucial for sustaining Japan's economic and stock market growth.
Looking forward, Nikkei faces a critical juncture at its long-term channel resistance, currently near the 42,000 level. Decisive break there would solidify medium term buying momentum and pave the way to 61.8% projection of 30538.28 to 41087.75 from 37950.19 at 44469.76. However, reversal from the channel resistance could turn in to a medium term down trend back to 55 W EMA or even to channel support. It's make or break time for Nikkei soon.
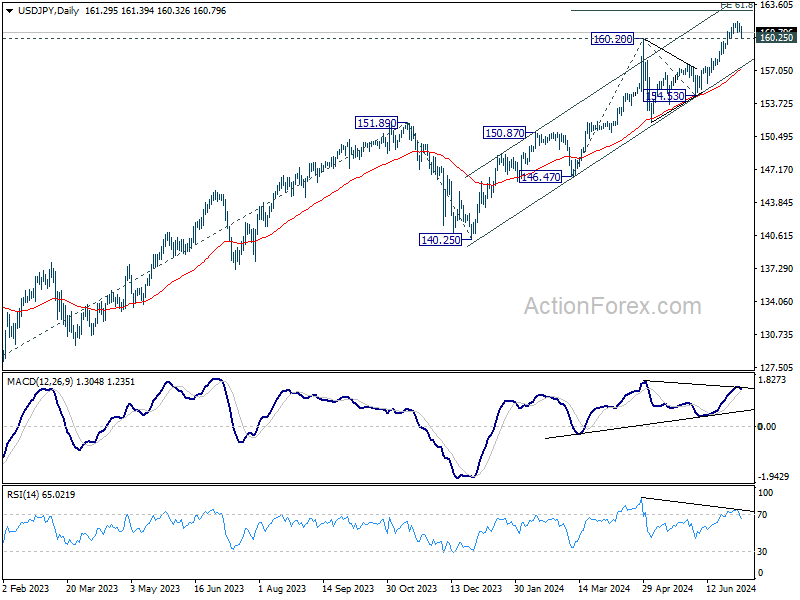
USD/JPY edged higher to 161.94 last week but turned into consolidations since then. Further rally is expected as long as 160.25 minor support holds. But loss of momentum could cap upside at 61.8% projection of 146.47 to 160.20 from 154.53 at 163.01 on first attempt. Meanwhile, firm break of 160.25 will suggest that a short term top is at least formed and bring deeper pull back.
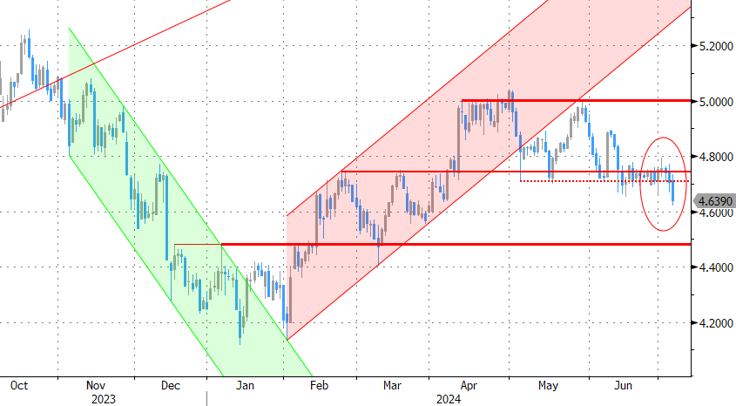
GBP/JPY Weekly Outlook
GBP/JPY's up trend continued last week and hit as high as 206.42. Initial bias is on the upside this week for further rally. Firm break of 100% projection of 191.34 to 200.72 from 197.18 at 206.56 will target 138.2% projection at 210.17. On the downside, below 204.97 minor support will turn bias to the downside for deeper pull back.
In the bigger picture, long term up trend is still in progress. Next target is 100% projection of 155.33 to 188.63 from 178.32 at 211.62. Outlook will stay bullish as long as 197.18 support holds, even in case of deep pullback.
In the longer term picture, rise from 122.75 (2016 low) is seen as the third leg of the pattern from 116.83 (2011 low). Next target is 138.2% projection of 116.83 to 195.86 from 122.75 at 231.96. Outlook will stay bullish as long as 178.32 support holds, or until a clear reversal pattern forms.
Summary 7/8 – 7/12
Monday, Jul 8, 2024
| GMT | Ccy | Events | Consensus | Previous |
|---|---|---|---|---|
| 23:30 | JPY | Labor Cash Earnings Y/Y May | 2.10% | 1.60% |
| 23:50 | JPY | Bank Lending Y/Y Jun | 3.10% | 3.00% |
| 23:50 | JPY | Current Account (JPY) May | 2.13T | 2.52T |
| 05:00 | JPY | Eco Watchers Survey: Current Jun | 46.3 | 45.7 |
| 06:00 | EUR | Germany Trade Balance (EUR) May | 19.9B | 22.1B |
| 08:30 | EUR | Eurozone Sentix Investor Confidence Jul | 0.0 | 0.3 |
| 23:50 | JPY | Money Supply M2+CD Y/Y Jun | 2.00% | 1.90% |
| GMT | Ccy | Events | |
|---|---|---|---|
| 23:30 | JPY | Labor Cash Earnings Y/Y May | |
| Forecast: 2.10% | Previous: 1.60% | ||
| 23:50 | JPY | Bank Lending Y/Y Jun | |
| Forecast: 3.10% | Previous: 3.00% | ||
| 23:50 | JPY | Current Account (JPY) May | |
| Forecast: 2.13T | Previous: 2.52T | ||
| 05:00 | JPY | Eco Watchers Survey: Current Jun | |
| Forecast: 46.3 | Previous: 45.7 | ||
| 06:00 | EUR | Germany Trade Balance (EUR) May | |
| Forecast: 19.9B | Previous: 22.1B | ||
| 08:30 | EUR | Eurozone Sentix Investor Confidence Jul | |
| Forecast: 0.0 | Previous: 0.3 | ||
| 23:50 | JPY | Money Supply M2+CD Y/Y Jun | |
| Forecast: 2.00% | Previous: 1.90% | ||
Tuesday, Jul 9, 2024
| GMT | Ccy | Events | Consensus | Previous |
|---|---|---|---|---|
| 00:30 | AUD | Westpac Consumer Confidence Jul | 1.70% | |
| 01:30 | AUD | NAB Business Conditions Jun | 6 | |
| 01:30 | AUD | NAB Business Confidence Jun | -3 | |
| 06:00 | JPY | Machine Tool Orders Y/Y Jun P | 4.20% | |
| 10:00 | USD | NFIB Business Optimism Index Jun | 89.5 | 90.5 |
| 23:50 | JPY | PPI Y/Y Jun | 2.90% | 2.40% |
| GMT | Ccy | Events | |
|---|---|---|---|
| 00:30 | AUD | Westpac Consumer Confidence Jul | |
| Forecast: | Previous: 1.70% | ||
| 01:30 | AUD | NAB Business Conditions Jun | |
| Forecast: | Previous: 6 | ||
| 01:30 | AUD | NAB Business Confidence Jun | |
| Forecast: | Previous: -3 | ||
| 06:00 | JPY | Machine Tool Orders Y/Y Jun P | |
| Forecast: | Previous: 4.20% | ||
| 10:00 | USD | NFIB Business Optimism Index Jun | |
| Forecast: 89.5 | Previous: 90.5 | ||
| 23:50 | JPY | PPI Y/Y Jun | |
| Forecast: 2.90% | Previous: 2.40% | ||
Wednesday, Jul 10, 2024
| GMT | Ccy | Events | Consensus | Previous |
|---|---|---|---|---|
| 01:30 | CNY | CPI Y/Y Jun | 0.40% | 0.30% |
| 01:30 | CNY | PPI Y/Y Jun | -0.80% | -1.40% |
| 02:00 | NZD | RBNZ Interest Rate Decision | 5.50% | 5.50% |
| 08:00 | EUR | Italy Industrial Output M/M May | 0.20% | -1.00% |
| 14:00 | USD | Wholesale Inventories May F | 0.60% | 0.60% |
| 14:30 | USD | Crude Oil Inventories | -12.2M | |
| 18:00 | USD | Fed's Beige Book | ||
| 23:01 | GBP | RICS Housing Price Balance Jun | -17% | |
| 23:50 | JPY | Machinery Orders M/M May | 1.00% | -2.90% |
| GMT | Ccy | Events | |
|---|---|---|---|
| 01:30 | CNY | CPI Y/Y Jun | |
| Forecast: 0.40% | Previous: 0.30% | ||
| 01:30 | CNY | PPI Y/Y Jun | |
| Forecast: -0.80% | Previous: -1.40% | ||
| 02:00 | NZD | RBNZ Interest Rate Decision | |
| Forecast: 5.50% | Previous: 5.50% | ||
| 08:00 | EUR | Italy Industrial Output M/M May | |
| Forecast: 0.20% | Previous: -1.00% | ||
| 14:00 | USD | Wholesale Inventories May F | |
| Forecast: 0.60% | Previous: 0.60% | ||
| 14:30 | USD | Crude Oil Inventories | |
| Forecast: | Previous: -12.2M | ||
| 18:00 | USD | Fed's Beige Book | |
| Forecast: | Previous: | ||
| 23:01 | GBP | RICS Housing Price Balance Jun | |
| Forecast: | Previous: -17% | ||
| 23:50 | JPY | Machinery Orders M/M May | |
| Forecast: 1.00% | Previous: -2.90% | ||
Thursday, Jul 11, 2024
| GMT | Ccy | Events | Consensus | Previous |
|---|---|---|---|---|
| 01:00 | AUD | Consumer Inflation Expectations Jul | 4.40% | |
| 06:00 | EUR | Germany CPI M/M Jun F | 0.10% | 0.10% |
| 06:00 | EUR | Germany CPI Y/Y Jun F | 2.20% | 2.20% |
| 06:00 | GBP | GDP M/M May | 0.20% | 0.00% |
| 06:00 | GBP | Industrial Production M/M May | 0.30% | -0.90% |
| 06:00 | GBP | Industrial Production Y/Y May | -0.40% | |
| 06:00 | GBP | Manufacturing Production M/M May | 0.30% | -1.40% |
| 06:00 | GBP | Manufacturing Production Y/Y May | 0.40% | |
| 06:00 | GBP | Goods Trade Balance (GBP) May | -16.1B | -19.6B |
| 12:30 | USD | Initial Jobless Claims (Jul 5) | 239K | 238K |
| 12:30 | USD | CPI M/M Jun | 0.10% | 0.00% |
| 12:30 | USD | CPI Y/Y Jun | 3.10% | 3.30% |
| 12:30 | USD | CPI Core M/M Jun | 0.20% | 0.20% |
| 12:30 | USD | CPI Core Y/Y Jun | 3.40% | 3.40% |
| 14:30 | USD | Natural Gas Storage | 32B | |
| 22:30 | NZD | Business NZ PMI Jun | 47.2 |
| GMT | Ccy | Events | |
|---|---|---|---|
| 01:00 | AUD | Consumer Inflation Expectations Jul | |
| Forecast: | Previous: 4.40% | ||
| 06:00 | EUR | Germany CPI M/M Jun F | |
| Forecast: 0.10% | Previous: 0.10% | ||
| 06:00 | EUR | Germany CPI Y/Y Jun F | |
| Forecast: 2.20% | Previous: 2.20% | ||
| 06:00 | GBP | GDP M/M May | |
| Forecast: 0.20% | Previous: 0.00% | ||
| 06:00 | GBP | Industrial Production M/M May | |
| Forecast: 0.30% | Previous: -0.90% | ||
| 06:00 | GBP | Industrial Production Y/Y May | |
| Forecast: | Previous: -0.40% | ||
| 06:00 | GBP | Manufacturing Production M/M May | |
| Forecast: 0.30% | Previous: -1.40% | ||
| 06:00 | GBP | Manufacturing Production Y/Y May | |
| Forecast: | Previous: 0.40% | ||
| 06:00 | GBP | Goods Trade Balance (GBP) May | |
| Forecast: -16.1B | Previous: -19.6B | ||
| 12:30 | USD | Initial Jobless Claims (Jul 5) | |
| Forecast: 239K | Previous: 238K | ||
| 12:30 | USD | CPI M/M Jun | |
| Forecast: 0.10% | Previous: 0.00% | ||
| 12:30 | USD | CPI Y/Y Jun | |
| Forecast: 3.10% | Previous: 3.30% | ||
| 12:30 | USD | CPI Core M/M Jun | |
| Forecast: 0.20% | Previous: 0.20% | ||
| 12:30 | USD | CPI Core Y/Y Jun | |
| Forecast: 3.40% | Previous: 3.40% | ||
| 14:30 | USD | Natural Gas Storage | |
| Forecast: | Previous: 32B | ||
| 22:30 | NZD | Business NZ PMI Jun | |
| Forecast: | Previous: 47.2 | ||
Friday, Jul 12, 2024
| GMT | Ccy | Events | Consensus | Previous |
|---|---|---|---|---|
| 12:30 | CAD | Building Permits M/M May | -5.00% | 20.50% |
| 12:30 | USD | PPI M/M Jun | 0.10% | -0.20% |
| 12:30 | USD | PPI Y/Y Jun | 2.20% | 2.20% |
| 12:30 | USD | PPI Core M/M Jun | 0.20% | 0.00% |
| 12:30 | USD | PPI Core Y/Y Jun | 2.50% | 2.30% |
| 14:00 | USD | Michigan Consumer Sentiment Jul P | 68.5 | 68.2 |
| GMT | Ccy | Events | |
|---|---|---|---|
| 12:30 | CAD | Building Permits M/M May | |
| Forecast: -5.00% | Previous: 20.50% | ||
| 12:30 | USD | PPI M/M Jun | |
| Forecast: 0.10% | Previous: -0.20% | ||
| 12:30 | USD | PPI Y/Y Jun | |
| Forecast: 2.20% | Previous: 2.20% | ||
| 12:30 | USD | PPI Core M/M Jun | |
| Forecast: 0.20% | Previous: 0.00% | ||
| 12:30 | USD | PPI Core Y/Y Jun | |
| Forecast: 2.50% | Previous: 2.30% | ||
| 14:00 | USD | Michigan Consumer Sentiment Jul P | |
| Forecast: 68.5 | Previous: 68.2 | ||
The Week Ahead – Will US Inflation Data Derail Market Optimism?
- Soft US economic data, including lower-than-expected job growth, has increased market expectations for a September rate cut.
- The week ahead features important data releases, including US inflation figures and Chinese inflation data.
- US Inflation holds the key to a September rate cut. A decline in inflation could see significant changes to rate cut probabilities.
- Chart of the Week: US Dollar index (DXY)
Week in Review: Slowing Payroll Growth Fuels Speculation of September Rate Cut
A significant week for markets ended on Friday with a lackluster US jobs report, consistent with most of the US data from this week. This has increased speculation that the Federal Reserve may cut rates in September, with market expectations now reflecting a higher likelihood of such a move.At the beginning of the week, the probability for a September rate cut stood around the 60% mark which increased to around the 75% mark post the NFP and jobs report release.
Interest Rate Probability – US Federal Reserve, July 5, 2024
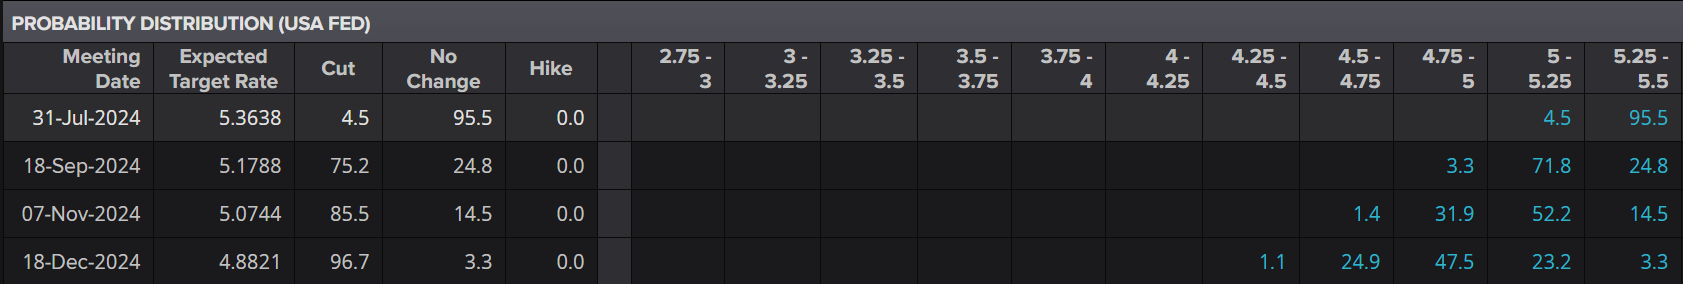
Source: LSEG
The slow growth of 136,000 private payrolls in June, along with the large downward revision of May’s numbers from 272,000 to 193,000, makes a September rate cut likely. As in recent months, the overall increase in payrolls was largely due to big gains in government and private healthcare jobs, up by 70,000 and 82,000 respectively.
Private payrolls, excluding private education and healthcare, grew by only 54,000, much lower than the six-month average of 101,000. Additionally, there have been consistent downward revisions—the latest estimates show that payroll growth from month to month over the past 12 months to May is on average 24,000 lower than initially reported—indicating that June’s data could look significantly worse in a few months.
The increase in speculation around rate cuts weighed on the USD for the majority of the week, allowing commodities and equities to rise once more. The S&P 500 and the Nasdaq 100 both printed fresh highs multiple times during the week.
The UK election did not throw up any surprises and the Labour Party performed even better than expected. The result saw an early rally for FTSE before a pullback Friday afternoon while the GBP advanced and gained significant ground against the weaker US dollar following the NFP and jobs report release.
On the commodities front gold (xau/usd) and silver (xag/usd) surged higher on Friday with oil prices on course for a fourth successive week of gains. Falling inventories and supply concerns continue to prop up oil prices as the European and US summer season gets into full swing.
The Week Ahead – EU, US and ASIA
Europe + UK
The UK election finished with Keir Starmer’s Labour Party achieving a decisive victory. While markets had anticipated a significant win, the outcome exceeded expectations, even for the most dedicated Labour supporters. Prime Minister Starmer has committed to rebuilding Britain after years of turmoil but cautioned that progress would require time.
Looking ahead to next week, markets will be closely observing any actions by the incoming Prime Minister. Speeches from the newly appointed Finance Minister Rachel Reeves will also be under scrutiny, as maintaining a tight fiscal policy is crucial for controlling the UK’s debt levels. In the short-term, financing the NHI looks to be a Labour priority, but beyond that Chancellor Reeves will have to walk a tightrope.
Looking toward Europe, it is a quiet week in terms of high impact data releases. All eyes will likely be fixed on the French election as round two gets underway. Despite the first round win for Marine Le Pen’s far-right National Rally party (RN), the lack of a majority put markets at ease.
Throughout the week, various polls have been conducted. The consensus among them is that a majority for the National Rally party is highly unlikely. However, if a surprise majority win does occur, it could unsettle markets, potentially leading to an increase in French bond yields similar to what we saw before the elections. This is definitely something to keep an eye on as the week begins.
ASIA PACIFIC
Looking at the Asia Pacific region, the biggest data releases next week come in the form of Chinese inflation and the Reserve Bank of New Zealand (RBNZ) interest rate decision.
The RBNZ rate decision is likely to be uneventful, as a move from the Central Bank seems improbable. With data remaining inconclusive, holding rates steady aligns with market expectations. Additionally, this meeting will not feature an update to economic projections, which is scheduled for the August 14 meeting.
US
In the US, inflation data will be released as CPI and PPI reports. With indications this week that price pressures are easing, a decline in inflation next week could bolster market participants’ hopes for a September rate cut.
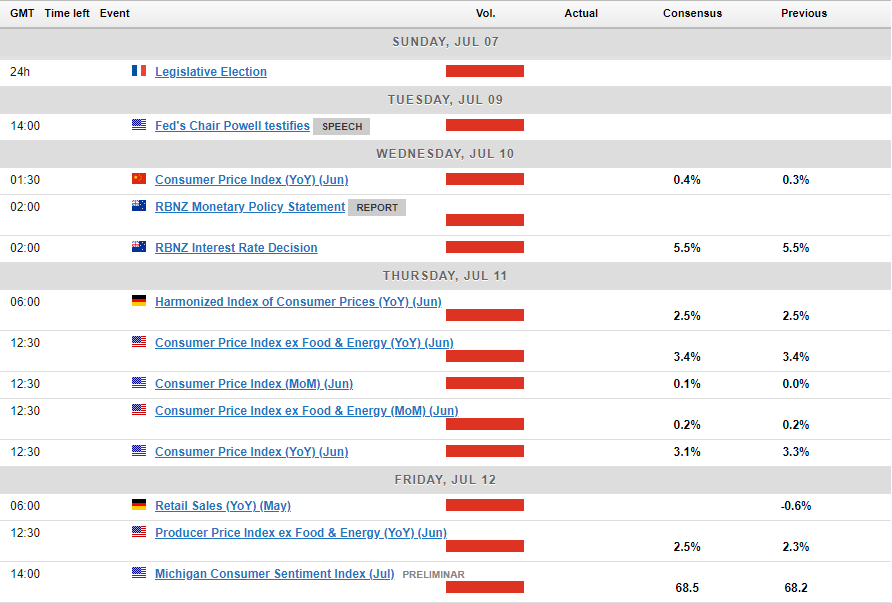
Chart of the Week
The chart I will be focusing on this week is the US Dollar Index (DXY). Following softer data in the US, the DXY has returned to the psychological 105.00 level. The long-term ascending trendline is now back in focus ahead of the US inflation data, making it a key area to watch.
Any indication that inflation is continuing its downward trajectory could facilitate a break of the trendline, putting further downward pressure on the US dollar. Such a scenario could have widespread market implications. Currently, markets are pricing in a 75% chance of a rate cut in September, which could increase if inflation continues to decline.
Conversely, a rise in inflation could help the DXY move away from the 105.00 level and the ascending trendline, potentially reaching 106.00 or even 107.00.
US Dollar Index Daily Chart – July 5, 2024
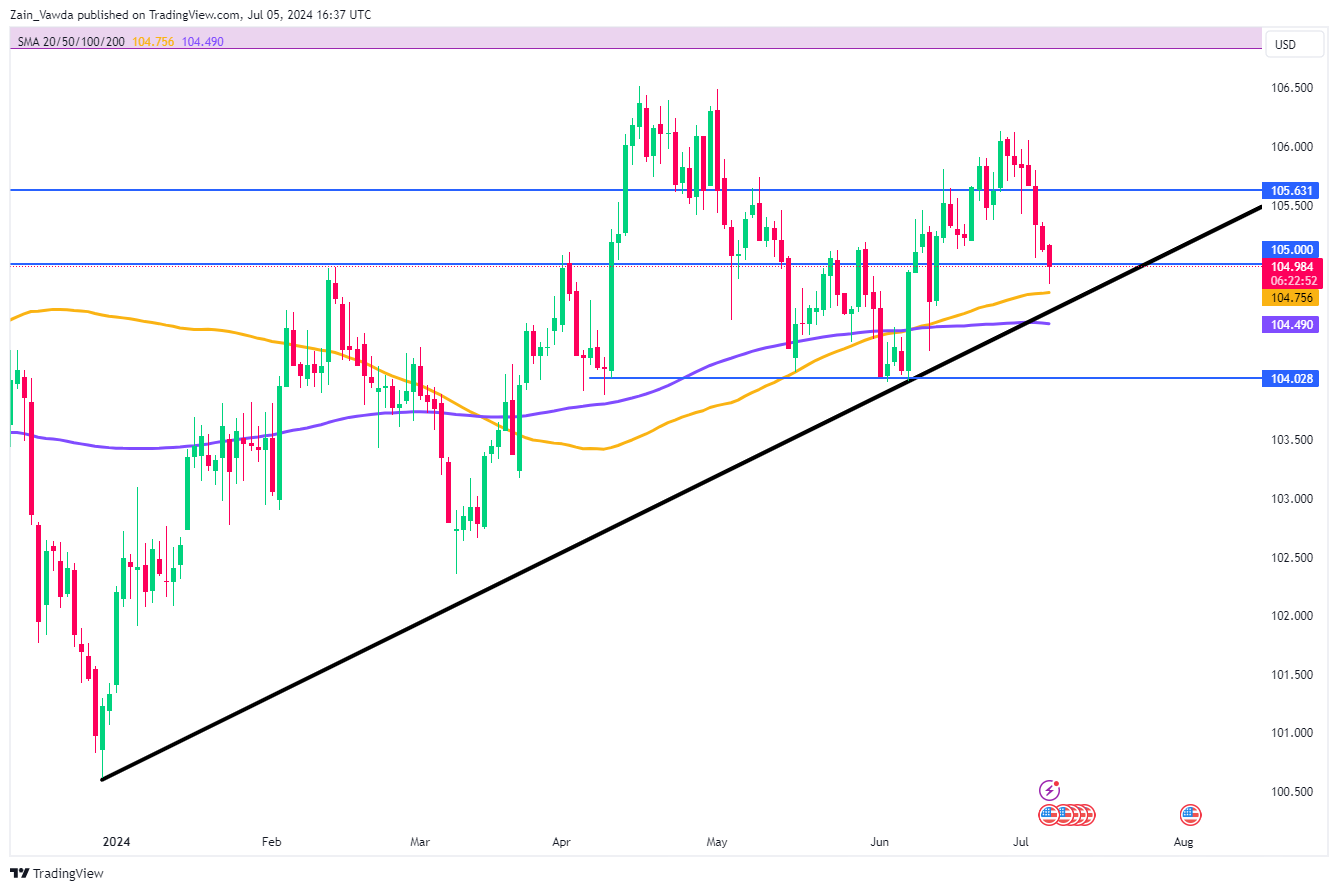
Source:TradingView.Com (click to enlarge)
Key Levels to Consider:
Support:
- 104.75
- 104.50
- 104.00
- 103.00
Resistance:
- 105.63
- 106.00
- 106.39
- 107.00
The Weekly Bottom Line: Gearing Down
U.S. Highlights
- This week’s data all flashed signs of an economy slowly gearing down.
- Both ISM indicators signaled contraction, while revisions to prior month’s payrolls gains and an uptick in the unemployment rate show the labor market continues to cool.
- All eyes will now be focused on next week’s Consumer Price Index report to see just how much this apparent slowdown is translating to the Fed’s goal.
Canadian Highlights
- A downbeat jobs report for June confirmed that Canada’s labour market continues to lose steam.
- Wage growth remains sticky, but should begin to soften as the unemployment rate tracks higher.
- International trade data for May suggests softer growth in the second quarter, but volatility in monthly readings leaves the external picture with a bit more uncertainty.
U.S. – Gearing Down
Despite the holiday, it was a data heavy week for the U.S., and all signs pointed to an economy that is slowly gearing down. The rally in U.S. Treasuries picked up steam as softer-than-expected survey data showed some cracks forming in the services sector and carried that momentum into Friday as the labor market continued to show signs of cooling. Taken together, the indicators signal that the economy might be cooling off enough to justify policy easing.
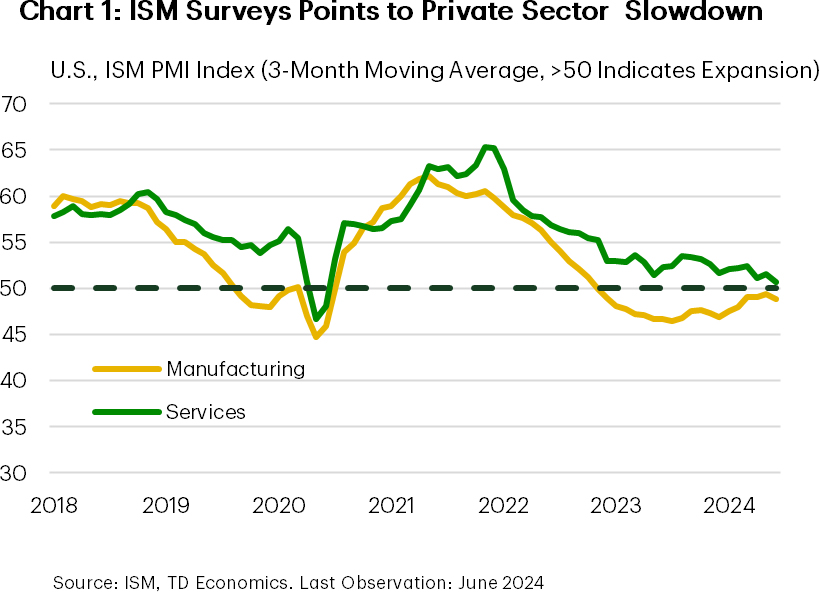
The ISM indicators have been wrong-footed several times by economic growth since the pandemic, most notably in late 2023 when real GDP growth jump to nearly 5% annualized without a discernible firming in the composite index. While that one quarter was an outlier, the trend in the data has been one of gradually decelerating growth (Chart 1). With June’s readings from the widely tracked indicator, the composite index now registered 50.5 in the second quarter, just above the 50 reading that signals growth. Now, this isn’t to say the economy will stall out, but rather that growth is trending lower, in line with the Fed’s goal of generating additional slack and cooling price pressures.
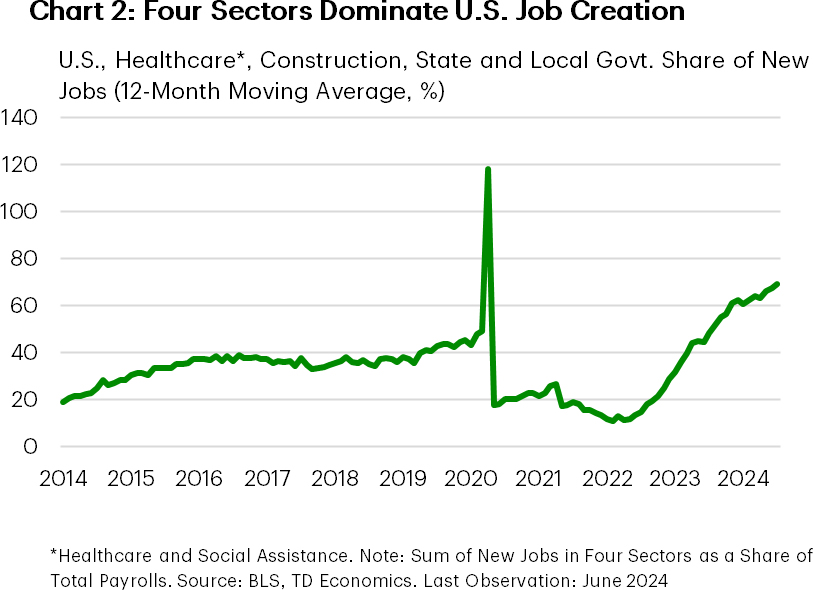
Friday’s Household and Payrolls figures reinforced the message that things are slowing down. Job gains in the two months to June were revised lower by roughly 100k positions, while the month’s reading fell roughly in line with what consensus was expecting. This wasn’t a bad report by any stretch, but it’s not the kind of gangbusters growth that drove the Fed to implement highly restrictive monetary policy. Looking under the hood can highlight this. Jobs gains were concentrated in construction, healthcare and social assistance, and local and state governments which, together, accounted for roughly 85% of the new positions in June. Moreover, they’ve been the real workhorse behind most of the job growth over the past year – being responsible for roughly 70% of the monthly job gains over this period (Chart 2) – larger than their usual contribution.
The unemployment rate also ticked up for the month (now up to 4.1%), but this wasn’t all bad news. The major driver here was that the number of people re-entering the labor market, or joining for the first time, drove much of the rise. What will matter going forward is whether the economy will have strong enough demand to absorb these new entrants – the slowing pace of new job creation suggests that it won’t be quite as easy to find work as last year.
So, with cracks clearly forming, the question for the Fed is when will decision makers have seen enough. The Minutes from June’s meeting put an emphasis on developments in the labor market and, to that end, today’s release was a step in the right direction. With private sector firms noting a clear slowdown in activity and new entrants into the labor market adding to labor supply, this should continue to work in the Fed’s favor, taking the edge off inflationary pressures. However, policymakers are likely to remain wary. The big story of 2023 and 2024 has been one of an economy that has consistently surprised with its remarkable resilience. To that end, all eyes are now focused on Fed Chair Powell’s testimony to Congress next Wednesday and Thursday’s release of June’s Consumer Price Index report to see just how much this apparent slowdown is translating to the Fed’s goal.
Canada – Labour Market Fatigue
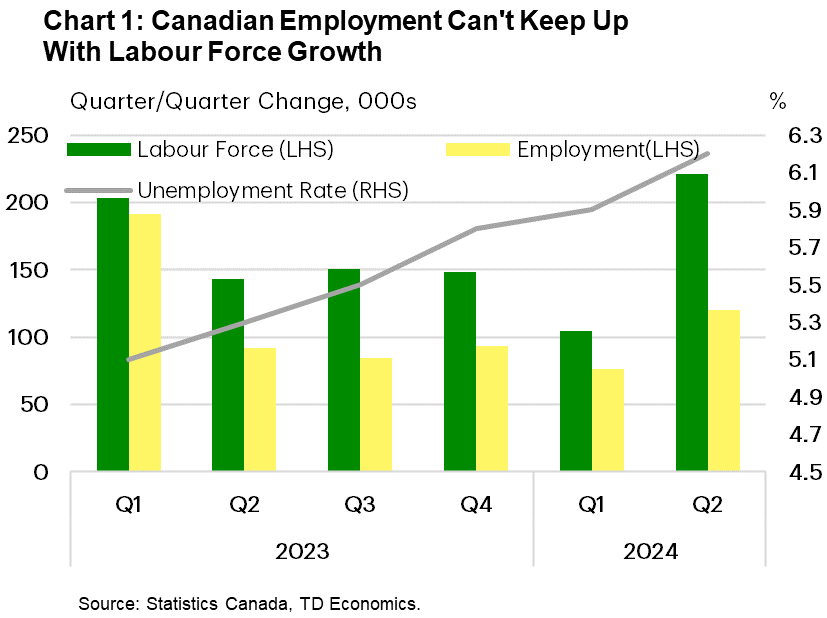
An update to Canada’s job market for the month of June was the main calendar-based risk in an otherwise quiet holiday-shortened week. Aside from this, markets continue to digest last week’s upside inflation surprise and what it means for the Bank of Canada (BoC) as they embark on their interest rate cutting campaign. Market moves were fairly muted as the Canadian 2 and 10-year yields closed the week effectively flat. Meanwhile, the Canadian dollar jumped a modest two-tenths of a cent to 0.733 USD.
Canada’s job market continues to gear down. The economy lost a few jobs in June, against consensus expectations for a +25k gain. The loss isn’t statistically significant when considering month-to-month fluctuations, but it is feeding into a broader trend of soft employment gains. Further signs of cooling were evidenced through another contraction in full-time workers and a pull-back in hours worked.
The economy continues to have difficulties absorbing new labour force entrants. For the past six-quarters, population-fueled labour force growth has outpaced employment, pulling the unemployment rate up over one percentage point over that time (Chart 1). At 6.4%, the jobless rate is at it’s highest level since January 2022 and half a percent above 2019 levels.
There is plenty in June’s job data that supports the case for lower interest rates. However, the BoC is likely focusing on the evolution of wages, which is presenting difficulties ahead of their July 24th meeting. Economy-wide wage growth accelerated in June, largely due to base-effects given the soft print one year ago. Still, it doesn’t take away from the fact wages have been growing at around 5% year-on-year for the past 18-months while productivity dipped over the same period. The acceleration of wages could stoke concerns around persistent inflation pressures but, in a recent speech, Governor Macklem has indicated the committee’s growing comfort that wage pressures will moderate.
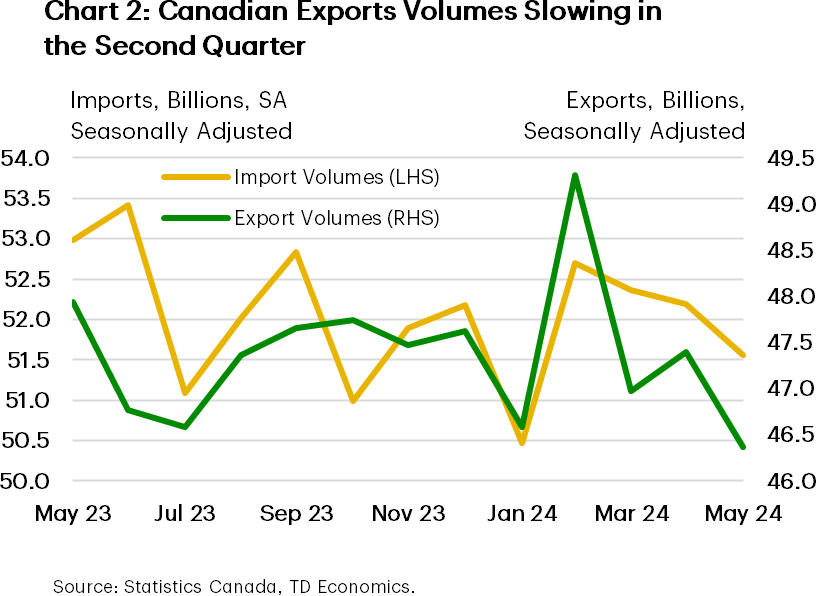
On the growth side, international trade data for May suggests that trade could chop a bit off of second quarter growth as export volumes have slid more relative to imports (Chart 2). The highly volatile metals and non-metallic minerals sector, as well as the energy sector, are responsible for the drag. We’d caution against attributing too much to the current tracking, as past trade data has been subject to heavy revisions and monthly variances. Looking forward, we expect trade to boost economic growth in the third quarter as the Trans Mountain Pipeline (TMX) expansion bolsters energy exports.
Market pricing for an interest rate cut in July has whipsawed significantly since the Bank cut rates earlier last month. Today’s soft jobs reading have markets settling on a 60% probability that the BoC will deliver another 25 bps cut on July 24th. However, there are still a couple of very key indicators to go before we reach that point, including inflation and the BoC’s Business Outlook Survey, which will help shape the Bank’s view on whether the next cut is July or September.
Weekly Economic & Financial Commentary: Because I Was Inverted
Summary
United States: No Fireworks from the June Jobs Report
It was a holiday-shortened week for many, but the economic data did not take a break. Nonfarm payrolls increased 206K in June; yet, downward revisions to the prior two months took much of the shine away from the headline gain. The unemployment rate ticked up a tenth to 4.1% in June, which is the highest since late 2021.
Next week: NFIB Small Business Optimism (Tue.), CPI (Thu.), Producer Price Index (Fri.)
International: Japan's Tankan Survey Keeps Recovery Outlook Within Reach
Japan's Q2 Tankan survey kept the outlook for economic recovery within reach. The large manufacturers' index rose two points to +13, the large non-manufacturers' index eased one point to +33 and capital spending plans for Japanese enterprises also firmed. Still, economic figures remain mixed, including a large decline in Q1 GDP. Against that backdrop, we expect the Bank of Japan to wait until October before it hikes its policy rate further.
Next week: Japan Labor Cash Earning (Mon.), Mexico CPI (Tue.), U.K. Monthly GDP (Thu.)
Topic of the Week: Because I Was Inverted
Two years ago today, the yield on the 10-year Treasury note fell below the two-year note. The yield curve has remained inverted since, marking the longest period in U.S. history in which the curve has been inverted and the economy has not slipped into recession.
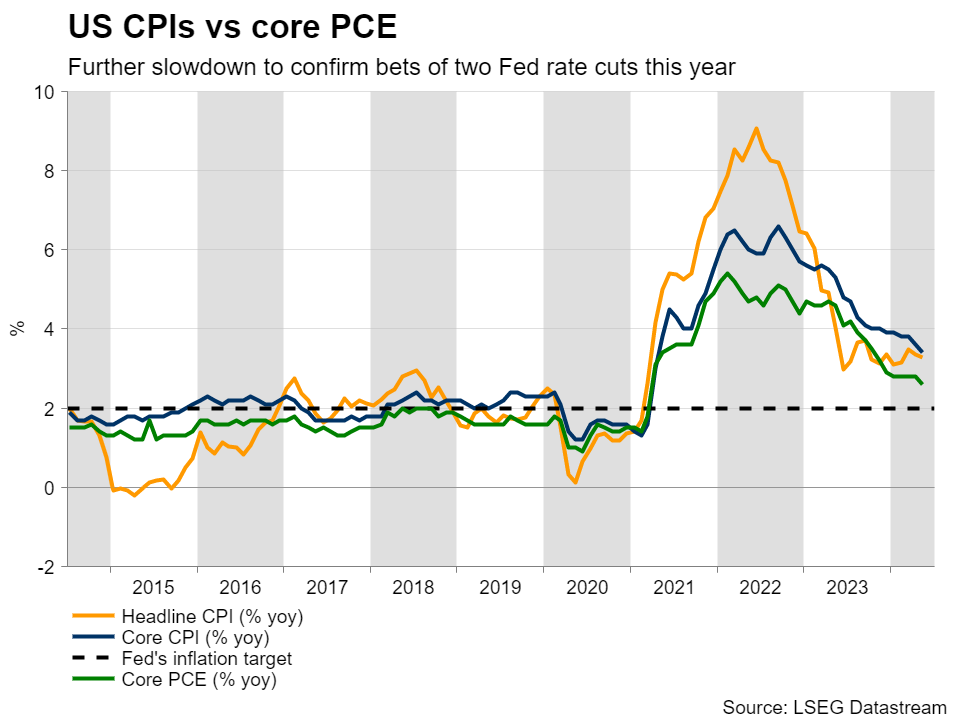
Softer U.S. Inflation Expected in June Ahead of Another Hold from Fed
June’s consumer price index data for the U.S. will be key in revealing whether the resurgence in inflation is over or if softer readings in April and May were just a short reprieve.
On Thursday, we expect headline CPI growth to slow to 3.1% in June, down from 3.3% in May—marking a third consecutive monthly deceleration. Lower gasoline prices (down 4% from May) are expected to account for the slowing. Food price growth was likely little changed, running around 2% year-over-year and we look for price growth excluding food and energy to hold at 3.4% on a second consecutive 0.2% month-over-month increase.
U.S. Federal Reserve officials will be focused on underlying details after a pick-up in broader measures of price growth in the first three months of 2024 was partially reversed over April and May. Rent prices continue to be the main contributor to U.S. price growth as nearly 60% of headline price growth over the past 12 months was attributed to housing in May. But, that will continue to decelerate as slowing growth in current market rent prices feeds through to lease renewals with a delay.
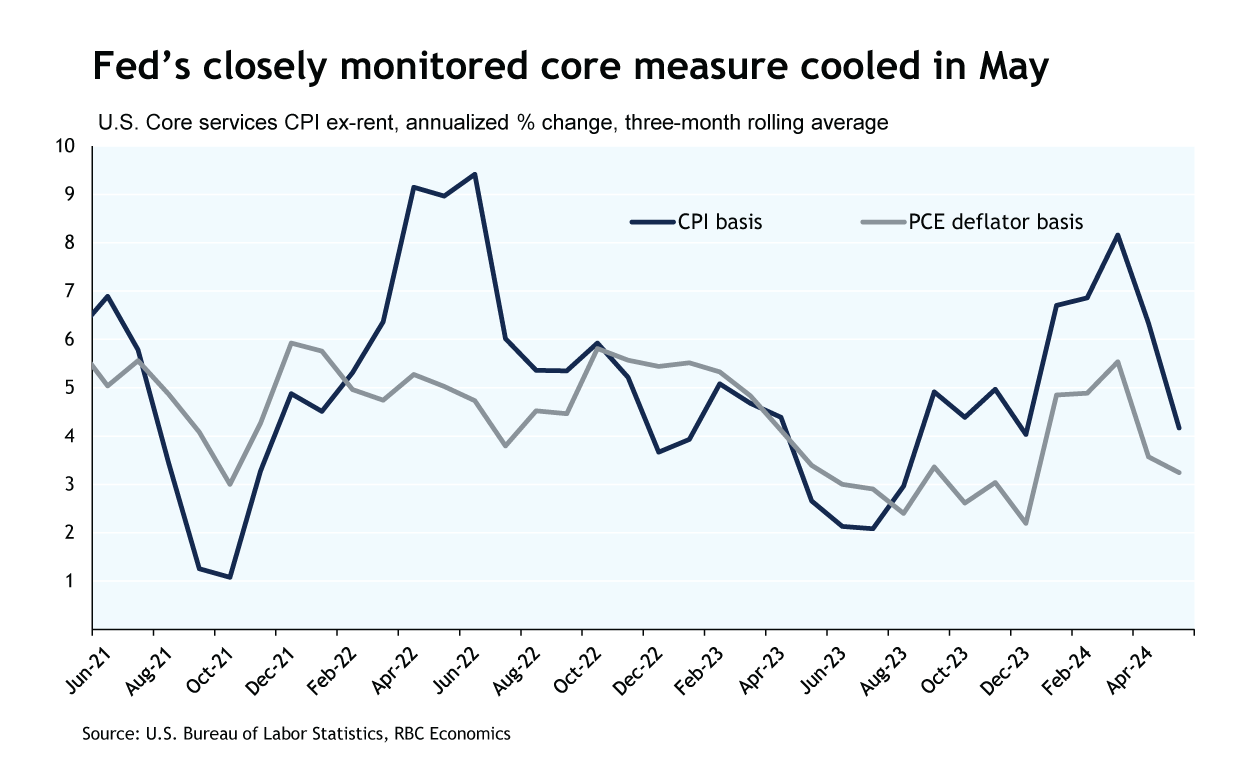
More concerning was a broadly based acceleration in price growth earlier this year. The share of CPI basket items reporting price growth above 5% (over three months) nearly doubled between November and March. That share moderated over April and May but is still higher than normal. The Fed’s closely watched core services excluding rent measure (super core) posted its softest monthly reading since 2021 in May (-0.04%) but only after a string of upside surprises averaging 0.6% per month over the first four months of the year.
We continue to expect that a sustained slowing in underlying inflation growth will only come alongside a softening U.S. economic growth backdrop, but the economic data also looks more mixed.
Employment rose by 206K in June but the unemployment rate has been edging higher and ticked up by one-tenth to 4.1%. Gross domestic product growth is tracking below 2% for a second consecutive quarter in Q2 and the ISM services index fell to its lowest level since the pandemic in June. Our base case assumption is that the upside inflation surprises earlier this year will delay the start of the Fed’s easing cycle compared to most other advanced economy central banks. We look for the first cut from the Fed in December.
Week ahead data watch:
Canadian building permits will be closely monitored in May given three-month rolling average values have trended higher in recent months, up from 257K to 282K in April.
Spotlight on Kiwi as RBNZ Decides on Rates Next Week
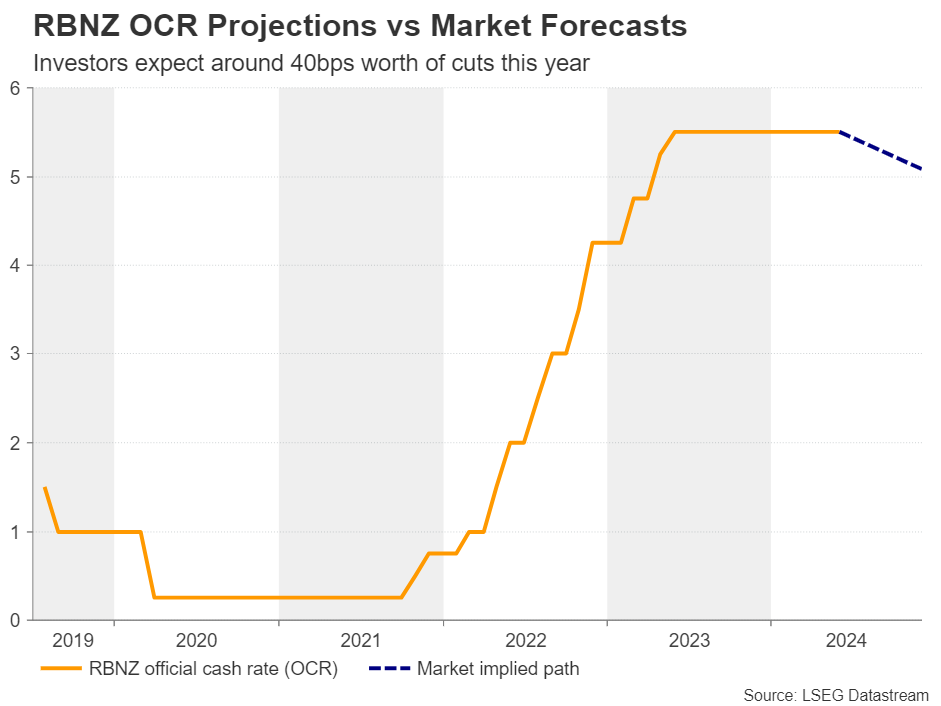
- Interest rates expected to hold stable at a 15-year high of 5.5%
- NZ inflation is still problematic; will the RBNZ talk about a rate hike again?
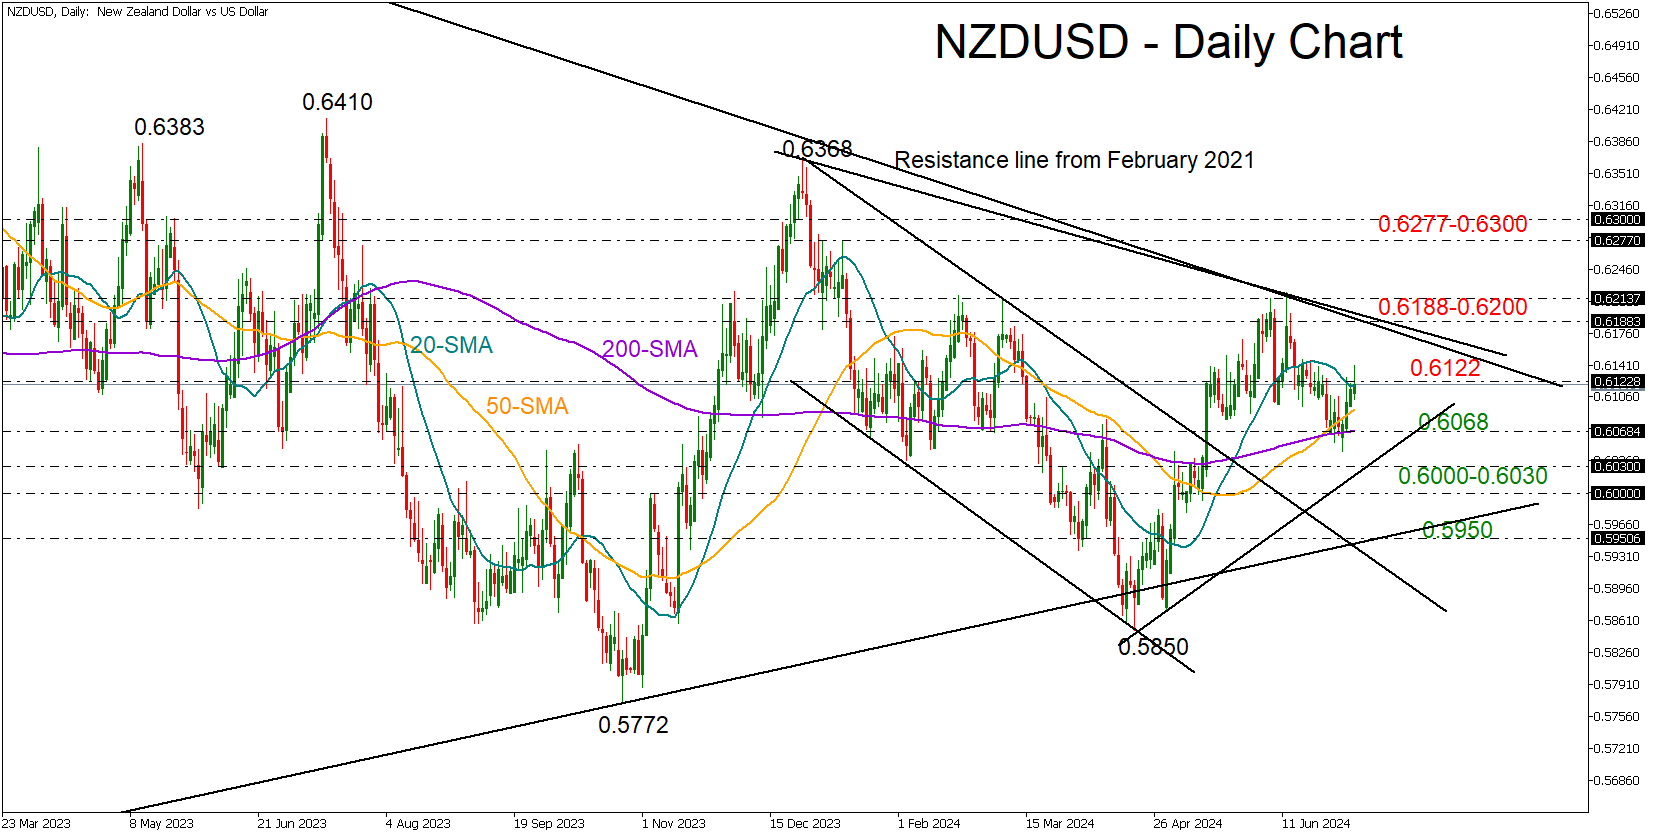
- NZDUSD bulls have some work to do; must surpass 0.6188-0.6200 to gain more fuel
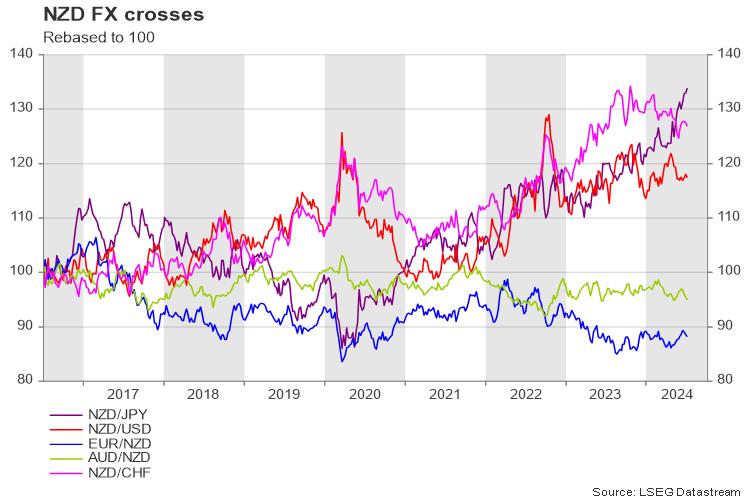
Kiwi has poor performance
The New Zealand dollar has faced difficulties this year in its exchange rate with other major currencies. Lower interest rates in Japan and Switzerland offered a minor advance to the kiwi against the yen and the swissie year-to-date, though the battle against the US dollar, the British pound, and the euro has been disappointing, resulting in a 1-3% retreat thanks to the tight rate differentials between the corresponding economies.
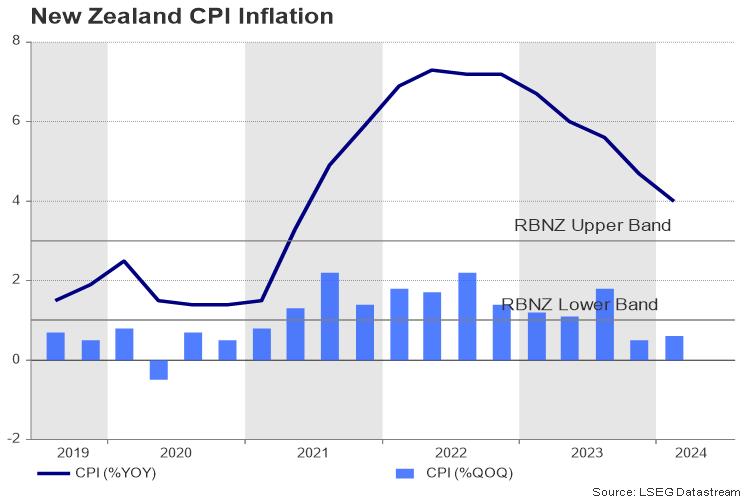
Inflation is still high
The problem is that, although the Reserve Bank of New Zealand (RBNZ) followed other major central banks in hiking interest rates to a multi-year high of 5.5%, headline CPI inflation has been diminishing at a relatively gradual pace, easing to 4.0% y/y in the first quarter compared to 3.6% in Australia, 3.3% in the US and 2.0% in the UK, in the most recent data. Although it’s not far from the target range of 1-3%, it is still twice the 2.0% midpoint objective and higher than what policymakers anticipated. Hence, the central bank met expectations by keeping interest rates unchanged in May, but surprisingly, it deliberated on the possibility of increasing rates, pushing back rate cut projections to the third quarter of 2025.
Investors see a rate cut this year
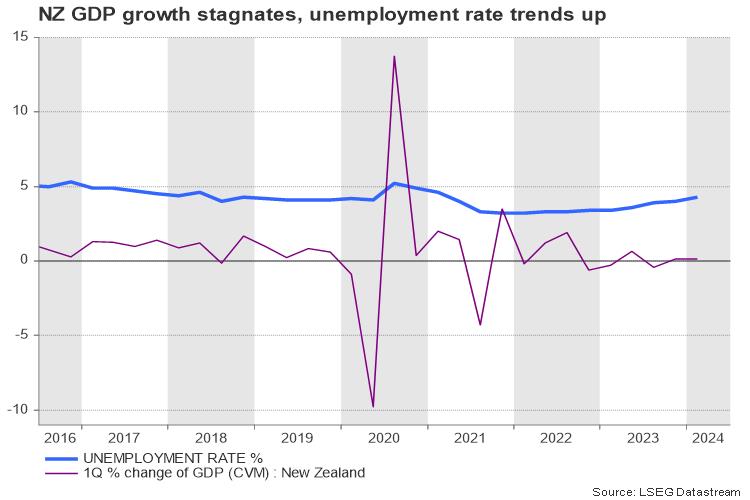
The hawkish policy communication led to a 5.3% rally in NZDUSD to 0.6220 in May-June, but analysts remained unconvinced about an upcoming interest rate hike. Instead, they keep pricing at least one quarter percentage reduction by the end of the year. Maybe they are correct. As the unemployment rate continues to rise and recent business surveys raise concerns about the stagnant economy, there may be little reason to increase borrowing costs.
Don't expect meaningful policy changes
That said, the central bank is not scheduled to update its projections for the economy before its August meeting, while the next employment and inflation releases will be published in the coming weeks. Therefore, policymakers might avoid saying anything pivotal next week until they have enough evidence to justify a rate cut.
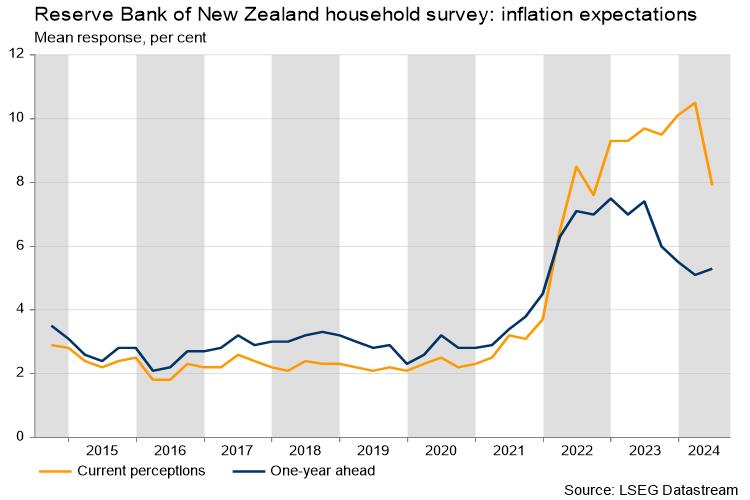
Any commentary on wage growth might also be worth paying attention to. Given the elevated inflation expectations, which suggests that demand for higher salaries could persist, it would be interesting to see if the central bank considers wage growth as a risk to inflation. If that proves to be the case, the kiwi could find some support.
In data releases, Stats NZ will publish a group of price indices on Thursday, including food and house prices, which cover 45% of the CPI, and retail card spending on Friday.
NZDUSD outlook
As regards the market reaction, the NFP report boded well for NZDUSD today. US employment increased by 206k, more than the 190k analysts estimated, though a faster-than-expected increase in the unemployment rate and a slowdown in average hourly earnings reflected weaker labor fundamentals, boosting the odds for a September rate cut to almost 80%. What remains to be seen is if Fed chief Powell sends a clear message of a rate cut during his testimony before Congress next week.
Technically, the 0.6188-0.6200 resistance zone is still intact and only a decisive close above it could elevate the price towards the 0.6277-0.6300 region.
Alternatively, if the RBNZ makes a dovish shift, calling for lower interest rates amid the weak economic climate, the pair could sink. If the 200-day simple moving average (SMA) gives way to the bears, the price could slump towards the 0.6000-0.6030 region and then to 0.5950.
Week Ahead – Round Two of French Elections, Powell Testimony and US CPI
- French parties race to block Le Pen’s RN
- Powell testifies before Senate Banking Committee
- US CPI data to shake Fed rate cut bets
- RBNZ to leave OCR untouched, focus on language
Euro traders keep gaze locked on French election
Traders will be sitting on the edge of their seats on Sunday, in anticipation of Monday’s open and what market impact the second round of the French election will have.
The far-right National Rally (RN) led the first round last Sunday, but the left-wing New Popular Front (NFP) was not far behind. The outcome also revealed that RN and its allies took first place in 296 out of 577 constituencies, which could translate in absolute majority in the second round.
However, left-wing and centrist parties formed an alliance and decided to withdraw their candidates in electorates where there is a three-way runoff, in an attempt to increase their chances of stopping RN from running the government.
The outcome of the European parliamentary elections revealed that the rise of Eurosceptic parties is a negative development for the euro, thus the coordinated attempt to halt Le Pen’s march is seen as positive.
However, even if the left-wing alliance secures victory and the euro opens with a gap on Monday, uncertainty will not vanish as investors may still be eager to find out whether this could lead to a stable government.
There is also the chance of having a hung parliament, where a minority government will struggle to pass legislation. This could lead to prolonged political paralysis given that no elections can take place for at least 12 months, but if the minority government is led by RN, it may not be that bad for the euro, as the other parties may do whatever it takes to block their Eurosceptic agenda.
Increasing Fed rate cut bets to dent the US dollar
In the US, Fed Chair Powell will testify on the economic outlook and recent monetary policy actions before the Senate Banking Committee. The Fed Chief will present a prepared statement and then the committee will conduct a Q&A session.
This week, at the ECB forum on central banking in Sintra, Powell said that they are getting back on “the disinflationary path,” adding though that they want to be more confident about inflation’s return towards their 2% target before they start loosening policy.
His comments were interpreted as corroborating the market narrative that two quarter-point rate reductions may be warranted this year, despite the Fed’s own dot plot pointing to just one. What’s more, following the disappointing ISM PMIs for June, the probability of the first reduction to be delivered in September has risen to 80%.
Although Powell is unlikely to deviate much from what he said in Portugal, the Q&A session may include more targeted questions that result in more clarity regarding the Fed’s plans.
Nonetheless, even if he insists that there is no urgency to press the rate cut button, whether the market pricing will drastically change could depend more on the outcome of the US CPI data on Thursday.
Taking into account that the price subindices of both the ISM manufacturing and non-manufacturing PMI surveys declined, the risks to the CPIs may be tilted to the downside. A further slowdown in inflation may convince more market participants to bet on two Fed rate cuts by December and thereby weigh on the US dollar.
Kiwi traders may cheer hawkish RBNZ
There is also a central bank meeting on next week’s agenda. During the Asian session on Wednesday, the RBNZ will announce its decision on monetary policy, but no change on interest rates is expected. There is only a small 5% chance for a 25bps rate cut.
At its latest gathering back in May, this Bank said that they need to maintain policy at restrictive levels to ensure that inflation returns to target, while more importantly, they discussed the possibility of raising interest rates at that gathering.
Since then, retail sales for Q1 came in better than expected, while the GDP data revealed that the economy grew by more than expected during that period. Although inflation numbers were not released, the aforementioned data corroborate the Bank’s hawkish stance.
Yet, investors are penciling in slightly more than 40bps worth of rate cuts by the end of the year. With the RBNZ having little reason to shift to a less hawkish stance, a reiteration of the May message may prompt investors to scale back rate cut bets, thereby boosting the kiwi.
Kiwi traders alongside their aussie friends will also pay attention to the Chinese CPI and PPI data, due out just half an hour ahead of the RBNZ decision.
UK data and sterling in post-election era
In the UK, with the general election behind them, pound traders may turn their attention back to economic releases. On Thursday, the monthly GDP for May alongside the industrial and manufacturing production numbers for the month are coming out.
With the Labor Party securing a majority in Parliament, the BoE may speed up its easing process on expectations of a more fiscally responsible government, which could prove negative for the pound in the medium term. Thus, improving GDP during the month of May is unlikely to severely alter market expectations with regards to the BoE’s plans.
Sunset Market Commentary
Markets
Payrolls have arrived. Net job creation in the US amounted to 206k in June. While slightly topping the 190k estimate, it came with a significant downward revision for the previous two months (-111k). In addition, about a third of June’s jobs came on the account of the government (+70k). That same government was also largely responsible for the JOLTS uptick published earlier this week (May). Other sectors adding jobs were health & social assistance (+82k) and wholesale trade (+14k). Retail trade (-9k), professional business services (-17k) and manufacturing (-8k) shed some. Hourly earnings came in at the expected 0.3% m/m (3.9% y/y). The unemployment rate unexpectedly ticking higher to 4.1% - the highest since November 2021 - draws attention after several Fed governors recently expressed growing concerns the labour market may be nearing an inflection point. The participation rate creeped marginally higher to 62.6%. All in all not an outright weak report but one that does show the labour market is slowing further. It’s too soon for the June edition to cement a September rate cut – market odds remain +/- 80% - but it obviously doesn’t call one into question either. US yields added to their previous losses in the wake of the report, especially at the front. Net daily changed vary between -2 bps (30-yr) to -7 bps (2-yr). The mid-June support zone around 4.65% in the 2-yr yield risks giving way. German yield declines range between -1.7 and -3.2 bps. The dollar retains the losses incurred earlier on the day. EUR/USD changes hands around 1.083, up from 1.0812. A minor drop in USD/JPY (to 160.82) does little to reassure Japanese officials. Next week is another important one for the US with June CPIs due and Fed chair Powell’s semiannual testimony before Congress. We do think he’ll save the juicy quotes for a potentially pivotal Jackson Hole symposium, planned at August 24-26. The Fed by then will have another batch of monthly data at its disposal. Crucially, it’ll be possible to make a first guestimate for the potential April 2023 – March 2024 payrolls revision two days in the run-up. A (sharp) downward adjustment (= the “unexpected labour market weakening” the Fed is wary about?!) is widely anticipated. Sterling is enjoying a nice run against the euro (EUR/GBP 0.845) and the dollar (GBP/USD +1.28) in the wake of a landslide Labour victory. Party leader Starmer held a first speech meanwhile, promising a government of “stability and moderation”. He’ll appoint his cabinet later today. The election topic remains hot with this weekend’s second round in the France due (parliament).
News & Views
The UN Food and Agricultural Organization monthly food price index was unchanged in June. Increases in vegetable oil, sugar and dairy products balanced out a decrease in cereals. The meat index was almost unchanged. Despite rebounding from the lowest level in about 2-year since February, the index remains 2.1% lower Y/Y and 24.8% below the peak of March 2022. Cereal prices declined 3.0% M/M and 9.0%% Y/Y. Global export prices of all major cereals decreased month on month. Improved production prospects in some major exporting countries along with the implementation of a temporary import ban by Turkey contributed to the softer price for wheat. Maize prices also dropped as production in Argentina and Brazil is seen larger than anticipated. Vegetable oil prices rose 3.1% M/M to the highest level since March 2023 due to higher quotations for palm, soy and sunflower oil. The dairy price index rose 1.2% M/M to be 6.6% higher compared to the same month last year.
Hungarian statistical office (KSH) data today suggest lackluster economic momentum. Industrial production dropped 1.1% M/M in May and was 4.9% lower Y/Y. KSH mentions a fall in the manufacture of transport equipment, electrical equipment, as well as in the manufacture of computer, electronic and optical products. Production of food products, beverages and tobacco products increased. In a separate release May retail sales were reported 3.6% higher Y/Y (was 3.2% in April). Food sales rose by 6.3% Y/Y, non-food retailing added 1.8% Y/Y while automotive fuel sales declined 0.7%. KSH assesses sales volumes to have been essentially unchanged from the previous month. Cumulative sales for the first 5 months of 2024 were 2.7% higher compared to last year. After coming under pressure due to global/European related uncertainty (European and French elections), the forint this week captured a better bid, strengthening to EUR/HUF 392.5 currently to be compared with levels near EUR/HUF 398 mid-June.
Graphs
US 2-yr yield mid-June support about to break in the wake of further slowdown in the labour market
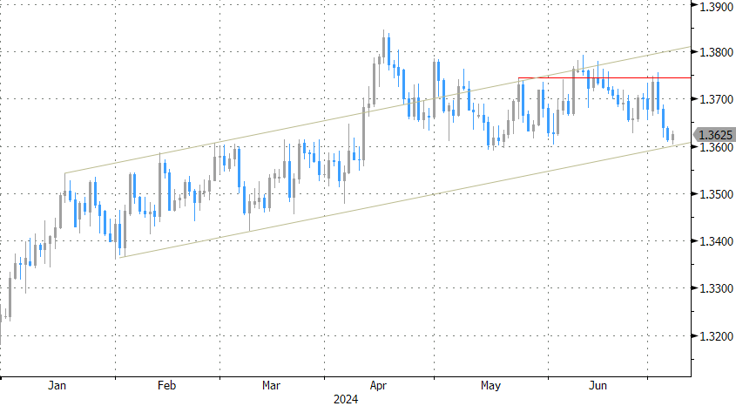
GBP/USD: cable nears the upper band of a sideways trading range on combo of sterling strength and dollar weakness
USD/CAD: unexpected decline in Canadian employment offers USD/CAD some relief
S&P500 opens near record high as softening labour market keeps September rate cut on the table