Sample Category Title
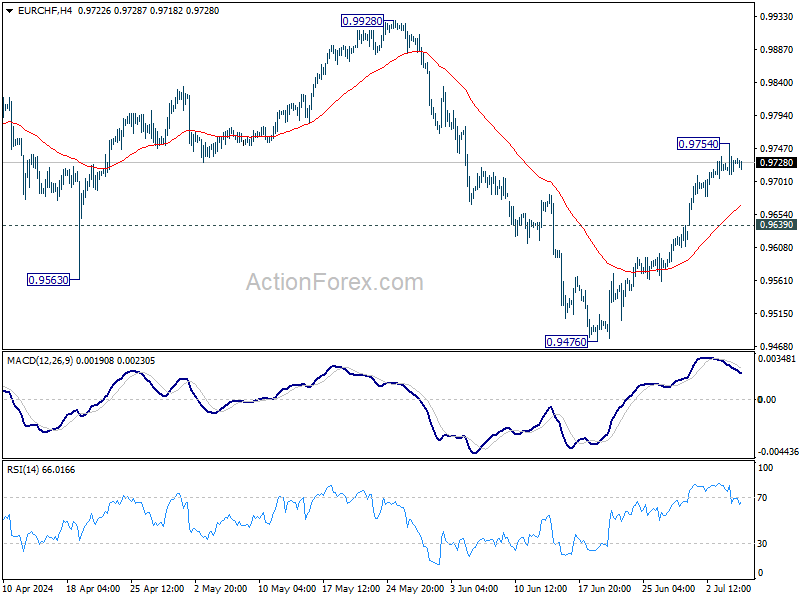
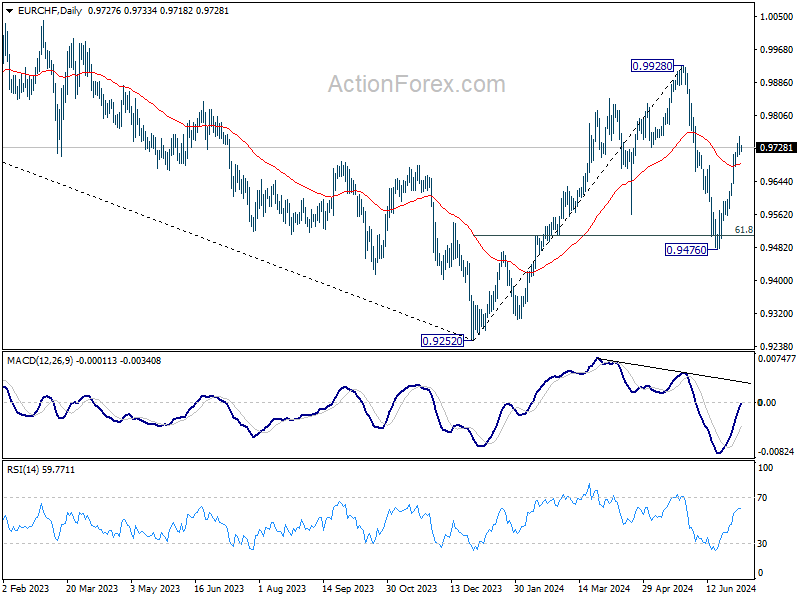
EUR/CHF Daily Outlook
Daily Pivots: (S1) 0.9711; (P) 0.9733; (R1) 0.9755; More....
Intraday bias in EUR/CHF is turned neutral with current retreat and some consolidations would be seen first. Further rally is expected as long as 0.9639 minor support holds. Above 0.9754 will resume the rise from 0.9476 to 0.9928 high. Nevertheless, break of 0.9639 will turn bias back to the downside for 0.9476 low instead.
In the bigger picture, rebound from 0.9252 medium term bottom might not be completed yet. But even in case of resumption, strong resistance could emerge from 1.0095 to limit upside. Medium term outlook will be neutral at best as long as 1.0094 structural resistance holds. Meanwhile, break of 0.9476 will bring retest of 0.9252 low.
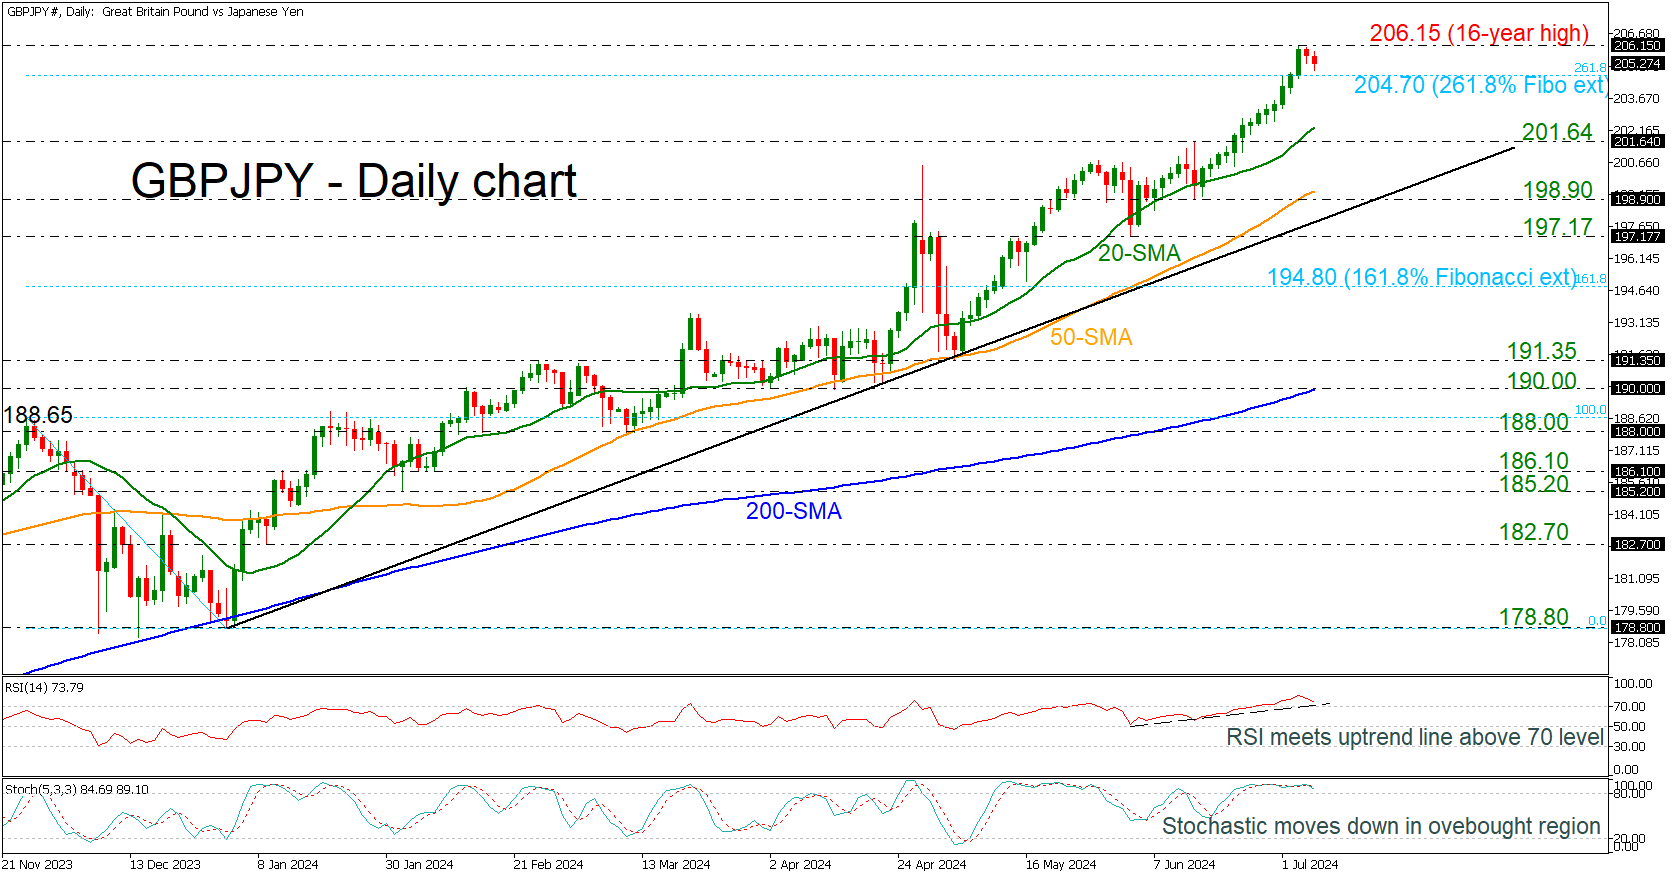
GBPJPY Eases After Hitting New 16-Year High
- GBPJPY remains in strong upside tendency in long-term
- RSI flirts with uptrend line above 70
- Stochastic looks overstretched
GBPJPY is declining somewhat after rallying to a fresh 16-year high of 206.15 earlier in the week. The pair posted 13 straight days of gains before falling near the 261.8% Fibonacci extension level of the down leg from 188.65 to 178.80 at 204.70.
The technical oscillators indicate an overstretched market, as the RSI is heading south, meeting the uptrend line that has been holding since the beginning of June, above the 70 level. Also, the stochastic oscillator is pointing down after the bearish crossover within the %K and %D lines above the 80 level.
If there are more declines and a dive below the immediate Fibonacci level, the market could visit the 20-day simple moving average (SMA) at 202.30, ahead of the 201.64 support level. Even lower, the bearish correction may continue until the 50-day SMA, near the 198.90 support, before testing the long-term ascending trend line at 198.50.
In the positive scenario, a successful climb above the latest multi-year peak could meet the next round numbers, such as 207.00 and 208.00, until the high in July 2008 at 215.90.
All in all, GBPJPY has been in a strong upward trend since the start of the year, and only a decisive fall below the 200-day SMA near the 190.00 psychological mark could change the current outlook.
EUR/USD Advances, DXY Eyes Trendline Break – Jobs Data Up Next
- EUR/USD rises above 1.0800 due to weak US economic data and a weaker USD.
- Market anticipates a 71.6% chance of a rate cut in September.
- DXY is at a psychological support level ahead of US jobs data release.
EUR/USD continued its upward momentum on US Independence Day, capitalizing on a weaker USD and low market liquidity to rise above the 1.0800 level.
A series of weak US economic data this week has increased expectations for rate cuts. ISM services data disappointed yesterday, contracting at its fastest rate in four years.
The ADP job numbers also came with a warning from ADP Chief Economist Nela Richardson, who noted that job growth had not been widespread. The leisure and hospitality sectors bolstered the ADP figure, which is unsurprising given the significant rise in travel during the summer.
This data has led market participants to price in a 71.6% likelihood of a rate cut in September, up from about 60% a week and a half ago. Last night’s Fed minutes revealed no new information, with the Fed emphasizing their lack of urgency to cut rates. Can upcoming data influence the Central Bank’s decision?
US Interest Rate Probability
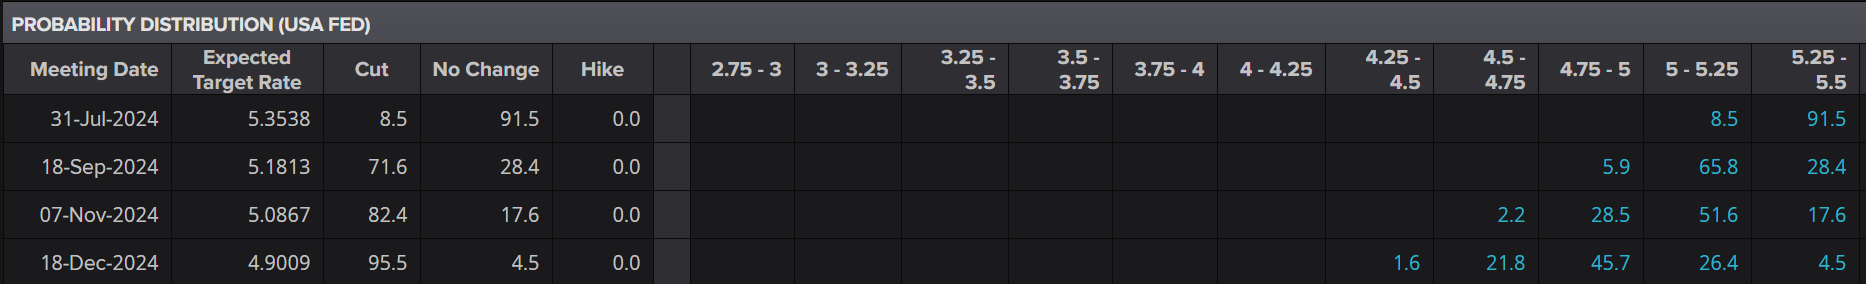
Source: LSEG
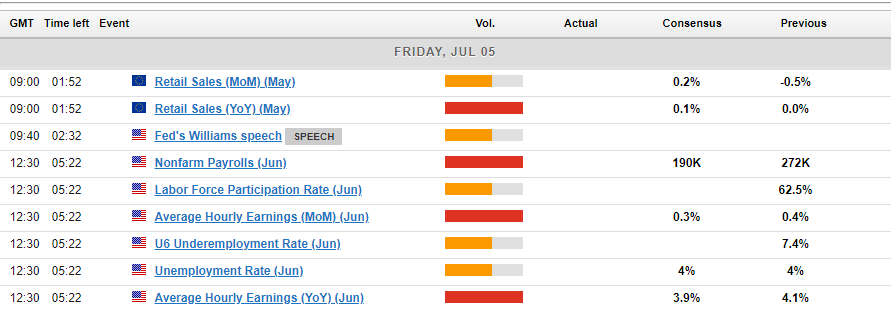
EU Retail Sales,US Jobs Data
Eurozone retail sales figures will be released shortly, with expectations for a 0.2% month-over-month increase and a 0.1% year-over-year rise. After the disappointing results in April, market participants are hoping that May’s numbers indicate some improvement. A positive reading could support the Euro against the US Dollar, even if the gains are temporary.
The importance of this NFP report and the unemployment rate release has been extensively discussed. After last month’s exceptional NFP figures, markets are eager to see if that result was an anomaly or part of a trend.
Technical Analysis on DXY and EUR/USD
The Dollar Index (DXY) is once again trading at a psychological support level, where numerous factors converge just ahead of tomorrow’s batch of US data. This positions the DXY delicately as we approach the release.
Should the data exceed forecasts, the DXY could retest the 106.00 level. Conversely, a disappointing data release could put the DXY at risk of breaking below the 100 and 200-day moving averages (MAs). These moving averages are situated just below psychological support and above the long-term ascending trendline.
The 100-day MA is at 104.75, with the 200-day MA slightly lower at 104.49. Combined with the trendline, the area just below 105.00 is dense with confluences. Therefore, a sustainable break below this level may be challenging unless the jobs data falls significantly short of expectations.
US Dollar Index Daily Chart, July 5, 2024
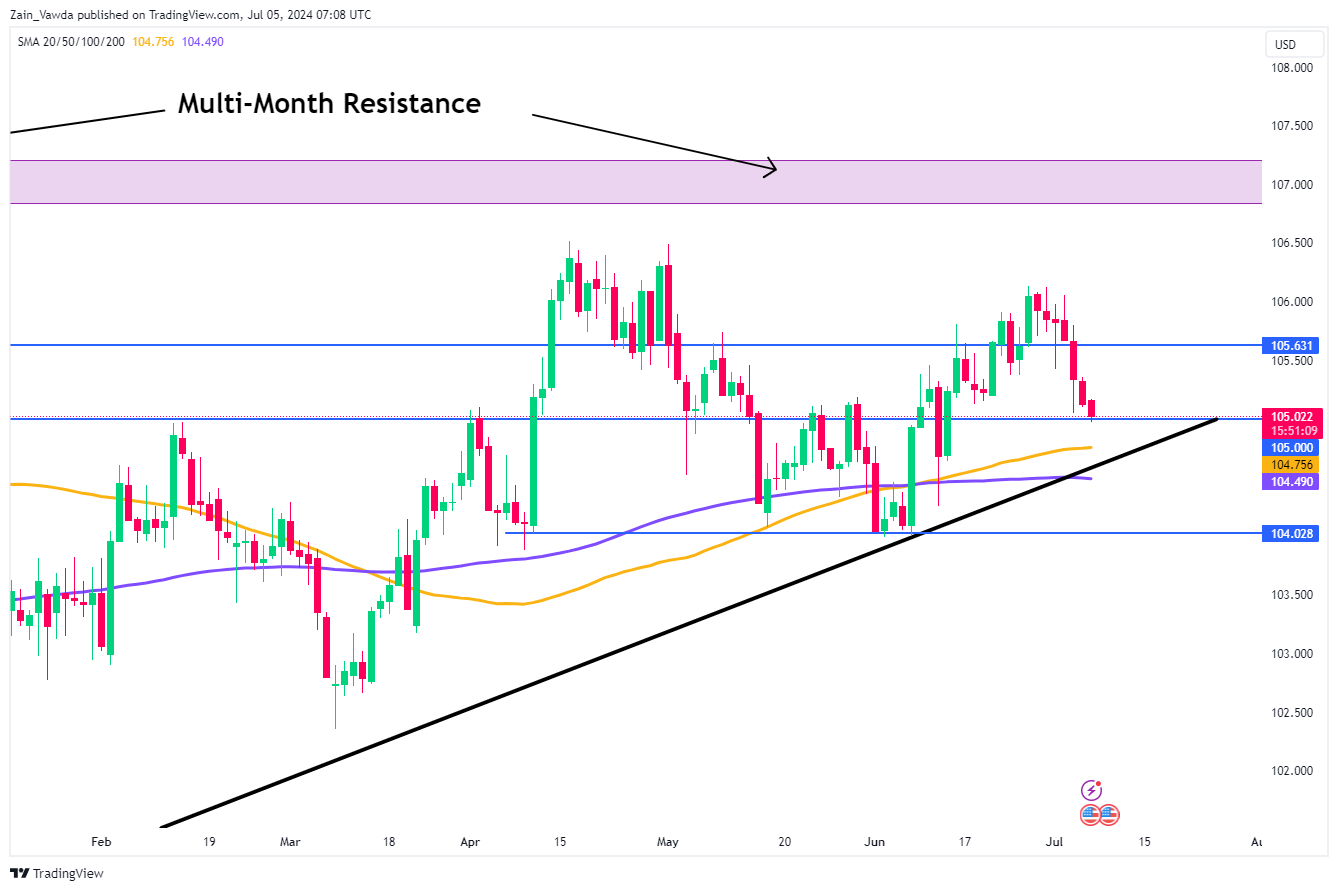
Source: TradingView.com (click to enlarge)
Key Levels to Keep an Eye on;
Support
- 105.00
- 104.75
- 104.50
- 104.00
Resistance
- 105.60
- 106.00
- 107.00
EUR/USD
EUR/USD is enjoying a bit of a renaissance following a two-week period of rangebound trading. Having finally broken above the resistance level at 1.0750, the pair has advanced and crossed above the 100-day MA.
A daily candle close above the 100-day moving average has positioned EUR/USD favorably ahead of the NFP and jobs data release in the US. Immediate resistance lies in the 1.08400-1.08500 range. A break above this level would bring the short-term descending trendline and the 1.0900 mark into play.
A significant downside miss in the NFP data could propel EUR/USD towards the psychological 1.10000 level. Conversely, if the data surpasses estimates, EUR/USD could head towards recent lows, potentially pushing beyond 1.07000 and highlighting the 1.0600 support level.
EUR/USD Daily Chart, July 5, 2024
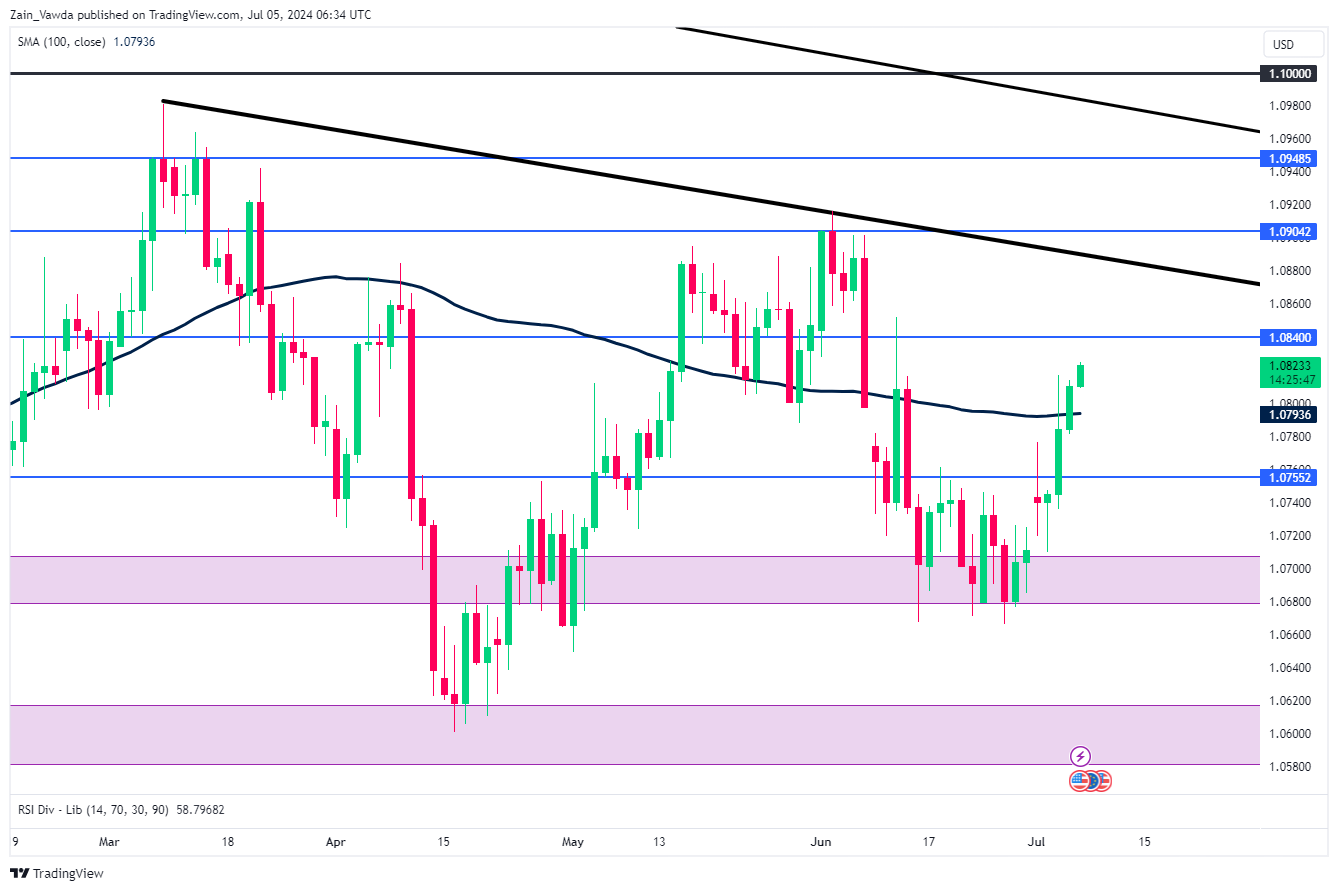
Source: TradingView.com (click to enlarge)
Dollar Consolidates Ahead of Nonfarm Payrolls: Possible Scenarios
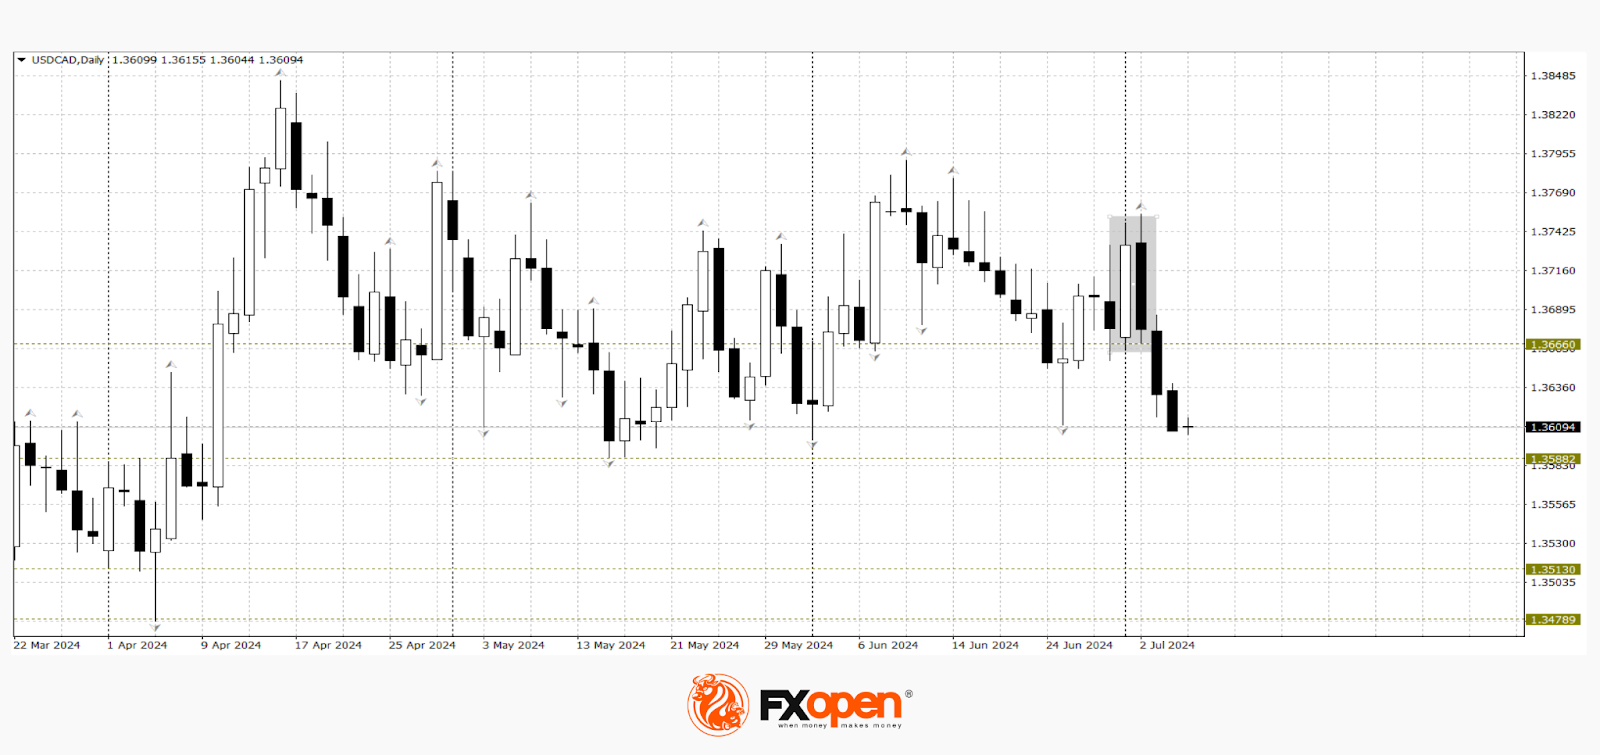
In anticipation of the release of one of the most important reports, the NonFarm Payrolls, the US currency has suffered losses across almost all fronts. Earlier this week, the EUR/USD currency pair tested and settled above 1.0800, GBP/USD traded above 1.2700, and USD/CAD fell back to 1.3610.
Today, we might see either continued corrective pullbacks or a resumption of medium-term trends if the employment data deviates from expectations. So, what should we expect?
- Experts forecast a decline in average earnings to 0.3% (if the figure comes in at last month's level or higher, it could strengthen the US currency).
- The number of new jobs in June is expected to be 194K (if the figure is significantly higher or lower than the forecast, it could cause volatility in major currency pairs).
USD/CAD
Dollar buyers in the USD/CAD pair failed to overcome resistance at 1.3750. A rebound from this level led to the formation of a "bearish engulfing" pattern on the daily timeframe. According to the technical analysis of USD/CAD, the price has approached the lower boundary of the medium-term flat corridor at 1.3610. If the price consolidates below this level in the coming trading sessions, the downward movement could continue towards 1.3520-1.3480. A rebound from 1.3610 could lead to a retest of 1.3700-1.3660.
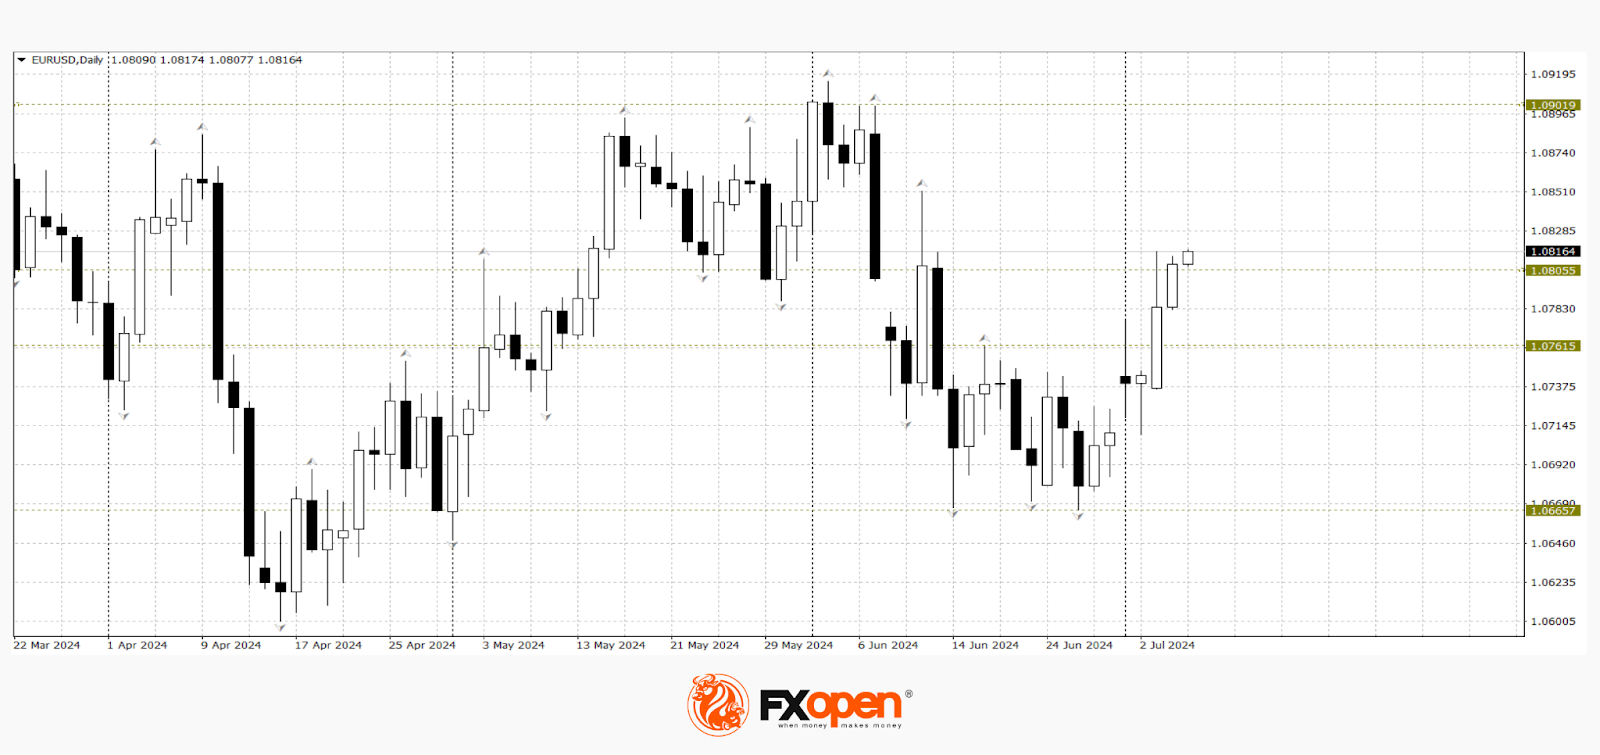
EUR/USD
Technical analysis of EUR/USD suggests the potential for continued growth towards 1.0900, as the price has exited the medium-term flat corridor of 1.0760-1.0650. A break in the upward impulse is possible if the price returns to the specified corridor and consolidates below 1.0760. Besides the publication of US employment data, the following events are worth noting today:
- At 10:00 (GMT +3:00) a speech by the President of the German Bundesbank, Nagel.
- At 12:00 (GMT +3:00) the release of retail sales volumes in the Eurozone for May.
Trade over 50 forex markets 24 hours a day with FXOpen. Take advantage of low commissions, deep liquidity, and spreads from 0.0 pips. Open your FXOpen account now or learn more about trading forex with FXOpen.
This article represents the opinion of the Companies operating under the FXOpen brand only. It is not to be construed as an offer, solicitation, or recommendation with respect to products and services provided by the Companies operating under the FXOpen brand, nor is it to be considered financial advice.
Market Analysis: Gold and Oil Prices Soar, More Gains Ahead?
Gold price started a fresh increase above the $2,342 resistance level. Crude oil prices are gaining bullish momentum and might soon test $85.00.
Important Takeaways for Gold and Oil Prices Analysis Today
- Gold price started a steady increase from the $2,320 zone against the US Dollar.
- A connecting bullish trend line is forming with support near $2,355 on the hourly chart of gold at FXOpen.
- Crude oil prices extended gains above the $82.00 and $83.00 resistance levels.
- There is a key bullish trend line forming with support at $82.75 on the hourly chart of XTI/USD at FXOpen.
Gold Price Technical Analysis
On the hourly chart of Gold at FXOpen, the price found support near the $2,320 zone. The price formed a base and started a fresh increase above the $2,330 level.
There was a decent move above the 50-hour simple moving average and $2,335. The bulls pushed the price above the $2,355 resistance zone. Finally, the bears appeared near $2,365. A high was formed near $2,364.89 and the price is now consolidating gains.
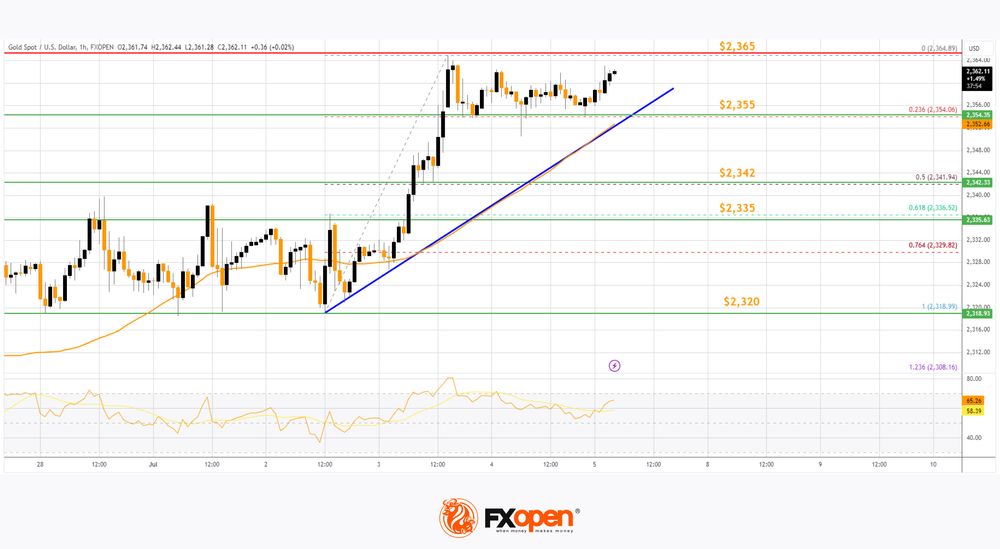
The price dipped a few points and tested the 23.6% Fib retracement level of the upward move from the $2,319 swing low to the $2,365 high. The RSI is still above 55 and the price could aim for more gains.
Immediate resistance is near the $2,365 level. The next major resistance is near the $2,372 level. An upside break above the $2,372 resistance could send Gold price toward $2,380. Any more gains may perhaps set the pace for an increase toward the $2,400 level.
Initial support on the downside is near the $2,355 zone. There is also a connecting bullish trend line forming with support near $2,355. If there is a downside break below the $2,355 support, the price might decline further.
In the stated case, the price might drop toward the $2,335 support or the 61.8% Fib retracement level of the upward move from the $2,319 swing low to the $2,365 high. The next major support sits at $2,320.
Oil Price Technical Analysis
On the hourly chart of WTI Crude Oil at FXOpen, the price started a major upward move from $80.45 against the US Dollar. The price gained bullish momentum after it broke the $82.00 resistance.
The bulls pushed the price above the $82.30 and $82.75 resistance levels. The recent high was formed at $83.50 and the price settled above the 50-hour simple moving average. The RSI is now near the 50 level and the price is trading below the 23.6% Fib retracement level of the upward move from the $81.95 swing low to the $83.52 high.
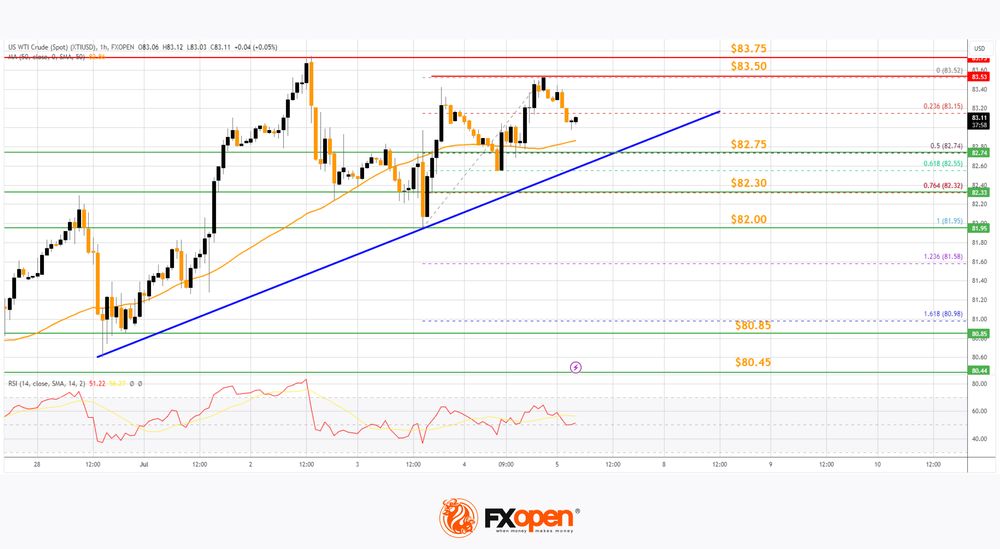
If the price climbs higher again, it could face resistance near $83.50. The next major resistance is near the $83.75 level. Any more gains might send the price toward the $85.00 level.
Conversely, the price might correct gains and test the 50% Fib retracement level of the upward move from the $81.95 swing low to the $83.52 high at $82.75. There is also a key bullish trend line forming with support at $82.75.
The next major support on the WTI crude oil chart is near the $82.30 zone, below which the price could test the $82.00 zone. If there is a downside break, the price might decline toward $80.85. Any more losses may perhaps open the doors for a move toward the $78.50 support zone.
Start trading commodity CFDs with tight spreads. Open your trading account now or learn more about trading commodity CFDs with FXOpen.
This article represents the opinion of the Companies operating under the FXOpen brand only. It is not to be construed as an offer, solicitation, or recommendation with respect to products and services provided by the Companies operating under the FXOpen brand, nor is it to be considered financial advice.
Anything But a Significant NFP Beat Probably Triggers Higher Bond Prices and Weaker Dollar
Markets
An uneventful session yesterday put the UK elections in the spotlights. It’s already clear by now that Labour won enough seats to secure a majority (at least 326 seats of the 650 up for grabs) after being in the opposition for 14 years. Exit polls taken after voting booths closed at 10 PM yesterday suggested it’s going to be a huge one with estimates going as high as 410, making it a victory comparable to the 1997 landslide under Tony Blair. Outgoing PM Sunak’s Conservative Party simply imploded. Voter turnout was close to a record low. As Labour’s Starmer is ready to move in to Downing Street 10, market attention shifts towards the new government’s policy plans. There’s a feeling that things can only get better in the UK with a hoped-for end to years of political drama that included Conservative infighting, BYOB lockdown scandals, Scotland’s independence referendum and of course Brexit. Labour’s typically has spending ambitions though markets assume the Truss-Kwarteng bond crash brought a sense of fiscal awareness. Chancellor-to-be Rachel Reeves also said that the administration does not plan to raise three key UK taxes on wages and goods. All that have yet to be formalized in a first official budget though, which could take until October. Sterling barely budged on the widely anticipated Labour win. EUR/GBP eked out a small gain yesterday to close at 0.8474. Trading for the next couple of days, perhaps weeks, could remain technically inspired as summer liquidity conditions kick in.
The US returns today after having enjoyed the day off for the 4th of July. They are immediately treated with important data. The June labour market report is due with the bar set at for a 190k job creation. Hourly earnings are expected to roll in at 0.3% m/m (3.9% y/y), easing from the 0.4% the month before. Unemployment would stabilize at 4%. The labour market gained in importance after several Fed governors showed increasing concerns that it may be nearing an inflection point. Upcoming data would now have to prove them otherwise. Markets will react accordingly with anything but a significant beat probably triggering higher bond prices and a weaker US dollar. The US 2-yr yield is trading a few basis points above the June lows of 4.65%. A break lower paves the way for a return to 4.58-4.60%. Longer maturities including the 10-yr have a bit more wiggle room ahead of similar support areas. EUR/USD topped the 1.08 yesterday. Next resistance is located at 1.087 before 1.09 shows up. But this may be a bridge too far for now this weekend’s second round in the French elections looming.
News & Views
Japanese consumer spending in May showed an unexpected steep decline, the statistical bureau said. Spending still rose 1.4% Y/Y in nominal terms but was 1.8% lower in real terms while contracting 0.3% M/M. Consensus expected real spending to have stayed in positive territory (0.3% Y/Y expected from 0.5% in April). The decline originated from food (-3.1%), housing (-3.5%), utilities (-9.7%) but also from lower discretionary spending in furniture and utensils (- 10.0%) and spending on culture and recreation (-8.4%). Positive growth was registered for education (9.3%) and medical care (6.4%). If confirmed by other data, the decline would complicated BOJ policy normalization as it seeks an upward spiral of higher real wages and gradual price rises to support domestic spending. Today’s data are a factor for the BOJ to wait with a rate hike at the upcoming July 31 meeting. USD/JPY (160.75) this morning eases of multi-decade highs just below 162 reached earlier this week, but this at least partially due to USD softness.
The NBP of Poland last Wednesday as expected left its policy rate unchanged at 5.75%. In new projections, inflation expectations were upwardly revised for this year (3.7% from 3.55%) and specially for next year (5.25% from 3.6%). In the press briefing commenting the decision yesterday, the new forecast caused governor Glapinski to conclude that expectations for a rate hike anytime soon are out of question. Inflation might again reach 5.0% at the end of this year and might even accelerated further on higher energy prices at the start of 2025. In this context, he concluded that a possibility to cut rates might only take place in 2026 at earliest. The zloty extended this week’s gains with EUR/PLN closing at EUR/PLN 4.2825).
Graphs
GE 10y yield
The ECB cut its key policy rates by 25 bps at the June policy meeting. A more bumpy inflation path in H2 2024, the EMU economy gradually regaining traction and the Fed’s higher for longer US strategy make follow-up moves difficult. Markets are coming to terms with that. Meanwhile, much of the save haven bids were reversed after the first round in the French elections. The 2.34%-2.4% support zone looks solid.
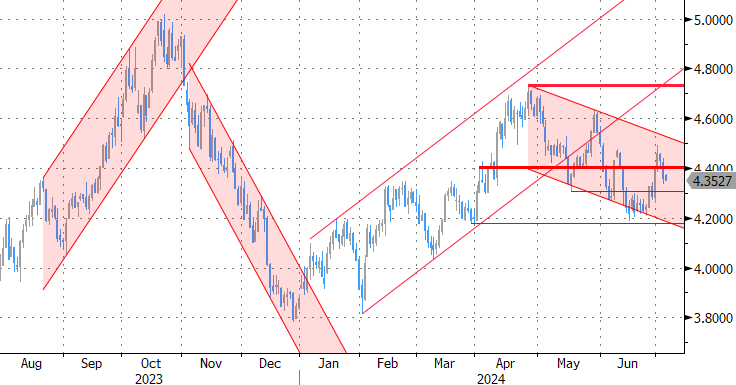
US 10y yield
The Fed needs more evidence than just one slower-than-expected (May) CPI is providing. Upgraded inflation forecasts and a higher neutral rate complicate the timing of a first cut further. June dots suggest one move in 2024 and four next year. The long end of the curve is supported by increased odds of a Trump presidency after the debate with Biden. The spectre of increased spending (risk premia) pulled the 10-yr away from the 4.2% support area.
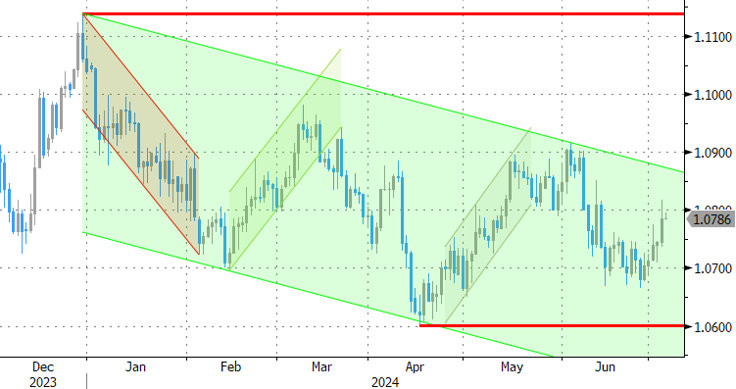
EUR/USD
EUR/USD is stuck in the 1.06-1.09 range. The desynchronized rate cut cycle with the ECB exceptionally taking the lead, strong US May payrolls and a swing to the right in European elections pulled the pair away from 1.09. The Fed meeting balanced the weaker than expected US CPI outcome. The increased probability of a hung French parliament after the first round offered the euro some relief.
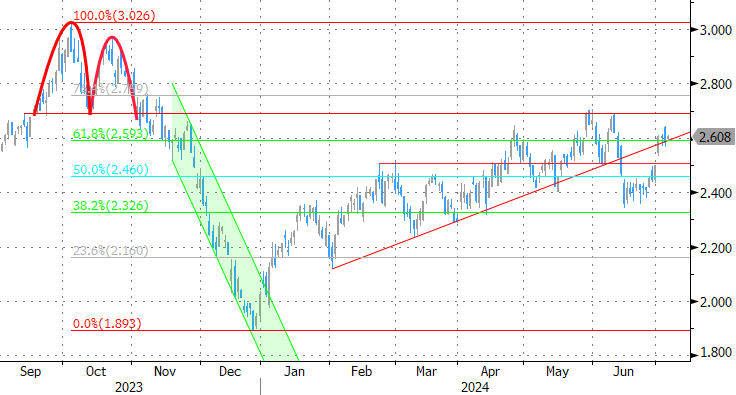
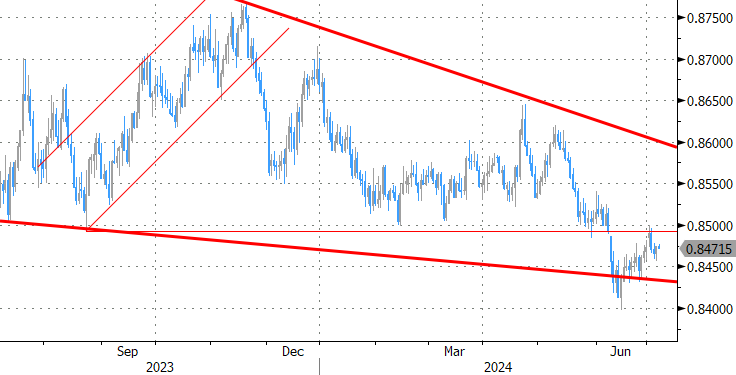
EUR/GBP
Debate at the BOE is focused at the timing of rate cuts. May headline inflation returned to 2%, but core measures weren’t in line with inflation sustainably returning to target any time soon. Still some BoE members at the June meeting appeared moving closer to a rate cut. This might cap further sterling gains. Labour has yet to reveal its policy plans after securing a landslide election victory. EUR/GBP 0.84 is solid support.
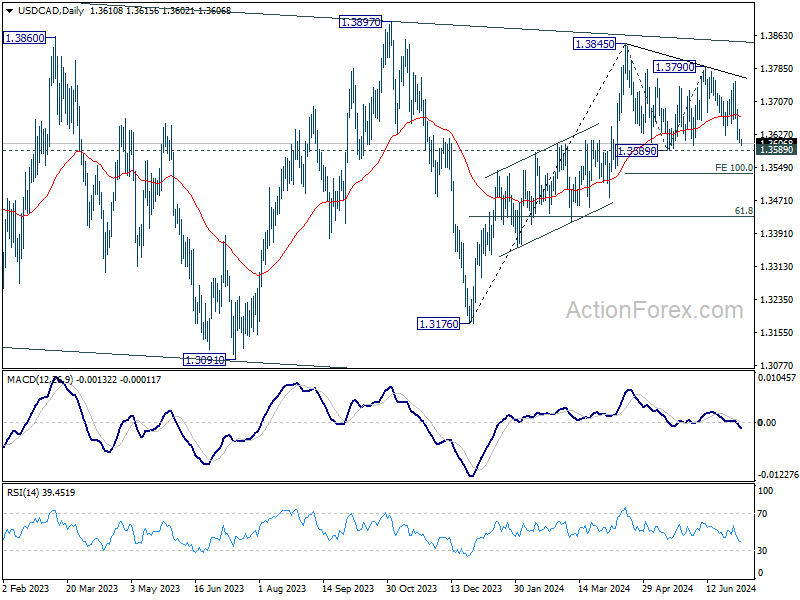
USD/CAD Daily Outlook
Daily Pivots: (S1) 1.3610; (P) 1.3648; (R1) 1.3679; More...
Intraday bias in USD/CAD remains neutral first. Break of 1.3589 will resume the corrective fall from 1.3845 to 100% projection of 1.3845 to 1.3589 from 1.3790 at 1.3534. Strong support would be seen there to bring rebound. On the upside, above 1.3686 minor resistance will turn bias back to the upside for 1.3790 resistance instead.
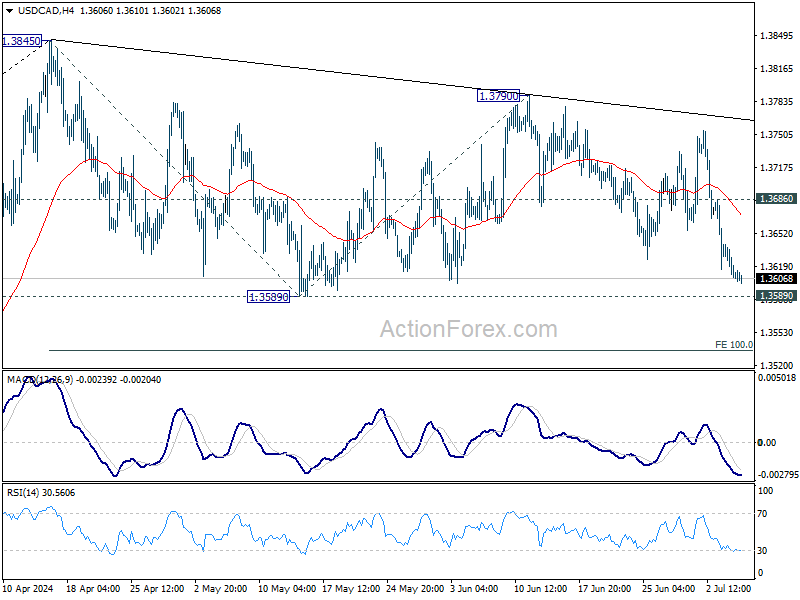
In the bigger picture, price actions from 1.3976 (2022 high) are viewed as a corrective pattern. In case of another fall, strong support should emerge above 1.2947 resistance turned support to bring rebound. Firm break of 1.3976 will confirm up resumption of whole up trend from 1.2005 (2021 low). Next target is 61.8% projection of 1.2401 to 1.3976 from 1.3176 at 1.4149.
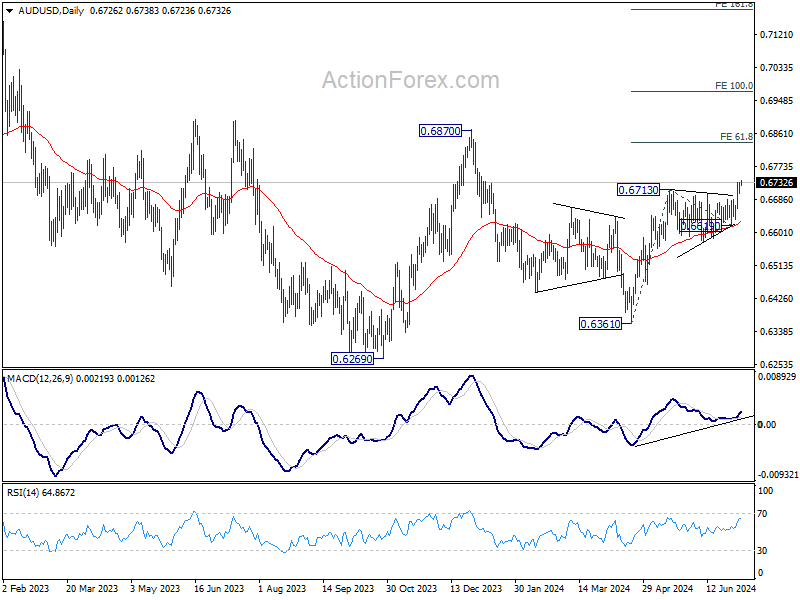
AUD/USD Daily Report
Daily Pivots: (S1) 0.6708; (P) 0.6720; (R1) 0.6738; More...
AUD/USD's rally is in progress and intraday bias stays on the upside. Current rise from 0.6361 should target 61.8% projection of 0.6361 to 0.6713 from 0.6619 at 0.6837 next. On the downside, below 0.6699 minor support will turn intraday bias neutral first. But, near term outlook will stay bullish as long as 0.6619 support holds, in case of retreat.
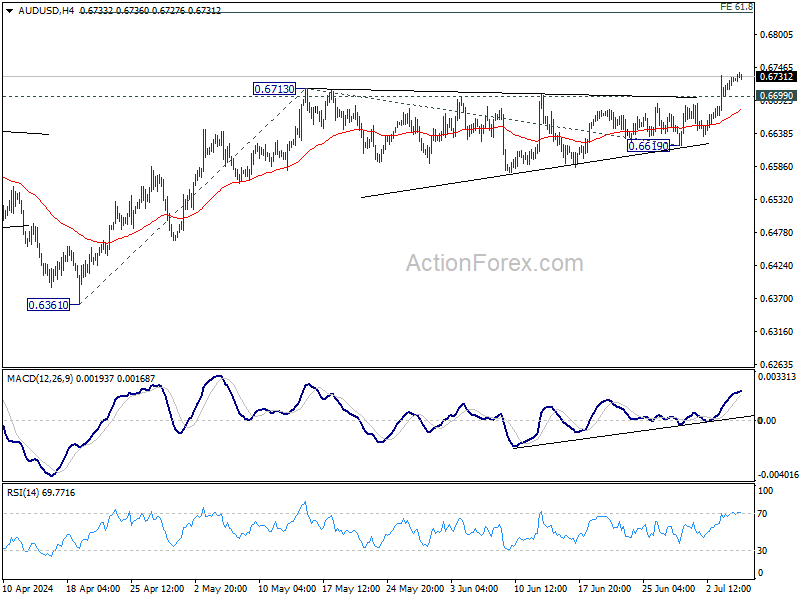
In the bigger picture, price actions from 0.6169 (2022 low) are seen as a medium term corrective pattern to the down trend from 0.8006 (2021 high). Fall from 0.7156 (2023 high) is seen as the second leg, which could have completed at 0.6269 already. Rise from there is seen as the third leg which is now trying to resume through 0.6870 resistance.
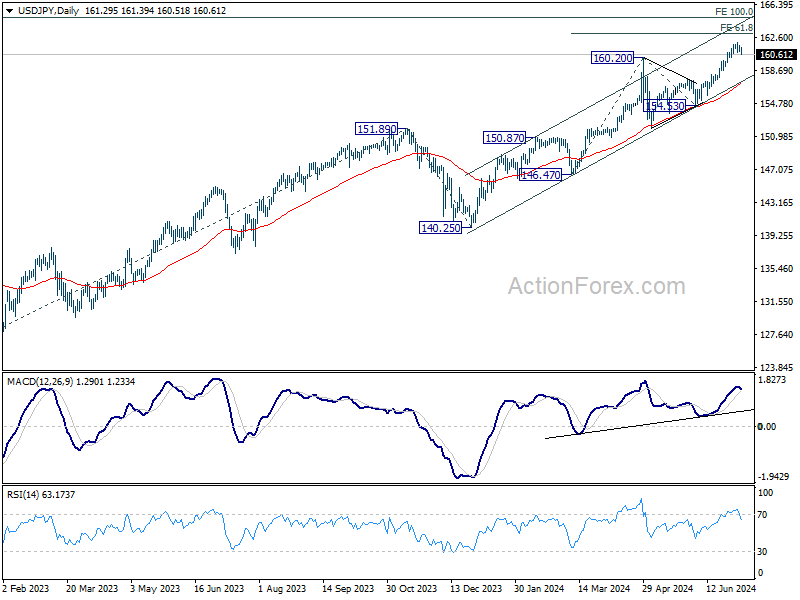
USD/JPY Daily Outlook
Daily Pivots: (S1) 160.92; (P) 161.30; (R1) 161.66; More...
Intraday bias in USD/JPY remains neutral for the moment and some more consolidations could be seen first. Further rally is expected as long as 160.25 minor support holds. Break of 161.94 will resume larger up trend to 61.8% projection of 146.47 to 160.20 from 154.53 at 163.01. Nevertheless, break of 160.25 will turn bias to the downside for deeper pullback.
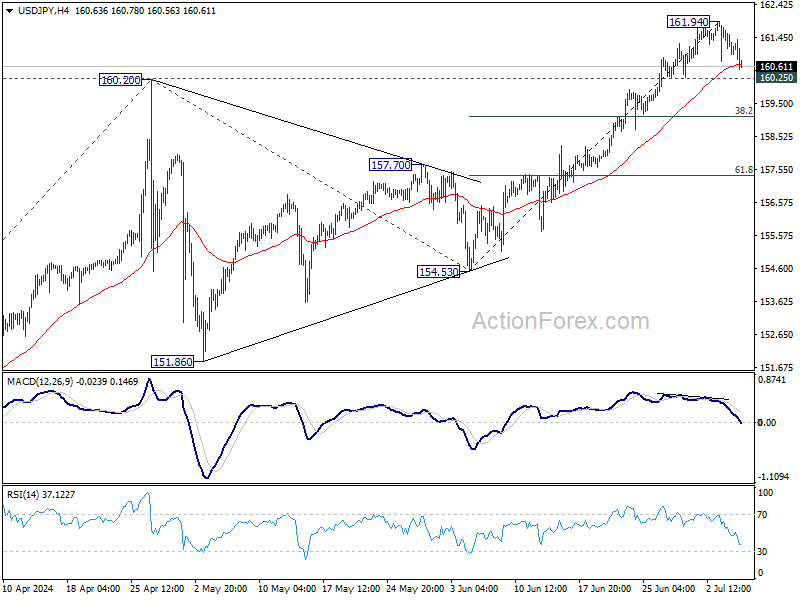
In the bigger picture, long term up trend is still in progress. Further rise is expected as long as 154.53 support holds. Next target is 100% projection of 127.20 (2023 low) to 151.89 (2023 high) from 140.25 at 164.94.
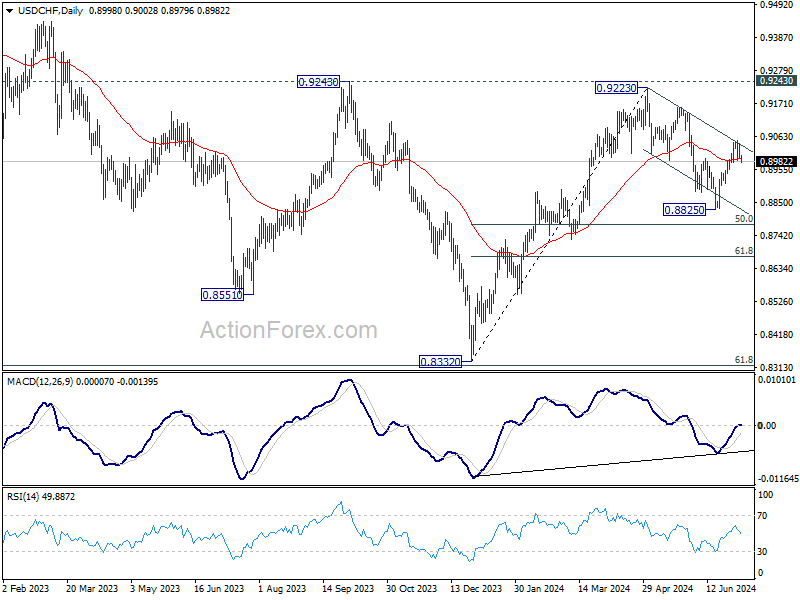
USD/CHF Daily Outlook
Daily Pivots: (S1) 0.8983; (P) 0.9012; (R1) 0.9031; More…
USD/CHF is staying consolidation below 0.9049 and intraday bias remains neutral. Further rise is mildly in favor as long as 0.8956 support holds. Above 0.9049 will affirm the case that corrective fall from 0.9223 has completed at 0.8825. Further rally would then be seen to 0.9157 resistance next. However, firm break of 0.8956 will bring retest of 0.8825 support instead.
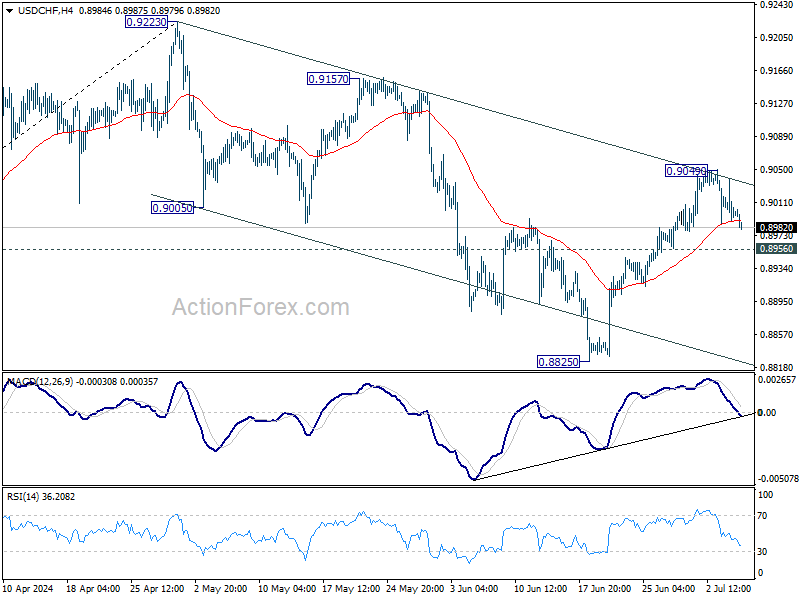
In the bigger picture, focus remains is now on 0.9223/9243 resistance zone. Decisive break there would complete a head and shoulder bottom pattern (ls: 0.8551; h: 0.8332; rs: 0.8825). That would indicate larger bullish trend reversal. Nevertheless, rejection by 0.9223/43 will keep medium term outlook neutral at best, for more range trading between 0.8332/9243 first.