

Sample Category Title
Bitcoin (BTCUSD) Found Sellers After Elliott Wave Zig Zag Pattern
Hello fellow traders. In this technical blog we’re going to take a quick look at the Elliott Wave charts of Bitcoin ( BTCUSD). As our members know, Bitcoin is correcting the cycle from the 25068 low, and we have been predicting a price decline. Recently, we observed a bounce against the June 7th peak. This recovery formed an Elliott Wave Zig Zag Pattern. In the following text, we will explain the Elliott Wave Pattern and the forecast.
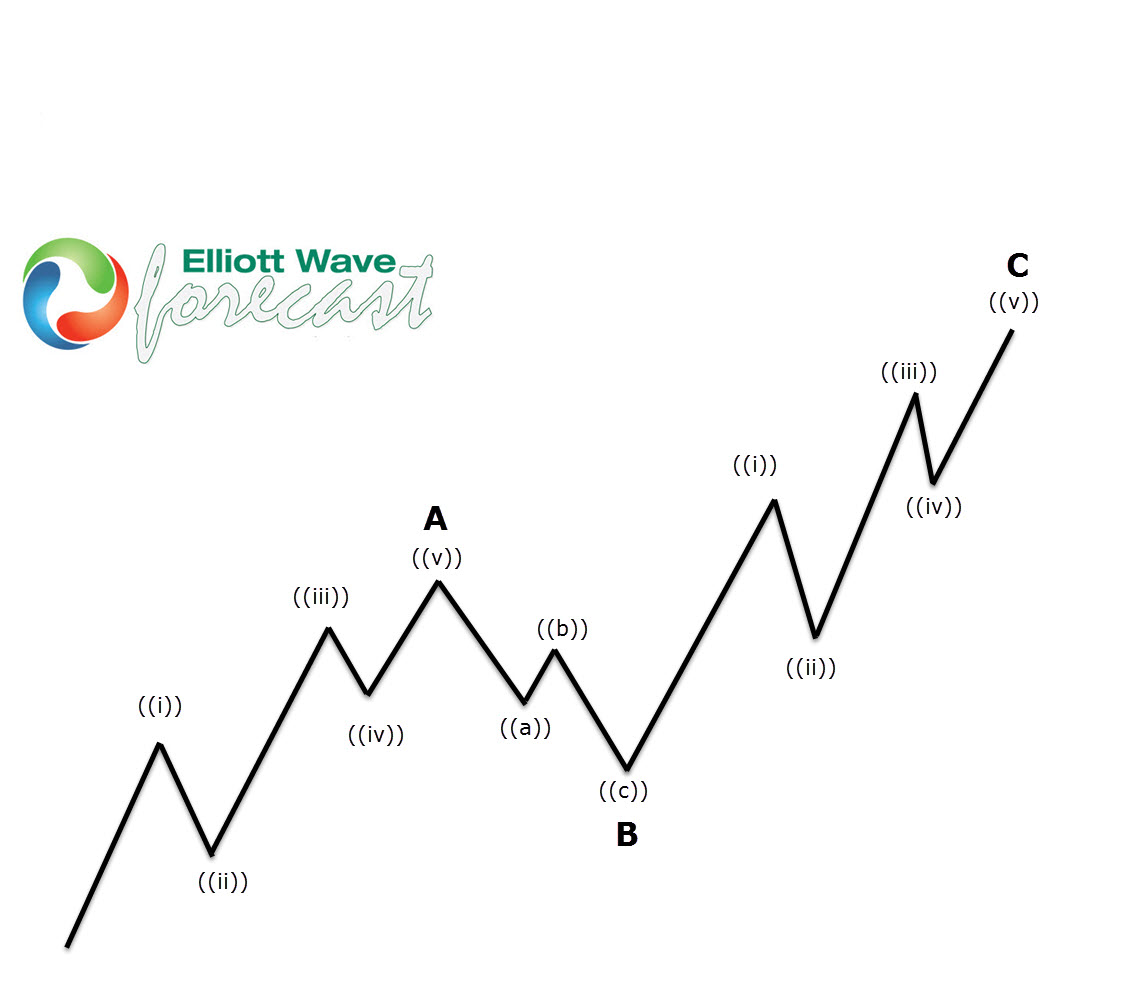
Before we take a look at the real market example, let’s explain Elliott Wave Zigzag pattern.
Elliott Wave Zigzag is the most popular corrective pattern in Elliott Wave theory . It’s made of 3 swings which have 5-3-5 inner structure. Inner swings are labeled as A,B,C where A =5 waves, B=3 waves and C=5 waves. That means A and C can be either impulsive waves or diagonals. (Leading Diagonal in case of wave A or Ending in case of wave C) . Waves A and C must meet all conditions of being 5 wave structure, such as: having RSI divergency between wave subdivisions, ideal Fibonacci extensions and ideal retracements.
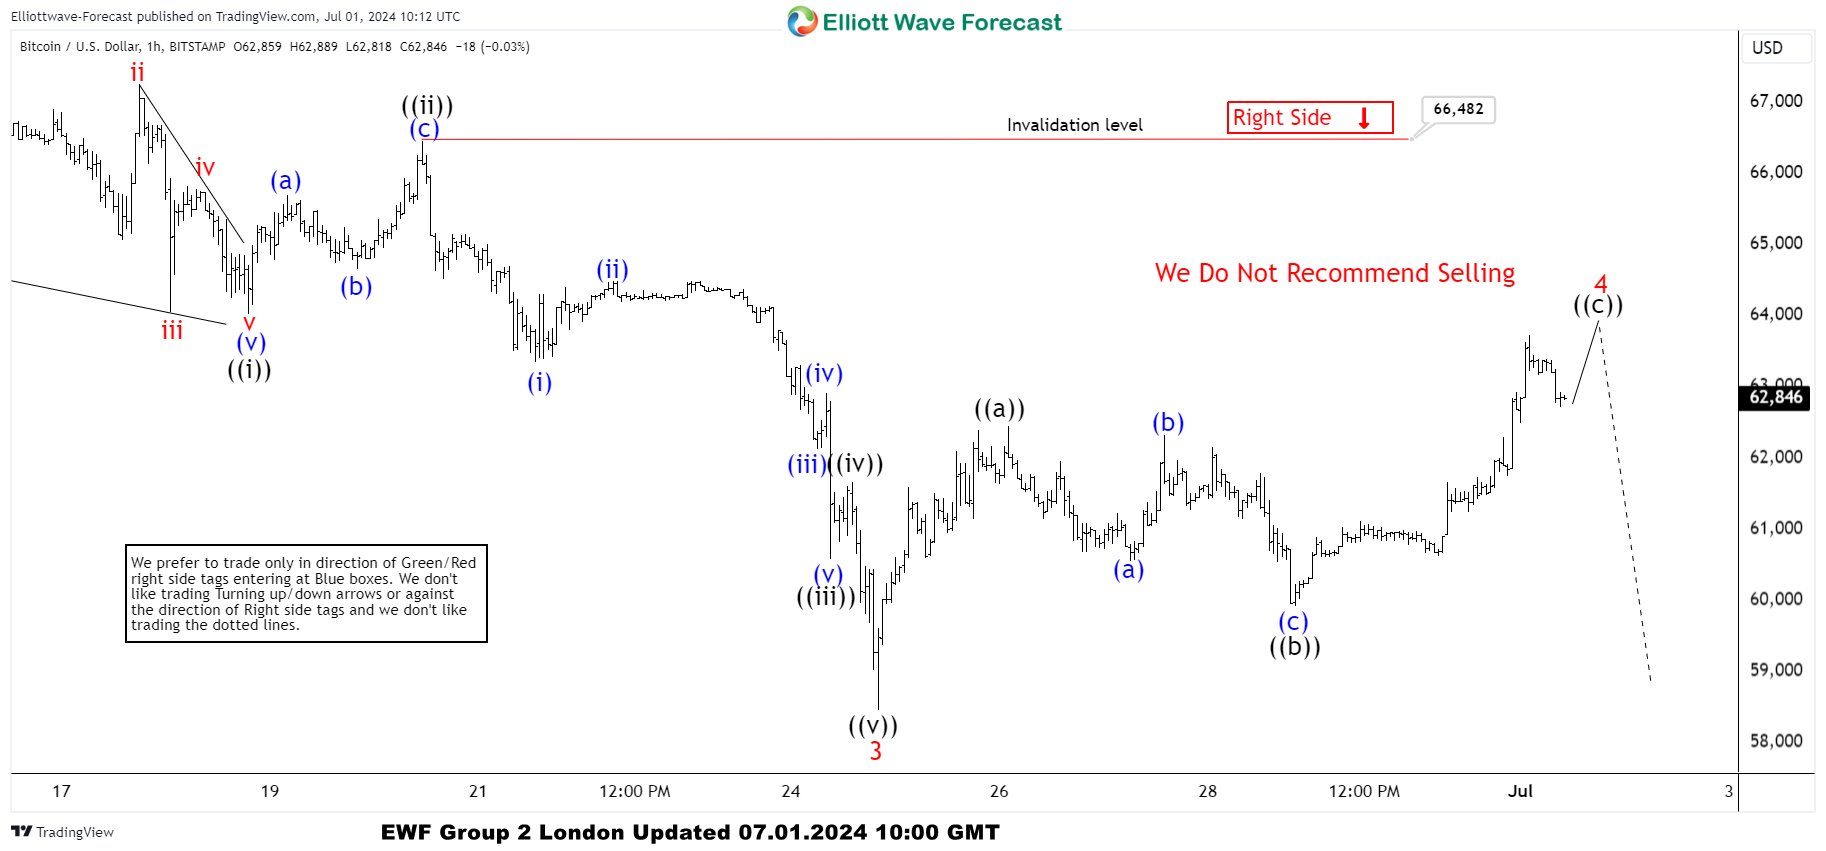
BTCUSD H1 Elliott Wave Analysis 07.01.2024
BTCUSD is showing incomplete sequences in the cycle from the 79.791 peak, suggesting we should get at least another leg down to complete 5 waves in the proposed cycle. The current view suggests Wave 4 red correction appears to be unfolding as an Elliott Wave Zig Zag pattern. The first leg ((a)) of 4 looks like a 5-wave pattern, after which we got a clear 3-wave pullback in ((b)) black. Currently, we are in the ((c)) leg, which also has the form of a 5-wave pattern. Another short-term high would be ideal to complete 5 waves within the ((c)) leg and Wave 4 red recovery as an Elliott Wave Zig Zag pattern. We don’t recommend buying the cryptocurrency at this stage and expect to see a decline toward new lows ideally.
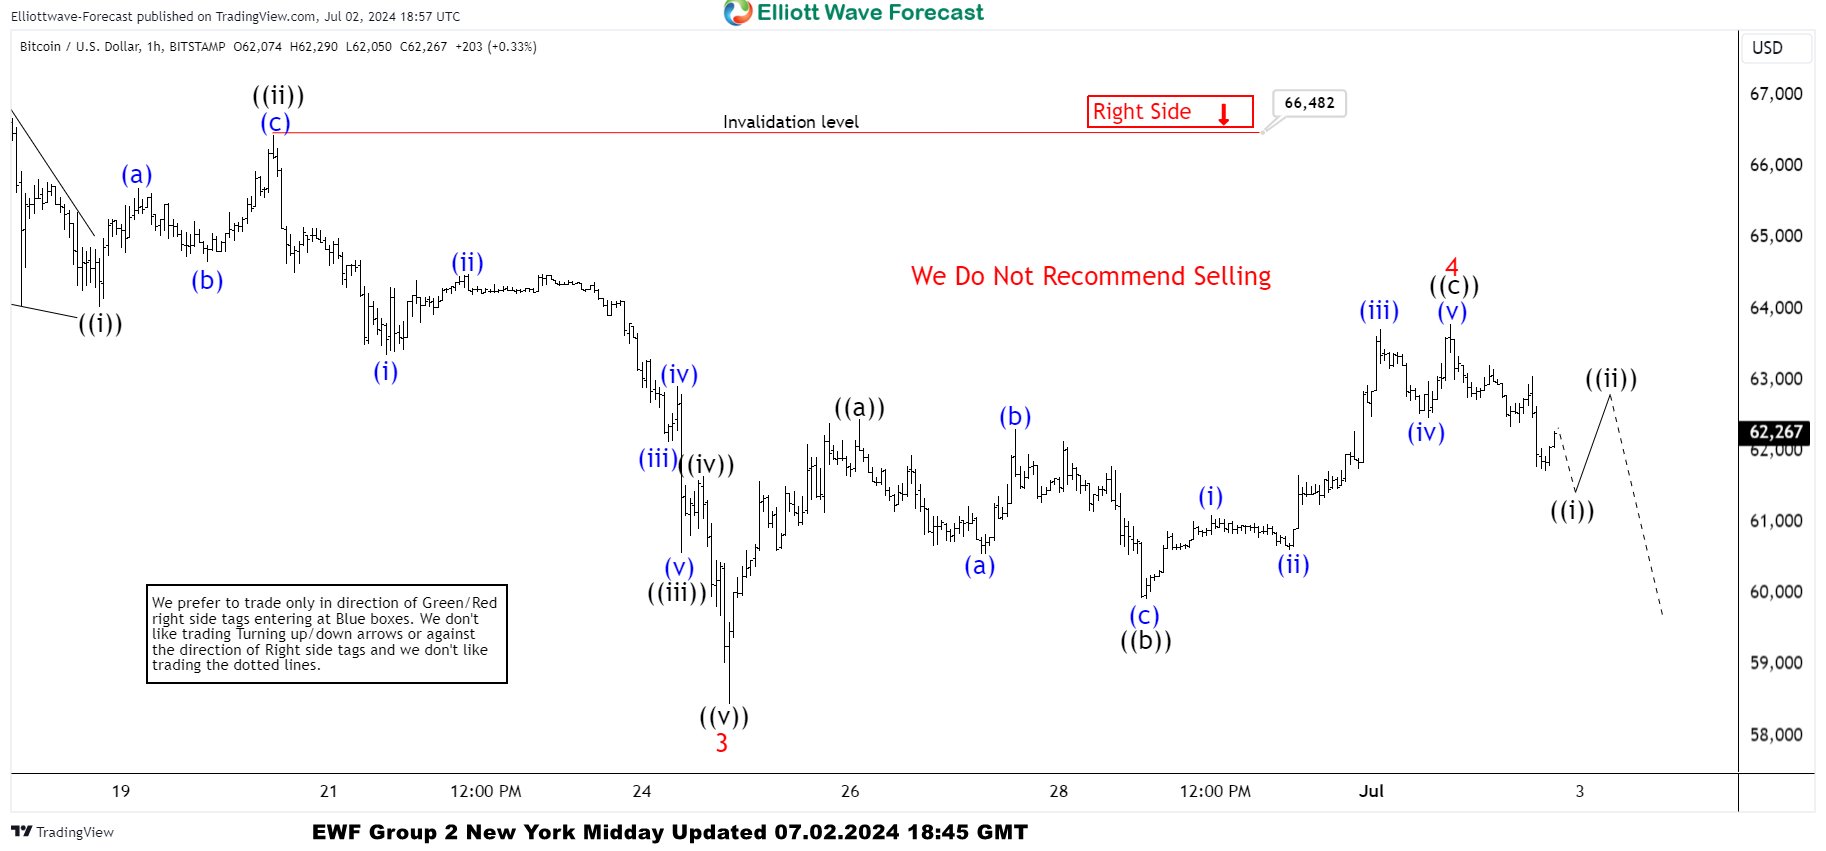
BTCUSD H1 Elliott Wave Analysis 07.02.2024
The cryptocurrency made another short-term high before declining as expected. The Wave 4 red recovery completed at the 63846 high. As long as Bitcoin remains below that peak, we expect it to continue finding sellers and extend toward new lows, targeting 57207-55166 area.
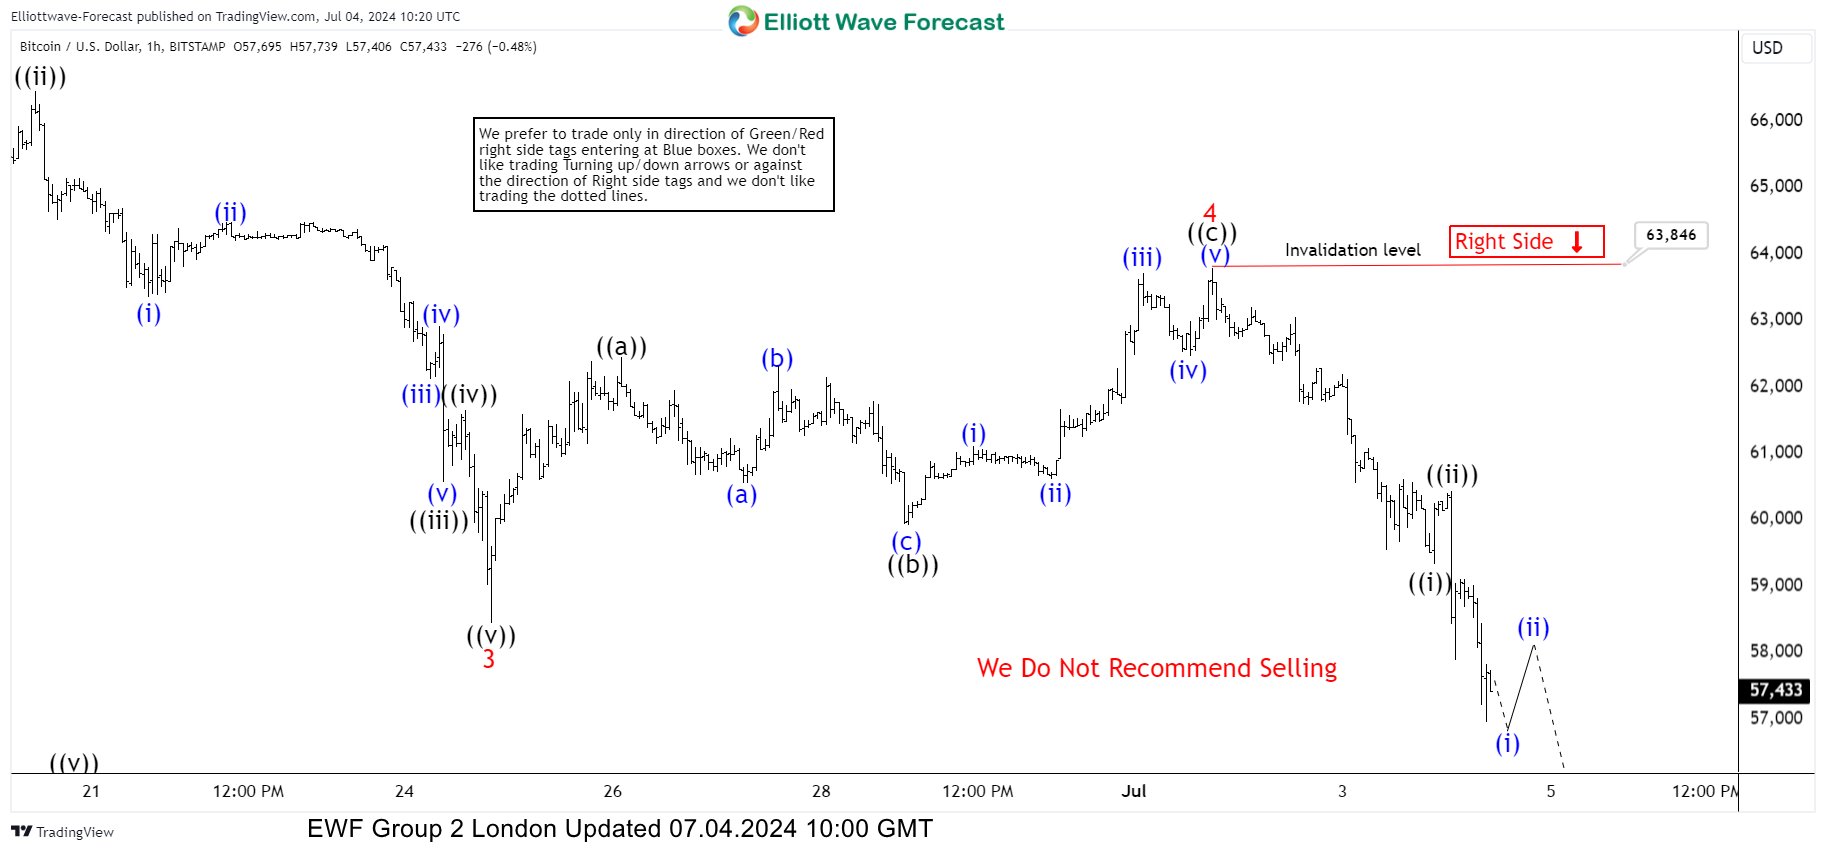
BTCUSD H1 Elliott Wave Analysis 07.04.2024
Eventually, the price made a further decline. Bitcoin broke the previous low and reached the first target area at 57207-55166 as we expected. The cryptocurrency remains bearish against the 63846 pivot.
WTI Wave Analysis
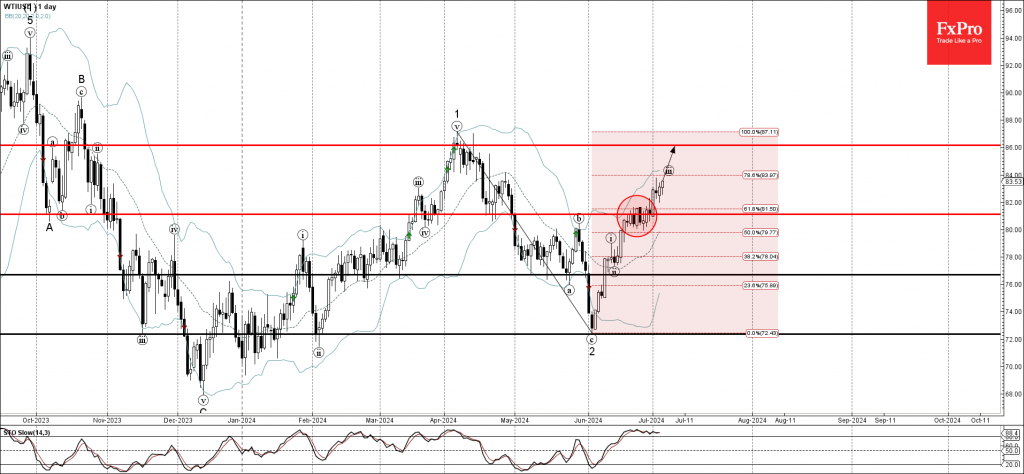
- WTI broke resistance level 81.10
- Likely to rise to resistance level 86.00
WTI crude oil recently broke the resistance level 81.10 (former top of the minor correction (b) from the end of May).
The breakout of the resistance level 81.10 coincided with the breakout of the 61.8% Fibonacci correction of the previous sharp ABC correction 2 from the start of April.
WTI crude oil can be expected to rise further toward the next resistance level 86.00, former strong resistance from April and the target price for the completion of the active impulse wave (iii).
Natural Gas Wave Analysis
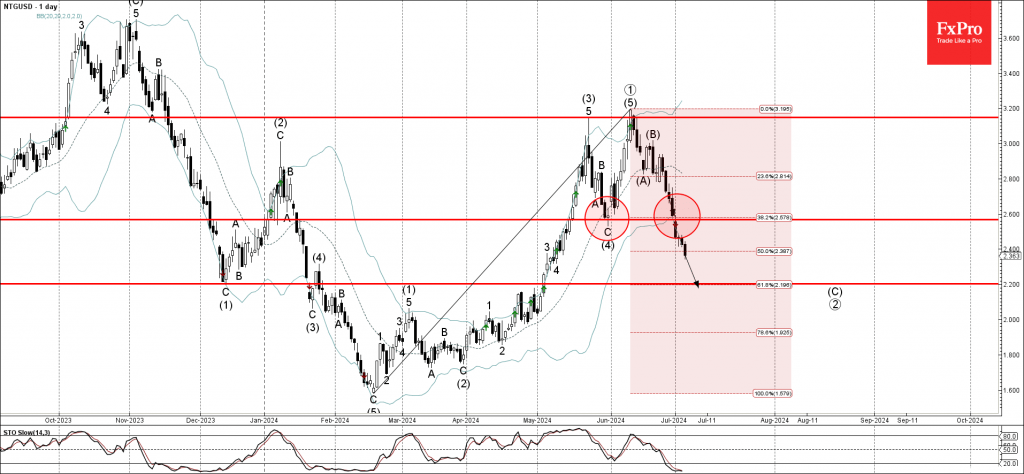
- Natural gas under the bearish pressure
- Likely to fall to support level 2.200
Natural gas is under bearish pressure after the earlier breakout of the key support level 2.600 (which stopped the previous medium-term ABC correction (4) from the end of May).
The breakout of the support level 2.600 coincided with the breakout of the 38.2% Fibonacci correction of the previous sharp upward impulse from February.
Natural gas can be expected to fall further toward the next support level 2.200, the target price for the completion of the active impulse wave (C).
USDCAD Slides Towards the Lower Bound of a Range
- USDCAD oscillates within a sideways range
- Momentum starts shifting negative
- A break below 1.3590 could turn the picture negative
- A move above 1.3750 could invite more bulls
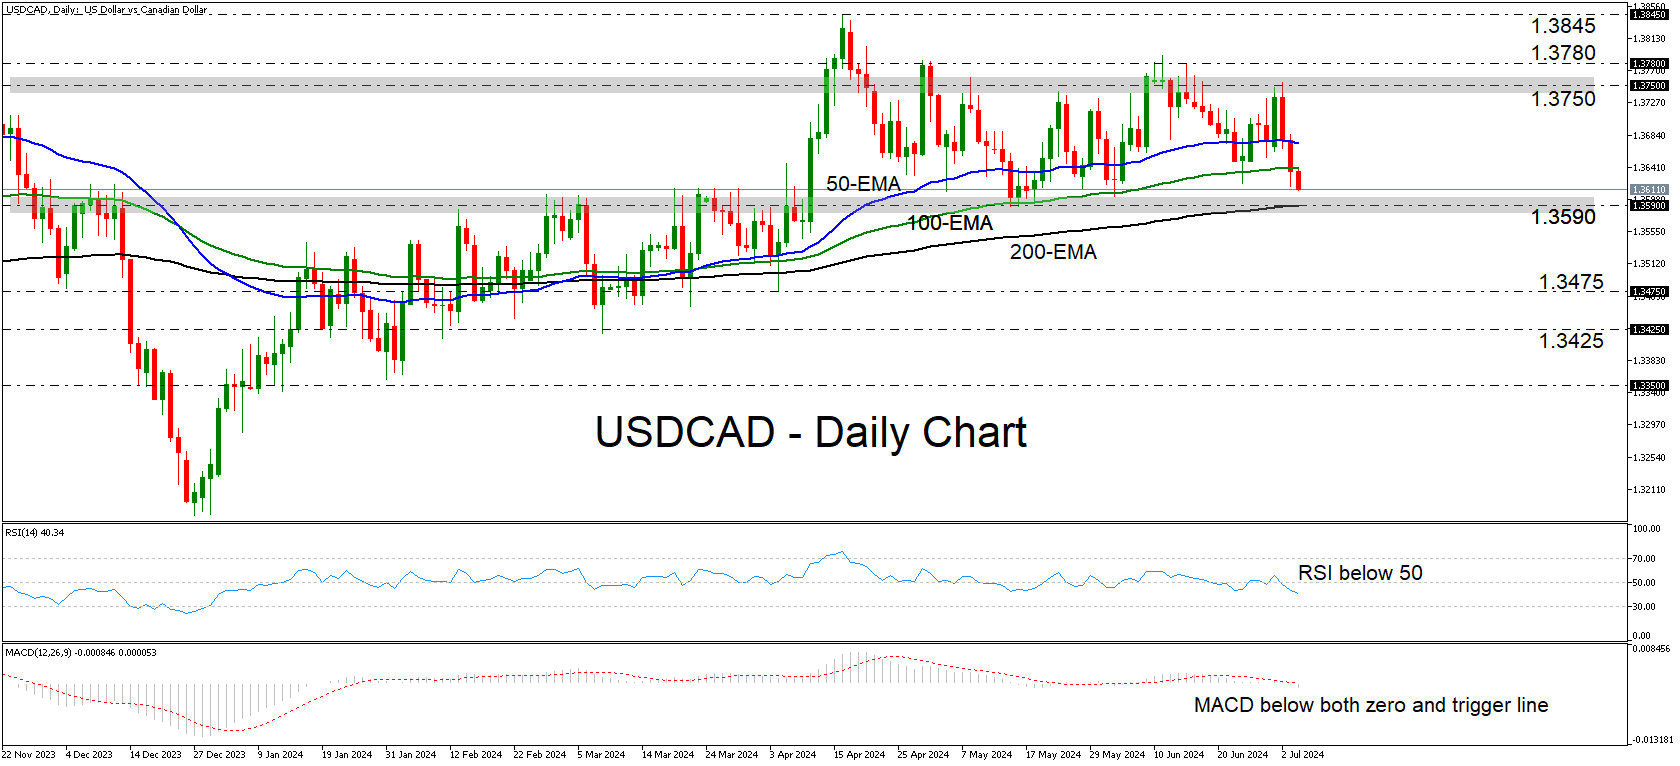
USDCAD came under selling interest this week, after hitting resistance near the 1.3750 zone, the upper bound of a sideways range, within which the pair has been mostly oscillating since April 10. The price is now approaching the lower boundary, which currently coincides with the 200-day exponential moving average (EMA).
Both the RSI and the MACD corroborate the latest bearish momentum and suggest that the declines may continue for a while longer. The RSI fell below 50 and is still pointing down, while the MACD is lying below both its trigger and zero lines.
If the bears are strong enough to overcome the lower bound of the range at around 1.3590, the slide may intensify towards the 1.3475 zone, which is marked as support by the low of April 4. The next area that could halt the slide may be at around 1.3425.
On the upside, a recovery above the upper end of the range at 1.3750 could meet immediate resistance at 1.3780. If the bulls do not stop there, then they may extend their march towards the peak of April 16 at around 1.3845.
To sum up, USDCAD is trading within a sideways range, with the price headed towards the lower bound of 1.3590. A break lower could turn the picture bearish.
Market Analysis: AUD/USD and NZD/USD Set for Steady Gains
AUD/USD is correcting gains from the 0.6735 zone. NZD/USD is showing positive signs and might attempt a fresh increase above 0.6120.
Important Takeaways for AUD USD and NZD USD Analysis Today
- The Aussie Dollar started a downside correction from 0.6735 against the US Dollar.
- There is a key bullish trend line forming with support at 0.6700 on the hourly chart of AUD/USD at FXOpen.
- NZD/USD is gaining pace above the 0.6100 support zone.
- There is a major bullish trend line forming with support at 0.6100 on the hourly chart of NZD/USD at FXOpen.
AUD/USD Technical Analysis
On the hourly chart of AUD/USD at FXOpen, the pair started a fresh increase from the 0.6635 support. The Aussie Dollar was able to clear the 0.6680 resistance to move into a positive zone against the US Dollar.
There was a close above the 0.6700 resistance and the 50-hour simple moving average. Finally, the pair tested the 0.6735 zone. A high was formed near 0.6733 and the pair is now correcting gains.
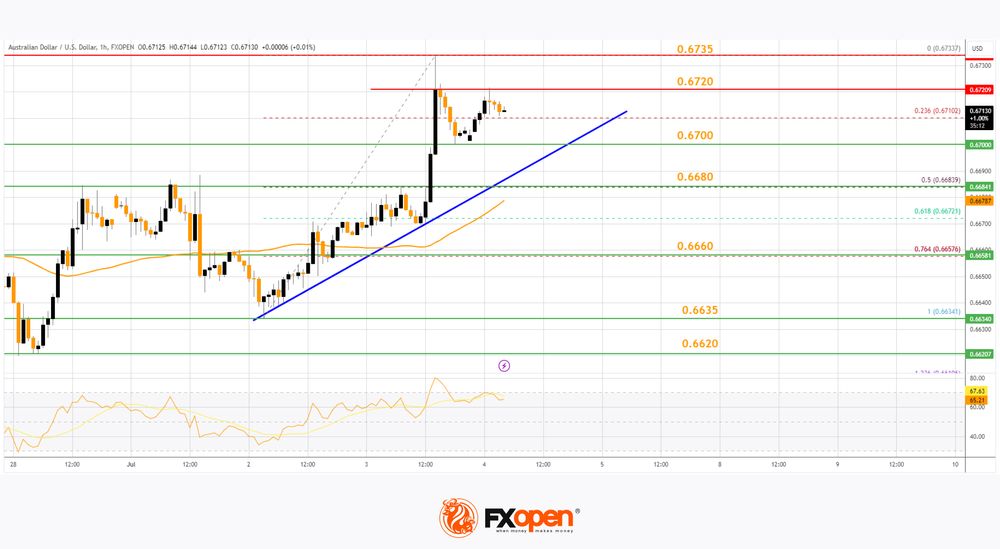
There was a move below the 0.6720 level. The pair declined below the 23.6% Fib retracement level of the upward move from the 0.6634 swing low to the 0.6733 high. On the downside, initial support is near a key bullish trend line at 0.6700.
The next major support is near the 50% Fib retracement level of the upward move from the 0.6634 swing low to the 0.6733 high at 0.6680.
If there is a downside break below the 0.6680 support, the pair could extend its decline toward the 0.6660 level. Any more losses might signal a move toward 0.6635.
On the upside, the AUD/USD chart indicates that the pair is now facing resistance near 0.6720. The first major resistance might be 0.6735. An upside break above the 0.6735 resistance might send the pair further higher.
The next major resistance is near the 0.6760 level. Any more gains could clear the path for a move toward the 0.6800 resistance zone.
Read analytical AUD/USD price forecasts for 2024 and beyond.
NZD/USD Technical Analysis
On the hourly chart of NZD/USD on FXOpen, the pair started a steady increase from the 0.6045 zone. The New Zealand Dollar broke the 0.6090 resistance to start the recent increase against the US Dollar.
The pair settled above 0.6100 and the 50-hour simple moving average. It tested the 0.6130 zone and is currently correcting gains. The pair corrected lower below the 0.6120 level. The pair also traded below the 23.6% Fib retracement level of the upward wave from the 0.6047 swing low to the 0.6128 high.
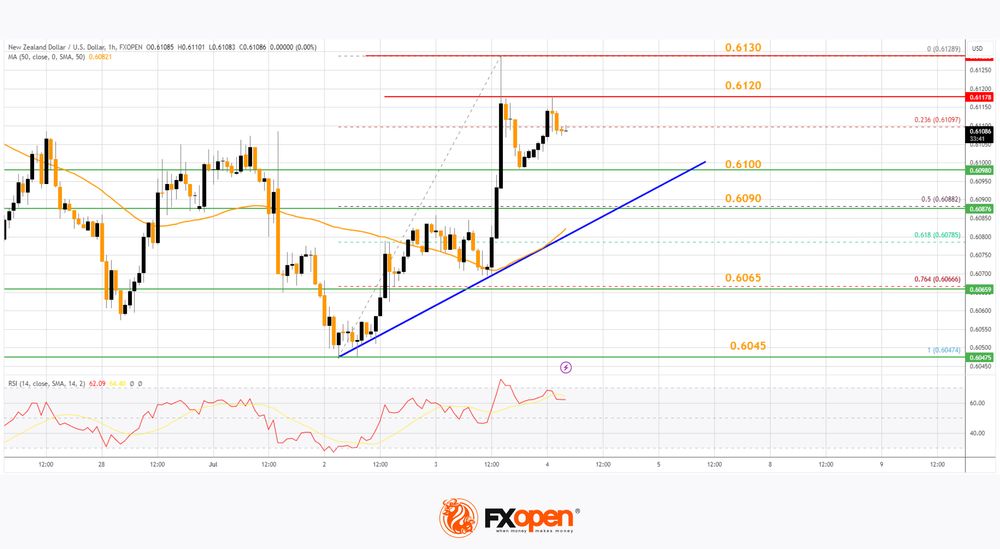
The NZD/USD chart suggests that the RSI is still above 50 and signaling more upsides. On the downside, there is major support forming near 0.6100 and a trend line.
The next major support is near the 50% Fib retracement level of the upward wave from the 0.6047 swing low to the 0.6128 high at 0.6090.
If there is a downside break below the 0.6090 support, the pair might slide toward the 0.6065 support. Any more losses could lead NZD/USD in a bearish zone to 0.6045.
On the upside, the pair might struggle near 0.6120. The next major resistance is near the 0.6130 level. A clear move above the 0.6130 level might even push the pair toward the 0.6165 level. Any more gains might clear the path for a move toward the 0.6200 resistance zone in the coming days.
Trade over 50 forex markets 24 hours a day with FXOpen. Take advantage of low commissions, deep liquidity, and spreads from 0.0 pips. Open your FXOpen account now or learn more about trading forex with FXOpen.
This article represents the opinion of the Companies operating under the FXOpen brand only. It is not to be construed as an offer, solicitation, or recommendation with respect to products and services provided by the Companies operating under the FXOpen brand, nor is it to be considered financial advice.
Crude Oil Moved Up But Looks Vulnerable
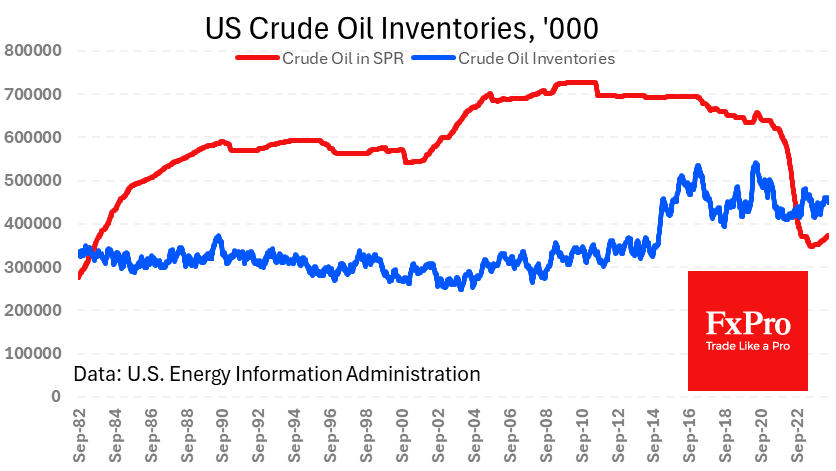
Crude oil inventories in US commercial storage fell by 12.2 million barrels last week, marking the sharpest decline since last July. The decrease is attributed to preparations for the start of the US driving season. Not only was the change significant, but it was also drastically different from the expected 0.4 million decline, prompting impulse buying in Oil.
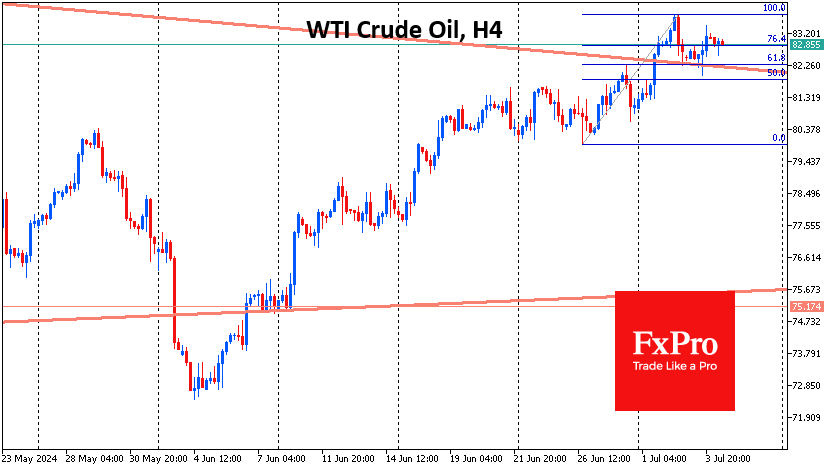
The price went from declining to rising shortly after the data release, swinging the price of a barrel of WTI from the day’s lows at $81.90 to a high at $83.40, likely halting a corrective pullback after a week of gains. Potentially, this strengthens the odds that the price will further update three-month highs in the near term, heading towards $85.
Meanwhile, there have been a few changes in the medium-term picture for Oil so far. Commercial inventories are 0.8% lower than a year ago, well within seasonal norms. Strategic inventories have changed a little, and there have been reports that the administration has been selling Oil to meet seasonal demand.
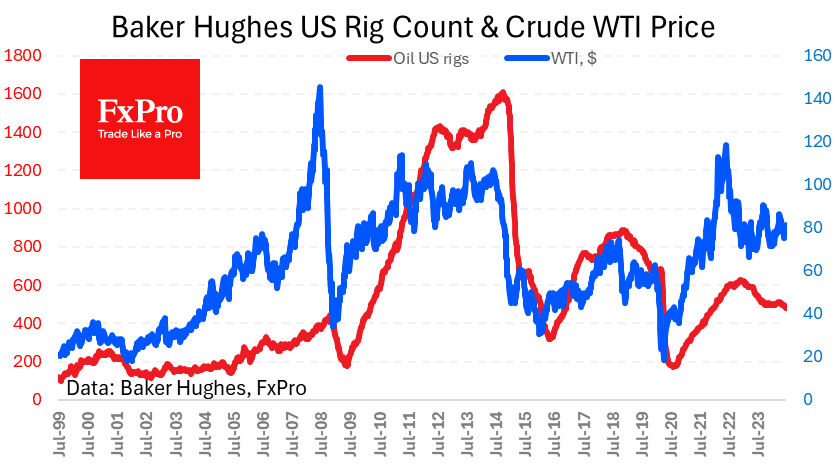
Interestingly, rising US production is not responding to the 15% month-over-month price increase or strong domestic demand. Production rates have remained at 13.2 million bpd for the past nine months.
Meanwhile, drilling activity continues to fall. The number of active oil rigs fell by 6 to 479 last week, the lowest since December 2021. Even with the expectation of improved production efficiency, there is little hope for a significant increase in the US share of global production.
On the chart, Crude price tests the upper boundary of the consolidation triangle, although it started in June with an attempt to break its lower boundary. Oil’s ability to rise above the previous highs, near $86, will confirm the consolidation break. The chances of such an outcome will increase significantly with more dovish signals from the Fed, undermining the dollar’s value.
In addition, it is worth monitoring crude oil and petrol inventories if we see the beginning of a downward trend rather than a one-off release.
History records many instances of June-July being the time when prices peaked for many months ahead. Thus, we should be very careful with Oil in the next couple of weeks, as it may be in for a serious bull-bear fight, which will determine the movement’s medium-term prospects.
Sunset Market Commentary
Markets
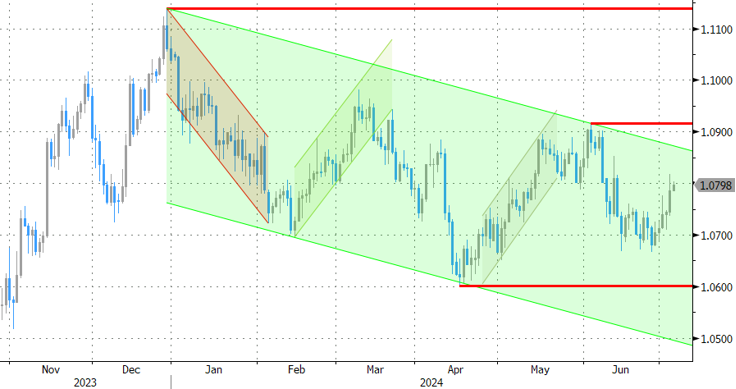
With US markets closed in observance of the 4th of July holiday; European based investors couldn’t do much but look forward and count down. Counting down to an almost certain outcome of the UK elections, to President Biden announcing to step out of the presidential race, to the second round of the French Parliamentary elections and to tomorrow’s key US payrolls report. For most of these topics investors have made up their minds. Looking backward, the ECB published the minutes of the its June 5-6 policy meeting when it decided to an inaugural rate cut even as the staff raised its 2024 and 2025 inflation projections. Most MPC members agreed that despite a bumpy road of inflation for the remainder of 2024, the bigger picture remained one of ongoing disinflation. Monetary policy was assessed to have clearly remained in restrictive territory and would continue to do so for some time even if interest rates were cut further. The ECB advocates that, at some point, it was necessary to make a judgement call based on the information available. ’Such an approach should not be seen as conflicting with data-dependence, as waiting for full confirmation would almost certainly imply cutting interest rates too late, potentially creating a significant risk of undershooting the target’. Some members were admitted to have had a dissenting view, but this apparently didn’t change to broader assessment/policy decision. Looking forward, the ECB also ‘commits’ to keep policy restrictive enough for as long as necessary to achieve its inflation target. Market/yields didn’t react to the much anticipated analysis of the ECB minutes. German yields currently rise 1 -1.5 bps across the curve. The euro also remains upwardly oriented trading near the 1.08 pivot. If anything, this has probably more to do with markets being hopeful that the outcome of the French election won’t lead to outright fiscal profligacy and as a softer than expected US payrolls report tomorrow potentially deprives the dollar some of its current interest rate support. European equities continue this week’s risk rebound (Eurostoxx 50 + 0.5%). Sterling trades in perfect calm as UK voters likely rubberstamp a highly anticipated regime change (EUR/GBP 0.8465).
News & Views
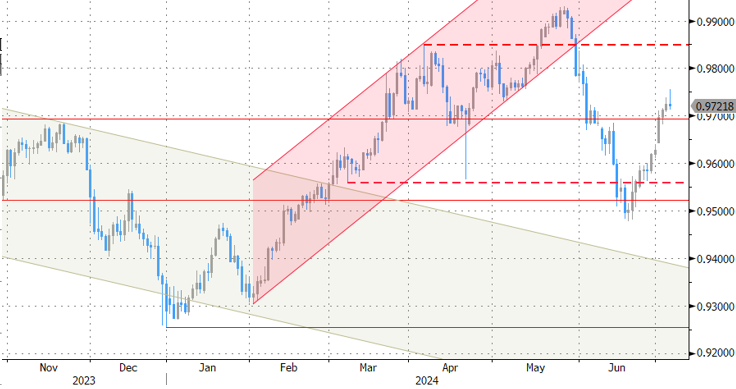
Swiss inflation unexpectedly decelerated in June. Headline prices were flat on a monthly basis, lowering the yearly figure from 1.4% to 1.3%. Core inflation eased from 1.2% to 1.3%. Prices for international package holidays and for fruiting vegetables and brassicas increased, the Swiss statistical office noted. Prices of hotel and the hire of private means of transport also increased. Declines in prices of air transport, petrol and diesel as well as clothing and footwear (seasonal sales) offset the previous increases. The Swiss National Bank earlier this month cut its policy rate by 25 bps to 1.25%. The second cut straight was at least partially inspired by the appreciation of the Swiss franc in the run-up to the meeting. EUR/CHF in the meantime recovered again to trade around 0.9712, virtually unchanged vs yesterday’s close. It’s too soon to conclude what today’s outcome means for the September SNB meeting given that there are still two CPI readings and Q2 GDP figures due. But assuming the central bank doesn’t seek an outright supportive monetary policy and the real neutral rate is about 0% or a little above (dixit SNB president Jordan), the room for further rate cuts is currently limited.
Czech retail sales came in to the weak side for the month of May. Sales (excluding motor vehicles) decreased in real terms by 0.1%, the Czech Statistical Office said. The y/y number as a result dropped from an upwardly revised 5.7% to 4.4% (5.3% expected). Non-specialised stores with food, beverages or tobacco and retail sale via mail order houses or via internet supported the year-on-year growth the most. On a monthly basis, automotive fuel and non-food goods sales fell by 0.5% m/m while food increased by 0.6%. Today’s outcome suggests some slack in consumer spending and could ease some concerns at the Czech National Bank. Policymakers are highly attentive of the impact of real household income growth recovering as inflation eases. The CNB cut rates in a 5-2 vote by 50 bps to 4.75%. It strongly hinted at a slower pace of cuts (or even a pause) in forthcoming meetings. EUR/CZK only temporarily rose (CZK weakening) in the wake of the retail sales publication. The pair is currently trading unchanged around 25.14.
Graphs
EUR/USD extends rebound as European risk is seen easing. At the same time, the dollar is vulnerable going into tomorrow’s payrolls.
EUR/CHF Swiss franc trading little changed. Softer CPI probably won’t be decisive for the SNB’s next policy step.
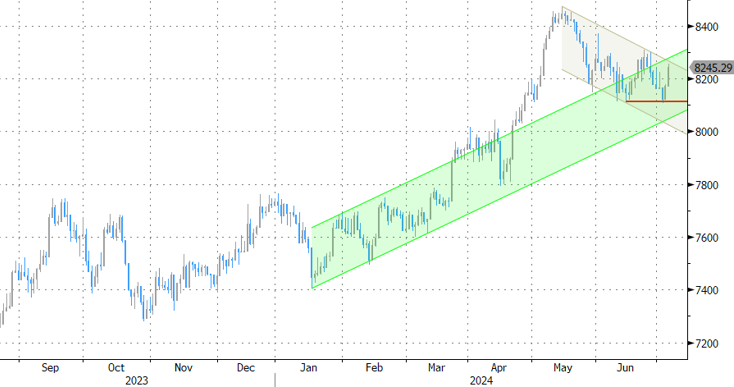
UK FTSE 100 rebounds off ST support as UK voters are rubberstamping a ’regime change”.
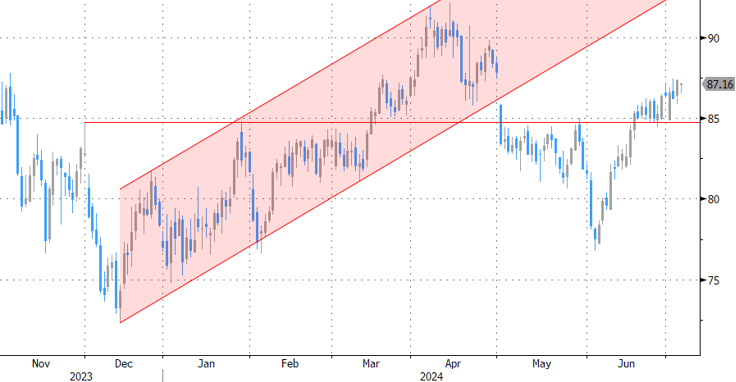
Brent crude oil: Rebound to slow as demand outlooks remains uncertain?
Dollar’s Decline Slows as Selling Momentum Eases
Dollar remains subdued today, but selling momentum has turned weak. With US markets closed for the holiday, trading activity is expected to be light. Meanwhile, traders are also gearing up for tomorrow's key US non-farm payroll data, which will be crucial. Further cooling in the job market and wage growth is needed to give Fed policymakers the confidence to start cutting interest rates in September.
Swiss Franc had a brief dip following lower-than-expected inflation data but quickly regained ground. It might be premature to determine if SNB will lower interest rates again in September. Additionally, with the French elections looming this weekend, Swiss Franc traders are likely to remain cautious as risk sentiment could flip dramatically.
For the week, Australian Dollar has overtaken Sterling and Euro as the best performer. Swiss Franc, Yen, and Dollar are continuing their positions at the bottom of the performance chart. Canadian Dollar and New Zealand Dollar hold middle positions.
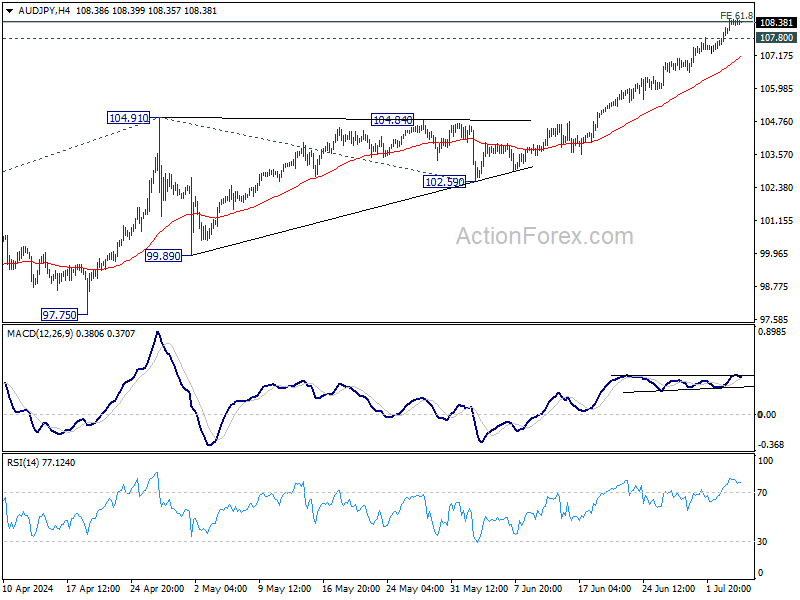
Technically, Yen pairs are showing signs of fatigue, including USD/JPY, EUR/JPY, and GBP/JPY. Yen might be entering a consolidation phase in the near term, awaiting further guidance from as traders look forward to BoJ meeting at the end of the month. A break of 107.80 minor support in AUD/JPY would indicate short-term topping, leading to deeper pullback to 55 4H EMA (now at 107.12) and possibly below.
In Europe, at the time of writing, FTSE is up 1.03%. DAX is up 0.45%. CAC is up 0.87%. UK 10-year yield is up 0.0239 at 4.200. Germany 10-year yield is up 0.010 at 2.577. Earlier in Asia, Nikkei rose 0.82%. Hong Kong HSI rose 0.28%. China Shanghai SSE fell -0.83%. Singapore Strait Times rose 0.71%. Japan 10-year JGB yield fell -0.0195 to 1.083.
ECB divided over rate cut at June meeting
Accounts from ECB's June meeting reveal that "almost all members" supported the 25bps rate cut. However, there was a significant "dissenting view", arguing that recent data and ongoing inflationary risks "did not support the case for a rate cut".
The dissenters pointed to "stickiness" in inflation and highlighted the risk that geopolitical factors could exacerbate inflation this "stickiness". They also warned that diverging from US interest rate path could "risk adding to inflationary pressures via exchange rate effects".
Looking ahead, ECB remains committed to ensuring inflation returns sustainably to the 2% medium-term target. Members emphasized maintaining a data-dependent, meeting-by-meeting approach without pre-committing to a specific rate path, allowing for full policy flexibility.
ECB's Lane Expects wage growth normalization in 2025
ECB Chief Economist Philip Lane, speaking in Italy today, expressed optimism that wage growth will normalize by 2025, based on surveys and forward-looking indicators among companies.
"The reason why we think inflation will come down next year is that this is the last year of high wages," Lane said. He highlighted that wage increases, which were around five or six percent last year, are now projected to be around three to four percent.
Lane also emphasized ECB's focus on domestic inflation, explaining, "What we can mostly influence is domestic inflation because the ability of European firms to raise prices depends on monetary conditions." He acknowledged that while domestic inflation has decreased from its peak a year ago, it remains around 4%, which continues to be a concern.
UK PMI construction falls to 52.2, slowing growth amid election uncertainty
UK PMI Construction fell to 52.2 in June, down from 54.7 in May, and below the expected 54.0. S&P Global highlighted the sharpest rise in employment in ten months, while inflationary pressures remained subdued.
Andrew Harker, Economics Director at S&P Global Market Intelligence, noted that the slowdown, particularly in housing activity, was partly due to "election uncertainty". He suggested that trends might improve once the election period ends.
Firms remain optimistic about the year-ahead outlook and increased employment significantly. Inflation pressures stayed low, encouraging firms to expand purchasing activity. Stable supply-chain conditions also supported this positive trend..
Swiss CPI slows to 1.3% yoy in Jun, vs exp 1.4% yoy
Swiss CPI rose 0.0% mom in June, below expectation of 0.1% mom. Core CPI (excluding fresh and seasonal products, energy and fuel) fell -0.1% mom. Domestic product prices rose 0.2% mom while imported products prices fell -0.5% mom.
For the 12-month period, CPI rose 1.3% yoy, slowed from prior month's 1.4% yoy, below expectation of 1.4% yoy. Core CPI slowed from 1.2% yoy to 1.2% yoy. Domestic products prices growth was unchanged at 2.0% yoy. Imported products prices fell -0.8% yoy, down from May's -0.6% yoy.
Economic Indicators Update
| GMT | Ccy | Events | Actual | Forecast | Previous | Revised |
|---|---|---|---|---|---|---|
| 01:30 | AUD | Trade Balance (AUD) May | 5.77B | 6.30B | 6.55B | 6.03B |
| 05:45 | CHF | Unemployment Rate Jun | 2.30% | 2.30% | ||
| 06:00 | EUR | Germany Factory Orders M/M May | -1.60% | 0.90% | -0.20% | -0.60% |
| 06:30 | CHF | CPI M/M Jun | 0.00% | 0.10% | 0.30% | |
| 06:30 | CHF | CPI Y/Y Jun | 1.30% | 1.40% | 1.40% | |
| 08:30 | GBP | Construction PMI Jun | 52.2 | 54.0 | 54.7 | |
| 11:30 | EUR | ECB Meeting Accounts |
ECB divided over rate cut at June meeting
Accounts from ECB's June meeting reveal that "almost all members" supported the 25bps rate cut. However, there was a significant "dissenting view", arguing that recent data and ongoing inflationary risks "did not support the case for a rate cut".
The dissenters pointed to "stickiness" in inflation and highlighted the risk that geopolitical factors could exacerbate inflation this "stickiness". They also warned that diverging from US interest rate path could "risk adding to inflationary pressures via exchange rate effects".
Looking ahead, ECB remains committed to ensuring inflation returns sustainably to the 2% medium-term target. Members emphasized maintaining a data-dependent, meeting-by-meeting approach without pre-committing to a specific rate path, allowing for full policy flexibility.