Sample Category Title
NZD/USD Continues to Climb Amidst USD Weakness
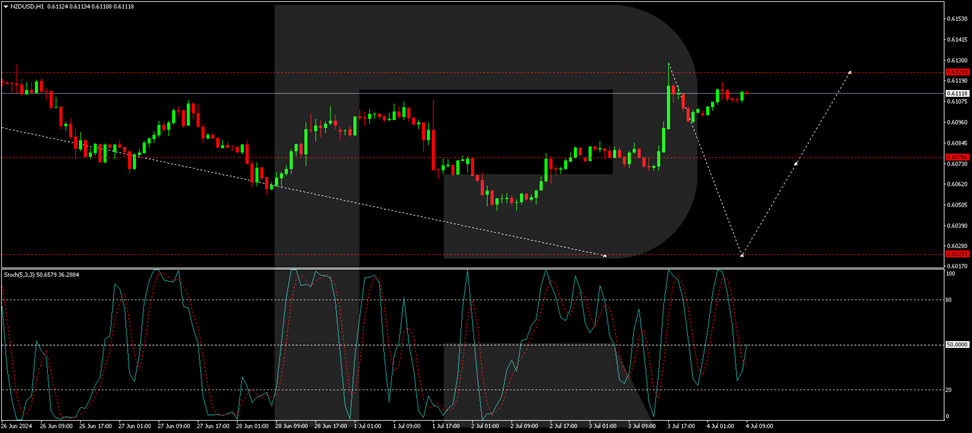
The NZD/USD pair has extended its upward movement into a third session, reaching 0.6106 amid growing weaknesses in the US dollar.
Negative shifts in US economic indicators, particularly June's disappointing private sector employment data from ADP and uncertain PMI signals, have supported the New Zealand dollar's recent gains. These factors have fuelled speculations about a possible interest rate cut by the Federal Reserve later in the year. However, such predictions should be approached cautiously, as the Fed has indicated it will only consider rate cuts after accumulating substantial supportive data.
Recent minutes from the Fed's meetings suggest that while inflation is trending towards the target, the movement is not yet pronounced enough to justify immediate rate cuts.
Looking ahead, the Reserve Bank of New Zealand (RBNZ) is expected to maintain its key rate at 5.5% during its upcoming meeting, marking the eighth consecutive hold at this level.
Technical analysis of NZD/USD
The NZD/USD pair recently completed a downtrend to 0.6048 and corrected back to 0.6128. Currently, the market is likely forming a consolidation range below this level. A breakout downwards could initiate a new decline towards 0.6022, aligning with technical indicators. The MACD supports a bearish outlook as its signal line is below zero, suggesting further declines.

On the hourly chart, after finding support at 0.6048, NZD/USD surged to 0.6077 and consolidated. Following an upward break, the pair reached 0.6128. We now anticipate the formation of a new consolidation range below this peak. Should the price break lower, we expect a return to 0.6077, potentially extending to 0.6022 if the downward momentum continues. This bearish potential is underscored by the Stochastic oscillator, poised to descend further from the 50 mark to 20.
Market outlook
Investors will closely monitor upcoming economic releases and central bank communications, particularly from the RBNZ and the Fed, which could significantly influence the trajectory of NZD/USD. The balance between local economic stability and global USD dynamics will be crucial in determining the near-term direction of the pair.
EUR/USD Outlook: Remains Constructive But Formation of Bull-Trap Warns
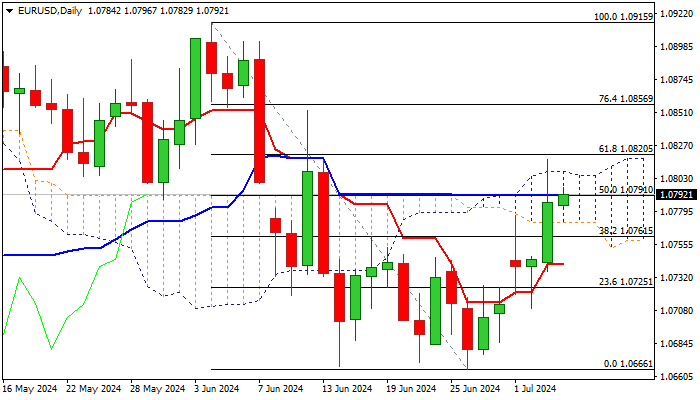
EURUSD remains at the front foot in early Thursday’s trading and holding under new three-week high (Wednesday’s spike at 1.0816).
Bulls probe again through cracked daily Kijun-sen (1.0791) and look for retest of daily cloud top (1.0808).
Cloud top was dented on Wednesday but subsequent pullback from new high and daily close well below cloud top, generate initial signal of bull-trap formation and warn of possible stall.
Adding to negative signals to the single currency was strong drop in German industrial orders in May that contributes to weak picture in manufacturing sector, which remains in contraction for two years.
Technical picture has further improved on daily chart, as positive momentum is rising and MA turned to almost full bullish setup however, sustained break above pivotal 1.0800 resistance zone (converged 100/200DMA’s / psychological / daily cloud top) is required to confirm bullish stance and signal continuation of recovery leg from 1.0666 higher base.
Otherwise, the downside is expected to remain vulnerable, despite prevailing bullish bias above cloud base (1.0771) and strong rally on Wednesday.
Loss of cloud base to generate initial negative signal, with drop below daily Tenkan-sen (1.0741), to confirm reversal and expose 1.0666 base for retest.
Markets are expected to operate with lower volumes today, as the US is shut for Independence Day, however, UK election, as top event today, may increase volatility.
Res: 1.0808; 1.0820; 1.0852; 1.0889.
Sup: 1.0771; 1.0741; 1.0723; 1.0700.
AUDUSD Challenges Upper Limit of Its Range
- AUDUSD attempts to break above sideways structure
- Oscillators are heavily tilted to the bullish side
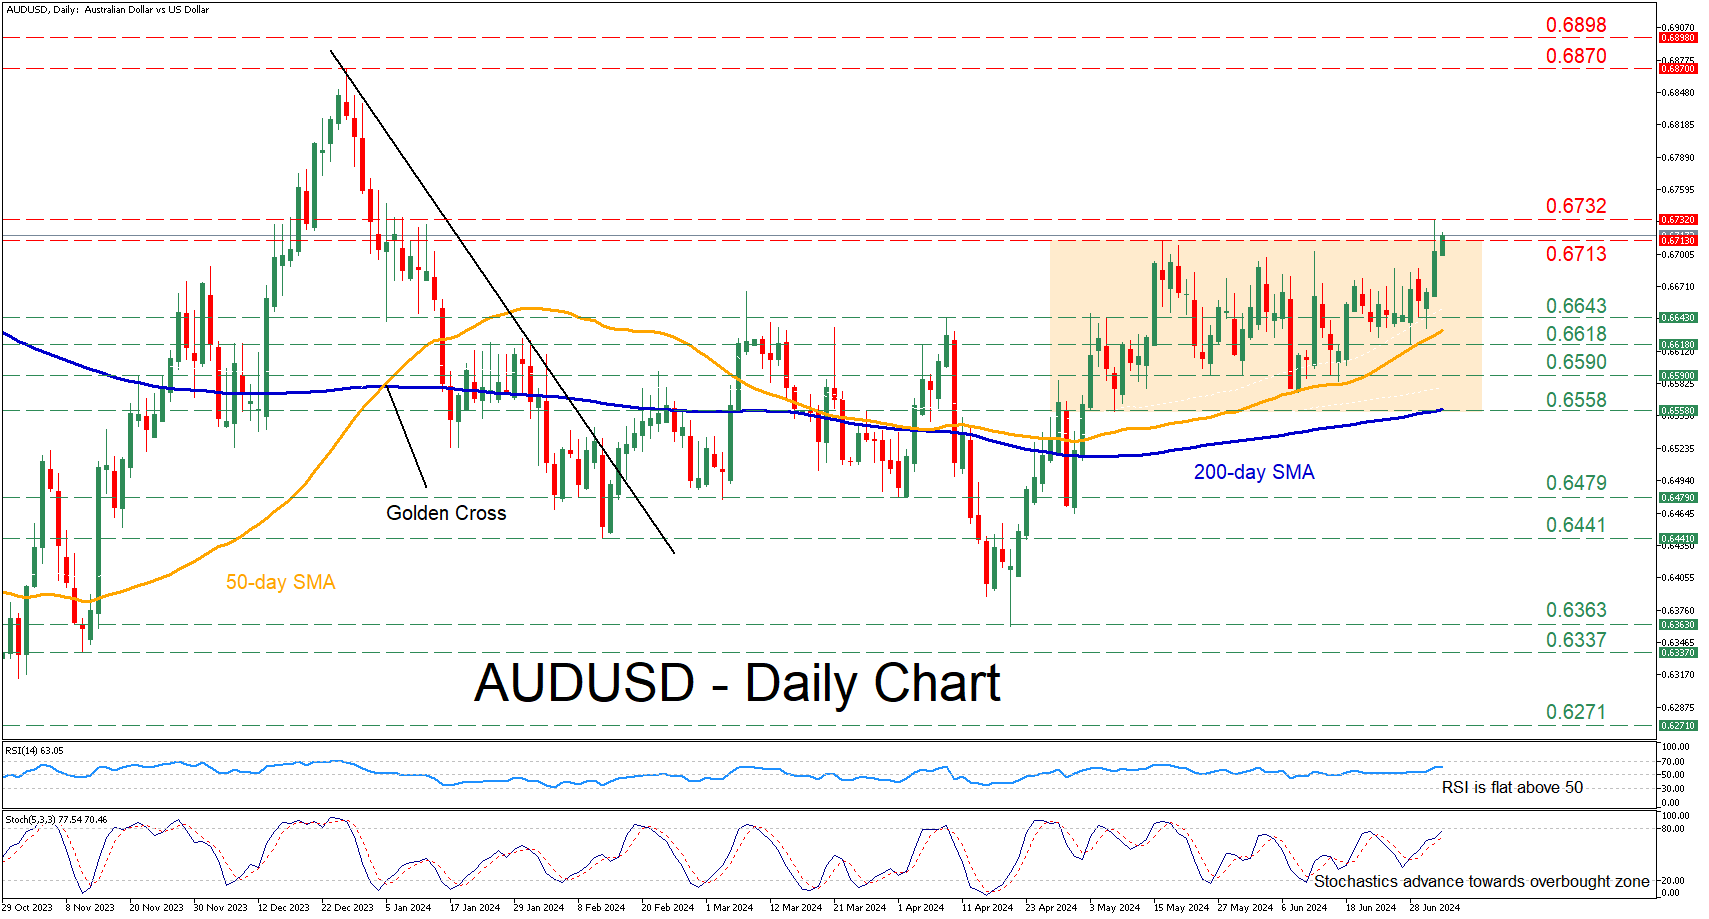
AUDUSD has been trading sideways for more than a month now, unable to adopt a clear directional impetus. However, in the last two sessions, the bulls have been testing the upper end of the neutral pattern, where a decisive break could trigger a sharp move to the upside.
If buying pressures persist and the price closes above 0.6713, the recent resistance of 0.6732 could prove to be a strong barrier for the bulls to claim. A violation of that threshold could pave the way for the December 2023 high of 0.6870. Failing to halt there, the pair may advance towards the double top region of 0.6898, registered last summer.
On the flipside, should the pair reverse lower, immediate support could be found at the April-May resistance of 0.6643 ahead of 0.6618. In case of a downside break, the bears may attack the May support of 0.6590. Further declines could then come to a halt at 0.6558, which overlaps with the 200-day simple moving average (SMA).
In brief, AUDUSD appears ready to escape its neutral structure as the upper limit has been tested in the last two sessions. Nevertheless, a repeated failure to claim this level might lead to the pair's reversal back within the short-term range.
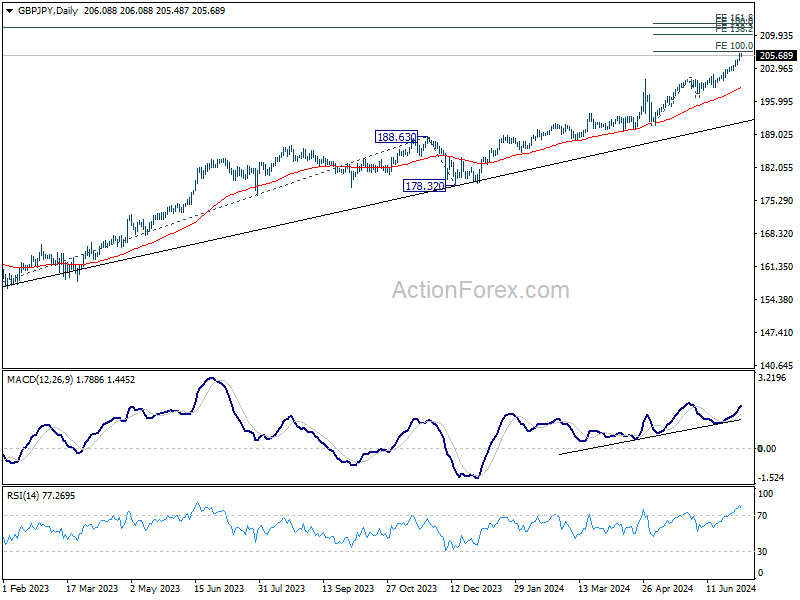
GBP/JPY Daily Outlook
Daily Pivots: (S1) 204.90; (P) 205.54; (R1) 206.68; More...
Intraday bias in GBP/JPY remains on the upside for the moment. Firm break of 100% projection of 191.34 to 200.72 from 197.18 at 206.56 will target 138.2% projection at 210.17. On the downside, below 204.71 minor support will turn intraday bias neutral and bring consolidations. But outlook will remain bullish as long as 201.59 resistance turned support holds, in case of retreat.
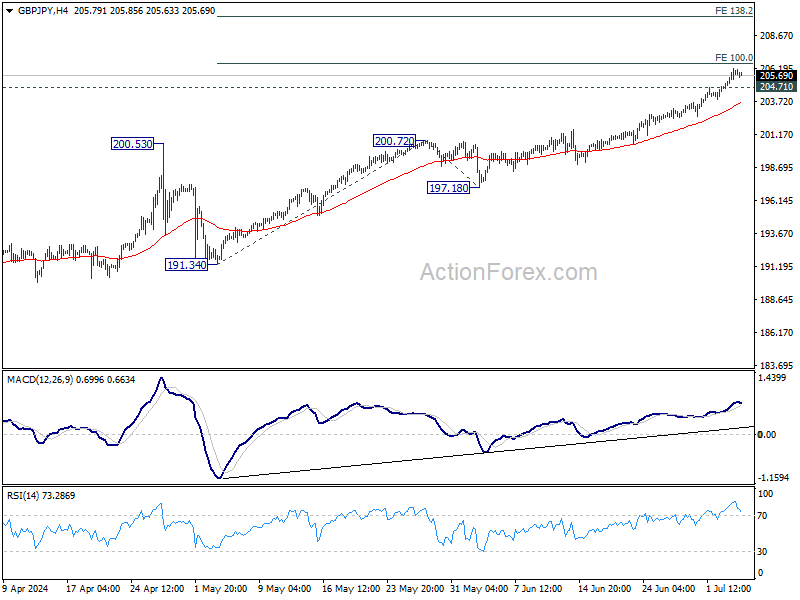
In the bigger picture, long term up trend is still in progress. Next target is 100% projection of 155.33 to 188.63 from 178.32 at 211.62. Outlook will stay bullish as long as 197.18 support holds, even in case of deep pullback.
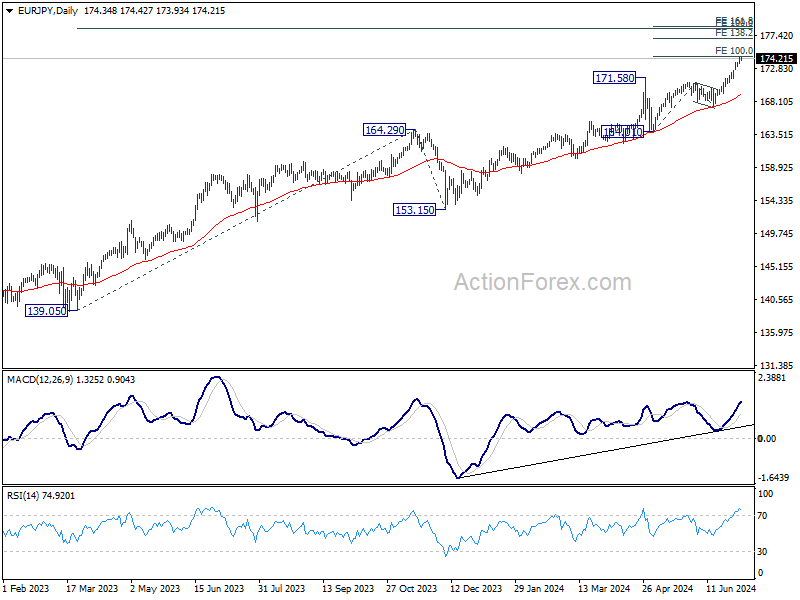
EUR/JPY Daily Outlook
Daily Pivots: (S1) 173.66; (P) 174.09; (R1) 174.87; More...
Intraday bias in EUR/JPY stays on the upside for the moment. Decisive break of 100% projection of 164.01 to 170.87 from 167.52 at 174.38 will target 138.2% projection at 177.00. On the downside, below 173.07 minor support will turn intraday bias neutral and bring consolidations first. But outlook will remain bullish as long as 170.87 resistance turned support holds.
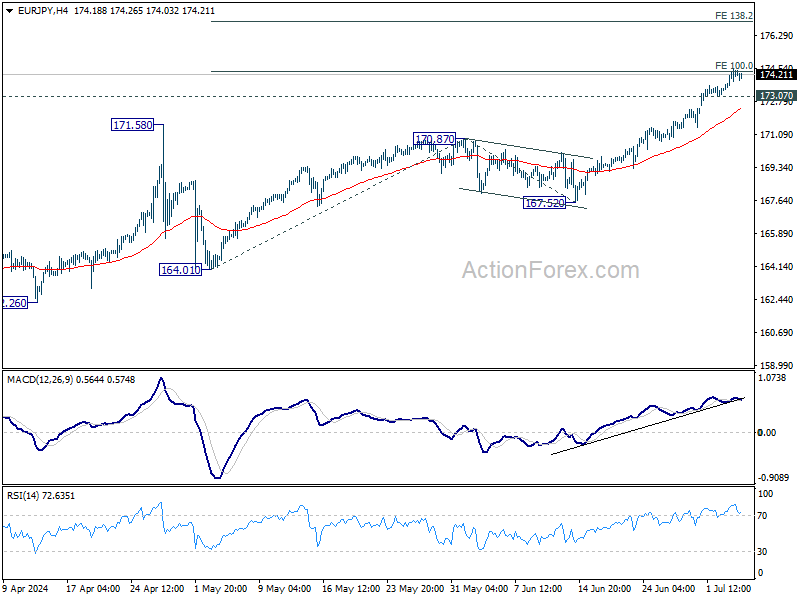
In the bigger picture, long term up trend is still in progress. Next target is 100% projection of 139.05 to 164.29 from 153.15 at 178.38. For now outlook will stay bullish as long as 167.52 support holds, even in case of deep pullback.
EUR/GBP Daily Outlook
Daily Pivots: (S1) 0.8457; (P) 0.8468; (R1) 0.8476; More...
Intraday bias in EUR/GBP remains neutral for the moment. On the upside, sustained trading above 55 D EMA (now at 0.8501) will extend the rise from 0.8396 short term bottom to 0.8529 support turned resistance. Nevertheless, On the downside, break of 0.8493 support will suggest that the corrective recovery has completed. Intraday bias will be back on the downside for retesting of 0.8396 low. Firm break there will resume larger down trend.
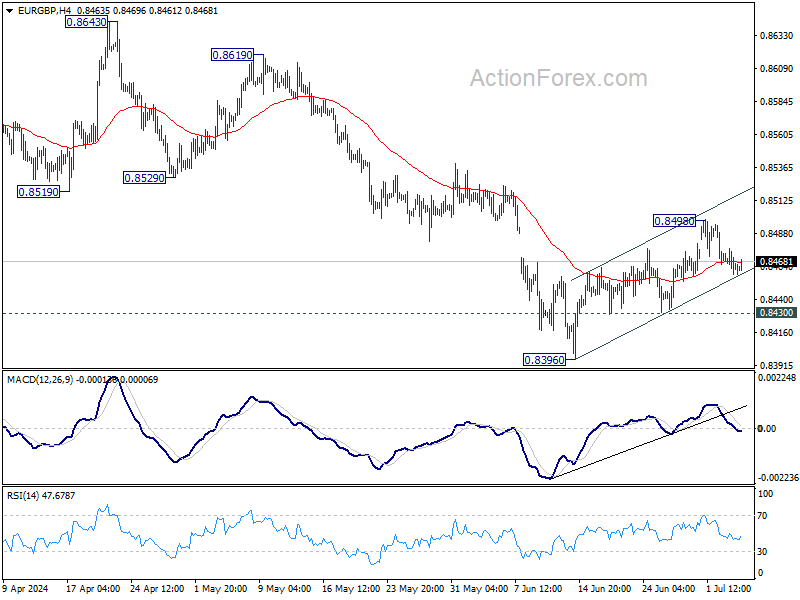
In the bigger picture, down trend from 0.9267 (2022 high) is in progress. Break of 0.8396 will target 0.8201 (2022 low). For now, outlook will remain bearish as long as 0.8643 resistance holds, even in case of stronger rebound.
EUR/AUD Daily Outlook
Daily Pivots: (S1) 1.6056; (P) 1.6096; (R1) 1.6129; More...
Intraday bias in EUR/AUD remains neutral for the moment, as consolidation from 1.5996 is extending. With 1.6211 support turned resistance intact, outlook remains bearish. On the downside, break of 1.5996 will target 100% projection of 1.6679 to 1.6211 from 1.6418 at 1.5950. Firm break there will target 1.5846 key support next.
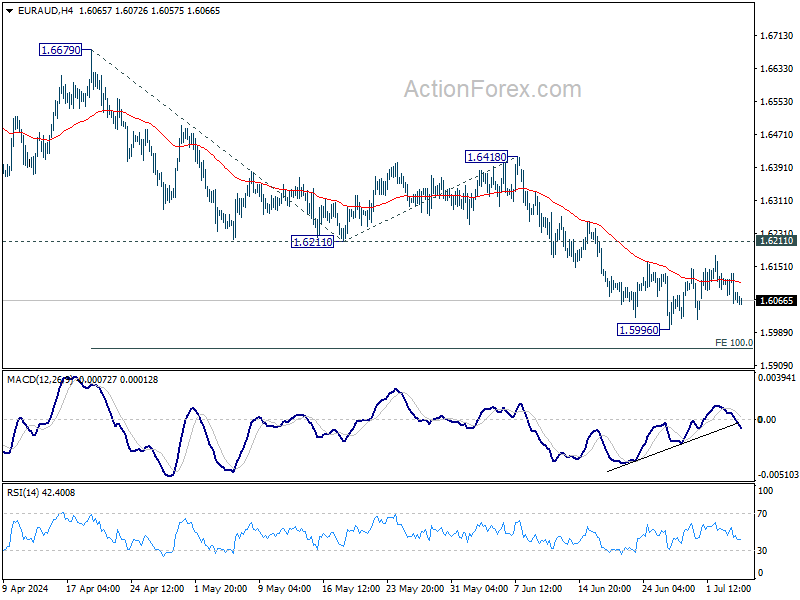
In the bigger picture, fall from 1.7062 medium term top is seen as a correction to the up trend from 1.4281 (2022 low) only. Strong support is still expected between 1.5846 and 38.2% retracement of 1.4281 to 1.7062 at 1.6000 to bring rebound. Break of 1.6148 resistance will argue that the correction has completed.
EUR/CHF Daily Outlook
Daily Pivots: (S1) 0.9707; (P) 0.9723; (R1) 0.9741; More....
EUR/CHF's rally from 0.9476 continues today and intraday bias stays on the upside. Further rally would be seen to retest 0.9928 resistance. Firm break there will resume whole rally from 0.9252. On the downside, below 0.9680 minor support will turn intraday bias neutral first.
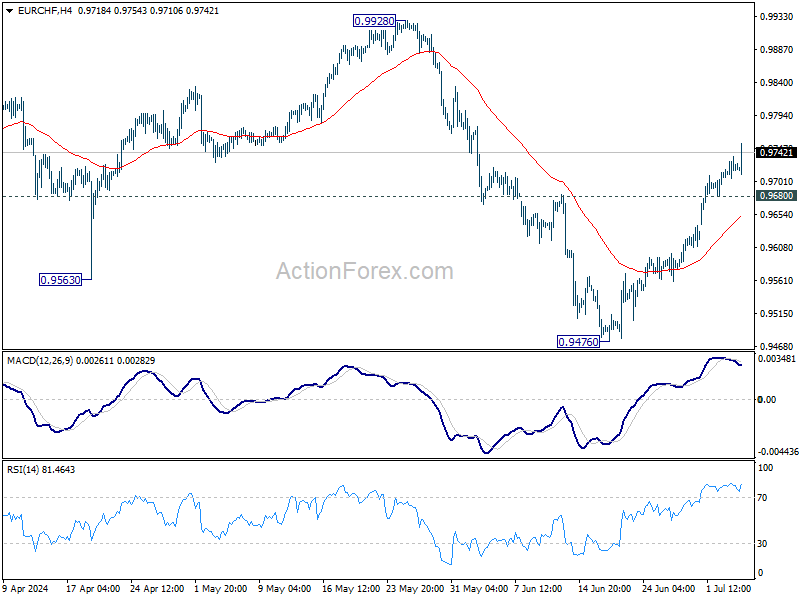
In the bigger picture, rebound from 0.9252 medium term bottom might not be completed yet. But even in case of resumption, strong resistance could emerge from 1.0095 to limit upside. Medium term outlook will be neutral at best as long as 1.0094 structural resistance holds. Meanwhile, break of 0.9476 will bring retest of 0.9252 low.
EUR/USD Daily Outlook
Daily Pivots: (S1) 1.0744; (P) 1.0781; (R1) 1.0825; More....
Intraday bias in EUR/USD remains on the upside for the moment. Pullback from 1.0915 should have completed at 1.0665. Further rally would be seen to 1.0915 resistance next. For now, risk will stay on the upside as long as 1.0709 support holds, in case of retreat.
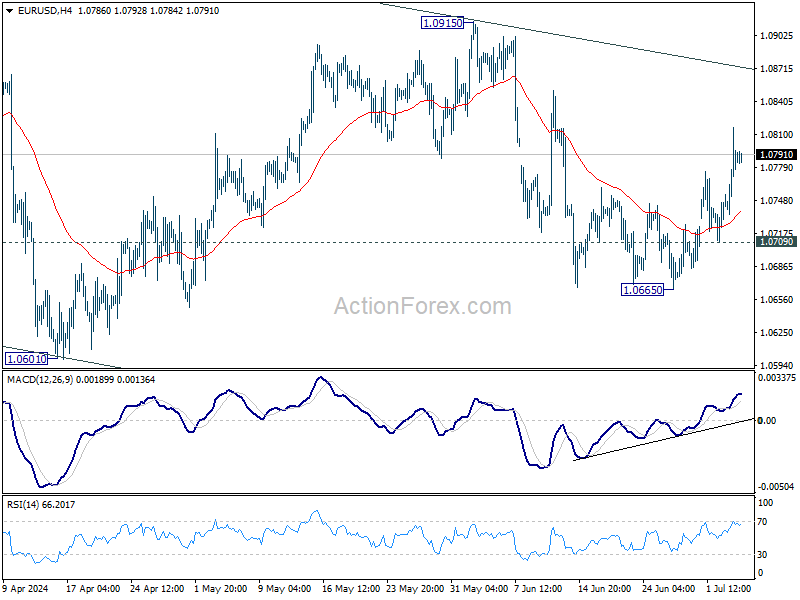
In the bigger picture, price actions from 1.1274 are viewed as a corrective pattern that's still in progress. Break of 1.0601 will target 1.0447 support and possibly below. On the upside, firm break of 1.0915 resistance will start another rising leg back to 1.1138 resistance instead.
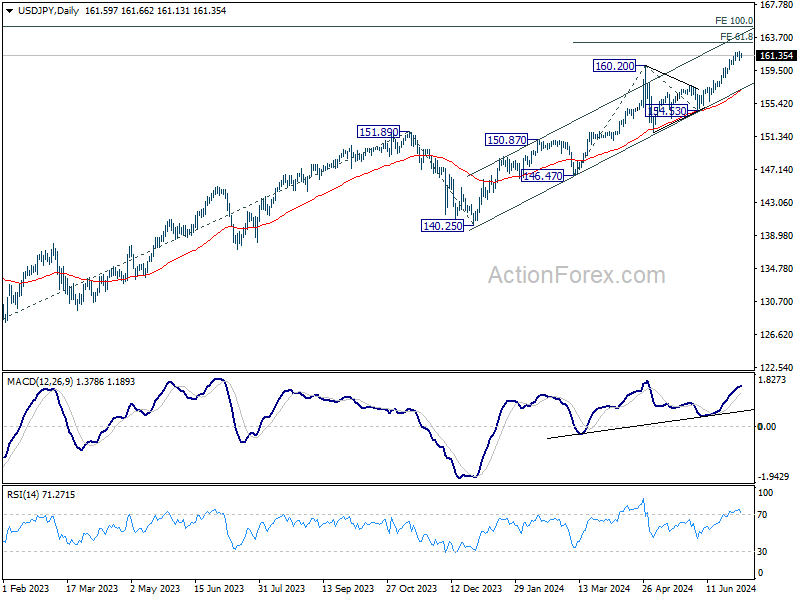
USD/JPY Daily Outlook
Daily Pivots: (S1) 161.00; (P) 161.48; (R1) 162.18; More...
Intraday bias in turned neutral with current retreat and some consolidations would be seen below 161.94 temporary top. But further rally is expected as long as 160.25 minor support holds. Break of 161.94 will resume larger up trend to 61.8% projection of 146.47 to 160.20 from 154.53 at 163.01. Nevertheless, break of 160.25 will turn bias to the downside for deeper pullback.
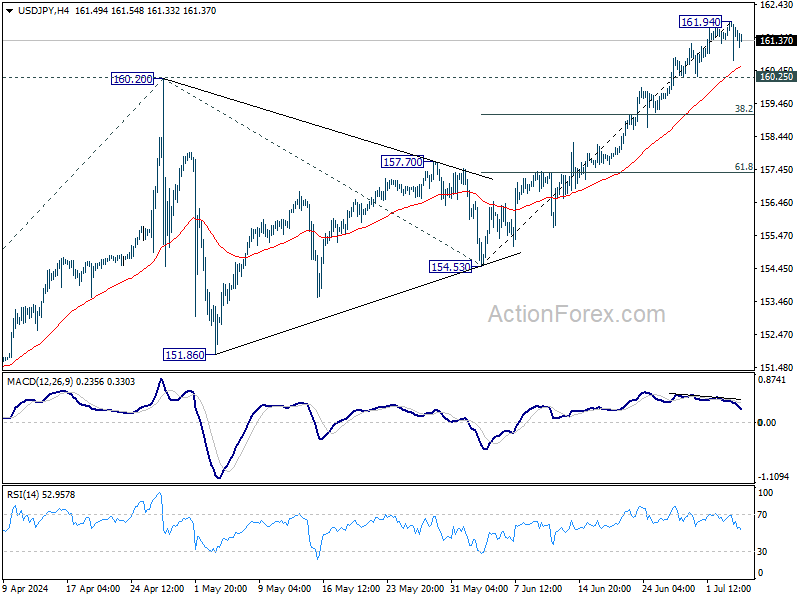
In the bigger picture, long term up trend is still in progress. Further rise is expected as long as 154.53 support holds. Next target is 100% projection of 127.20 (2023 low) to 151.89 (2023 high) from 140.25 at 164.94.