Sample Category Title
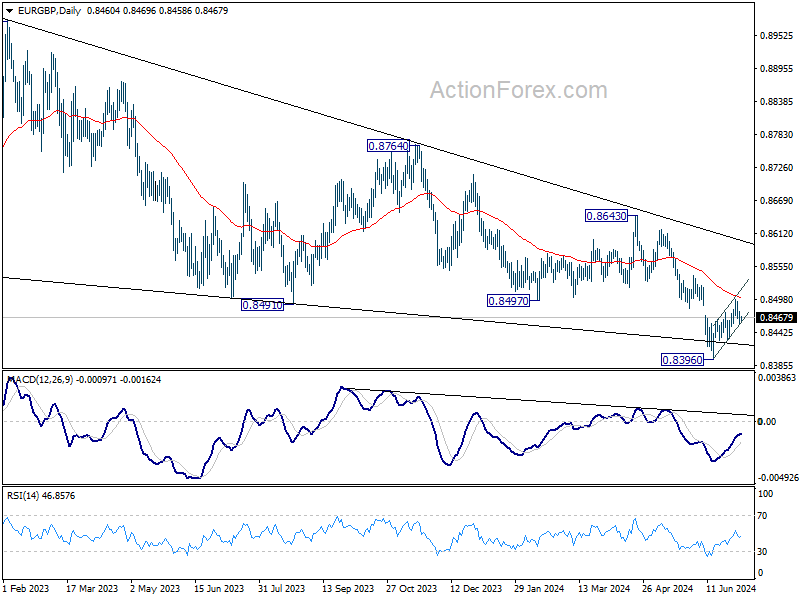
EUR/GBP Daily Outlook
Daily Pivots: (S1) 0.8457; (P) 0.8468; (R1) 0.8476; More...
Intraday bias in EUR/GBP remains neutral for the moment. On the upside, sustained trading above 55 D EMA (now at 0.8501) will extend the rise from 0.8396 short term bottom to 0.8529 support turned resistance. Nevertheless, On the downside, break of 0.8493 support will suggest that the corrective recovery has completed. Intraday bias will be back on the downside for retesting of 0.8396 low. Firm break there will resume larger down trend.
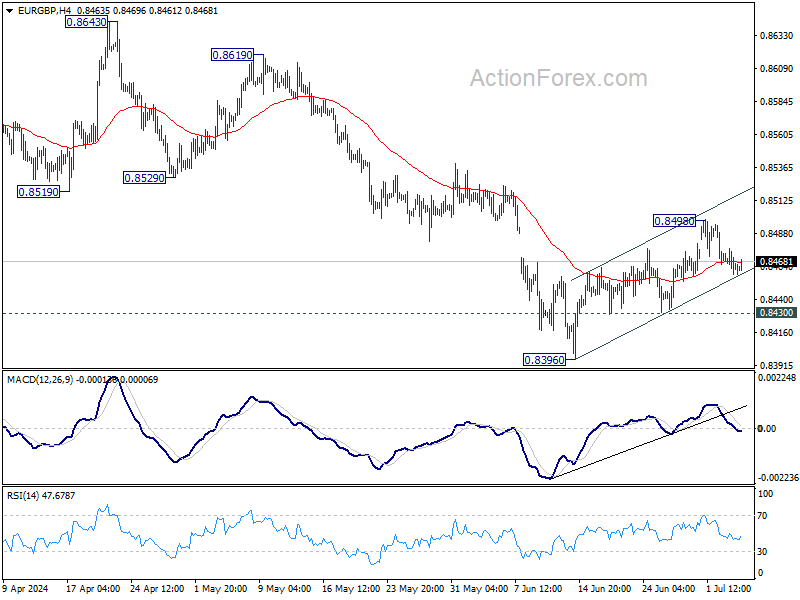
In the bigger picture, down trend from 0.9267 (2022 high) is in progress. Break of 0.8396 will target 0.8201 (2022 low). For now, outlook will remain bearish as long as 0.8643 resistance holds, even in case of stronger rebound.
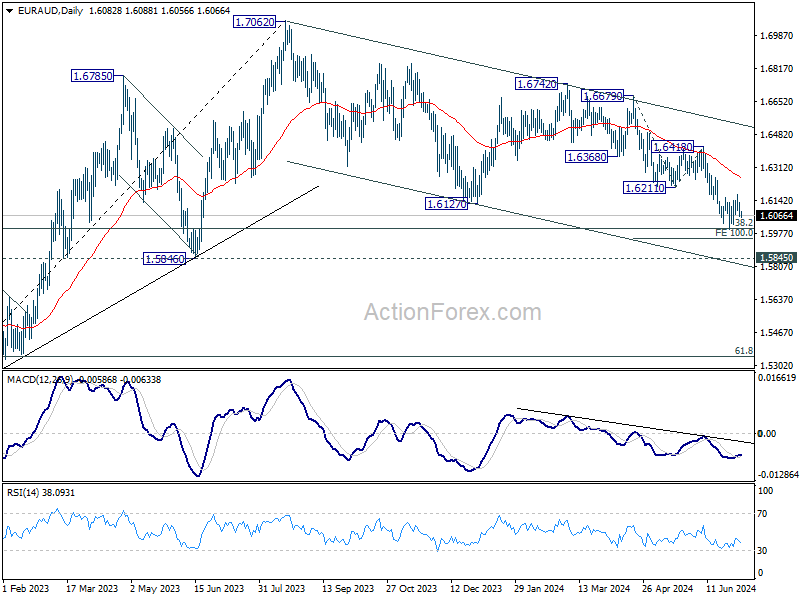
EUR/AUD Daily Outlook
Daily Pivots: (S1) 1.6056; (P) 1.6096; (R1) 1.6129; More...
Intraday bias in EUR/AUD remains neutral for the moment, as consolidation from 1.5996 is extending. With 1.6211 support turned resistance intact, outlook remains bearish. On the downside, break of 1.5996 will target 100% projection of 1.6679 to 1.6211 from 1.6418 at 1.5950. Firm break there will target 1.5846 key support next.
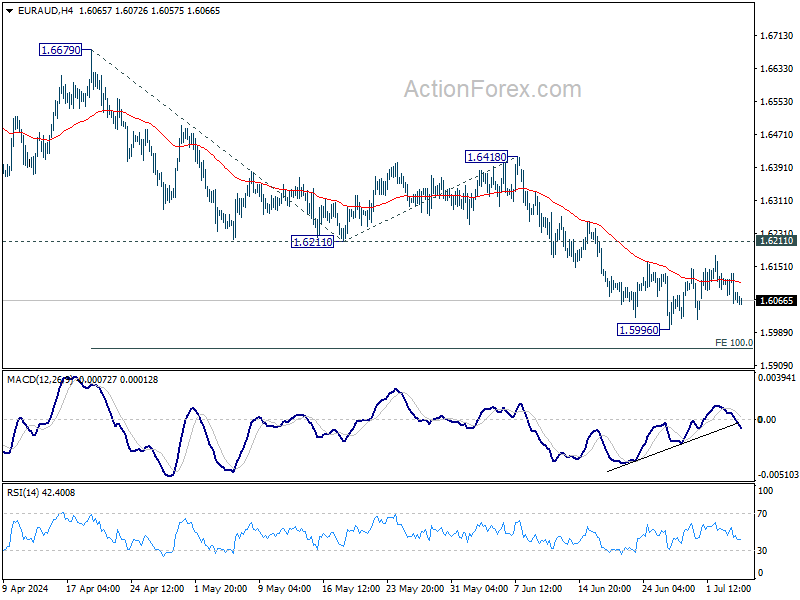
In the bigger picture, fall from 1.7062 medium term top is seen as a correction to the up trend from 1.4281 (2022 low) only. Strong support is still expected between 1.5846 and 38.2% retracement of 1.4281 to 1.7062 at 1.6000 to bring rebound. Break of 1.6148 resistance will argue that the correction has completed.
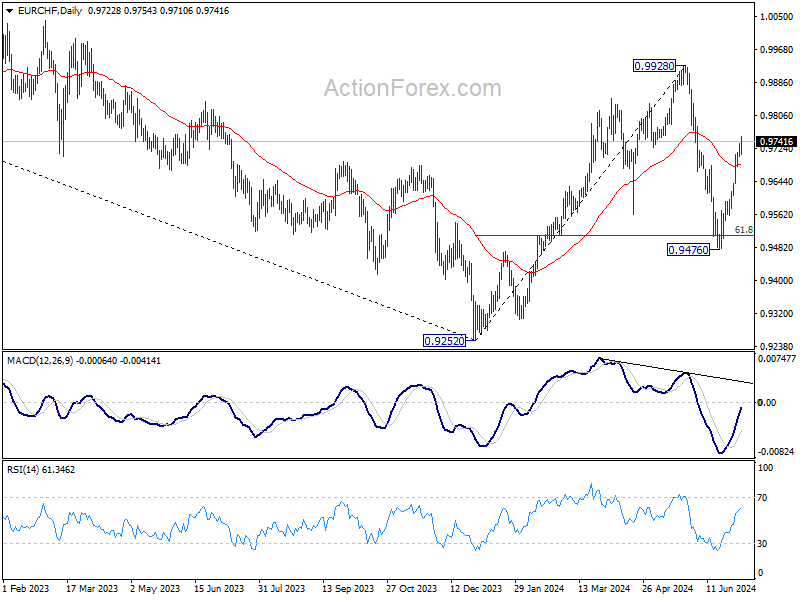
EUR/CHF Daily Outlook
Daily Pivots: (S1) 0.9707; (P) 0.9723; (R1) 0.9741; More....
EUR/CHF's rally from 0.9476 continues today and intraday bias stays on the upside. Further rally would be seen to retest 0.9928 resistance. Firm break there will resume whole rally from 0.9252. On the downside, below 0.9680 minor support will turn intraday bias neutral first.
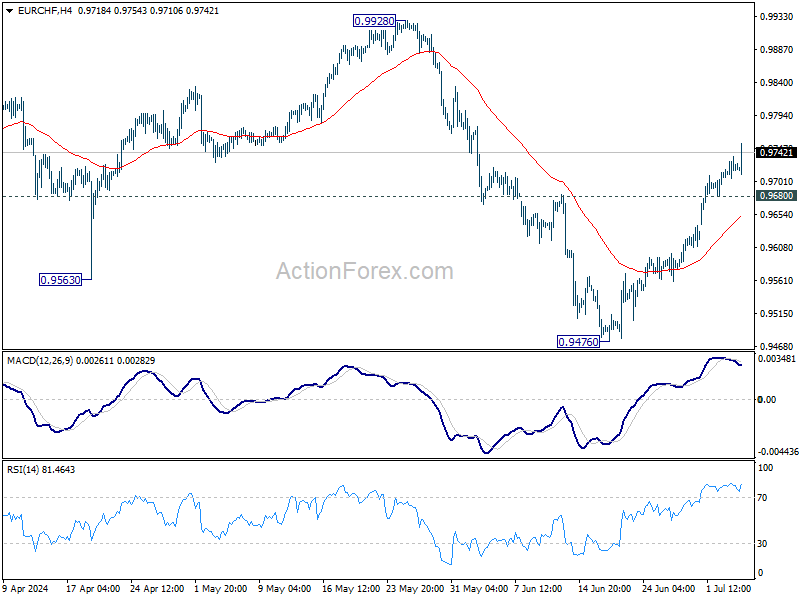
In the bigger picture, rebound from 0.9252 medium term bottom might not be completed yet. But even in case of resumption, strong resistance could emerge from 1.0095 to limit upside. Medium term outlook will be neutral at best as long as 1.0094 structural resistance holds. Meanwhile, break of 0.9476 will bring retest of 0.9252 low.
EUR/USD Daily Outlook
Daily Pivots: (S1) 1.0744; (P) 1.0781; (R1) 1.0825; More....
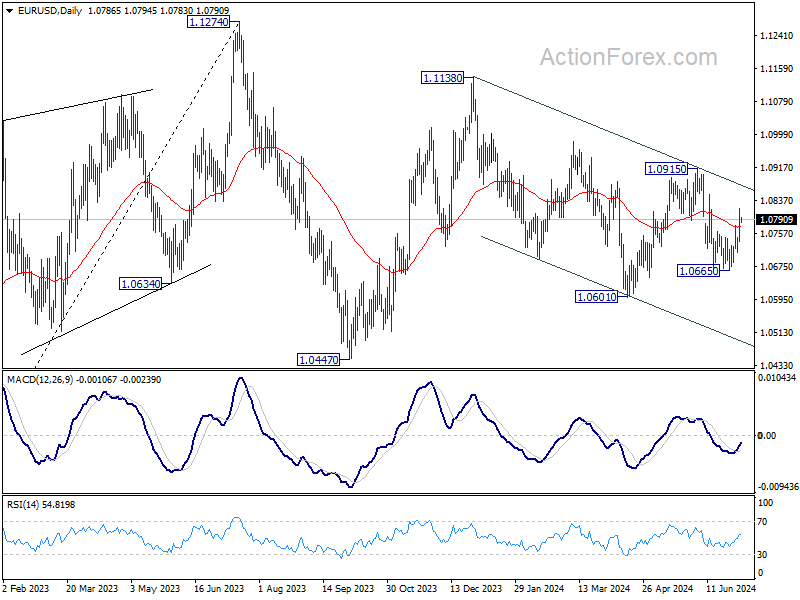
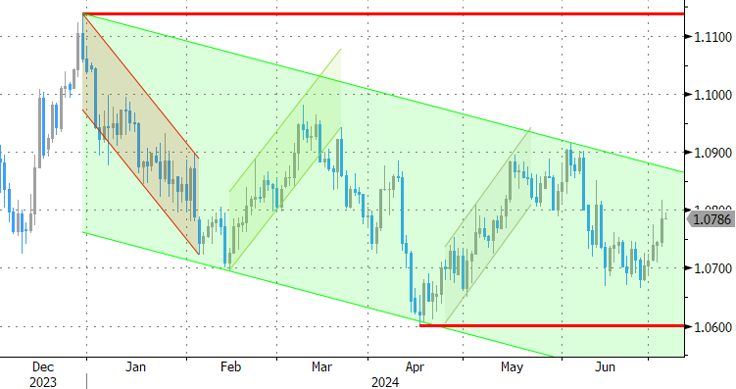
Intraday bias in EUR/USD remains on the upside for the moment. Pullback from 1.0915 should have completed at 1.0665. Further rally would be seen to 1.0915 resistance next. For now, risk will stay on the upside as long as 1.0709 support holds, in case of retreat.
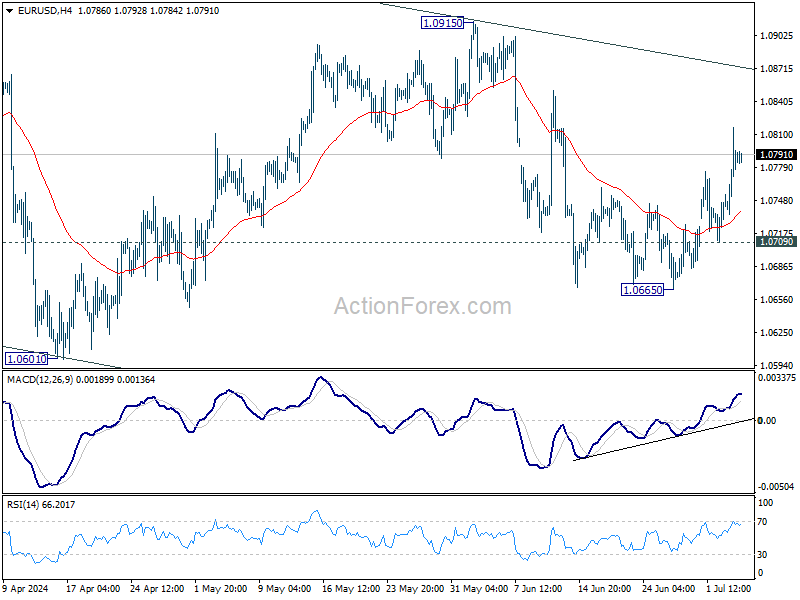
In the bigger picture, price actions from 1.1274 are viewed as a corrective pattern that's still in progress. Break of 1.0601 will target 1.0447 support and possibly below. On the upside, firm break of 1.0915 resistance will start another rising leg back to 1.1138 resistance instead.
USD/JPY Daily Outlook
Daily Pivots: (S1) 161.00; (P) 161.48; (R1) 162.18; More...
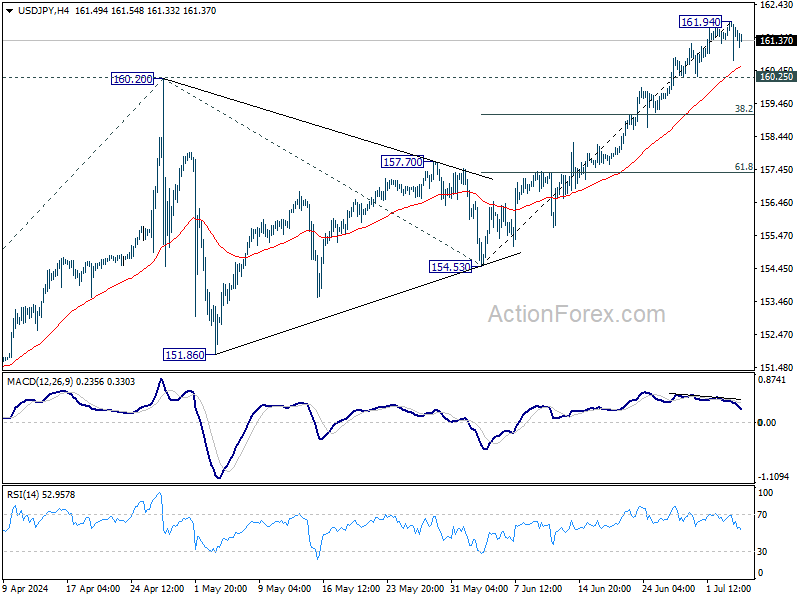
Intraday bias in turned neutral with current retreat and some consolidations would be seen below 161.94 temporary top. But further rally is expected as long as 160.25 minor support holds. Break of 161.94 will resume larger up trend to 61.8% projection of 146.47 to 160.20 from 154.53 at 163.01. Nevertheless, break of 160.25 will turn bias to the downside for deeper pullback.
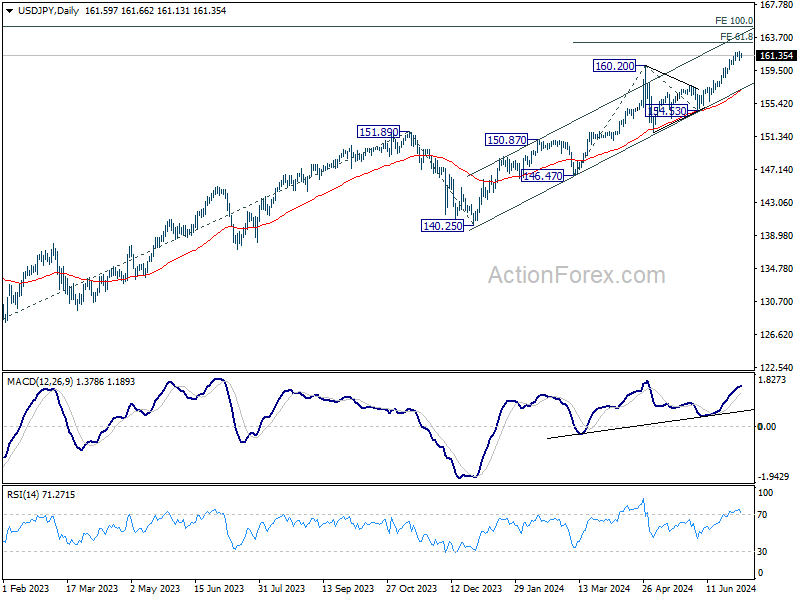
In the bigger picture, long term up trend is still in progress. Further rise is expected as long as 154.53 support holds. Next target is 100% projection of 127.20 (2023 low) to 151.89 (2023 high) from 140.25 at 164.94.
GBP/USD Daily Outlook
Daily Pivots: (S1) 1.2684; (P) 1.2731; (R1) 1.2789; More...
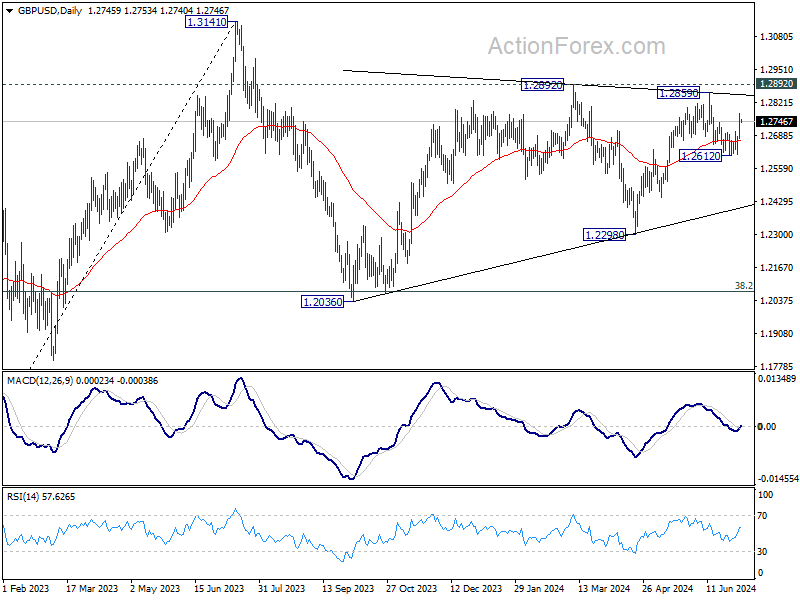
Intraday bias in GBP/USD remains on the upside for retesting 1.2859 high. Correction from there should have completed at 1.2612. Firm break of 1.2859 will resume rally from 1.2298. For now, risk will stay on the upside as long as 1.2612 support holds, in case of retreat.
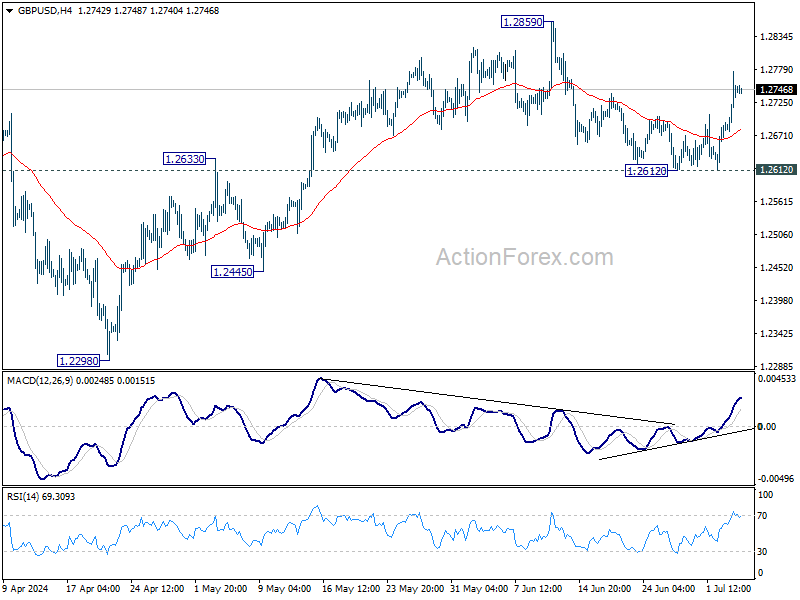
In the bigger picture, price actions from 1.3141 medium term top are seen as a corrective pattern that is still in progress. Break of 1.2445 support will confirm that another falling leg has started and target 1.2036 cluster support again (38.2% retracement of 1.0351 (2022 low) to 1.3141 at 1.2075. Nevertheless, break of 1.2892 resistance will argue that larger up trend from 1.0351 is ready to resume through 1.3141.
USD/CHF Daily Outlook
Daily Pivots: (S1) 0.8982; (P) 0.9019; (R1) 0.9051; More…
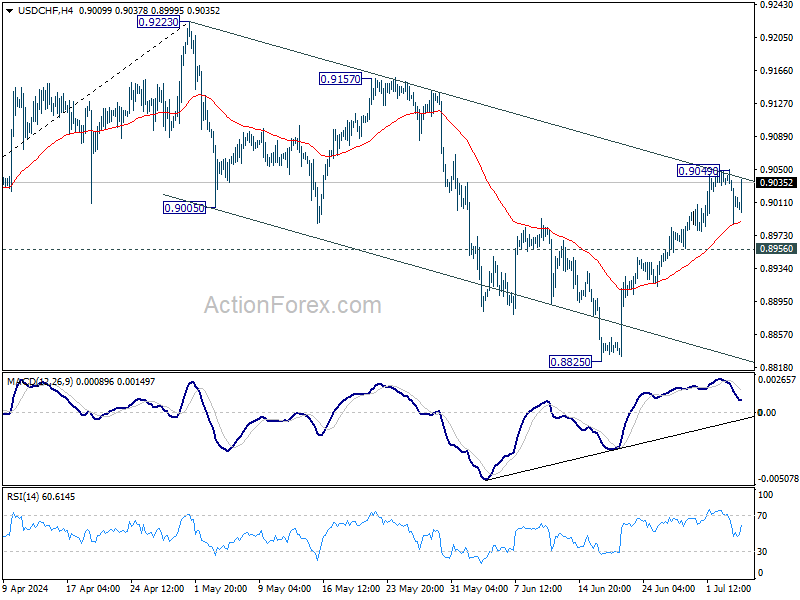
Intraday bias in USD/CHF remains neutral for the moment. Further rise is mildly in favor as long as 0.8956 support holds. Above 0.9049 will affirm the case that corrective fall from 0.9223 has completed at 0.8825. Further rally would then be seen to 0.9157 resistance next. However, firm break of 0.8956 will bring retest of 0.8825 support instead.
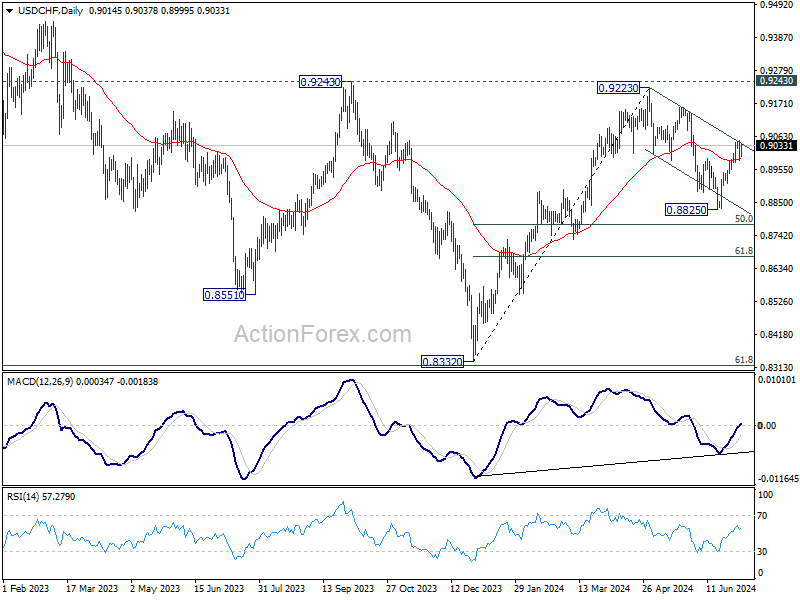
In the bigger picture, focus remains is now on 0.9223/9243 resistance zone. Decisive break there would complete a head and shoulder bottom pattern (ls: 0.8551; h: 0.8332; rs: 0.8825). That would indicate larger bullish trend reversal. Nevertheless, rejection by 0.9223/43 will keep medium term outlook neutral at best, for more range trading between 0.8332/9243 first.
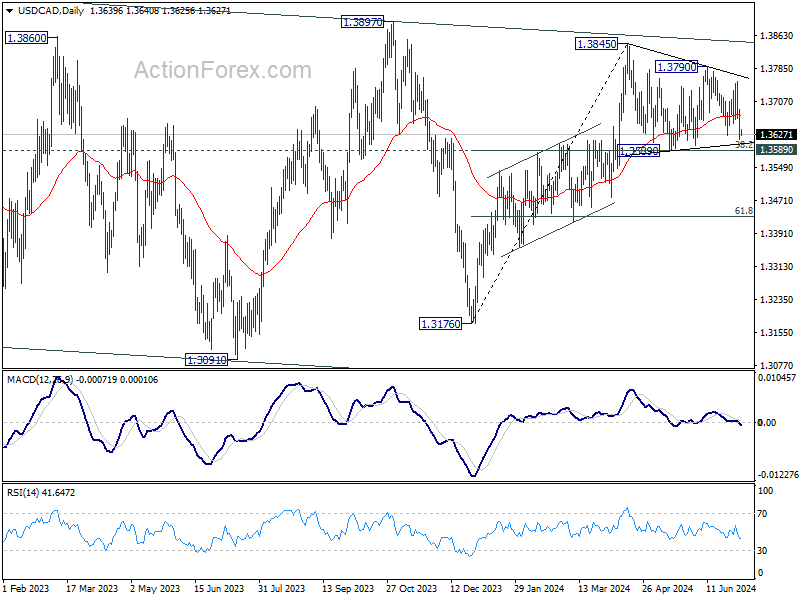
USD/CAD Daily Outlook
Daily Pivots: (S1) 1.3610; (P) 1.3648; (R1) 1.3679; More...
While USD/CAD declines notably, there is no change in the outlook as consolidation from 1.3845 is in progress, and could extend further. Downside should be contained by 1.3589 cluster support (38.2% retracement of 1.3176 to 1.3845 at 1.3589) to bring rebound. Break of 1.3790 resistance will argue that larger rise is ready to resume and target 1.3845 resistance.
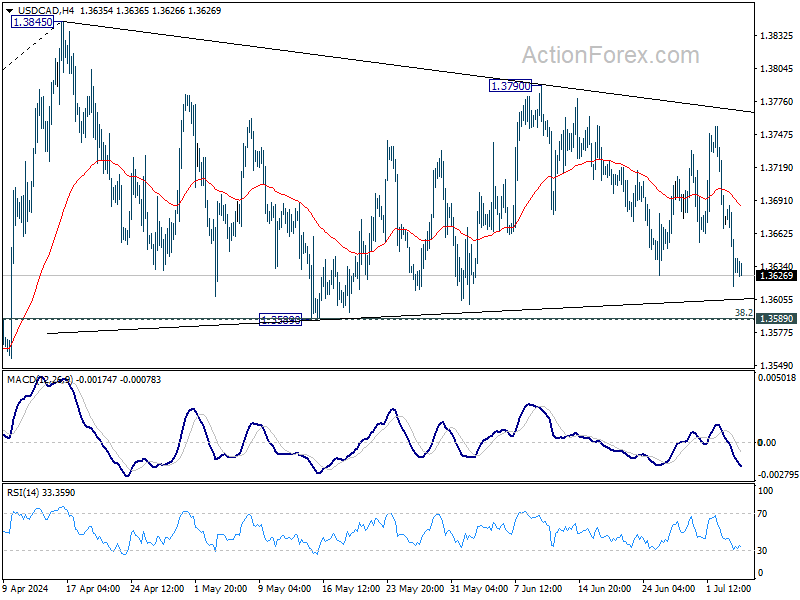
In the bigger picture, price actions from 1.3976 (2022 high) are viewed as a corrective pattern. In case of another fall, strong support should emerge above 1.2947 resistance turned support to bring rebound. Firm break of 1.3976 will confirm up resumption of whole up trend from 1.2005 (2021 low). Next target is 61.8% projection of 1.2401 to 1.3976 from 1.3176 at 1.4149.
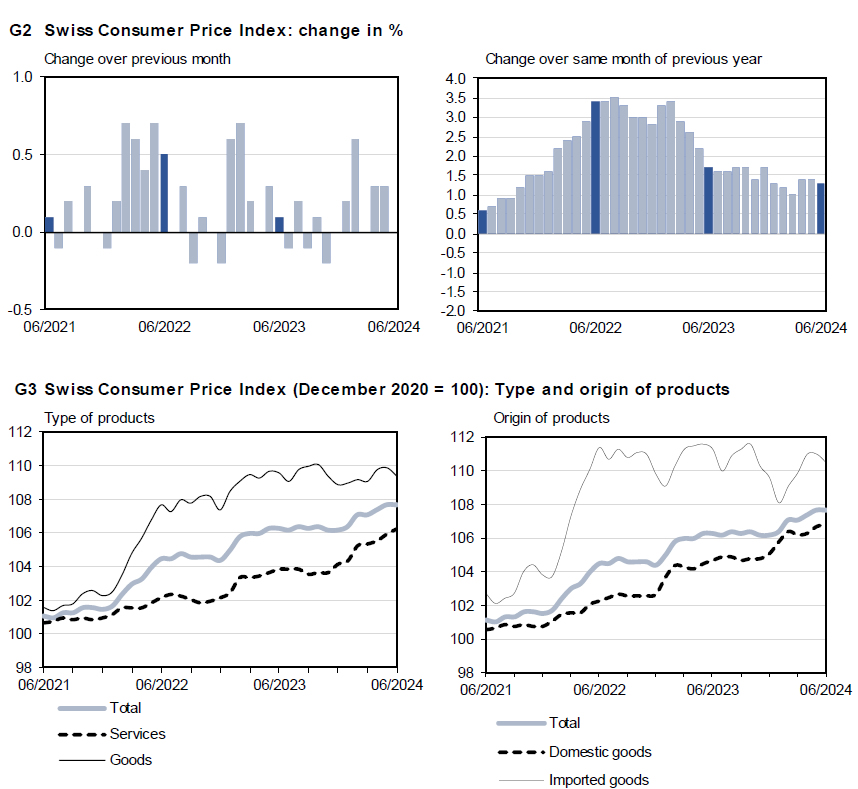
Swiss CPI slows to 1.3% yoy in Jun, vs exp 1.4% yoy
Swiss CPI rose 0.0% mom in June, below expectation of 0.1% mom. Core CPI (excluding fresh and seasonal products, energy and fuel) fell -0.1% mom. Domestic product prices rose 0.2% mom while imported products prices fell -0.5% mom.
For the 12-month period, CPI rose 1.3% yoy, slowed from prior month's 1.4% yoy, below expectation of 1.4% yoy. Core CPI slowed from 1.2% yoy to 1.2% yoy. Domestic products prices growth was unchanged at 2.0% yoy. Imported products prices fell -0.8% yoy, down from May's -0.6% yoy.
Election Day in UK, Sterling Shows Little Signs of Nervousness
Markets
US Treasuries outperformed Bunds during a holiday-shortened session yesterday. Yields slid between 3.4 (2-yr) to -7.8 (30-yr) bps following a string of weaker-than-expected data (ADP job report, jobless claims & services ISM). The FOMC June meeting minutes, which were released after the early US market close, highlighted the need for additional evidence of inflation cooling before considering to cut rates. But there’s growing caution about the labor market with “several” participants noting that a further weakening in demand may lead to actual higher unemployment rather than in fewer job openings. Since the policy meeting, we’ve seen a number of Fed officials including SF’s Daly and governor Cook particularly focusing on the labour market so we’re not surprised to see the topic gaining traction internally. German yields (ex. 2-yr, +1.2 bps) dropped in sympathy with the US with net daily losses of as much as 5.6 bps (30-yr). Narrowing yield differentials and the bullish equity sentiment (both S&P500 & Nasdaq finished at record highs) weighed on the dollar. EUR/USD swung from 1.0745 to an intraday high of 1.0817 before paring gains to 1.0786 in the close. DXY limited the fallout out from 105.67 to 105.40. USD/JPY eked out a gain nonetheless to 161.55, the highest close in 38 years.
It’s election day in the UK today. Sterling shows little signs of nervousness though. The pound strengthened in recent days after EUR/GBP failed to take out 0.85 earlier this week. Anything but a (possibly record-breaking) landslide Labour victory would be a huge surprise. Keir Starmer’s party has had a strong lead in the polls for more than two years now. Sterling’s reaction to today’s outcome should stay limited, eying Labour’s policy plans and how they fund them instead. This will only get clearer as weeks pass by. We hold a negative EUR/GBP bias nonetheless mainly due to the euro-side of the equation ahead of the next round in the French parliamentary elections. Today’s French auction is worth mentioning in this respect. In a sign of caution, treasury downsized the target size by €1.5bn to 10.5bn for a four-layered sale of bonds maturing between 2033 and 2066. Politics continue to take center stage in the US as well, even as financial markets are closed for Independence Day. Calls internally grow louder for Biden to step down after a disastrous showing during the debate with Trump. We expect an announcement in coming days. Trading in FX and FI core markets in absence of the US and economic data will be technically inspired.
News & Views
The National Bank of Poland kept its policy rate unchanged at 5.75% yesterday. New annual inflation projections put CPI at 3.7% this year (from 3.55%), 5.25% in 2025 (from 3.6%) and 2.7% in 2026 (from 2.9%). The NBP expects inflation (2.6% Y/Y in June) to increase in the coming quarters and run above the NBP’s inflation target mainly because of raised energy prices. It’s uncertain whether this will impact inflation expectations while elevated services price growth, future fiscal/regulatory policies, the pace of the economic recovery and labour market conditions (wage growth is still high) are other risks. Weakened Polish economic conditions (especially industry & construction) result in downwardly revised growth forecast for the 2024-2026 horizon: from 3.5%-4.25%-3.25% in March to 3%-3.8%-3.1% yesterday. NBP governor Glapinski will still give a press conference later today. He’s unlikely to change previous guidance of unchanged policy rates for at least the remainder of the year. The Polish zloty holds near multiyear highs at 4.30.
The Brazilian real finally found some relieve yesterday. The currency lost more than 10% against the dollar since early May, propelling USD/BRL to 5.70 for the first time since early 2022. USD strength was this month accompanied by BRL weakness on the back of multiple calls from Brazilian president Lula da Silva to defy spending cuts and wrestle the Brazilian central bank into larger policy rate cuts. Yesterday, he more or less changed course by saying that his government sees fiscal responsibility as a commitment while Minister of Finance Haddad stressed that central bank directors have the autonomy to act. Simultaneously, Lula nevertheless unveiled a record breaking BRL 400bn of funding to support the Brazilian agricultural sector. USD/BRL fell back towards 5.55.
Graphs
GE 10y yield
The ECB cut its key policy rates by 25 bps at the June policy meeting. A more bumpy inflation path in H2 2024, the EMU economy gradually regaining traction and the Fed’s higher for longer US strategy make follow-up moves difficult. Markets are coming to terms with that. Meanwhile, much of the save haven bids were reversed after the first round in the French elections. The 2.34%-2.4% support zone looks solid.
US 10y yield
The Fed needs more evidence than just one slower-than-expected (May) CPI is providing. Upgraded inflation forecasts and a higher neutral rate complicate the timing of a first cut further. June dots suggest one move in 2024 and four next year. The long end of the curve is supported by increased odds of a Trump presidency after the debate with Biden. The spectre of increased spending (risk premia) pulled the 10-yr away from the 4.2% support area.
EUR/USD
EUR/USD is stuck in the 1.06-1.09 range. The desynchronized rate cut cycle with the ECB exceptionally taking the lead, strong US May payrolls and a swing to the right in European elections pulled the pair away from 1.09. The Fed meeting balanced the weaker than expected US CPI outcome. The increased probability of a hung French parliament after the first round offered the euro some relief.
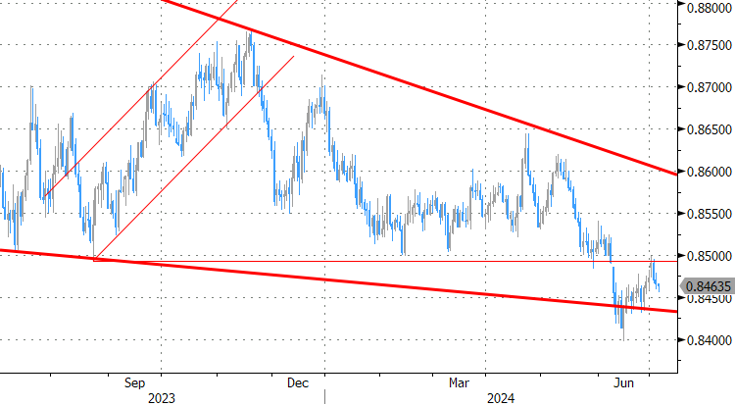
EUR/GBP
Debate at the BOE is focused at the timing of rate cuts. May headline inflation returned to 2%, but core measures weren’t in line with inflation sustainably returning to target any time soon. Still some BoE members at the June meeting appeared moving closer to a rate cut. This might cap further sterling gains. The euro’s vulnerability to political event risk going into the French elections eased for now. EUR/GBP 0.84 is becoming solid support.