Sample Category Title
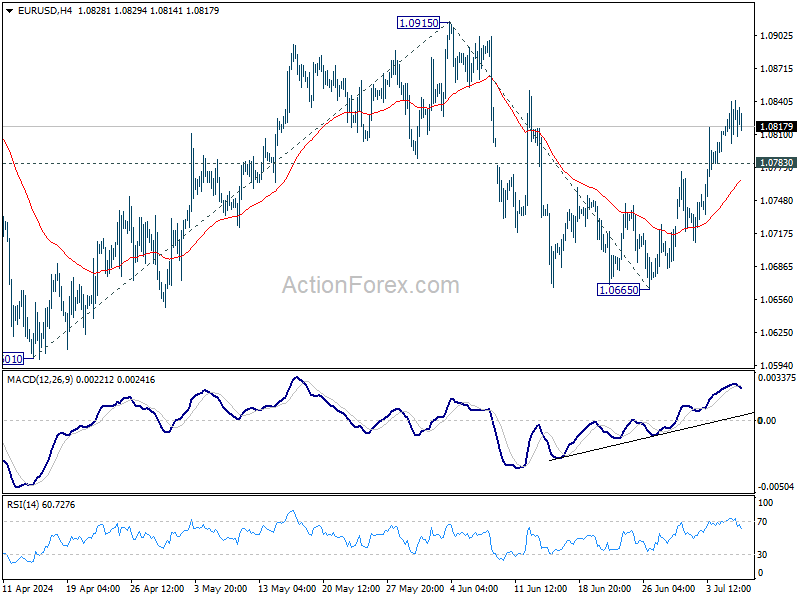
EUR/USD Daily Outlook
Daily Pivots: (S1) 1.0813; (P) 1.0827; (R1) 1.0854; More....
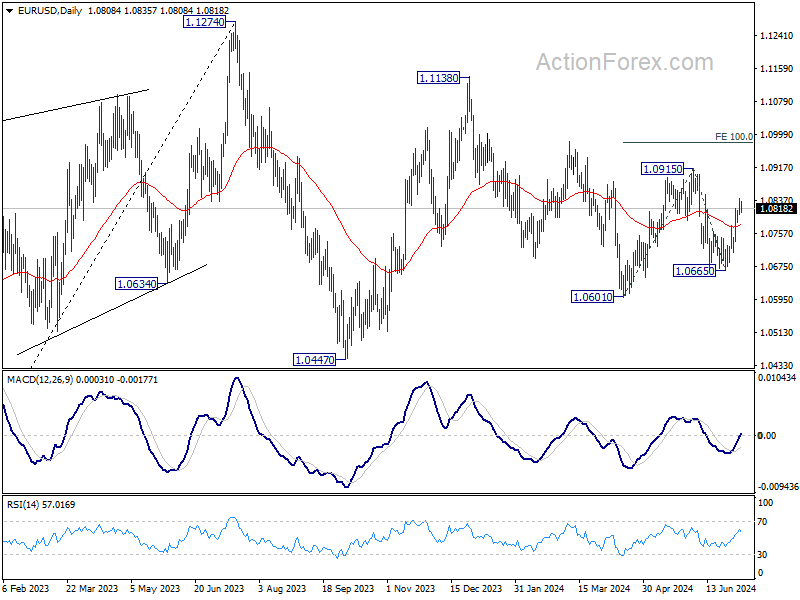
Despite some loss off upside momentum as seen in 4H MACD, intraday bias in EUR/SD stays on the upside with 1.0783 minor support intact. Rise from 1.0665 would target 1.0915 resistance first. Firm break there will target 100% projection of 1.0601 to 1.0915 from 1.0665 at 1.0919 next. On the downside, below 1.0783 minor support will turn intraday bias neutral first.
In the bigger picture, price actions from 1.1274 are viewed as a corrective pattern that's still in progress. Break of 1.0601 will target 1.0447 support and possibly below. On the upside, firm break of 1.0915 resistance will start another rising leg back to 1.1138 resistance instead.
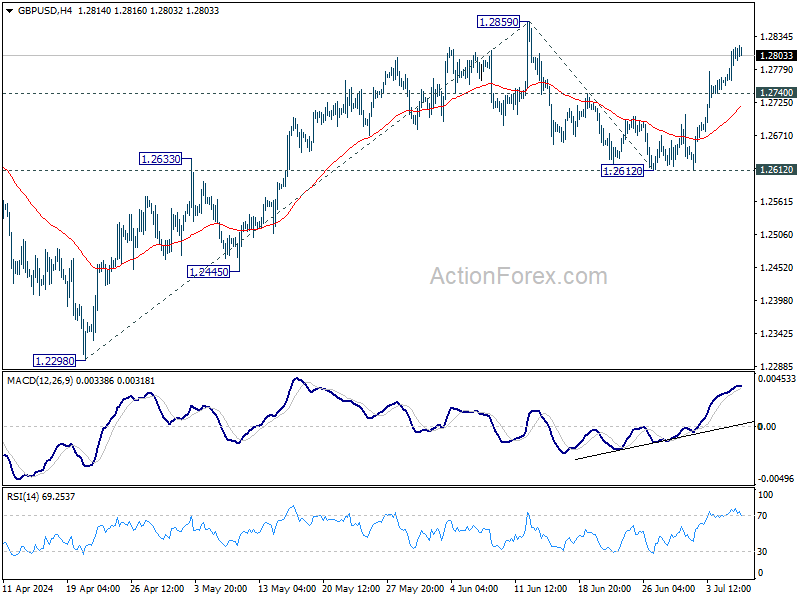
GBP/USD Daily Outlook
Daily Pivots: (S1) 1.2773; (P) 1.2796; (R1) 1.2837; More...
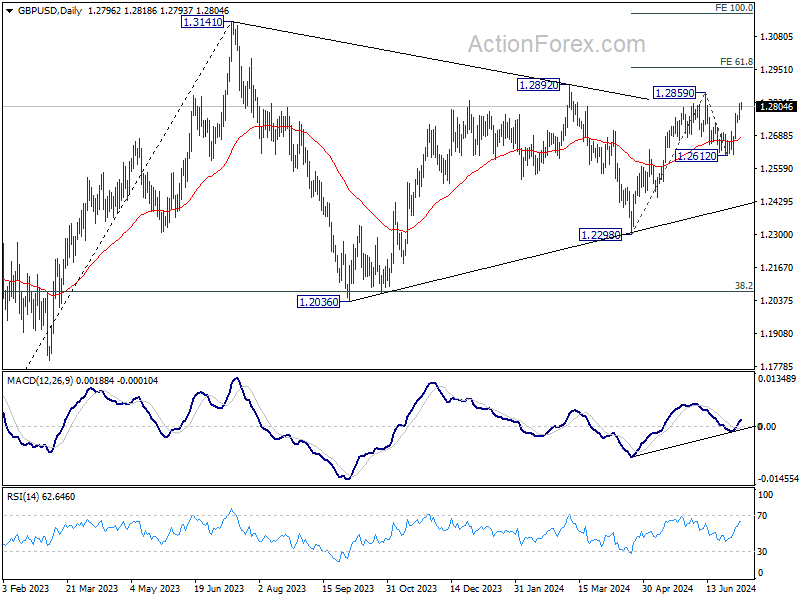
Rise from 1.2612 is in progress, and intraday bias in GBP/USD remains on the upside for 1.2859 resistance. Firm break there will resume the rally from 1.2298 and target 61.8% projection of 1.2298 to 1.2859 from 1.2612 at 1.2959. Decisive break there would prompt upside acceleration through 1.3141 to 100% projection at 1.3173. On the downside, below 1.2740 minor support will turn intraday bias neutral first.
In the bigger picture, price actions from 1.3141 medium term top are seen as a corrective pattern which might still extend. Break of 1.2612 support will bring another fall to 1.2298 support and possibly below. Nevertheless, break of 1.2892 resistance will argue that larger up trend from 1.0351 might be ready to resume through 1.3141.
USD/CHF Daily Outlook
Daily Pivots: (S1) 0.8939; (P) 0.8973; (R1) 0.8992; More…
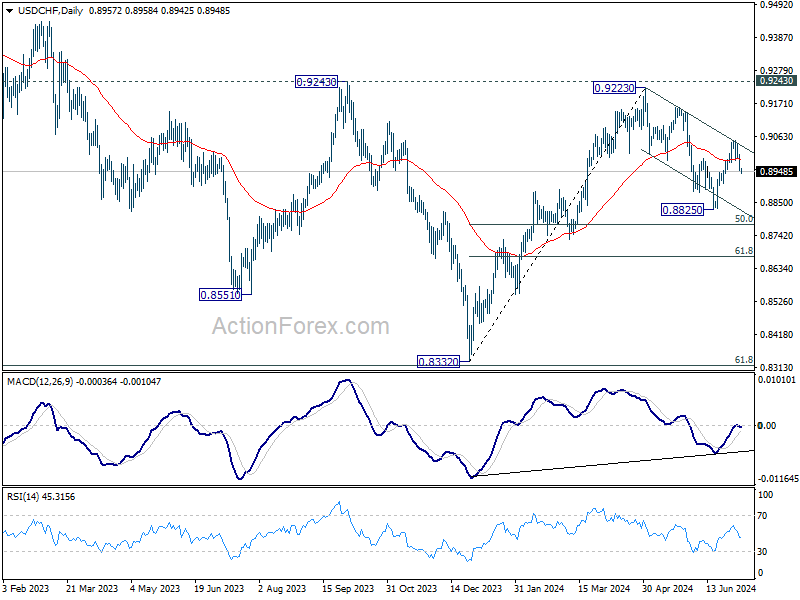
USD/CHF's break of 0.8956 minor support suggests that rebound from 0.8825 has completed at 0.9049, after rejection by falling channel resistance. Also, fall from 0.9223 is not completed yet. Intraday bias is back on the downside for retesting 0.8825 low next. For now, risk will stay on the downside as long as 0.9049 resistance holds, in case of recovery.

In the bigger picture, focus remains on 0.9223/9243 resistance zone. Decisive break there would suggest larger bullish trend reversal and turn outlook bullish. Nevertheless, rejection by 0.9223/43 will keep medium term outlook neutral at best, for more range trading between 0.8332/9243 first.
USD/JPY Daily Outlook
Daily Pivots: (S1) 160.28; (P) 160.84; (R1) 161.35; More...
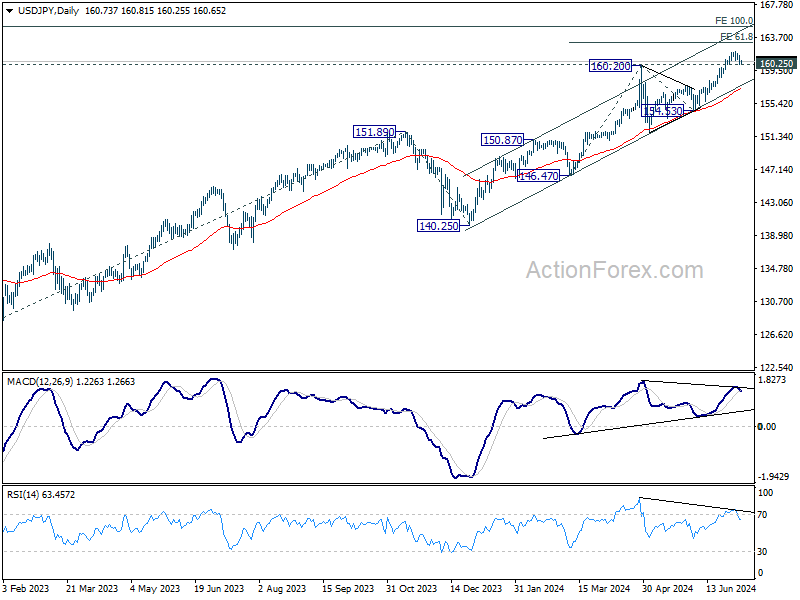
Intraday bias in USD/JPY remains neutral first and further rally is expected with 160.25 minor support intact. On the upside, break of 161.94 temporary top will resume larger up trend to 61.8% projection of 146.47 to 160.20 from 154.53 at 163.01. Nevertheless, break of 160.25 will turn bias to the downside for deeper pullback.
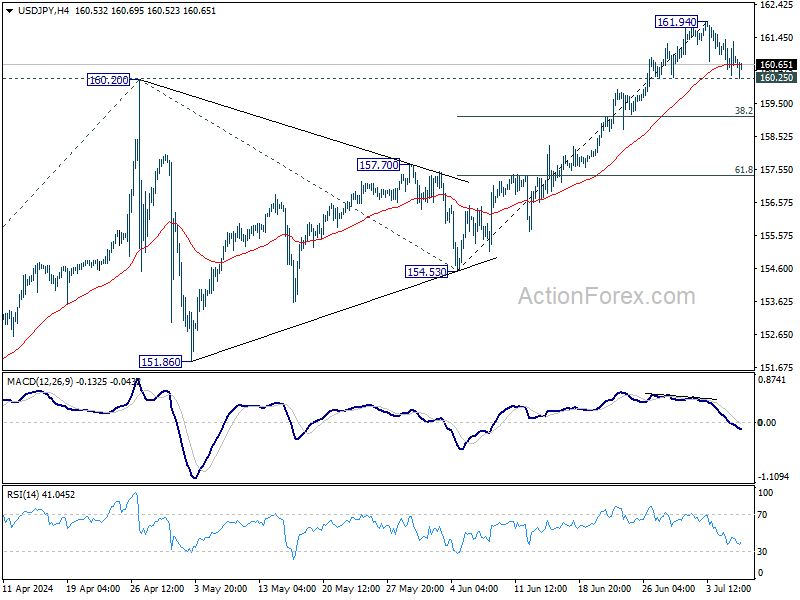
In the bigger picture, long term up trend is still in progress. Further rise is expected as long as 154.53 support holds. Next target is 100% projection of 127.20 (2023 low) to 151.89 (2023 high) from 140.25 at 164.94.
Second Round of French Legislative Election Brought New Surprises on the Table
The second round of French legislative election brought new surprises on the table – to say the least. Not only Marine Le Pen’s far-right National Rally didn’t win a majority but the New Popular Front – which is a leftist coalition led by the far-left Jean Luc Melonchon – secured the biggest share of the cake, and did too well to soothe investors’ concerns regarding stability and the predictability of the French politics and the good health of the French finances as Melonchon likes to spend big – probably even more than the far-right, he is anti-euro and anti-NATO. Melonchon said after the results that he will stick to his huge spending plan entirely and refuse to enter in parliamentary discussions with Macron. The latter could weigh on French bond appetite and keep the spread with the German yield above the pre-election levels and limit the euro’s upside potential.
The market reaction was a swift fall in the euro at the open, the franc gained on the back of an early flow of capital to its safety, but the EURUSD recovered most of losses before the Europeans have stepped in. The EURUSD trades around 1.0830 level at the time of writing. The European equity futures were pointing to the upside when I first turned on my computer but are slightly negative right now as the French political risks are not gone. France went from favouring the far-right to giving support to the far left in just a week time. French are looking for solutions in two extremes and that’s not an ideal outcome.
In equities, shares of French banks will particularly be in focus as the left suggested raising banks’ mandatory capital buffers and transaction tasks, and will also be tempted to raise taxes on wealth, dividends and share buybacks.
Soft jobs data fuels Fed cut bets
Across the Atlantic, last week ended with heightened hope of Federal Reserve (Fed) rate cuts. Despite a higher-than-expected NFP number, the wages growth eased in line with expectations while the unemployment rate ticked higher – to the highest level since late 2021. As such, investors looked past the stronger-than-expected NFP figure and sent the US yields lower. The US 2-year yield fell to 4.60% and the 10-year yield slipped below 4.30% as the probability of a September rate cut jumped past 75%. The dollar index extended losses below the 50-DMA and is preparing to test the 100-DMA – which stands near 104.75 - to the downside, though the US dollar is better bid this morning as a result of more political shenanigans in France.
Later this week, Fed Chair Jerome Powell’s semiannual testimony and the release of the all-important US CPI update will take the center stage. On Tuesday and Wednesday, the Fed Chief will likely reiterate the progress in inflation and may even give a clearer hint on the approximate timing of the first rate cut. And on Thursday, the latest inflation report from the US is expected to reveal a softening headline CPI from 3.3% to 3.1%, and a steady core reading at 3.4%. The market is craving for a set of soft and ideally softer-than-expected inflation numbers to bring the Fed closer to lowering its rates.
In equities, the rising Fed rate cut bets and lower yields helped the S&P500 close the week on a positive note, having reached another record high level on Friday. As such, the index kicked off the H2 of the year with its strongest performance since late April and climbed 2% during last week. Nasdaq 100 also extended gains toward new highs and closed a touch below the 20400 mark while the Russell 2000 traded lower on Friday and failed to extend gains above its 50-DMA – as a warning that the major US indices don’t necessarily reflect the mood elsewhere. The Russell 2000 is down by more than 5% since the April peak and the slowing economic fundamentals worry the small cap investors more than they worry the big caps.
Elsewhere, US crude fell more than 1% on Friday and begins the week downbeat after last week’s failure to clear the $85pb resistance. The price of a barrel stands at the bottom of the ytd uptrending channel base and should see the benefits of rising Fed cut bets. A minor support to the latest rebound is seen at $81.85pb – the 23.6% Fibonacci retracement on past month’s rebound. A major support is seen near the $80pb psychological level – which also coincides with the major 38.2% Fibonacci retracement and which should distinguish between the actual positive trend and a medium term bearish reversal.
AUD/USD Daily Report
Daily Pivots: (S1) 0.6727; (P) 0.6741; (R1) 0.6762; More...
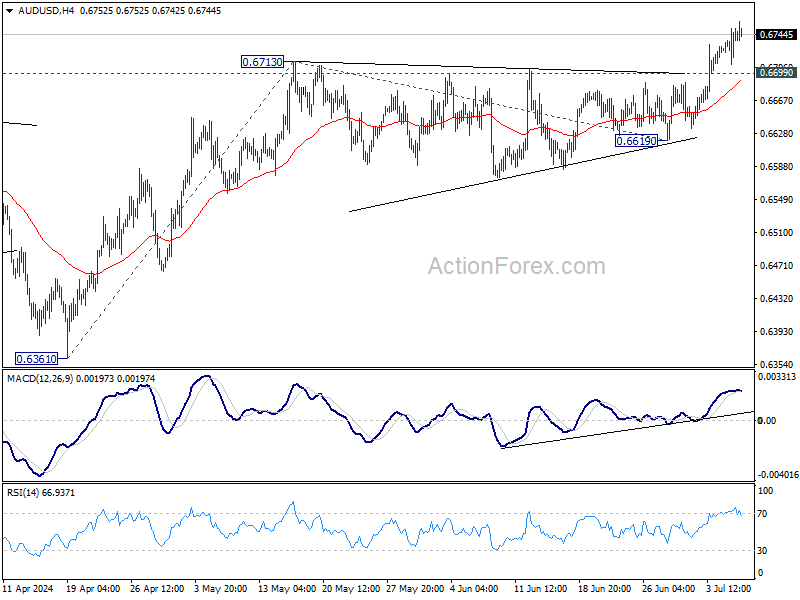
Intraday bias in AUD/USD remains on the upside for the moment. Current rally should target 61.8% projection of 0.6361 to 0.6713 from 0.6619 at 0.6837. On the downside, below 0.6699 minor support will turn intraday bias neutral first. But, near term outlook will stay bullish as long as 0.6619 support holds, in case of retreat.
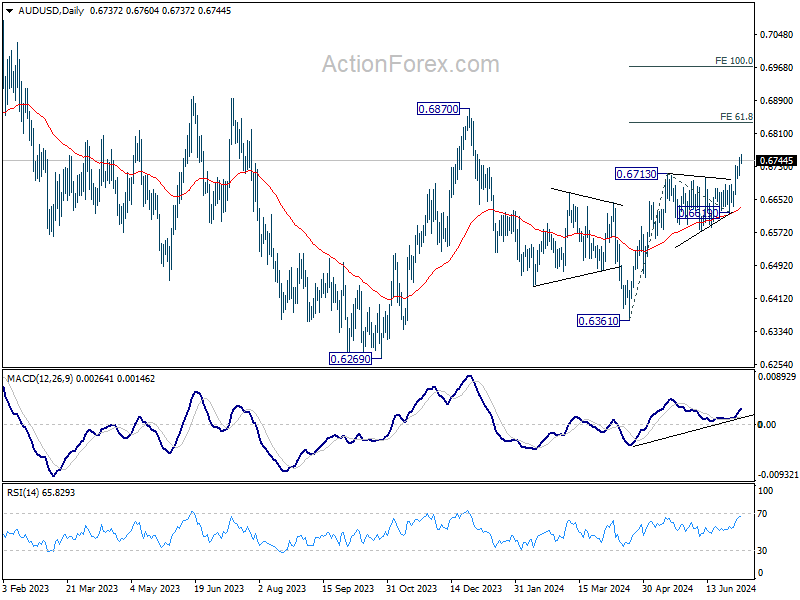
In the bigger picture, price actions from 0.6169 (2022 low) are seen as a medium term corrective pattern to the down trend from 0.8006 (2021 high). Fall from 0.7156 (2023 high) is seen as the second leg, which could have completed at 0.6269 already. Rise from there is seen as the third leg which is now trying to resume through 0.6870 resistance.
USD/CAD Daily Outlook
Daily Pivots: (S1) 1.3612; (P) 1.3633; (R1) 1.3663; More...
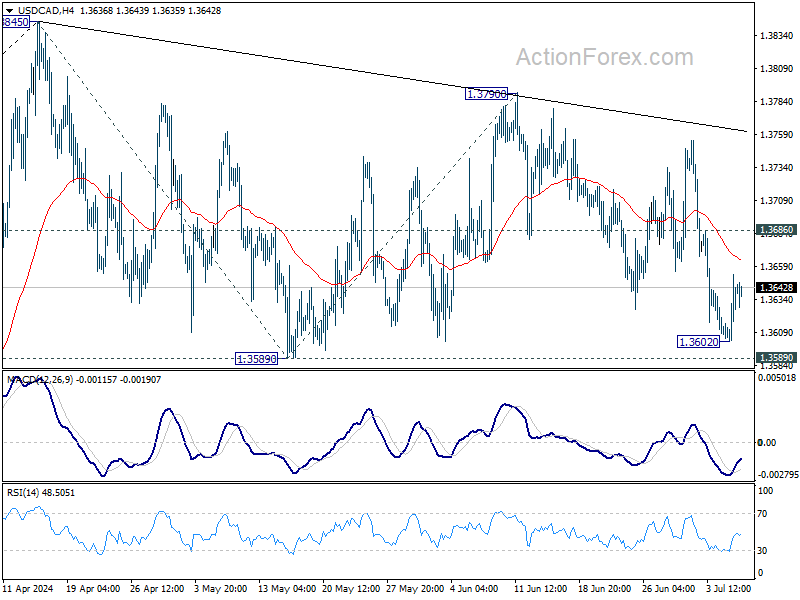
Intraday bias in USD/CAD remains neutral for the moment. Corrective pattern from 1.3845 could still extend. Break of 1.3589 will target 100% projection of 1.3845 to 1.3589 from 1.3790 at 1.3534. Strong support would be seen there to bring rebound. On the upside, above 1.3686 minor resistance will turn bias back to the upside for 1.3790 resistance instead.
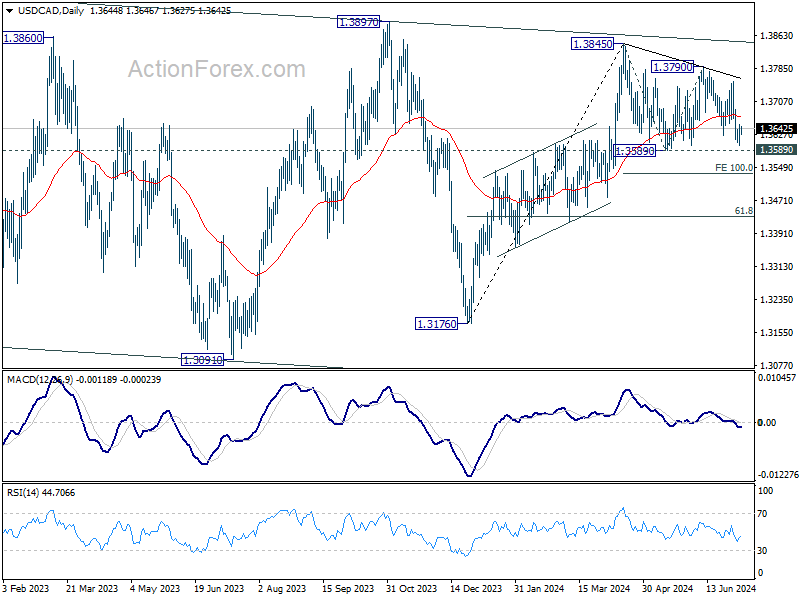
In the bigger picture, price actions from 1.3976 (2022 high) are viewed as a corrective pattern. In case of another fall, strong support should emerge above 1.2947 resistance turned support to bring rebound. Firm break of 1.3976 will confirm up resumption of whole up trend from 1.2005 (2021 low). Next target is 61.8% projection of 1.2401 to 1.3976 from 1.3176 at 1.4149.
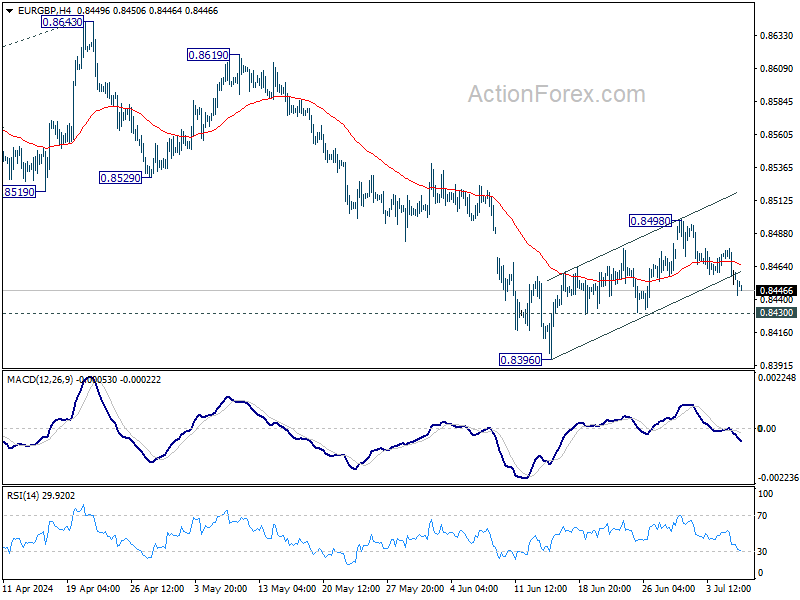
EUR/GBP Daily Outlook
Daily Pivots: (S1) 0.8447; (P) 0.8462; (R1) 0.8473; More...
Intraday bias in EUR/GBP remains neutral first. On the upside, sustained trading above 55 D EMA (now at 0.8501) will extend the rise from 0.8396 short term bottom to 0.8529 support turned resistance. Nevertheless, On the downside, break of 0.8493 support will suggest that the corrective recovery has completed. Intraday bias will be back on the downside for retesting of 0.8396 low. Firm break there will resume larger down trend.
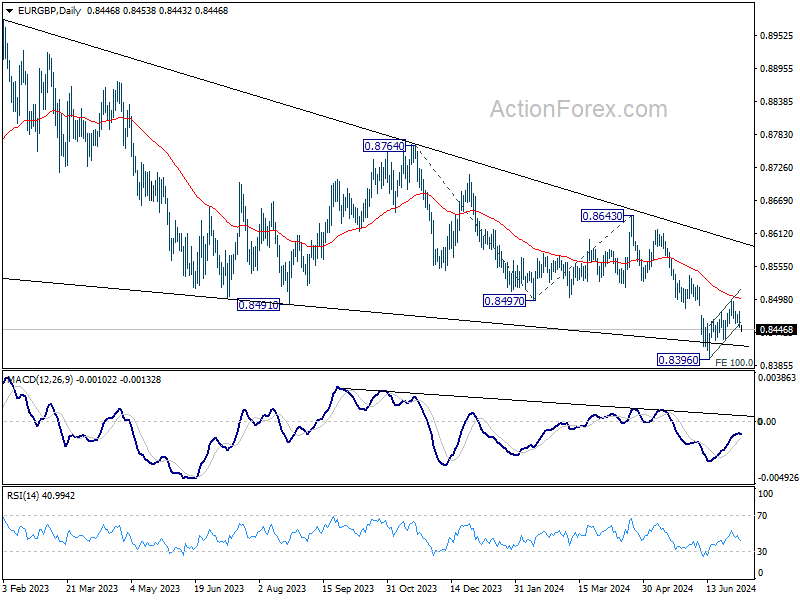
In the bigger picture, down trend from 0.9267 (2022 high) is in progress. Next target is 100% projection of 0.8764 to 0.8497 from 0.8643 at 0.8376. Sustained break there will target 161.8% projection at 0.8211 next. For now, outlook will remain bearish as long as 0.8643 resistance holds, even in case of stronger rebound.
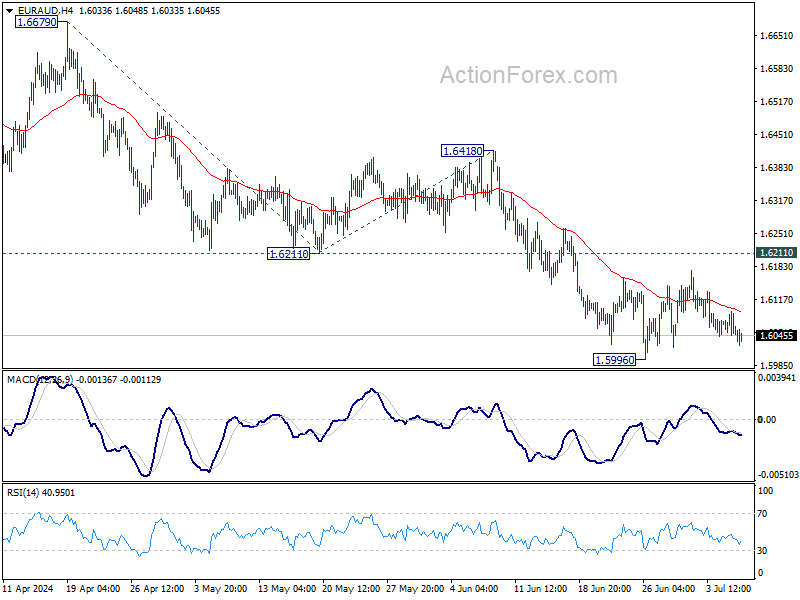
EUR/AUD Daily Outlook
Daily Pivots: (S1) 1.6038; (P) 1.6067; (R1) 1.6088; More...
Intraday bias in EUR/AUD remains neutral as consolidation from 1.5996 is still extending. Outlook will remain bearish as long as 1.6211 support turned resistance holds. On the downside, break of 1.5996 will target 100% projection of 1.6679 to 1.6211 from 1.6418 at 1.5950. Firm break there will target 1.5846 key support next.
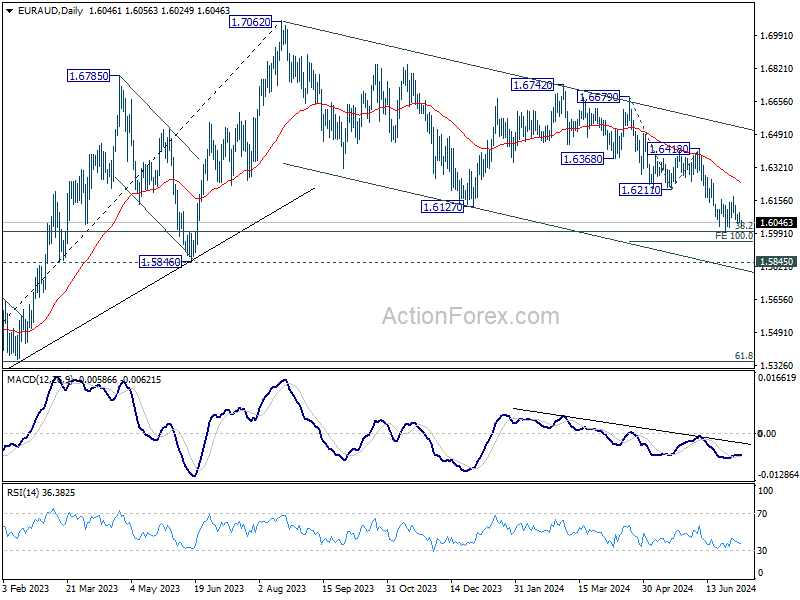
In the bigger picture, fall from 1.7062 medium term top is seen as a correction to the up trend from 1.4281 (2022 low) only. Strong support is still expected between 1.5846 and 38.2% retracement of 1.4281 to 1.7062 at 1.6000 to bring rebound. Break of 1.6148 resistance will argue that the correction has completed.
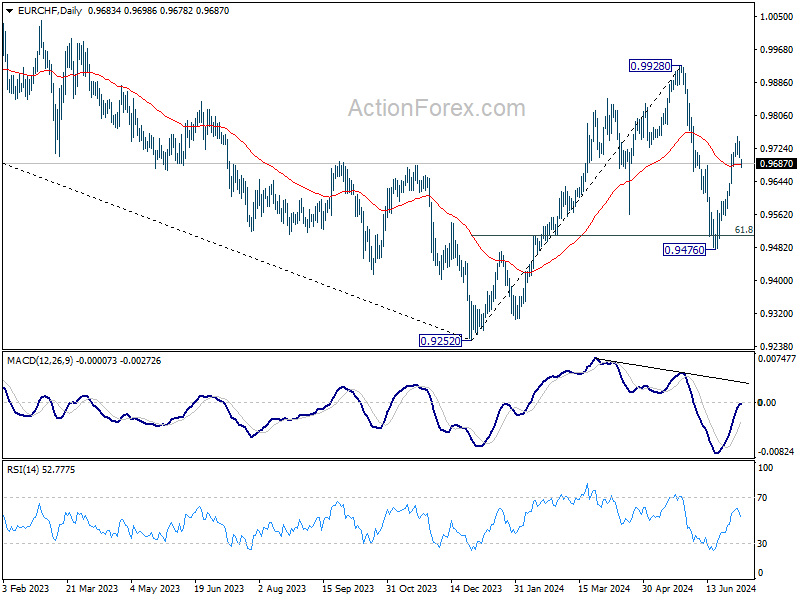
EUR/CHF Daily Outlook
Daily Pivots: (S1) 0.9695; (P) 0.9718; (R1) 0.9733; More....
EUR/CHF dips further today but stays above 0.9639 minor support. Intraday bias remains neutral and further rally is still expected. Above 0.9754 will target 0.9928 high. Nevertheless, break of 0.9639 will resume the rally from 0.9476 and turn bias back to the downside for 0.9476 low instead.
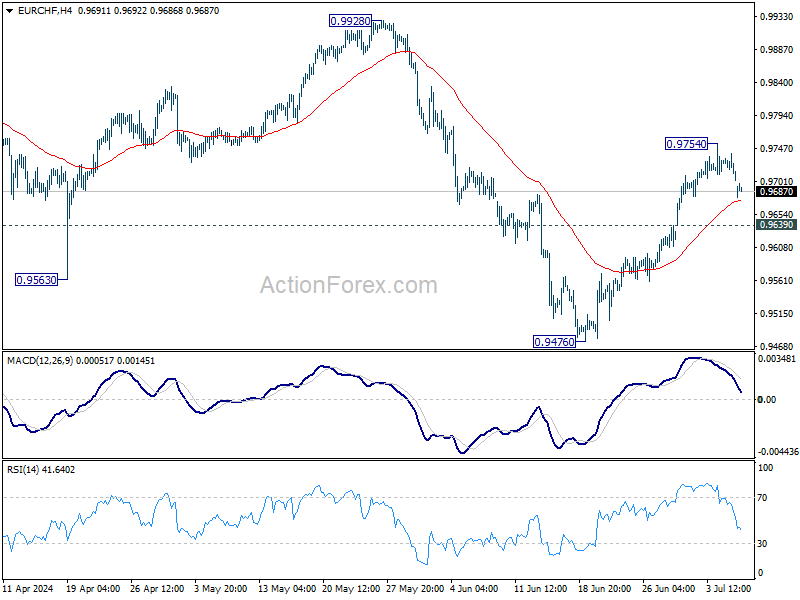
In the bigger picture, rebound from 0.9252 medium term bottom might not be completed yet. But even in case of resumption, strong resistance could emerge from 1.0095 to limit upside. Medium term outlook will be neutral at best as long as 1.0094 structural resistance holds. Meanwhile, break of 0.9476 will bring retest of 0.9252 low.