Sample Category Title
Chart alert: NZD/USD’s 3-Day Decline Ends, Potential Bullish Reversal above 0.5846 Key Support
Key takeaways
- Hawkish RBNZ supports NZD upside: Stronger-than-expected inflation (3.1%) increases the likelihood of rate hikes, with bond yield spreads signalling a more hawkish stance that underpins NZD/USD.
- Bullish reversal taking shape: NZD/USD has rebounded from its 200-day moving average, breaking back above the 50-day MA, suggesting the recent 3-day decline may have ended.
- Key levels for continuation: Holding above 0.5846 keeps the bullish bias intact, with upside toward 0.5965–0.6030, while a break below this level risks a pullback toward 0.5800 and lower.
Annual inflation in New Zealand came in at 3.1% year-on-year in Q1 2026, unchanged from Q4 2026’s 1.5 year high but exceeded the consensus forecast of 2.9%.
The latest inflation print in New Zealand has continued to surpass the RBNZ (New Zealand central bank) long-term inflation target of 1%-3%, therefore increasing the odds of a 25 basis points (bps) interest rate hike by the RBNZ in July’s monetary policy meeting to bring the official cash policy rate higher to 2.50%. So far, the RBNZ has kept its policy rate unchanged at 2.25% for two consecutive meetings since February 2026.
2-year NZ sovereign bond/US Treasury yield spread has started to price in a more hawkish RBNZ
Fig. 1: 2-year yield spread of New Zealand sovereign bond and US Treasury note medium-term trend as of 21 Apr 2026 (Source: TradingView).
The movement of the 2-year sovereign government bond yields is highly sensitive to changes in monetary policy guidance. Hence, the directional movement of the 2-year yield spread between the two countries’ sovereign bonds is likely to influence the foreign exchange rate of these two countries.
By looking at the current 2-year yield spread between New Zealand sovereign bonds and US Treasuries from a technical analysis perspective, it has traced out a major bullish reversal “Inverse Head & Shoulders” configuration since 9 January 2025 and traded above its 200-day moving average, which is acting as a key support at -0.45% (see Fig. 1).
Therefore, breaking above the neckline resistance of the “Inverse Head & Shoulders” at –0.09% is likely to see a further rally in the current 2-year yield spread between New Zealand sovereign bonds and US Treasuries (US Treasuries’ yield premium shrinkage), in turn, putting potential upside pressure on the NZD/USD rate.
Let us now examine the short-term outlook (1-3 days) of NZD/USD from a technical analysis perspective.
NZD/USD – Bullish reversal at 0.5846 support
Fig. 2: NZD/USD minor trend as of 21 Apr 2026 (Source: TradingView).
Fig. 3: NZD/USD medium-term trend as of 21 Apr 2026 (Source: TradingView).
The price actions of the NZD/USD have pushed back up above its 50-day moving average after a retest of its 200-day moving average on Monday, 20 April 2026.
Watch the 0.5880/0.5846 key short-term pivotal support on the NZD/USD. A clearance above 0.5929 opens scope for a further potential short-term rally for the next intermediate resistances to come in at 0.5965 and 0.6015/0.6030 (also a Fibonacci extension) (see Fig. 2).
However, failure to hold and an hourly close below 0.5846 invalidates the bullish scenario for a minor corrective pull-back to retest the 20-day moving average that is acting as the next intermediate support at 0.5800. A break below 0.5800 may trigger a deeper slide to expose 0.5725 next.
Key elements to support the near-term bullish bias on NZD/USD
- Price actions of NZD/USD have continued to oscillate within a minor ascending channel in place since the 7 April 2026 low of 0.5690 and still have room to maneuver towards the upper boundary of the minor ascending channel (see Fig. 2).
- NZD/USD has just shaped a 3-day (17 April, 21 April, and 22 April) bullish reversal candlestick condition on the retest of its key 200-day moving average, indicating the potential end of the minor corrective decline sequence from 15 April 2026 to 20 April 2026 (see Fig. 3).
- The daily RSI momentum indicator has shaped a higher low above the 50 level and has not reached its overbought region (above the 70 level) (see Fig. 3).
Elliott Wave Outlook: Dow Futures (YM) On Course for Breakout to Fresh Highs
Dow Futures ended the correction against the cycle from the April 2025 low at 45,065, which we identify as wave (2). From that level, the Index began to rally higher in wave (3). To confirm the bullish sequence, it must break above the prior wave (1) peak at 50,611. Such a move would eliminate the risk of a double correction. Importantly, other major indices such as the S&P 500 (SPX) and Nasdaq 100 (NQ) have already registered new highs, which reduces the probability of Dow Futures forming a double correction.
From the wave (2) low, wave ((1)) advanced to 47,090. A subsequent pullback in wave ((ii)) found support at 46,076. The Index then nested higher, with wave (i) ending at 46,987 and wave (ii) retracing to 46,362. Momentum carried wave (iii) to 48,555, followed by a measured pullback in wave (iv) to 47,534. One more leg higher is expected to complete wave (v) of ((iii)). Afterward, the Index should correct the cycle from the April 2 low in wave ((iv)) before resuming its upward trajectory. Near term, the pivot at 45,065 remains critical. As long as this level holds, dips are expected to attract buyers. Support should emerge in three, seven, or eleven swing sequences, reinforcing the broader bullish outlook.
Dow Futures (YM) 60-Minute Elliott Wave Chart
YM Elliott Wave Video:
https://www.youtube.com/watch?v=Xk_BO2TCFs0
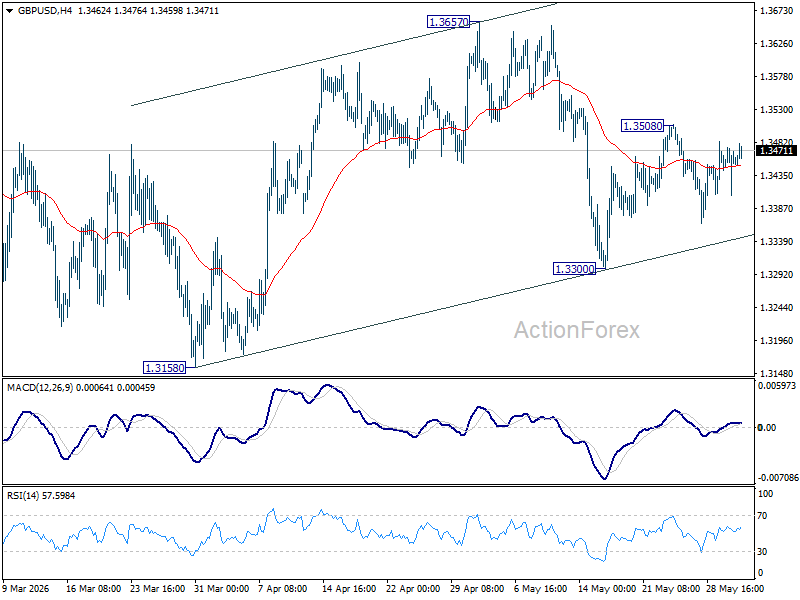
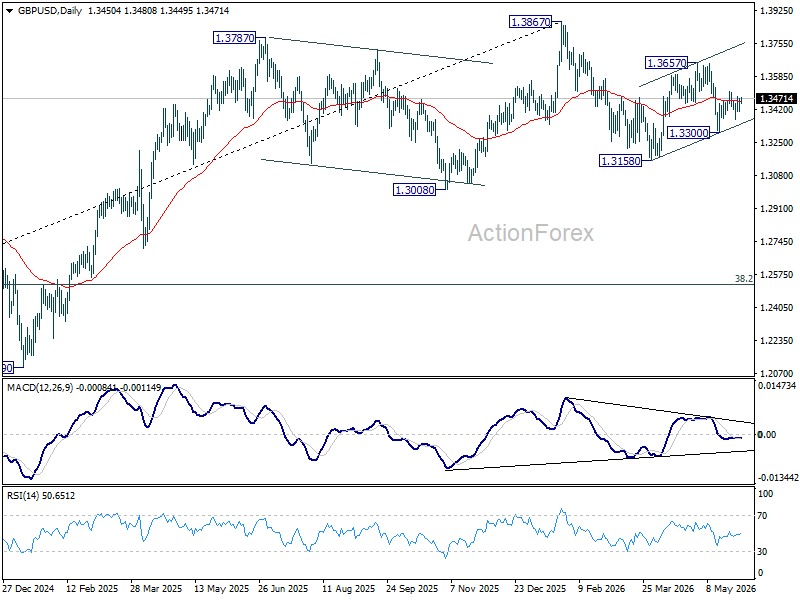
GBP/USD Moves Up, Traders Eye Continuation Of Rally
Key Highlights
- GBP/USD extended gains and settled above the 1.3500 zone.
- A major bullish trend line is forming with support at 1.3505 on the 4-hour chart.
- EUR/USD might attempt another increase if it clears 1.1850.
- Bitcoin corrected some gains from $78,000 and tested $74,000.
GBP/USD Technical Analysis
The British Pound climbed toward 1.3600 before correcting some gains against the US Dollar. GBP/USD dipped to 1.3500 and might soon resume upside.
Looking at the 4-hour chart, the pair settled above the 1.3500 level, the 100 simple moving average (red, 4-hour), and the 200 simple moving average (green, 4-hour). A low was formed at 1.3472, and the pair is now attempting another increase.
On the upside, the pair faces resistance at 1.3550 or the 61.8% Fib retracement level of the downside correction from the 1.3599 swing high to the 1.3472 low.
The first major resistance sits at 1.3565. The main resistance could be 1.3600. A close above 1.3600 could open doors for gains above 1.3620. In the stated case, the bulls could aim for a move to 1.3740.
Immediate support is seen near 1.3500. There is also a major bullish trend line forming with support at 1.3505. The next support could be 1.3475. A close below 1.3475 might push the pair toward 1.3420. The main support sits at 1.3380, the 100 simple moving average (red, 4-hour), and the 200 simple moving average (green, 4-hour). Any more losses could initiate a fresh move to 1.3250 in the coming days.
Looking at Bitcoin, the price started a consolidation phase after the bears protected more gains above the $78,000 zone.
Upcoming Key Economic Events:
- UK Claimant Count Change for March 2026 – Forecast 21.4K, versus 24.7K previous.
- UK ILO Unemployment Rate for Feb 2026 (3M) – Forecast 5.2%, versus 5.2% previous.
- US Retail Sales for March 2026 (MoM) – Forecast +1.4%, versus +0.6% previous.
NZ Inflation Holds at 3.1% as Non-Tradables Stay Firm, Energy Pressures Build
New Zealand’s CPI held steady at 3.1% yoy in Q1, above expectations of 2.9% and marking the highest level since Q2 2024, keeping it above the RBNZ’s 1–3% target band for a second straight quarter. On a quarterly basis, CPI rose 0.9% qoq, slightly above forecasts, suggesting underlying pressures remain persistent despite expectations for easing earlier in the year.
The breakdown highlights a clear divergence between external and domestic inflation. Tradable inflation edged lower from 2.6% yoy to 2.5% yoy, reflecting softer imported price pressures. In contrast, non-tradable inflation held firm at 3.5% yoy, with a 1.1% quarterly increase.
Energy played a key role in the latest pickup. Petrol prices rose 3.5% in the quarter, reversing earlier declines in January and February, while electricity prices surged 12.5% yoy, remaining the largest contributor to annual inflation for a third consecutive quarter. Even excluding petrol, CPI still rose 0.8% qoq, indicating that inflation pressures are not solely driven by energy.
For the RBNZ, the signal is uncomfortable. While core CPI remains relatively contained at 0.5% qoq and 2.6% yoy, the persistence in non-tradables and the continued influence of energy costs point to upside risks. With inflation still above target and domestic pressures holding firm, expectations for a July rate hike are likely to strengthen, particularly if second-round effects begin to emerge in coming months.
| Data | Latest |
|---|---|
| CPI (qoq) | +0.9% |
| CPI (yoy) | 3.1% |
| Tradable CPI (qoq) | +0.7% |
| Tradable CPI (yoy) | 2.5% |
| Non-tradable CPI (qoq) | +1.1% |
| Non-tradable CPI (yoy) | 3.5% |
| Core CPI (qoq) | +0.5% |
| Core CPI (yoy) | 2.6% |
| CPI ex-petrol (qoq) | +0.8% |
New Zealand Business Confidence Slumps as Conflict Weighs, Inflation Pressures Rise, RBNZ July Hike Expected
New Zealand business confidence deteriorated sharply in the March quarter, with the NZIER Quarterly Survey of Business Opinion showing the general business situation dropping from +39 to +1. The survey highlights how the US–Israel conflict with Iran and disruptions in the Strait of Hormuz, have quickly eroded sentiment despite earlier signs of recovery.
Domestic activity held up better than sentiment suggests. Firms reported trading activity over the past three months improving from -3 to 0, indicating stabilization in near-term demand. However, forward-looking indicators softened, with expected trading activity falling from +22 to +13, pointing to growing caution as external risks intensify.
At the same time, pricing pressures picked up notably. Average selling prices over the past three months rose from +13 to +22, while expectations for the next three months surged from +25 to +43. This suggests that while demand conditions are fragile, firms are still passing through higher costs, particularly from energy and supply chain disruptions linked to the conflict.
For policy, the signal is mixed but important. NZIER sees only "modest" risk of persistently high inflation, but emphasizes elevated uncertainty around energy prices and supply chains. The RBNZ is still expected to begin tightening with a 25 basis-point hike in July, with forward-looking inflation indicators likely to determine the timing.
| Data | Latest (Q1 2026) | Previous (Q4 2025) |
|---|---|---|
| General Business Situation | +1 | +39 |
| Trading Activity (Past 3 Months) | 0 | -3 |
| Trading Activity (Next 3 Months) | +13 | +22 |
| Average Selling Prices (Past 3 Months) | +22 | +13 |
| Average Selling Prices (Next 3 Months) | +43 | +25 |
First impressions: NZ Consumer Price Inflation, March quarter 2026
NZ consumer prices were up 0.9% in Q1, with annual inflation unchanged at 3.1% The result was stronger than expected with firm underlying inflation.
Consumers Price Index, March quarter 2026
Headline inflation
- Quarterly change: +0.9% (prev: +0.6%)
- Westpac forecast: +0.7%
- Market median: +0.8%, range +0.7% to. +1.1%
- Annual change: +3.1% (prev: +3.1%)
- Westpac forecast: +2.8%, RBNZ: +3.0%, Market: +2.9%
Non-tradables
- Quarterly change: +1.1% (prev: +0.6%)
- Westpac forecast: +0.8%
- Annual change: +3.5% (prev: +3.5%)
Tradables
- Quarterly change: +0.7% (prev: +0.7%)
- Westpac forecast: +0.2%
- Annual change: +2.5% (prev: +2.6%)
Consumer prices rose 0.9% in the March quarter. That saw the annual inflation rate remaining unchanged at 3.1%.
The March quarter inflation result was above the 0.7% rise we were expecting, with surprises spread across tradable and non-tradable categories.
The result was also above the RBNZ’s updated forecast from their April policy update for 3% annual inflation.
Importantly, many measures of core inflation have continued to run at levels close to or above the top of the target band. For the RBNZ, that highlights the firm starting point for inflation even before the recent oil price shock.
What contributed to inflation in the March quarter?
Underpinning the March quarter rise in consumer prices were large increases in some specific areas.
- Food prices were up 1.5% over the quarter, underpinned by the usual seasonal increases in the price of fruit, as well as higher prices for confectionary (especially chocolates).
- Unsurprisingly, the other big category that has boosted inflation this quarter were transport costs. The sharp rise in oil prices over the past few weeks has left petrol prices up 3.5% over the quarter, with diesel prices up 11%. Notably, we also saw the early stages of spillovers from high fuel prices into other costs, with domestic airfares up 9% over the quarter.
- In addition to those factors, the March quarter also saw continued increases in electricity charges and the annual increase in the tobacco excise tax. There has also been a big rise in vehicle registration costs and health care costs (the later related to the annual roll-over in the subscription subsidy).
On the downside, we saw a fall in overseas holiday accommodation costs (-4%) and international airfares (-7%). Both of those declines are seasonal, and in the case of international airfares, we are likely to see large increases over the coming months.
On the housing front, rents were flat over the quarter. That was the weakest result since 2001. It’s particularly notable as the start of the year typically sees many rental agreements rolling over and larger increases in rents. This softness comes against a backdrop of low population growth and increases in housing supply, with particularly weak growth in areas like Wellington. We expect housing rental growth will remain muted for some time.
The March quarter also saw a modest 0.5% rise in the cost of a newly built home. Construction cost inflation has been muted for some time. However, there is growing pressure on materials costs, and that’s likely to flow through to larger increases in building costs later in the year.
Annual and core inflation
The annual inflation rate was unchanged at 3.1% in the year to March.
Looking under the surface, prices in the domestically oriented non-tradables group rose 1.1% over the quarter (above expectations). That saw annual non-tradables inflation remaining unchanged at 3.5%.
Non-tradables inflation has been lingering above historic averages. In part, that’s due to the continued large increases in administered prices, like electricity charges which rose 12.5% over the past year. However, prices in other areas have also been firm. Non-tradables excluding housing and utilities costs (which also omits rates) was 3.5% for the year (up from 3.4% at the end of last year). In seasonally adjusted terms, quarterly non-tradables inflation has been running at a rate 0.9% for most of the past year.
Tradables inflation was also hotter than expected in the March quarter (+0.7 qtr, +2.5% yr), with increases seen across a range of discretionary spending categories. That saw annual tradables inflation excluding food and fuel rising to 1.8% (up from 1.7% at the end of last year and the highest it's been since September 2023).
And over the coming quarters, tradable price inflation is set to accelerate sharply. As well as increase global fuel and transport charges, supply chain disruptions are already pushing up the prices for many imported goods.
While the past quarter did see large moves in a few specific areas like food and fuel prices, these aren’t the only areas where we’ve seen firmness in inflation. Despite dropping back over the past year, key measures of core inflation remain in the upper part of the RBNZ’s target band, and several have taken a step higher. (Note: core inflation measures smooth through the quarter-to-quarter swings in inflation and track the underlying trend in prices).
In terms of specifics:
- CPI ex-fuel inflation: +3.2% yr (vs +3.2% previously)
- CPI ex-fuel and food: +3.0% yr (vs +2.9% previously)
- 30% trimmed mean: +2.3%yr (vs +2.5% previously)
- Weighted median +1.6%yr (vs 1.7% previously)
That resilience in core inflation will be important for the RBNZ, highlighting the firm starting point for inflation even before the recent oil price shock
Outlook
This quarter’s result was really just the curtain raiser. Both we and the RBNZ now expect inflation will rise to over 4% in the June quarter. We’ve recently updated our forecasts and had assumed annual inflation would peak at 4.3% in the June quarter, before dropping back to 3.9% by the end of this year. Today's result suggests upside risk to those forecasts
The middle part of the year will see the full brunt of the recent rise in oil prices, as well as related increases in transport and other costs. There will also be a big focus the various survey gauges of forward cost and pricing pressures over the next few months, which will be closely watch for signs of a more enduring lift in inflation.
First Impressions: NZIER Quarterly Survey of Business Opinion, March quarter 2026
Business confidence fell sharply after the Iran conflict, with the gloom deepening over the course of March.
Key results (seasonally adjusted)
- General business situation: +1 (Prev: +39)
- Trading activity, past three months: 0 (Prev: -3)
- Trading activity, next three months: +13 (Prev: +22)
- Average selling prices, past three months: +22 (Prev: +13)
- Average selling prices, next three months: +43 (Prev: +25)
Business confidence has unsurprisingly taken a knock since the Iran war kicked off at the end of February. Indeed, given the fast-moving situation, the headline results of the Quarterly Survey of Business Opinion understate the degree of the shock. Firms noted ongoing cost pressures, and a growing number of them are intending to raise their prices, but their ability to do so remains mixed. Overall, today’s survey probably underscores rather than deepens the dilemma that the RBNZ will be facing in the coming months.
Sentiment about the general business situation fell from +39 to +1, the lowest reading since September 2024 – and that doesn’t come close to telling the full story. Surveying began on 6 March, and the initial batch of responses was a net 34% positive. After the first reminder in mid-March, the next batch was a net 7% negative, and the last batch at the end of March was a whopping net 57% negative. NZIER didn’t provide this breakdown for the other survey questions, but we can reasonably assume that there was a similar deterioration over the course of the month.
The own-activity measure for the last quarter actually picked up a little compared to the December survey, emphasising that the economy was regaining some momentum before the Iran war. Expectations for the next quarter fell from +22 to +13, though again the picture is likely to have looked significantly worse by the end of the survey period.
A net 37% of firms reported a rise in their costs, unchanged from last quarter. Expected costs for the next quarter were a net 45%, up from 39% in December – not a big increase, but this measure was already at elevated levels.
A net 22% of firms increased their prices last quarter, compared to 13% in December. More notably, a net 43% plan to raise their prices in the next quarter, the highest reading since September 2023. Firms’ ability to raise their prices remained mixed across sectors though: for instance, builders reported a sharp rise in costs but a net 25% lowered their own prices last quarter.
Employment was down a net 5% past quarter, after a brief pickup in December, and hiring intentions also turned negative again. That said, there is evidence of labour shortages emerging again for skilled roles, though not for unskilled ones.
Metals in Focus with Ceasefire Uncertainty – Silver (XAG/USD) & Gold (XAU/USD) Intraday Outlook
- Silver, Gold and other metals are struggling to pick-up momentum despite lower Oil prices.
- The Ceasefire is set to expire soon, and both sides seem more reluctant to extend it without a deal.
- Intraday timeframe analysis for XAG/USD and XAU/USD.
After rebounding sporadically over the past two weeks, Gold and other precious commodities have failed to match the broadly positive, euphoric mood currently driving equity markets.
While they initially profited from the first corrective wave in the US Dollar, capital flows have aggressively pivoted toward risk-on assets.
Traditional safe havens, which arguably lost their clear directional sight during the height of the war's panic, are now heavily questioning their role in this new environment—and investors are doing exactly the same.
The geopolitical clock is ticking. The temporary US-Iran ceasefire is officially set to expire by Wednesday, April 22, and both sides appear increasingly reluctant to extend the truce without a finalized, signed agreement in place.
The US Administration is eager for a peaceful resolution but the President communicated that he is also ready to use strength.
Despite Crude Oil dropping back to the $90 handle, metals are struggling to pick up any meaningful bullish momentum while in this tense waiting room.
Should the ceasefire unexpectedly collapse without a diplomatic resolution, precious metals could face a violent, binary reaction.
If WTI Oil manages to remain contained below the critical $100 mark, Gold could absolutely explode higher on a sudden rush of risk-off haven flows, capitalizing on its recent technical correction, and a lack of worsening inflation expectations.
Conversely, more risk-sensitive, industrial-leaning metals like Silver and Copper would likely struggle to catch a sustained bid, facing heavy downward pressure precisely because they are hovering near their current relative highs.
Let's explore the recent shifts in an intraday timeframe analysis of Gold (XAU/USD) and Silver (XAG/USD) to identify where are the key levels to watch for breakouts.
Gold (XAU/USD) 4H Chart and levels
Gold (XAU/USD) 4H Chart, April 20, 2026 – Source: TradingView
Gold has rallied a quite impressive 17% after reaching 4-month lows on March 22, but has failed to breach the quintessential $4,900 resistance.
For bulls to retake the intermediate momentum advantage, they will have to generate a proper push above the psychological level – that could potentially happen if sentiment sours further.
In the immediate outlook however, the 4H 200-period MA is putting bearish pressure, hence if nothing fundamental changes, sellers would have the short-term advantage.
A break below the $4,781 50 MA confirms a turn lower and would push back towards $4,650.
Intraday Timeframe Levels to watch for Gold (XAU/USD):
Resistance Levels:
- $4,800 4H 200-period MA
- $4,850 to $4,900 Major Resistance (bullish above)
- $5,100 Pivotal Resistance
- $5,400 mini-resistance
Support Levels:
- $4,781 50-MA short-term support
- Daily Momentum Pivot $4,675 (bearish below)
- Pivotal Support $4,325 – $4,400
- Main Channel Lows Support $4,100
Silver (XAG/USD) 4H Chart and levels
Silver (XAG/USD) 4H Chart, April 20, 2026 – Source: TradingView
Silver has also rallied strongly from its March 22 lows but is now struggling to extend above the $83 resistance.
Still evolving within a bull channel, traders will have to track its upper ($84.50) and lower bounds ($77) to play breakouts.
If the situation remains confusing as it currently is, expect the channel to consolidate into a range between $77 and $83.
Higher Timeframe Levels to watch for Silver (XAG/USD):
Resistance Levels:
- Major Resistance $83 to $84.50 (Mid-term bullish above)
- Key Range Resistance $90 to $92
- $96.47 March highs (higher odds of All-time highs if break above)
- Current Record $121.67
Support Levels:
- Key Momentum Pivot $75 to $79
- 4H 50 and 200-period MAs ($77)
- December FOMC Minor Support $64 to $66
- $61.10 Past Session lows
- $50 to $55 October Resistance now Major Support
- Silver's 2011 All-time highs $49.81
Safe Trades and a successful week!
Bitcoin’s (BTC/USD) Price Outlook: Bitcoin Shrugs Off Sluggishness and Targets Recent Highs. Is $80000 a Possibility?
- Bitcoin has reclaimed the $76000 handle and maintains a firmly bullish technical structure.
- The $75000 psychological level is acting as a consistent pivot, suggesting sustained institutional interest.
- If buying pressure persists, the primary short-term goal is a run toward the psychological $80000 level, with the ultimate bullish hurdle being $82133.
Bitcoin (BTC/USD) has displayed impressive resilience during the Monday session, shaking off early-morning sluggishness to reclaim the $76000 handle. After a brief period of consolidation, the premier cryptocurrency looks poised to challenge its recent highs, underpinned by a technical structure that continues to favor the "buy the dip" crowd.
Daily Chart: Holding the MA High Ground
The daily timeframe remains the cornerstone of the current bullish thesis. Following the impulsive "V-shaped" recovery throughout early April, Bitcoin has successfully turned previous resistance into rock-solid support.
Key observations on the Daily:
- The SMA Support Sandwich: Bitcoin is currently trading comfortably above its 100-day MA (yellow) at $74145 and its 50-day MA (blue) at $70577.
As long as the pair remains above this "support sandwich," the broader bias remains firmly bullish.
- The $75000 Pivot: The daily candles are showing a consistent ability to close above the $75000 psychological level, suggesting that institutional interest is picking up at these elevated levels.
- RSI Momentum: The Daily RSI is trending at 61, indicating that while momentum is positive, we are still a long way from the "danger zone" of 70+, leaving significant room for a run toward the $82133 hurdle.
Bitcoin (BTC/USD) Daily Chart, April 20, 2026
Source: TradingView.com (click to enlarge)
H4 Chart: The Bullish Base at $74000
Zooming into the H4 chart, we can see a textbook example of healthy trend development. After hitting a local top near $78197, the pair underwent an orderly retracement that found a floor exactly at the 50-period MA (blue), currently at $74632.
The H4 structure has now printed a significant higher low. With the RSI bouncing off its midpoint (58) after a "PIVOT" low signal, the indicators suggest that the corrective phase is over, and the next impulsive leg may be beginning to take shape.
Bitcoin (BTC/USD) Four-Hour Chart, April 20, 2026
Source: TradingView.com (click to enlarge)
H1 Chart: Session Scenarios & Intraday Outlook
The hourly chart provides the most immediate optimism, with Bitcoin slicing back above its 50, 100, and 200-period MAs in a single concerted move.
The Bullish Scenario
For the bulls to maintain this momentum into the Asian and European sessions, we need to see a sustained hold above the $75700 area (the H1 100-MA). A clean break above $76800 would likely trigger a liquidation of short positions, clearing the path for a retest of $78197. If buying pressure persists, a psychological run toward $80000 becomes the primary target.
The Bearish Scenario
The bears need a rejection at current levels and a break back below the $75000 pivot to regain any short-term control. Failure to hold the $74555 level (H1 200-MA) would signal a more prolonged consolidation, likely drawing the price back toward the structural support at $71673.
However, given the current "BULL" labels on the RSI, the bears seem to be on the back foot for now.
Key Levels to Watch:
- Resistance: $78197, $80000, $82133
- Support: $75000, $74145 (Daily 100-MA), $71673
Bitcoin (BTC/USD) One-Hour Chart, April 20, 2026
Source: TradingView.com (click to enlarge)
Bitcoin is effectively "re-loading" for its next major move. The confluence of support between $74,000 and $75,000 has proven to be a formidable base for the bulls. WIll it serve as a base for Bitcoin to finally push beyond the coveted $80000 mark?
ECB Waits for Signals from the Economy. War with Iran Raises Risks to Inflation and Growth in the Euro...
- The ECB says it is still too early to fully assess the economic impact of the Iran conflict on the euro area, so policymakers should closely watch incoming data and avoid rushing into decisions.
- The war creates a classic supply shock: it raises energy and commodity prices, increases inflation risks, and at the same time threatens already weak euro area growth, especially through potential disruptions such as a Strait of Hormuz blockade.
- The ECB’s main concern is whether higher energy costs will trigger longer-lasting “second-round effects” across the economy; if inflation expectations rise and price pressures become persistent, the central bank may have to respond.
The European Central Bank is still unable to clearly assess how strong the full impact of the war with Iran will be on the euro area economy. As Álvaro Santos Pereira, a member of the ECB’s Governing Council, emphasizes, the conflict is too recent to draw firm conclusions, so for now the central bank should closely monitor incoming data and refrain from hasty reactions.
Too early for a full assessment of the conflict’s effects
According to Pereira, the current situation requires caution because this is a classic supply shock. Such shocks usually lead at the same time to weaker economic growth and higher inflation, putting the central bank in a particularly difficult position. On the one hand, energy and commodity prices are rising; on the other, economic activity is weakening. For the euro area, this means worsening conditions, although at this stage the negative impact of the conflict is not yet seen as dramatic.
A supply shock puts the ECB in a difficult position
Pereira notes that the euro area economy is currently somewhere between the ECB’s baseline scenario and the adverse scenario it had considered. Even before the current crisis, economic growth in the euro area had been running at around 1%, which in itself pointed to limited recovery momentum. In this situation, any additional external shock, especially one related to the energy market and geopolitical tensions in the Middle East, increases the risk of a further weakening in economic conditions.
ECB inflation and growth forecast, source: Bloomberg
The ECB is paying particularly close attention to developments surrounding the fighting in the Middle East and the potential consequences for Europe of a blockade of the Strait of Hormuz. This channel could be of key importance for oil prices, transport costs, and more broadly for cost pressures in the economy. For the central bank, however, the most important issue will not be the temporary rise in prices itself, but the possibility of so-called second-round effects. This refers to a situation in which higher energy and commodity prices begin to spread into other sectors of the economy, pushing inflation higher in a more lasting way.
The biggest risk is entrenched inflationary pressure
In Pereira’s view, only clear signs that higher inflation is becoming entrenched, along with rising inflation expectations, should prompt the ECB to react. If such signals appear in the data, the central bank will have to respond. If, however, price pressure proves limited and temporary, it will be more appropriate to continue observing the situation and make decisions with great caution. This is particularly important at a time when less than two weeks remained before the ECB’s next interest-rate decision.
Euro Area Inflation Rate, source: TradingEconomics
Europe needs not only caution, but also reforms
In the Governing Council member’s opinion, short-term caution in monetary policy should not obscure the broader picture. Pereira points out that for more lasting growth, Europe also needs structural measures, above all faster completion of the single market. Deeper economic integration could increase Europe’s resilience to external shocks and improve its long-term growth prospects.
For now, the ECB therefore remains in a mode of vigilant observation. The conflict with Iran is already worsening economic conditions in the euro area, but the scale of its impact has not yet been determined. The coming weeks and incoming data will show whether this is a temporary disruption or the start of stronger and more persistent inflationary pressure that would force the central bank to respond.