Sample Category Title
USD/CHF Daily Outlook
Daily Pivots: (S1) 0.7759; (P) 0.7800; (R1) 0.7824; More….
USD/CHF is still bounded in range above 0.7774 and intraday bias stays neutral at this point. Upside of recovery should be limited below 0.7933 resistance to bring another fall. Sustained break of 61.8% retracement of 0.7603 to 0.8041 at 0.7770 will resume the decline from 0.8041 to retest 0.7603 low.
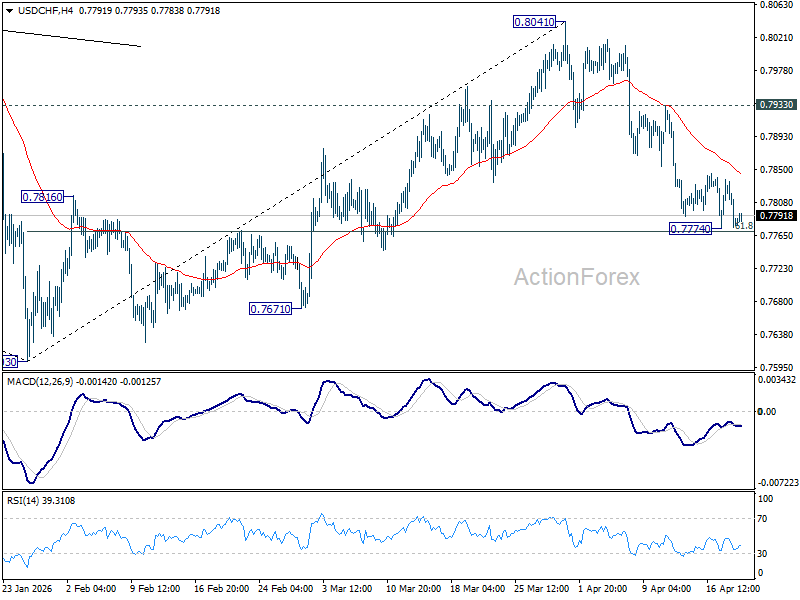
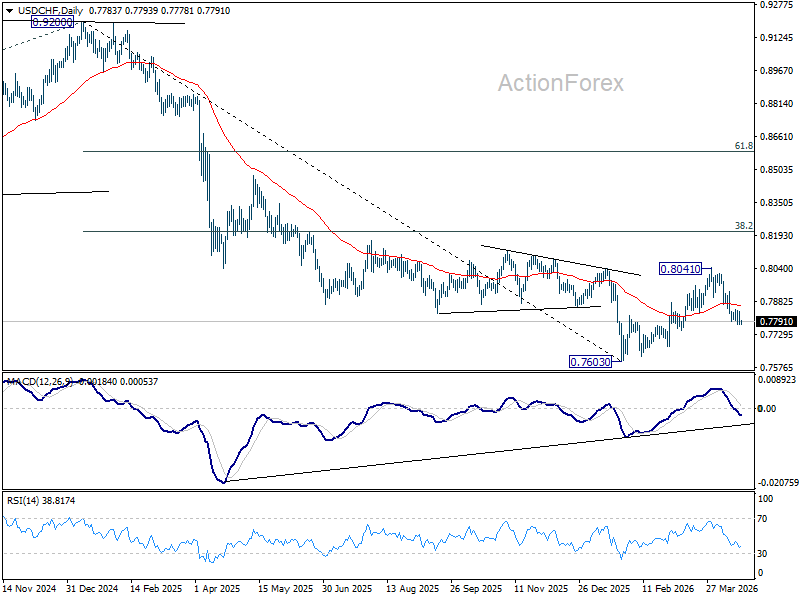
In the bigger picture, rebound from 0.7603 medium term bottom is seen as correcting the fall from 0.9200 only. Rejection by 55 W EMA (now at 0.8059) will affirm this bearish case, and setup down trend resumption to 100% projection of 1.0146 (2022 high) to 0.8332 from 0.9200 at 0.7382 at a later stage. Though, sustained break of 55 W EMA will suggest that it's probably correcting the larger scale down trend from 1.0146 (2022 high).
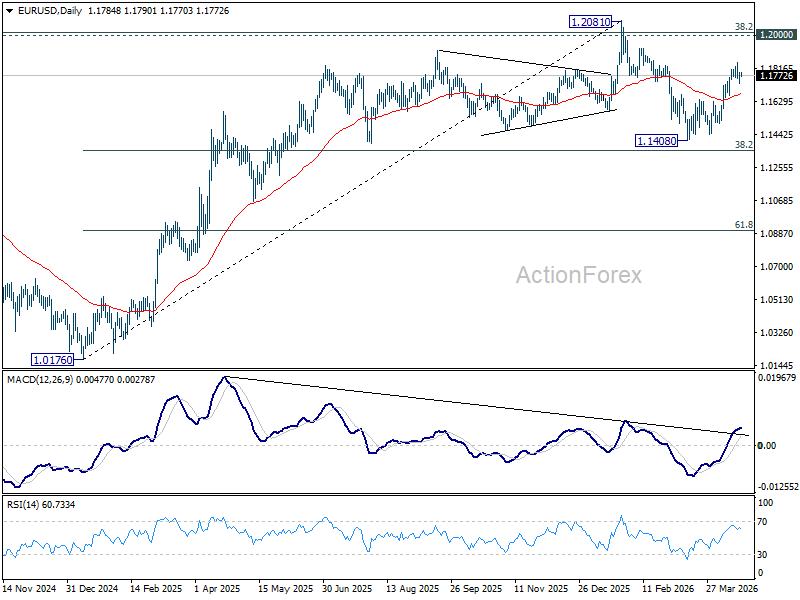
EUR/USD Daily Outlook
Daily Pivots: (S1) 1.1746; (P) 1.1768; (R1) 1.1809; More….
Intraday bias in EUR/USD remains neutral as consolidations continue below 1.1848. Further rally is in favor as long as 1.1662 support holds. On the upside, sustained trading above 61.8% retracement of 1.2081 to 1.1408 at 1.1824 will pave the way to retest 1.2081 high. However, firm break of 1.1662 support will bring deeper decline back towards 1.1408 low instead.
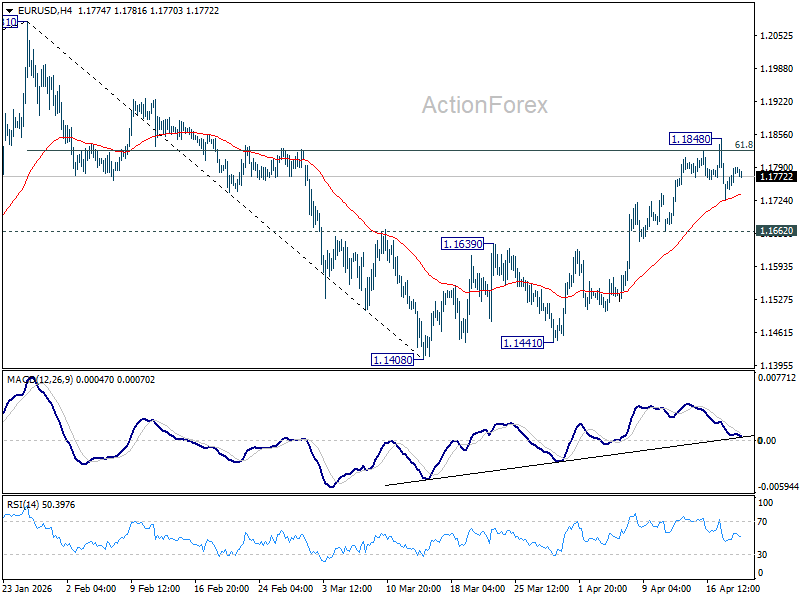
In the bigger picture, the strong support from 38.2% retracement of 1.0176 to 1.2081 at 1.1353 suggests that the pullback from 1.2081 is more likely a corrective move. Strong support was also found in 55 W EMA (now at 1.1507). Focus is back on 1.2 key cluster resistance level. Decisive break there will carry long term bullish implications. Nevertheless, break of 1.1408 support will revive the case of medium term bearish trend reversal.
AUD/USD and NZD/USD Flash Early Signs of Bullish Recovery
AUD/USD is attempting a fresh increase from 0.7115. NZD/USD is consolidating and could aim for a move above 0.5930 in the short term.
Important Takeaways for AUD/USD and NZD/USD Analysis Today
- The Aussie Dollar remained supported above 0.7100 and recovered losses against the US Dollar.
- There is a rising channel forming with resistance at 0.7200 on the hourly chart of AUD/USD at FXOpen.
- NZD/USD is consolidating gains above 0.5900 and 0.5890.
- There is a bullish trend line forming with support at 0.5890 on the hourly chart of NZD/USD at FXOpen.
AUD/USD Technical Analysis
On the hourly chart of AUD/USD at FXOpen, the pair formed a base above 0.7100. The Aussie Dollar started a decent increase above 0.7150 against the US Dollar to enter a short-term positive zone.
The bulls even pushed the pair above the 50% Fib retracement level of the downward move from the 0.7221 swing high to the 0.7114 low and the 50-hour simple moving average. The AUD/USD chart indicates that the pair could struggle to clear the 61.8% Fib retracement at 0.7180.
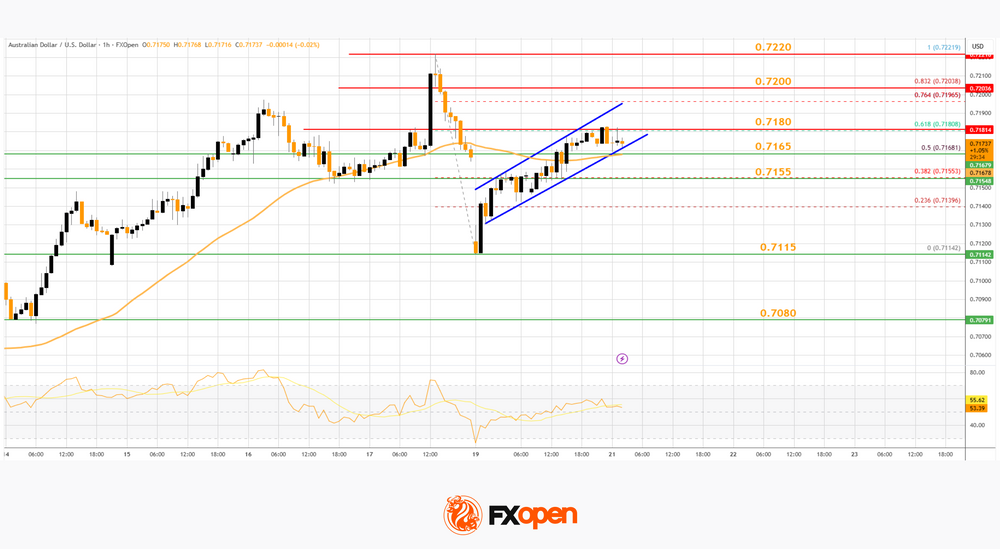
The first major hurdle for the bulls could be 0.7200. There is also a rising channel forming with resistance at 0.7200. An upside break above 0.7200 might send the pair further higher. The next major target might be 0.7220.
Any more gains could clear the path for a move toward 0.7300. If there is no close above 0.7200, the pair might start a fresh decline. Immediate bid zone could be near 0.7165 and the 50-hour simple moving average.
The next area of interest is 0.7155. If there is a downside break below 0.7155, the pair could extend its decline toward 0.7115. Any more losses might signal a move toward 0.7080.
NZD/USD Technical Analysis
On the hourly chart of NZD/USD on FXOpen, the pair also followed AUD/USD. The New Zealand Dollar failed to stay above 0.5920 and corrected gains against the US Dollar.
The pair dipped below 0.5900 and the 50-hour simple moving average. A low was formed at 0.5848, and the pair is now attempting to recover losses. There was a move above the 50% Fib retracement level of the downward move from the 0.5928 swing high to the 0.5848 low.
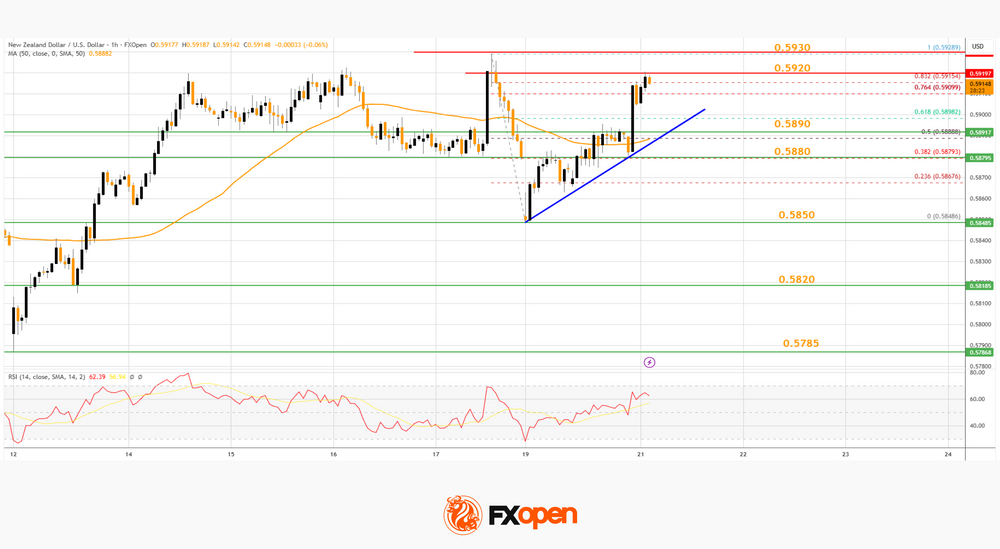
Besides, there is a bullish trend line forming with support at 0.5890. The NZD/USD chart suggests that the RSI is above 50, signaling a short-term positive bias. On the upside, the pair is facing resistance near 0.5920.
The next major hurdle for buyers could be near 0.5930. A clear move above 0.5930 might even push the pair toward 0.5950. Any more gains might clear the path for a move toward the 0.6000 pivot zone in the coming sessions.
On the downside, there is support forming near 0.5890 and the 50-hour simple moving average. If there is a downside break below 0.5890, the pair might slide toward 0.5850. Any more losses could lead NZD/USD into a bearish zone to 0.5820.
Trade over 50 forex markets 24 hours a day with FXOpen. Take advantage of low commissions, deep liquidity, and spreads from 0.0 pips (additional fees may apply). Open your FXOpen account now or learn more about trading forex with FXOpen.
This article represents the opinion of the Companies operating under the FXOpen brand only. It is not to be construed as an offer, solicitation, or recommendation with respect to products and services provided by the Companies operating under the FXOpen brand, nor is it to be considered financial advice.
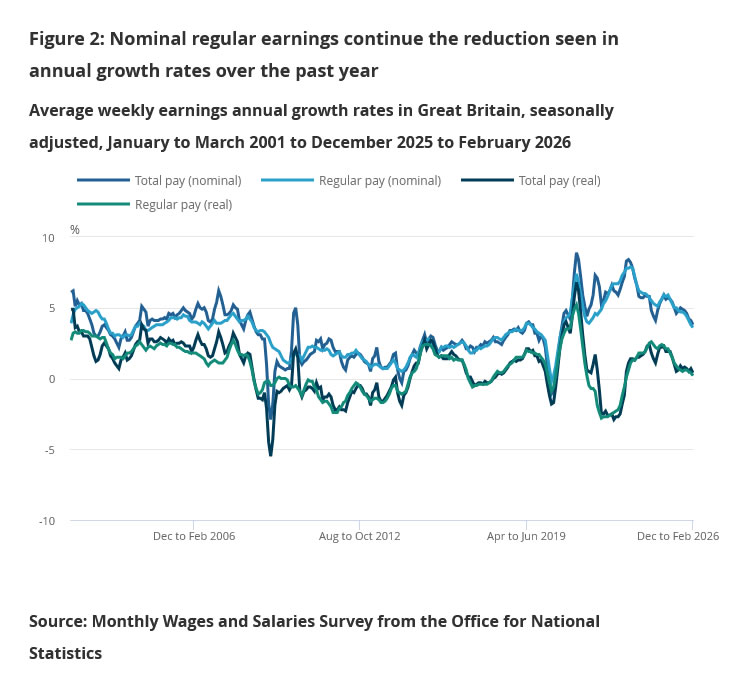
UK Unemployment Falls to 4.9% as Wage Growth Slows to Lowest Since Late 2020
UK labor market data for March pointed to a gradual cooling, with payrolled employment slipping by -11k and claimant count rising by 26.8k, above expectations. Wage growth is also easing. Median monthly pay growth edged down from 4.4% yoy to 4.3% yoy
In the three months to February, regular pay growth (excluding bonus) slowed from 3.8% yoy to 3.6% yoy—the lowest since November 2020. This moderation in earnings points to a softening in inflationary pressure from the labor market.
Despite this, the unemployment rate fell from 5.2% to 4.9%, highlighting a mixed picture.
According to Liz McKeown of ONS, payroll numbers have remained broadly flat amid weak hiring, while vacancies have dropped to their lowest in nearly five years.
| Data | Latest | Previous |
|---|---|---|
| Payrolled Employment | -11k (-0.0%) | |
| Median Monthly Pay Growth | 4.3% | 4.4% |
| Claimant Count Change | +26.8k | |
| Unemployment Rate | 4.9% | 5.2% |
| Pay Growth ex-bonus | 3.6% | 3.8% |
Trump Pushes the Deadline a Day Further in Time
Markets
Oil prices jumped and stocks fell yesterday. It was renewed risk off following the reopening and then closure by Iran again of the Strait of Hormuz and the seizure of an Irian-flagged vessel by the US over the weekend. A barrel of Brent shot up to just shy of $98 at the open before prices started easing slowly throughout the session with a closing price of $94. We’ve witnessed some volatility in late European dealings after president Trump warned it’s “highly unlikely” that the ceasefire would be extended. The two-week truce deadline was widely assumed to be tonight (US time) but Trump yesterday talked about it lapsing Wednesday evening (US time again). The extra day is helpful with both sides, in public at least, showing little signs whatsoever of being on the same page. Some are calling the bluff though and put comfort from Iran - reportedly, we should add - sending a negotiating team to Islamabad after all for a second round of talks today. It may help explain the intraday oil price cooldown as well as the limited drop in US equities in particular. Wall Street fell no more than 0.25%. Core bonds fell with Bunds underperforming Treasuries. German yields rose between 0.4 and 5.1 bps in a bear flattening move. It’s keeping some speculation for an April ECB hike alive but with president Lagarde repeating yesterday that more data is needed, it’s becoming ever unlikely. As long as oil prices stabilize below $100, the central bank could wait and see how things play out first. “So far, we have not seen energy prices rise far enough to push us squarely into our adverse scenario.”, she said. US rates finished marginally higher at the frond end of the curve. The US dollar’s initial strong performance faded during the day. EUR/USD recovered from the lows around 1.173 towards but below the 1.18 barrier. DXY lost some territory. The 98 barrier survived though.
President Trump pushed the deadline a day further in time so that means an additional 24 hours of twiddling thumbs and potential lacklustre trading (not taking into account any possible explosive headlines and tweets). Green equity futures suggest there’s some hope for things not to escalate. In these circumstances it’s impossible to predict the outcome, so the best thing markets can do is how things went in the past. And that more often than not involved TACO. While investors gauge the geopolitics, some attention should also to go the economic calendar. US March retail sales are scheduled for release. The expected boost to the headline print is largely energy-driven since the series are unadjusted for inflation. We’ll be monitoring the underlying series for an actual (early) impact of the Iran war on consumer spending. Trump’s nominee for next Fed chair Warsh will testify before Congress, offering him a chance to map out his view of the institution and policy going forward. Warsh’s appointment is not yet rubberstamped though with one key Republican Senator opposing until the DOJ’s probe into current chair Powell ends.
News & Views
New Zealand inflation accelerated from 0.6% Q/Q in Q4 2025 to 0.9%in Q1 2026 (vs 0.8% consensus estimate). Higher petrol prices were the largest contributor, being up 3.5% Q/Q. Rising costs for pharmaceutical products (+17.7% Q/Q) was another strong driver of quarterly inflation. Other details showed tradeable (goods) CPI sticky at 0.7% Q/Q while non-tradeable (services) CPI accelerated from 0.6% Q/Q to 1.1% Q/Q. On an annual basis inflation held stable above the Reserve Bank of New Zealand’s 2-3% target band, at 3.1% (vs 2.9%). For a third quarter in the row, electricity was the largest upward contributor to the annual number, rising by 12.5% Y/Y. Due to the impact of the war in Iran, NZ CPI is expected to rise further above target in Q2, posing the RBNZ with a dilemma in light of weakening growth and rising unemployment (Q4 2025 unemployment rate was the highest since Q3 2015). NZ money markets attach a 40% probability to a rate hike in May when the central bank publishes new quarterly forecasts. By the following, July, meeting, a 25 bps rate increase is fully discounted. NZD/USD this morning tests the recent tops around 0.5925.
Bloomberg reports that technical tests of the Druzhba pipeline are set to take place today. The pipeline supplies Hungary and Slovakia before it was damaged by a Russian attack in January. Previous Hungarian PM Orban tied the start of disbursements of a €90bn loan to Ukraine to the resumption of oil flows. The new government showed readiness to lift this block immediately if oil shipments restart. Last week, Slovakian PM Fico also changed tack by saying that he will not disrupt EU unity on the loan for Ukraine.
Between Hope and Reality
The week started on a sour note as tensions in the Middle East flared up again over the weekend, and uncertainty remains over what will happen when the two-week ceasefire agreement comes to an end on Wednesday evening, Washington time. Major US and European indices kicked off the week by giving back last week’s gains. That leaves the tech-heavy S&P 500 just a touch below its record high, and the Stoxx 600 some 2.30% lower compared to its February ATH.
Futures are back in positive territory this morning on hopes that the US and Iran will reach an agreement before the Wednesday deadline. That would match the almost two-month pattern of “tensions rise over the weekend, markets sell off on Monday, hesitate on Tuesday, sentiment improves on optimistic — but not necessarily substantiated — announcements from the US, markets rally into Friday, and the weekend brings fresh bad news.”
Crude oil gave back much of its early-week jump during yesterday’s session. US crude retreated nearly 5%, to close Monday up 2.80%, while Brent crude ended the session up only 1.50% and is consolidating near $95pb this morning. As a result, energy stocks barely benefited from the early gains. The SPDR energy sector ETF was broadly flat, reflecting oil’s inability to consolidate gains despite geopolitical tensions.
Why are oil prices falling when the Strait of Hormuz remains closed and prolonged disruptions are expected to constrain energy supply for months? Kuwait Petroleum Corp, for example, declared force majeure yesterday on crude and refined product shipments, saying it won’t be able to meet full obligations due to circumstances beyond its control. The longer the Strait of Hormuz disruptions persist, the scarcer energy becomes, considering that around 20% of global oil flows used to transit through the strait before the conflict. Houthis are also threatening to attack vessels rerouted via the Red Sea. It would take years — investment and sustainably higher oil prices compared to pre-war levels — for other producers like Brazil, Guyana, Suriname and Venezuela to help fill the gap. So why the pullback? Is it just hope?
The answer is likely no. Hope plays a role, but other factors are at work. First, releases from strategic reserves may have temporarily supported supply, though these buffers are diminishing. But more importantly, demand destruction is already underway. Reports suggest European refineries, for example, have reduced demand due to higher input costs — putting downward pressure on prices. This aligns with what we discussed at the start of the conflict: oil prices cannot rise indefinitely, as higher prices ultimately curb demand.
Looking at price action, a downside correction trend appears to be forming despite intense geopolitical uncertainty. From a technical perspective, US crude remains in a bearish consolidation zone below $94pb, which aligns with the 38.2% Fibonacci retracement of this year’s rally, and could retreat toward the $80–87pb range, with or without a resolution in the Middle East — although a peace scenario would likely accelerate the move.
What does this mean for the energy complex? Energy stocks could come under pressure alongside oil prices. On Friday, the SPDR energy ETF has slipped into a medium-term bearish consolidation zone after falling below its own 38.2% Fibonacci retracement. That said, recent price spikes should support earnings, and upcoming results from energy majors will be key. Strong earnings and potential buybacks could help put a floor under the downside.
Elsewhere, technology stocks — particularly AI-related names — are back in focus as recent earnings helped ease concerns about heavy AI spending and uncertain return timelines. The sector continues to operate in its own lane, with ongoing expansion in AI models and applications driving demand for infrastructure. In this context, Marvell Technology surged nearly 6% yesterday after reports that Google is developing new AI chips to compete with Nvidia, while Amazon is investing another $5bn in Anthropic and may add up to $20bn more to stay in course. The Roundhill Magnificent 7 ETF rebounded from a key Fibonacci support level, avoiding a move into medium-term bearish consolidation. With valuations appearing more attractive, investors seem willing to look past concerns around leverage and returns.
Zooming out, the geopolitical and macro backdrop remains fragile, and investors are turning to data to gauge the economic impact of the Iran conflict. Later today, US retail sales are expected to have risen in March, largely due to higher energy prices, while ex-energy sales may show signs of pressure.
The US 2-year yield has eased since its late-March peak, as markets bet that higher energy prices could weigh on growth and eventually prompt a more accommodative monetary stance despite inflation risks.
Today, all eyes turn to Kevin Warsh’s Senate hearing for signals on where Federal Reserve (Fed) policy may be headed next. Warsh has argued that AI-driven productivity gains could help offset inflation, potentially allowing the Fed to cut rates despite a short-term energy-driven price spike. If he maintains that stance, short-term yields could ease further, supporting equities. However, he has also been critical of the Fed’s large balance sheet, and any push for faster normalization could tighten liquidity.
In any case, Fed funds futures are not pricing a rate cut before December. That outlook remains highly dependent on developments in the Middle East and could shift quickly. For now, uncertainty remains the only certainty — but equity markets appear relatively unfazed.
German ZEW, UK Labour Market, and US Retail Sales on the Agenda
In focus today
In Germany, the ZEW indicator for April will be released. The assessment of the current conditions rose last month, while expectations took a historically large hit. As the oil price has declined and the German equity index is up compared to the survey period in March, we expect to see a partial rebound in expectations as this often follows movements in the DAX index while the current situation is likely to decline.
In the UK, we get the February/March labour market report. The previous report added 60K jobs compared to earlier estimates and a feared surge in the unemployment rate was also avoided. In this report, we will particularly take notice whether the decline in wage pressure is broken. The KPMG jobs report suggested wage pressures weakened in March, a key argument for keeping rates unchanged in the Bank of England. On the back of the continued disruption in energy markets, we have removed our expectations of rate cuts and see the BoE on hold for the coming year.
In the US, March retail sales data is released, marking the first hard consumer data since the onset of the war in Iran. February retail sales surprised to the topside but did not reflect possible negative sentiment effects from the war due to timing of data collection.
Also in the US, Fed chair nominee Kevin Warsh will testify before the Senate Banking Committee at his confirmation hearing. A copy of his opening statement reveals that he will emphasise the importance of the Fed's autonomy, stating his commitment to ensuring monetary policy remains 'strictly independent' and that inflation and price stability remain key mandates for the Fed.
Economic and market news
What happened overnight
Oil prices trimmed gains from the prior session following reports that Iran will send a delegation to Pakistan for a second round of negotiations. Meanwhile, President Trump extended the current ceasefire to Wednesday evening Washington time, warning that further extensions are "highly unlikely" without a deal by then.
What happened yesterday
ECB President Christine Lagarde emphasised that the economic implications of the war in Iran have not yet reached the ECB's adverse scenario. Despite rising energy prices, there is no clear evidence of second-round effects to justify rate hikes. Lagarde's remarks suggest that the policy meeting on 30 April is likely too soon for any rate adjustments, as the central bank continues to gather more data. Last week, we tweaked our ECB call, pushing our expected rate hikes from April and June to June and July.
In Japan, Reuters sources said that "the BoJ is likely to hold off raising interest rates..." citing economic and price outlook uncertainty imposed by the war. We now expect the Bank of Japan to keep interest rates unchanged at the April meeting next week. While we think most conditions for a hike are still in place, the BoJ is unlikely to deliver any surprises. As such, we postpone our call for a rate hike to June, which markets currently price as a 50% probability, although this will largely depend on developments in energy markets.
In Canada, March headline inflation rose to 2.4% y/y (prior: 1.8%), slightly below expectations. The Bank of Canada's closely watched core measures remained stable, and Governor Macklem stated on Friday that the central bank is not concerned about a temporary rise in inflation expectations. The print is likely to be neutral for next week's Bank of Canada meeting, where we expect a rate hold in line with market pricing.
Equities: Global equities were somewhat lower yesterday in what initially seemed to be a complete reversal in terms of sector moves relative to Friday's risk-on. That said, late-stage optimism of both US and Iran heading for Pakistan today (latter still to be confirmed) supported risk sentiment with a slight cyclical tilt and the more yield sensitive small caps performing (reflecting strong bank performance). Semiconductors ended its long 13-day gain streak yesterday with a minor decline. Global equities ended 0.3% lower, S&P 500 -0.2%, Nasdaq -0.3%, Russell 2000 0.5% higher. Overnight, US futures and Asian indices are in green.
FI and FX: Renewed uncertainty regarding the ceasefire between US and Iran sent the oil price higher, equities lower and global bond yields modestly higher on Monday with the ceasefire deadline looming Wednesday evening in Washington. However, EUR/USD has remained even surprisingly steady near 1.18 despite the rapidly shifting situation in the Middle East. While we think that the odds of a quick resolution to the war remain low, and a prolonged conflict remains a key downside risk for the cross, moderating energy prices have at least partially eased the negative terms-of-trade shock for now. USD/JPY traded near 159 overnight, as the Iran war continues to weigh on the JPY, with Japan being a large net-importer of energy. The NOK is once again proving remarkably resilient to the setback in risk appetite amid higher energy prices and an empty domestic data calendar. EUR/NOK is consequently back down below the 11.00 figure. Focus for GBP is today on the release of the UK jobs report.
GBP/USD Daily Outlook
Daily Pivots: (S1) 1.3492; (P) 1.3519; (R1) 1.3562; More...
Range trading continues in GBP/USD and intraday bias stays neutral. Further rise is in favor as long as 1.3379 support holds. Sustained break of 61.8% retracement of 1.3867 to 1.3158 at 1.3596 will pave the way to retest 1.3867 high. However, firm break of 1.3379 will bring deeper fall back to 1.3158 low instead.
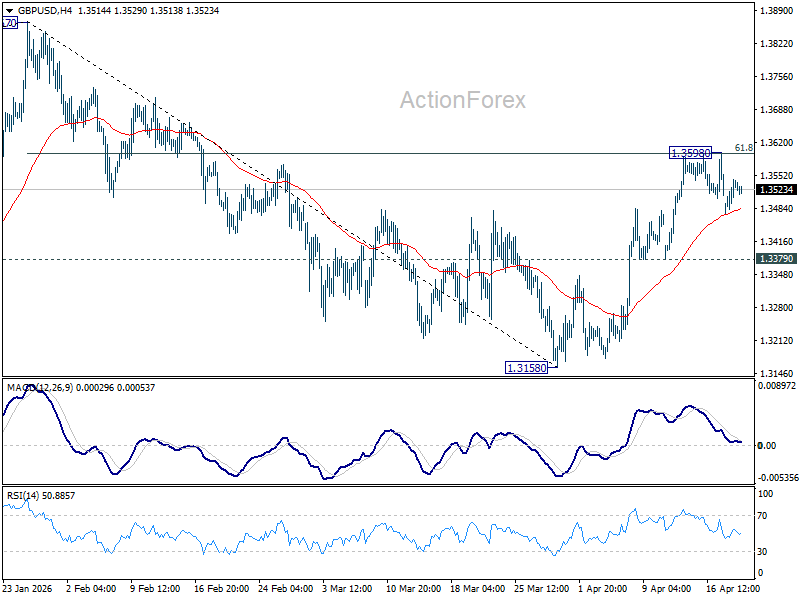
In the bigger picture, current development suggests that price actions from 1.3867 are merely a corrective pattern within the broader up trend from 1.0351 (2022 low). With 1.3008 support intact, medium term bullishness is maintained and break of 1.3867 is back in favor for a later stage, towards 1.4248 key resistance (2021 high).
Markets Hold Near Highs as Traders Avoid Fading Potential US–Iran De-Escalation
The US markets are holding near record highs, not because conviction in de-escalation is strong, but because traders are unwilling to fade the possibility of last-minute progress or extension in US–Iran negotiations. The price action reflects hesitation rather than optimism, with risk assets supported but not advancing.
S&P 500 and NASDAQ hovered close to their peaks overnight, yet the lack of follow-through buying is telling. If markets were fully pricing a peaceful outcome, equities would be breaking decisively higher. Instead, they are consolidating gains, signaling a reluctance to commit.
This creates a distinct dynamic: not a risk-on rally, but a refusal to sell. Traders are effectively caught between rising geopolitical tension and a well-established pattern of brinkmanship followed by de-escalation. The result is positioning that is defensive rather than directional.
The credibility of deadlines has also eroded. The ceasefire, initially expected to expire on Tuesday, has effectively been extended into Wednesday following comments from US President Donald Trump. With multiple extensions already seen since mid-April, markets are increasingly treating deadlines as flexible rather than binding.
Two key assumptions underpin current resilience. First, negotiations could still take place. The reported departure of JD Vance, Jared Kushner, and Steve Witkoff for Islamabad suggests that talks remain a live possibility. This "high-level" deployment is what's keeping the peace trade alive—markets assume Vance wouldn't fly 14 hours if a "no-show" from Tehran was 100% certain.
Second, the possibility of another extension remains firmly in play. The pattern of repeated deadline shifts has conditioned markets to anticipate delay rather than escalation. This expectation is now embedded in positioning.
In the currency markets, Kiwi is currently the strongest one for the day so far, as boosted by increased RBNZ hike bet after Q1 CPI data. But outside of that, currencies are mixed. Loonie is the second strongest and then Dollar. Aussie is currently the worst, followed by Sterling, and then Euro.
In Asia, at the time of writing, Nikkei is up 1.04%. Hong Kong HSI is up 0.58%. China Shanghai SSE is up 0.08%. Singapore Strait Times is up 0.19%. Japan 10-year JGB yield is down -0.014 at 2.385. Overnight, DOW fell -0.01%. S&P 500 fell -0.24%. NASDAQ fell -0.26%. 10-year yield rose 0.004 to 4.250.
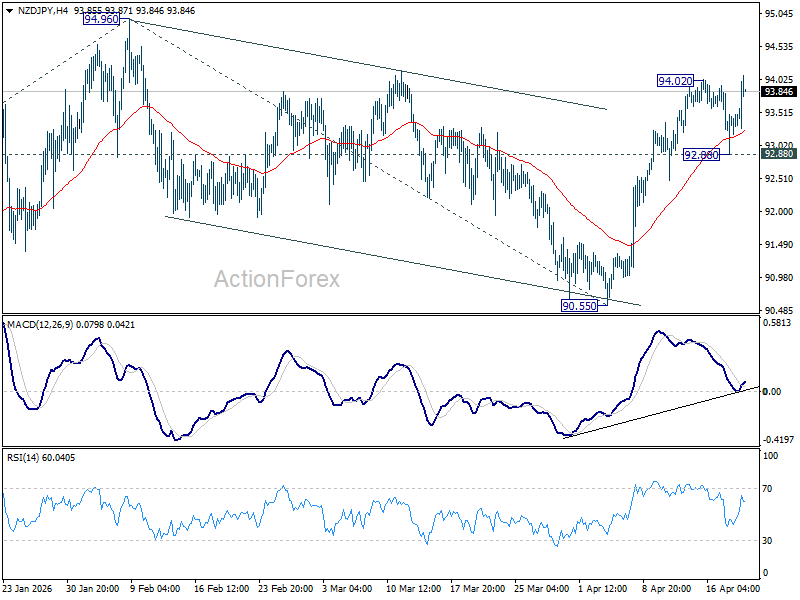
NZD/JPY to Resume Up Trend to 96.50 as Inflation Boosts RBNZ Rate Hike Bets
NZD/JPY is breaking higher as inflation pressures remain firm. With non-tradable prices holding up, markets are strengthening bets on an RBNZ rate hike later this year. The cross now looks ready to resume the medium term up trend towards 96.50 target. Read More.
NZ Inflation Holds at 3.1% as Non-Tradables Stay Firm, Energy Pressures Build
New Zealand inflation isn’t easing as expected. With CPI holding at 3.1% and non-tradable prices still firm, the data points to persistent domestic pressure—keeping RBNZ rate hike expectations alive. Read More.
New Zealand Business Confidence Slumps as Conflict Weighs, Inflation Pressures Rise, RBNZ July Hike Expected
New Zealand business confidence has dropped sharply as geopolitical tensions weigh on outlook—but pricing pressures are rising. With firms still lifting prices, NZIER sees the RBNZ moving toward a July rate hike. Read More.
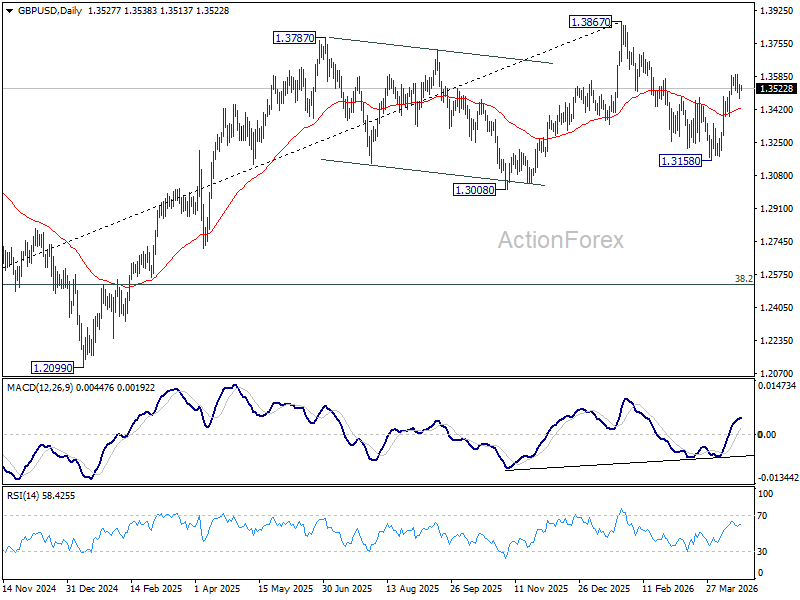
GBP/USD Daily Outlook
Daily Pivots: (S1) 1.3492; (P) 1.3519; (R1) 1.3562; More...
Range trading continues in GBP/USD and intraday bias stays neutral. Further rise is in favor as long as 1.3379 support holds. Sustained break of 61.8% retracement of 1.3867 to 1.3158 at 1.3596 will pave the way to retest 1.3867 high. However, firm break of 1.3379 will bring deeper fall back to 1.3158 low instead.
In the bigger picture, current development suggests that price actions from 1.3867 are merely a corrective pattern within the broader up trend from 1.0351 (2022 low). With 1.3008 support intact, medium term bullishness is maintained and break of 1.3867 is back in favor for a later stage, towards 1.4248 key resistance (2021 high).
NZD/JPY to Resume Up Trend to 96.50 as Inflation Boosts RBNZ Rate Hike Bets
NZD/JPY surged as New Zealand inflation data reinforced expectations for a Reserve Bank of New Zealand rate hike later in the year, with markets responding to persistent price pressures despite soft demand signals. The technical setup suggests NZD/JPY is ready to resume its medium-term uptrend toward 96.50 target.
Q1 CPI came in stronger than expected, holding at 3.1% yoy, keeping inflation above the RBNZ’s target band and supporting the case for further policy tightening. More importantly, the composition matters. While tradable inflation eased slightly, non-tradable inflation held firm at 3.5% yoy, pointing to ongoing domestic price pressures that are harder for policymakers to ignore.
However, at the same time, the NZIER survey paints a more cautious picture on growth. Business confidence deteriorated sharply, and firms reported weak demand conditions, with limited ability to pass on rising costs. This dynamic acts as a natural constraint on inflation, reducing the urgency for immediate policy action.
For the RBNZ, the signal is nuanced. Inflation is firming and supports the case for tightening, but weak demand allows the central bank to move gradually. The base case remains for a hold at the May 27 meeting, with policymakers likely to use a higher OCR track to lay the groundwork for a hike in July or September.
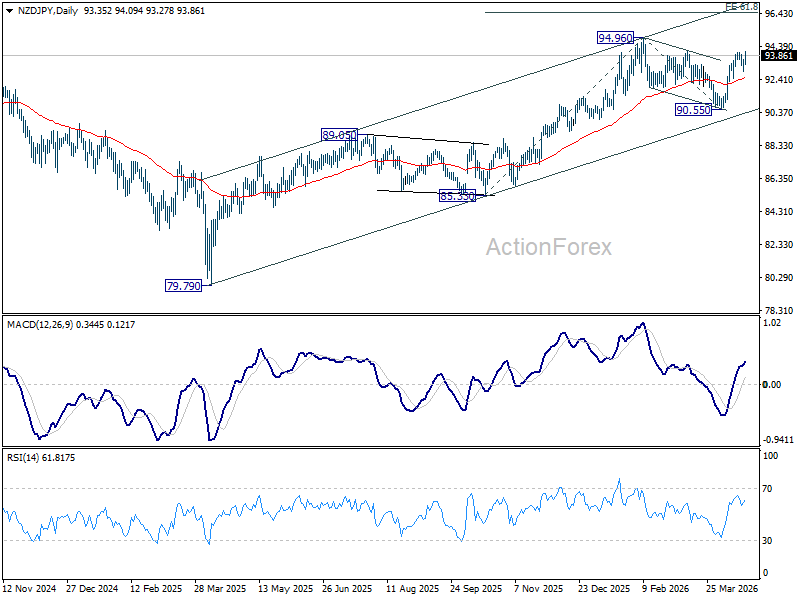
Technically, NZD/JPY's rise from 90.55 resumed today by breaching 94.02 temporary top. The development reinforces that case that corrective fall from 94.96 has completed with three waves down to 90.55. That is, up trend from 79.79 might be ready to resume. For now, further rise is expected as long as 92.88 support holds. Retest of 94.96 should be seen next. Firm break there will pave the way to 61.8% projection of 85.33 to 94.96 from 90.55 at 96.50.