Sample Category Title
Forex and Cryptocurrency Forecast
EUR/USD: Who Controls the Financial Market
It is clear that interest rates rule the markets, not only in terms of actual changes but also regarding expectations about the timing and magnitude of future changes. From spring 2022 to mid-2023, the focus was on raising rates; now, the expectation has shifted towards their reduction. Traders are still uncertain about the Federal Reserve's decisions and timing, leading them to scrutinize macroeconomic statistics primarily for their impact on the likelihood of monetary policy easing by the regulator.
At the beginning of last week, the dollar was under pressure due to weak data on business activity (PMI) in the US manufacturing sector. On Monday, 3 June, the Institute for Supply Management (ISM) reported that manufacturing activity in the country decreased in May from 49.2 to 48.7 points (forecast 49.6). As the index remained in contraction territory (below 50), there was renewed speculation among traders and investors about a possible Fed rate cut in September.
The US currency received some support from business activity data in the services sector. This time, the PMI was 53.8 points, higher than both the previous value of 49.4 and the forecast of 50.8, which slightly pleased the dollar bulls.
Thursday, 6 June, was relatively calm. The European Central Bank's Governing Council lowered the interest rate by 25 basis points (bps) to 4.25%, as expected. This step fully aligned with forecasts and was already factored into EUR/USD quotes. Notably, the ECB had not lowered rates since 2019, began raising them in July 2022, and kept them unchanged at the same level during the last five meetings. Since September 2023, inflation in the Eurozone has decreased by more than 2.5%, allowing the regulator to take this step for the first time in a long while.
The ECB's statement following the meeting indicated that despite the rate cut, its monetary policy remains restrictive. The regulator forecasts that inflation will likely remain above the 2.0% target this year and next. Therefore, interest rates will remain at restrictive levels as long as necessary to achieve the inflation goal. The ECB raised its forecast for inflation, now expecting CPI to average 2.5% in 2024, 2.2% in 2025, and 1.9% in 2026м.
As mentioned, the ECB's current decision was fully anticipated by the market, as predicted by all 82 economists surveyed by Reuters at the end of May. The more intriguing aspect is what will happen next. More than two-thirds of Reuters respondents (55 out of 82) believe that the ECB's Governing Council will cut the rate twice more this year – in September and December. This figure has increased compared to the April survey, where just over half of the economists made such a prediction.
A local triumph for the dollar bulls occurred on Friday, 7 June, when the US Department of Labour report was released. The number of new jobs in the non-farm sector (NFP) was 272K in May, compared to the expected 185K. This result was significantly higher than the revised April figure of 165K. The data also showed a more substantial than expected increase in the average hourly earnings, an inflationary indicator, which grew by 0.4%, double the previous value of 0.2% and one and a half times higher than the forecast of 0.3%. The only slight negative was the unemployment rate, which unexpectedly rose from 3.9% to 4.0%. However, overall, this data benefited the dollar, and the EUR/USD pair, having bounced off the upper boundary of the 3.5-week sideways channel at 1.0900, ended the five-day period at its lower boundary of 1.0800.
Regarding the analysts' forecast for the near future, as of the evening of 7 June, it is quite vague: 40% of experts voted for the pair's growth, and an equal number (40%) for its fall, with the remaining 20% maintaining neutrality. Technical analysis also provides no clear guidance. Among trend indicators on D1, 25% are green and 75% are red. Among oscillators, 25% are green, 15% neutral-grey, and 60% red, though a third of them signal the pair is oversold. The nearest support levels are 1.0785, then 1.0725-1.0740, 1.0665-1.0680, and 1.0600-1.0620. Resistance zones are at 1.0865-1.0895, then 1.0925-1.0940, 1.0980-1.1010, 1.1050, and 1.1100-1.1140.
The upcoming week also promises to be quite interesting. The key day will be Wednesday, 12 June. On this day, consumer inflation (CPI) data for Germany and the United States will be released, followed by the FOMC (Federal Open Market Committee) meeting of the US Fed. It is expected that the regulator will keep the key interest rate unchanged at 5.50%. Therefore, market participants will be more focused on the FOMC's Economic Projections Summary and the subsequent press conference by the Fed leadership. The next day, Thursday, 13 June, will see the release of US Producer Price Index (PPI) data and initial jobless claims numbers. At the end of the week, on Friday, 14 June, the Fed's Monetary Policy Report will be available for review.
USD/JPY: Finance Minister Responds to Questions
A week ago, we wrote that Japanese financial authorities had not confirmed whether they conducted intensive yen purchases on 29 April and 1 May to support its exchange rate. Bloomberg estimated that around ¥9.4 trillion ($60 billion) might have been spent on these currency interventions, setting a new monthly record for such financial operations. We questioned the long-term or even medium-term effectiveness of this expenditure.
It seems that Japan's Finance Minister, Shunichi Suzuki, read our review, as he hastened to provide answers to the questions posed. In his statement, he first confirmed that (quote): "the decline in Japan's foreign reserves at the end of May partially reflects currency interventions." This suggests that yen purchases indeed took place. Additionally, the minister noted, "the effectiveness of such interventions should be considered," indicating his doubts about their feasibility.
Suzuki refrained from commenting on the size of the intervention funds but mentioned that while there is no limit on funds for currency interventions, their use would be limited.
As previously mentioned, besides interventions (and the fear of them), another way to support the national currency is through tightening the monetary policy of the Bank of Japan (BoJ). Early last week, yen received support from rumours that the BoJ is considering reducing the volume of its quantitative easing (QE) programme. Such a decision could decrease demand for Japanese government bonds (JGBs), increase their yields (which inversely correlates with prices), and positively impact the yen's exchange rate. The Bank of Japan is expected to discuss reducing bond purchases at its meeting next Friday, 14 June.
On Tuesday, 4 June, BoJ Deputy Governor Ryozo Himino confirmed concerns that a weak yen could negatively impact the economy and cause inflation to rise. According to him, a low national currency rate increases the cost of imported goods and reduces consumption, as people delay purchases due to high prices. However, Ryozo Himino stated that the Bank of Japan would prefer inflation driven by wage growth, as this would lead to increased household spending and consumption.
The yen received another blow from the dollar after the publication of US labour market data on 7 June. The USD/JPY pair surged as wage growth in the US sharply contrasted with the 25th consecutive month of declining wages in Japan in April.
As the saying goes, hope dies last. Investors remain hopeful that the regulator will actively combat the yen's depreciation, creating long-term factors for USD/JPY to decline. For now, it ended the week at 156.74.
The median forecast of analysts for the near term is as follows: 75% voted for the pair's decline and yen strengthening ahead of the BoJ meeting, while the remaining 25% took a neutral stance. None favoured the pair's upward movement. Technical analysis, however, presents a different picture: 100% of trend indicators on D1 are green. Among oscillators, 35% are green, 55% neutral-grey, and only 10% red. The nearest support level is around 156.00-156.25, followed by zones and levels at 155.45, 154.50-154.70, 153.10-153.60, 151.85-152.35, 150.80-151.00, 149.70-150.00, 148.40, and 147.30-147.60, with 146.50 being the furthest. The closest resistance is in the zone of 157.05-157.15, then 157.70-158.00, 158.60, and 160.00-160.20.
Noteworthy events in the coming week include Monday, 10 June, when Japan's Q1 2024 GDP data will be released, and, of course, Friday, 14 June, when the Bank of Japan's Governing Council will make decisions on future monetary policy. However, like the Fed, the yen interest rate is likely to remain unchanged.
CRYPTOCURRENCIES: What Drives and Will Drive Bitcoin Upwards
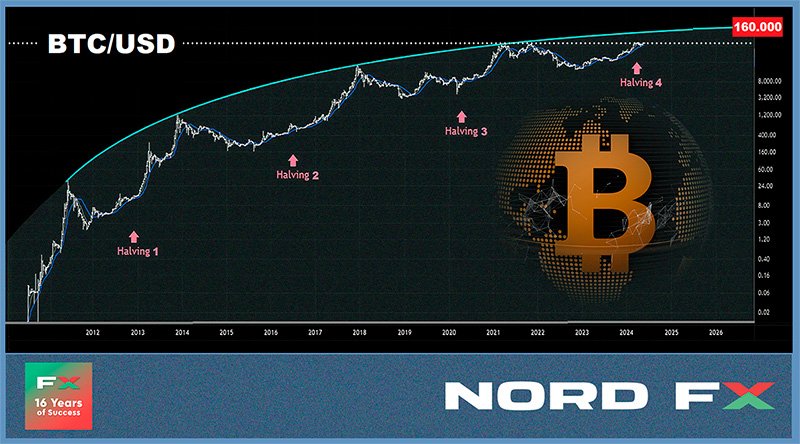
The launch of spot bitcoin ETFs in January caused an explosive price increase for the leading cryptocurrency. On 12 March, inflows into these funds reached $1 billion, and by 13 March, BTC/USD set a new all-time high, rising to $73,743. Then came a lull, followed by a post-halving correction, and finally, growth resumed in May. Early last week, net inflows into BTC-ETFs amounted to $887 million, the second largest in these funds' history. As a result, BTC/USD broke the $70,000 level and recorded a local high at $71,922.
Young whales (holding over 1,000 BTC) demonstrated noticeable accumulation, adding $1 billion daily to their wallets. CryptoQuant's head, Ki Young Ju, notes that their current behaviour resembles 2020. At that time, consolidation around $10,000 lasted about six months, after which the price increased 2.5 times in three months. Key representatives of these young whales include major institutional investors from the US, who accounted for a third of all capital inflows into spot BTC-ETFs in Q1 (about $4 billion) from companies with over $100 million in assets under management.
Besides BTC-ETFs, the recent growth was significantly influenced by April's halving. The Hash Ribbons indicator is giving an "optimal signal" to buy digital gold in the coming weeks, indicating a resumption of the asset's rally, according to Capriole Investments founder Charles Edwards. The metric shows miner capitulation that began two weeks ago. This period occurs when the 30-day moving average of the hash rate falls below the 60-day rate.
According to Edwards, miner capitulation happens roughly once a year, typically due to operational halts, bankruptcies, takeovers, or, as in this case, halving. The halving of the block reward makes equipment unprofitable, leading to its shutdown and hash rate decline. The last miner capitulation was in September 2023, when bitcoin traded around $25,000.
In the event of a new growth impulse, Edwards predicts the next medium-term target will be $100,000. However, he warns that summer traditionally sees a lull in financial markets, so the upward impulse might be delayed.
Wall Street legend and Factor LLC head Peter Brandt highlights the "remarkable symmetry" of market cycles, with halving halving the weeks between the bottom and the peak. If Brandt's model is correct, BTC should reach a peak between $130,000-160,000 by September next year.
Venture investor Chamath Palihapitiya offers a much more optimistic forecast. Analysing bitcoin's post-halving dynamics, he notes the cryptocurrency achieved its greatest growth 12-18 months after the event. Palihapitiya predicts that if the growth trajectory after the third halving is repeated, bitcoin's price could reach $500,000 by October 2025. Using the average figures of the last two cycles, the target is $1.14 million.
For the coming weeks, analyst Rekt Capital believes digital gold will need to confidently overcome the $72,000-$73,000 resistance zone to enter a "parabolic growth phase." Popular cryptocurrency expert Ali Martinez forecasts BTC will likely test the $79,600 price range. AI PricePredictions suggests that bitcoin could not only firmly establish above the critical $70,000 mark but also continue growing, reaching $75,245 by the end of June. This prediction is based on technical analysis indicators like the Relative Strength Index (RSI), Bollinger Bands (BB), and Moving Average Convergence Divergence (MACD).
Two catalysts could drive the upcoming growth of the crypto market: the launch of spot exchange-traded funds based on Ethereum after SEC approval of S-1 applications, and the US presidential elections. According to Bloomberg exchange analyst James Seyffart, the SEC might approve the applications by mid-June, although it could take "weeks or months." JPMorgan experts believe the SEC's decision on ETH-ETFs was politically motivated ahead of the US presidential elections. These elections themselves are the second catalyst for a bull rally.
A recent Harris Poll survey, sponsored by BTC-ETF issuer Grayscale, found that geopolitical tensions and inflation are prompting more American voters to consider bitcoin. The survey, which included over 1,700 potential US voters, revealed that 77% believe presidential candidates should at least have some understanding of cryptocurrencies. Additionally, 47% plan to include cryptocurrencies in their investment portfolios, up from 40% last year. Notably, 9% of elderly voters reported increased interest in bitcoin and other crypto assets following BTC-ETF approval. According to NYDIG, the total cryptocurrency community in the US currently numbers over 46 million citizens, or 22% of the adult population.
Evaluating this situation, Wences Casares, Argentine entrepreneur and CEO of venture company Xapo, believes the US could be one of the first to adopt a dual currency system. In this case, the dollar would be used for transactions with everyday goods and services, while cryptocurrency would be a store of value.
At the time of writing, the evening of Friday, 7 June, BTC/USD trades at $69,220. The total crypto market capitalisation stands at $2.54 trillion ($2.53 trillion a week ago). The Crypto Fear & Greed Index rose from 73 to 77 points over the week, moving from the Greed zone to the Extreme Greed zone.
In conclusion, the forecast for the next potential candidate for a spot ETF launch in the US after bitcoin and Ethereum. Galaxy Digital CEO Mike Novogratz believes it will be Solana, which showed impressive results over the past year. At the end of 2023, SOL was around $21 but exceeded $200 by March 2024, showing nearly tenfold growth. Currently, SOL is around $172 and ranks fifth in market capitalisation. Given Solana's current position, Novogratz is confident this altcoin has a good chance of being included in the pool of spot ETFs. Recently, BKCM investment company CEO Brian Kelly expressed a similar view.
Summary 6/10 – 6/14
Monday, Jun 10, 2024
| GMT | Ccy | Events | Consensus | Previous |
|---|---|---|---|---|
| 23:50 | JPY | Bank Lending Y/Y May | 3.10% | 3.10% |
| 23:50 | JPY | GDP Q/Q Q1 F | -0.50% | -0.50% |
| 23:50 | JPY | GDP Deflator Y/Y Q1 F | 3.70% | 3.60% |
| 23:50 | JPY | Current Account (JPY) Apr | 2.06T | 2.01T |
| 05:00 | JPY | Eco Watchers Survey: Current May | 48.9 | 47.4 |
| 08:00 | EUR | Itay Industrial Output M/M Apr | 0.30% | -0.50% |
| 08:30 | EUR | Eurozone Sentix Investor Confidence Jun | -1.9 | -3.6 |
| 23:50 | JPY | Money Supply M2+CD Y/Y May | 2.10% | 2.20% |
| GMT | Ccy | Events | |
|---|---|---|---|
| 23:50 | JPY | Bank Lending Y/Y May | |
| Forecast: 3.10% | Previous: 3.10% | ||
| 23:50 | JPY | GDP Q/Q Q1 F | |
| Forecast: -0.50% | Previous: -0.50% | ||
| 23:50 | JPY | GDP Deflator Y/Y Q1 F | |
| Forecast: 3.70% | Previous: 3.60% | ||
| 23:50 | JPY | Current Account (JPY) Apr | |
| Forecast: 2.06T | Previous: 2.01T | ||
| 05:00 | JPY | Eco Watchers Survey: Current May | |
| Forecast: 48.9 | Previous: 47.4 | ||
| 08:00 | EUR | Itay Industrial Output M/M Apr | |
| Forecast: 0.30% | Previous: -0.50% | ||
| 08:30 | EUR | Eurozone Sentix Investor Confidence Jun | |
| Forecast: -1.9 | Previous: -3.6 | ||
| 23:50 | JPY | Money Supply M2+CD Y/Y May | |
| Forecast: 2.10% | Previous: 2.20% | ||
Tuesday, Jun 11, 2024
| GMT | Ccy | Events | Consensus | Previous |
|---|---|---|---|---|
| 01:30 | AUD | NAB Business Confidence May | 1 | |
| 01:30 | AUD | NAB Business Conditions May | 7 | |
| 06:00 | GBP | ILO Unemployment Rate (3M) Apr | 4.30% | 4.30% |
| 06:00 | GBP | Average Earnings Including Bonus 3M/Y Apr | 5.70% | 5.70% |
| 06:00 | GBP | Average Earnings Excluding Bonus 3M/Y Apr | 6% | |
| 06:00 | GBP | Claimant Count Change May | 10.2K | 8.9K |
| 10:00 | USD | NFIB Business Optimism Index May | 89.8 | 89.7 |
| 12:30 | CAD | Building Permits M/M Apr | 5.20% | -11.70% |
| 23:50 | JPY | PPI Y/Y May | 2.00% | 0.90% |
| GMT | Ccy | Events | |
|---|---|---|---|
| 01:30 | AUD | NAB Business Confidence May | |
| Forecast: | Previous: 1 | ||
| 01:30 | AUD | NAB Business Conditions May | |
| Forecast: | Previous: 7 | ||
| 06:00 | GBP | ILO Unemployment Rate (3M) Apr | |
| Forecast: 4.30% | Previous: 4.30% | ||
| 06:00 | GBP | Average Earnings Including Bonus 3M/Y Apr | |
| Forecast: 5.70% | Previous: 5.70% | ||
| 06:00 | GBP | Average Earnings Excluding Bonus 3M/Y Apr | |
| Forecast: | Previous: 6% | ||
| 06:00 | GBP | Claimant Count Change May | |
| Forecast: 10.2K | Previous: 8.9K | ||
| 10:00 | USD | NFIB Business Optimism Index May | |
| Forecast: 89.8 | Previous: 89.7 | ||
| 12:30 | CAD | Building Permits M/M Apr | |
| Forecast: 5.20% | Previous: -11.70% | ||
| 23:50 | JPY | PPI Y/Y May | |
| Forecast: 2.00% | Previous: 0.90% | ||
Wednesday, Jun 12, 2024
| GMT | Ccy | Events | Consensus | Previous |
|---|---|---|---|---|
| 01:30 | CNY | CPI Y/Y May | 0.30% | 0.30% |
| 01:30 | CNY | PPI Y/Y May | -1.80% | -2.50% |
| 06:00 | GBP | GDP M/M Apr | 0.00% | 0.40% |
| 06:00 | GBP | Industrial Production M/M Apr | -0.10% | 0.20% |
| 06:00 | GBP | Industrial Production Y/Y Apr | 0.50% | |
| 06:00 | GBP | Manufacturing Production M/M Apr | -0.20% | 0.30% |
| 06:00 | GBP | Manufacturing Production Y/Y Apr | 2.30% | |
| 06:00 | GBP | Goods Trade Balance (GBP) Apr | -14.0B | |
| 06:00 | EUR | Germany CPI M/M May F | 0.10% | 0.10% |
| 06:00 | EUR | Germany CPI Y/Y May F | 2.40% | 2.40% |
| 12:30 | USD | CPI M/M May | 0.20% | 0.30% |
| 12:30 | USD | CPI Y/Y May | 3.40% | 3.40% |
| 12:30 | USD | CPI Core M/M May | 0.30% | 0.30% |
| 12:30 | USD | CPI Core Y/Y May | 3.50% | 3.60% |
| 14:30 | USD | Crude Oil Inventories | 1.2M | |
| 18:00 | USD | Fed Interest Rate Decision | 5.50% | 5.50% |
| 18:30 | USD | FOMC Press Conference | ||
| 23:01 | GBP | RICS Housing Price Balance May | -5% | -5% |
| 23:50 | JPY | BSI Large Manufacturing Conditions Index Q2 | -5.2 | -6.7 |
| GMT | Ccy | Events | |
|---|---|---|---|
| 01:30 | CNY | CPI Y/Y May | |
| Forecast: 0.30% | Previous: 0.30% | ||
| 01:30 | CNY | PPI Y/Y May | |
| Forecast: -1.80% | Previous: -2.50% | ||
| 06:00 | GBP | GDP M/M Apr | |
| Forecast: 0.00% | Previous: 0.40% | ||
| 06:00 | GBP | Industrial Production M/M Apr | |
| Forecast: -0.10% | Previous: 0.20% | ||
| 06:00 | GBP | Industrial Production Y/Y Apr | |
| Forecast: | Previous: 0.50% | ||
| 06:00 | GBP | Manufacturing Production M/M Apr | |
| Forecast: -0.20% | Previous: 0.30% | ||
| 06:00 | GBP | Manufacturing Production Y/Y Apr | |
| Forecast: | Previous: 2.30% | ||
| 06:00 | GBP | Goods Trade Balance (GBP) Apr | |
| Forecast: | Previous: -14.0B | ||
| 06:00 | EUR | Germany CPI M/M May F | |
| Forecast: 0.10% | Previous: 0.10% | ||
| 06:00 | EUR | Germany CPI Y/Y May F | |
| Forecast: 2.40% | Previous: 2.40% | ||
| 12:30 | USD | CPI M/M May | |
| Forecast: 0.20% | Previous: 0.30% | ||
| 12:30 | USD | CPI Y/Y May | |
| Forecast: 3.40% | Previous: 3.40% | ||
| 12:30 | USD | CPI Core M/M May | |
| Forecast: 0.30% | Previous: 0.30% | ||
| 12:30 | USD | CPI Core Y/Y May | |
| Forecast: 3.50% | Previous: 3.60% | ||
| 14:30 | USD | Crude Oil Inventories | |
| Forecast: | Previous: 1.2M | ||
| 18:00 | USD | Fed Interest Rate Decision | |
| Forecast: 5.50% | Previous: 5.50% | ||
| 18:30 | USD | FOMC Press Conference | |
| Forecast: | Previous: | ||
| 23:01 | GBP | RICS Housing Price Balance May | |
| Forecast: -5% | Previous: -5% | ||
| 23:50 | JPY | BSI Large Manufacturing Conditions Index Q2 | |
| Forecast: -5.2 | Previous: -6.7 | ||
Thursday, Jun 13, 2024
| GMT | Ccy | Events | Consensus | Previous |
|---|---|---|---|---|
| 01:30 | AUD | Employment Change May | 39.0K | 38.5K |
| 01:30 | AUD | Unemployment Rate May | 4.00% | 4.10% |
| 06:30 | CHF | PPI M/M May | 0.50% | 0.60% |
| 06:30 | CHF | PPI Y/Y May | -1.80% | |
| 09:00 | EUR | Eurozone Industrial Production M/M Apr | 0.10% | 0.60% |
| 12:30 | USD | PPI M/M May | 0.20% | 0.50% |
| 12:30 | USD | PPI Y/Y May | 2.20% | 2.20% |
| 12:30 | USD | PPI Core M/M May | 0.30% | 0.50% |
| 12:30 | USD | PPI Core Y/Y May | 2.30% | 2.40% |
| 12:30 | USD | Initial Jobless Claims (Jun 7) | 227K | 229K |
| 14:30 | USD | Natural Gas Storage | 98B | |
| 22:30 | NZD | Business NZ PMI May | 48.9 |
| GMT | Ccy | Events | |
|---|---|---|---|
| 01:30 | AUD | Employment Change May | |
| Forecast: 39.0K | Previous: 38.5K | ||
| 01:30 | AUD | Unemployment Rate May | |
| Forecast: 4.00% | Previous: 4.10% | ||
| 06:30 | CHF | PPI M/M May | |
| Forecast: 0.50% | Previous: 0.60% | ||
| 06:30 | CHF | PPI Y/Y May | |
| Forecast: | Previous: -1.80% | ||
| 09:00 | EUR | Eurozone Industrial Production M/M Apr | |
| Forecast: 0.10% | Previous: 0.60% | ||
| 12:30 | USD | PPI M/M May | |
| Forecast: 0.20% | Previous: 0.50% | ||
| 12:30 | USD | PPI Y/Y May | |
| Forecast: 2.20% | Previous: 2.20% | ||
| 12:30 | USD | PPI Core M/M May | |
| Forecast: 0.30% | Previous: 0.50% | ||
| 12:30 | USD | PPI Core Y/Y May | |
| Forecast: 2.30% | Previous: 2.40% | ||
| 12:30 | USD | Initial Jobless Claims (Jun 7) | |
| Forecast: 227K | Previous: 229K | ||
| 14:30 | USD | Natural Gas Storage | |
| Forecast: | Previous: 98B | ||
| 22:30 | NZD | Business NZ PMI May | |
| Forecast: | Previous: 48.9 | ||
Friday, Jun 14, 2024
| GMT | Ccy | Events | Consensus | Previous |
|---|---|---|---|---|
| JPY | BoJ Interest Rate Decision | 0.10% | 0.10% | |
| 04:30 | JPY | Tertiary Industry Index M/M Apr | 0.40% | -2.40% |
| 04:30 | JPY | Industrial Production M/M Apr F | -0.10% | -0.10% |
| 09:00 | EUR | Eurozone Trade Balance (EUR) Apr | 17.3B | |
| 12:30 | CAD | Manufacturing Sales M/M Apr | 1.30% | -2.10% |
| 12:30 | CAD | Wholesale Sales M/M Apr | 2.50% | -1.10% |
| 12:30 | USD | Import Price Index M/M May | 0.10% | 0.90% |
| 14:00 | USD | Michigan Consumer Sentiment Index Jun P | 73 | 69.1 |
| GMT | Ccy | Events | |
|---|---|---|---|
| JPY | BoJ Interest Rate Decision | ||
| Forecast: 0.10% | Previous: 0.10% | ||
| 04:30 | JPY | Tertiary Industry Index M/M Apr | |
| Forecast: 0.40% | Previous: -2.40% | ||
| 04:30 | JPY | Industrial Production M/M Apr F | |
| Forecast: -0.10% | Previous: -0.10% | ||
| 09:00 | EUR | Eurozone Trade Balance (EUR) Apr | |
| Forecast: | Previous: 17.3B | ||
| 12:30 | CAD | Manufacturing Sales M/M Apr | |
| Forecast: 1.30% | Previous: -2.10% | ||
| 12:30 | CAD | Wholesale Sales M/M Apr | |
| Forecast: 2.50% | Previous: -1.10% | ||
| 12:30 | USD | Import Price Index M/M May | |
| Forecast: 0.10% | Previous: 0.90% | ||
| 14:00 | USD | Michigan Consumer Sentiment Index Jun P | |
| Forecast: 73 | Previous: 69.1 | ||
The Weekly Bottom Line: Labor Market Resilience Highlights Global Policy Rate Divergence
U.S. Highlights
- The U.S. economy added 272k jobs in May, while the unemployment rate ticked up to 4.0%.
- The ISM Purchasing Managers’ Indexes showed manufacturing activity continued to contract in May, while services activity returned to growth.
- Central banks in Canada and Europe started to cut interest rates this week, which has heightened the focus of markets on the guidance expected from next week’s Federal Reserve meeting.
Canadian Highlights
- The Bank of Canada (BoC) cut its policy rate by 25 basis points this week (to 4.75%) – the first cut in four years.
- Canadian employment growth showed a 27k gain in May, but the unemployment rate continued to rise to 6.2%. The labour market has loosened on the back of rapid population increases.
- The path forward for the BoC is clear. With economic growth and inflation subdued, we expect the central bank to cut interest rates further in September and December this year.
U.S. – Labor Market Resilience Highlights Global Policy Rate Divergence
The economic calendar this week was backloaded, with Friday’s employment report for May dominating headlines. This week also saw two G7 central banks start cutting interest rates. Rate cuts by the European Central Bank and Bank of Canada raised market hopes that similar moves stateside were not far off. Treasury yields fell on the week, with the 10-Year yield down 9 basis-points (bps), while equities remained buoyant, with the S&P 500 rising to 1.4% as of the time of writing.
May’s jobs report showed that the economy added 272k jobs last month, exceeding consensus expectations and accelerating relative to the month prior (Chart 1). The unemployment rate ticked up modestly to 4.0% - it’s highest level in over two years - partly owing to a decline in the more volatile household survey employment metric. On aggregate the labor market remains solid, with broad-based contributions to non-farm payrolls in May, which helped to push up average hourly earnings. However, the uptick in the unemployment rate combined with the normalization in the job opening rate in April point to likely cooling moving forward.
Earlier in the week, we received an update on activity in the manufacturing and service sectors from the ISM Purchasing Managers’ Index reports. Manufacturing activity contracted for a second consecutive month, with growth in production and raw material prices continuing to decelerate as new orders fell sharply. In contrast, the services sector expanded, with the index reaching its highest level in nine months in May after contracting briefly in the month prior. With both indexes at levels consistent with the pre-pandemic period and survey respondents citing continued headwinds from high interest rates, the Federal Reserve should be in a position to ease policy later this year.
The Federal Reserve’s international counterparts began this process this week, with the Bank of Canada and the European Central Bank both lowering their policy rate by 25 bps. Inflation has cooled further outside the U.S. (Chart 2), as U.S. economic resilience slowed this progress over the past few months. However, officials in Canada and Europe emphasized that monetary policy easing would be implemented on a gradual basis, with future decisions dependent on the evolution of price growth trends moving forward.
Markets will now be waiting anxiously for the Federal Reserve’s decision next week. Although no change in policy is anticipated, the FOMC will publish updated forecasts in its Summary of Economic Projections (SEP). These will provide some guidance on the Fed’s expectations for interest rates. The prior SEP outlined expectations for 75 bps of cuts in 2024, but more recently market pricing has shifted closer to expecting roughly 50 bps after the persistence of inflation in the first quarter. Next week’s CPI report for May will provide some insight into the Fed’s progress on returning inflation to the 2% target, but it will likely be at least a few months before the Fed will possess the necessary confidence in the trajectory of inflation to reduce the policy rate.
Canada – Canada – Let’s Just Enjoy the Moment
The Bank of Canada (BoC) cut its policy rate by 25 basis points this week (to 4.75%), recognizing the easing in inflationary pressures that we have been harping on for all of 2024 (Chart 1). This was welcomed news for an economy that has been stuck in a rut for the better part of the last two years. Canadian employment confirmed this, as the unemployment rate rose to 6.2% (from 6.1%), even though jobs rose 27k in May.
The BoC found the confidence it needed to become the first G7 central bank to cut its policy rate. The bank had plenty of justification for cutting rates. GDP for the first quarter came in at about half the rate of population growth, making it the sixth negative GDP per capita print in the last seven. The bank could also point to the drop in underlying inflation, with the 3-month average of the BoC’s core inflation rates below the 2% target. This points to further deceleration in the annual core inflation rate in the months ahead. Not only that, but the Canadian job market has also continued to cool.
The unemployment rate has risen by 1.4 percentage points, from its low of 4.8% in 2022. This rise has occurred as population growth has well eclipsed the ability for firms to absorb workers (Chart 2). This trend continued in May. Employment growth was easily outpaced by a 98k increase in the working age population and a 55k increase in the number of people engaged in the workforce. Consequently, the number of unemployed workers has increased by 36% in the last two years. This is the largest increase in unemployment outside of recession. The rapid normalization in the job market has increased our confidence that wage growth will ease (from still high levels) over the remainder of this year.
Chart 2 shows year on year population (15+) and employment growth from July 2024 to May 2024. It show population growth will exceeding employment.
The road to future rate cuts is clear for the BoC. The policy rate is still restrictive and will continue to weigh on economic growth and inflation. Only about half of mortgage holders have renewed at higher rates. As more renew over 2024 and 2025, the impact on disposable income will prevent an acceleration in consumer spending even with BoC rate cuts. This means that the first rate cut seen this week won’t be the last.
That said, the BoC is likely to proceed cautiously. It doesn’t want to stoke the housing market, which has typically responded with a recoil whenever the BoC gives the market some interest rate relief. For this reason, we expect the central bank to pause in July, before cutting again in September and December. This means that Canada’s policy rate is going to fall further below the U.S.’s. The spread between the BoC overnight rate and the U.S. fed funds rate could widen to 100 to 125 basis points by year-end. This is within the range seen over the last three episodes of policy divergence, but the effect is likely going to be felt on the Canadian dollar, which we expect will push towards the 70 U.S. cent level over the second half of 2024.
Weekly Economic & Financial Commentary: G7 Central Banks Ease into Summer with Rate Cuts
Summary
United States: July Cut Bites the Dust; September Hanging on Edge of Its Seat
- The strong job gain and rebound in average hourly earnings in May reaffirm our expectation that a rate cut remains some time away and is increasingly dependent on a few slower inflation reports. Next week's CPI report and the FOMC's Summary of Economic Projections are now in focus.
- Next week: NFIB (Tue.), Consumer Price Index (Wed.), Producer Price Index (Fri.)
International: G7 Central Banks Ease into Summer with Rate Cuts
- This week, the Bank of Canada lowered its policy rate by 25 bps and offered comments that leaned dovish in tone; we forecast another 25 bps cut in July. The European Central Bank (ECB) also delivered a 25 bps rate cut, a communicated and somewhat cautious stance for monetary policy going forward. We look for an ECB rate pause in July.
- Next week: U.K. Monthly GDP (Wed.), Australia Employment (Thu.), Bank of Japan (Fri.)
Interest Rate Watch: Dots Headed Higher
- The FOMC will release an updated Summary of Economic Projections (SEP) coinciding with its policy meeting next week. Price pressures have held relatively firm in the months following the last SEP, leading us to anticipate an upshift in the median dot. We also expect longer-term interest rate expectations to edge higher, reflecting the possibility of greater underlying economic potential.
Credit Market Insights: Personal Interest Expenses Are Stacking Up
- Households have been under ever-increasing pressure from high interest rates, leaving those that carry a balance on their credit cards or those paying off an auto loan saddled with more personal interest expenses. As the Fed has raised rates at the fastest pace in four decades, the interest expenses consumers have incurred on consumer loans have soared.
Topic of the Week: Fire and Ice: The Economics of the 2024 Stanley Cup Finals
- As the heat of June arrives, with it comes the end of the NHL season and a battle for the most coveted prize in ice hockey, the Stanley Cup. This year’s finals feature the Florida Panthers out of Sunrise, Florida, and the Edmonton Oilers out of Alberta, Canada. In just about every sense, these two cup cities could not be more different.
Fed Set to Hold Rates as Inflation and Other Indicators Show Mixed Signals
Wednesday’s U.S. Consumer Price Index data and the Federal Reserve’s interest rate decision will be in focus after the Bank of Canada and European Central Bank cut rates the week before.
The Fed is not expected to follow suit—at least not right now. We expect U.S. CPI growth numbers out in the morning before the rate decision to look a little better. But that follows a string of upside surprises and persistent economic outperformance that have made near-term U.S. interest rate cuts much less likely compared to other advanced economies.
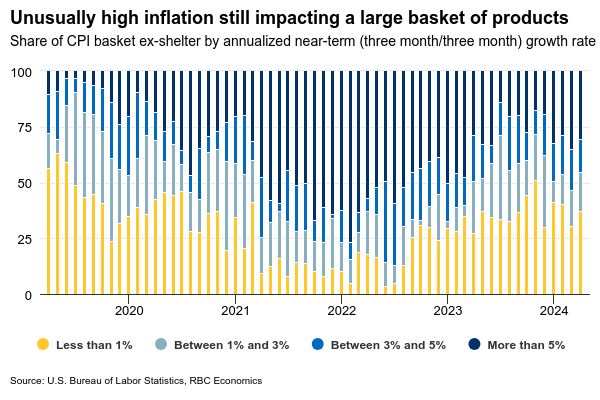
We look for headline CPI growth in May to hold at 3.4% year-over-year with the underlying details looking slightly better. Energy prices likely declined in May as oil prices edged lower. But “core” (excluding food and energy) price growth is also expected to edge down to 3.5% (from 3.6% in April) on a more normal-looking 0.2% month-over-month increase. Home rent price growth should also slow alongside a lower month-over-month increase in the core services ex-rent measure that Fed policymakers have been watching closely. The April increase in that measure already edged down to 0.4% following three straight upside surprises (averaging 0.7% per month) over the first three months of the year.
The diffusion index, which measures the breadth of inflation pressures, has shown little improvement over the past few months. Fed policymakers still think the current level of interest rates is “restrictive” enough to bring inflation back to the 2% target. But another round of firm U.S. employment numbers in May, including a tick up in wage growth, reinforced that there is no pressure on the Fed to lower interest rates quickly. Our base case assumption is that the Fed won’t be in a position to cut interest rates until December, and that shift is still contingent on seeing economic growth and inflation slow.
Week ahead data watch
Manufacturing sales likely increased by 1.2% on higher sales of transportation equipment, according to Statistics Canada’s advance estimates. The Industrial Product Price Index for the manufacturing sector rose by a similar amount by our count (on a seasonally adjusted basis), suggesting that most of the increase in sales came from higher prices rather than higher sale volumes.
Statistics Canada’s early estimate of core wholesale sales was up 2.8% in April, largely driven by sales growth in the motor vehicle and parts sector.
Canadian household net worth likely rose in Q1 with stronger equity markets boosting financial asset values. The household debt to income ratio likely edged lower from 178.7 in Q4 with mortgage and non-mortgage debt levels little changed but incomes still rising. Earlier interest rate increases are continuing to boost debt payments with a lag, but household disposable incomes also rose sharply in Q1 to likely leave the ratio of debt payments to incomes little changed (although still close to record high levels) in Q1.
A strike by Canadian border workers could start as soon as end of day on Friday, June 7. Most border workers are “essential” and not able to legally walk off the job, but a work-to-rule campaign could slow border crossings. A prolonged strike could significantly disrupt supply chains and would restrict cross-border travel. A similar strike in 2021 happened when the Canada/U.S. border was still closed to non-essential travel during the pandemic and was too short (three days) to have a significant impact on economic data.

Weekly Focus – ECB in No Rush to Commit to Further Ccuts
The ECB delivered the widely anticipated first 25bp rate cut but kept its forward-looking guidance vague. Lagarde noted there was a 'strong likelihood' the ECB would dial back the restrictiveness of their monetary policy going forward but was not ready to pre-commit or even discuss the possible timing of the next cut. The updated economic projections underscored the cautious tone as both headline and core inflation forecasts were revised higher through 2024-2025. On Friday morning, after the meeting Thursday, several GC members including Nagel, Muller and Kazaks echoed the need to move forward gradually and depending on the incoming data. Markets were ultimately little affected by the meeting, and the next rate cut is still largely priced in by October. We still like our call of ECB cutting rates the next time only in December, read more from our ECB Review - Cutting and keeping, 6 June.
Signs of recovering European manufacturing cycle have helped calm perceived downside risks related to restrictive monetary policy stance. This week's PMI data showed a particularly sharp improvement in Swedish manufacturers' order-inventory balances. In contrast to the general trend seen over the past couple of years, US manufacturing data from the ISM was relatively less optimistic and JOLTs job openings pointed towards further cooling in labour demand.
Besides stronger export demand, improving real purchasing power is expected to lift consumption towards summer (and maintain inflation sticky in the process). Lagarde saw growth risks better balanced going forward, which rhymes well with our updated economic projections in the latest Nordic Outlook - Warmer than expected, 4 June. We revised our 2024 growth forecasts slightly higher across the euro area, the US and China. Forecasts for the Nordic economies remained little changed, with Sweden and Denmark still seeing stronger growth already this year while Finland lags behind.
Next week's main event will be the FOMC meeting on Wednesday where we, broad consensus and markets expect no monetary policy changes. The median rate projection on the updated 'dot plot' is likely to shift higher, signalling only two rate cuts this year (instead of three). That said, Powell is likely to still signal bias towards cutting rates going forward and push back on any questions regarding the possibility of further hikes. In the afternoon ahead of the meeting, US May CPI is also due for release. We forecast headline CPI at +0.19% m/m SA (Cons. +0.2%, Apr. +0.31%) and core CPI at +0.25% m/m SA (Cons. +0.3%, Apr. +0.29%). Read more from our Fed preview - No urgency, 7 June.
We expect little to no market reaction to the European Parliament elections this weekend, despite its status as a significant political event. Historical data suggests that these elections typically have a minimal effect on markets, and we anticipate a similar scenario this time, find more details from our earlier preview, Research euro area - European Parliament election will not move markets, 14 May.
Bank of Japan will also wrap up its monetary policy meeting next Friday. We expect no rate changes, but we do expect the BoJ to signal tapering of its bond purchases, which would be a natural next step after BoJ exited its yield curve control policy in March.
US: Payrolls Surge in May, While Unemployment Rate Ticks Up to 28-month High of 4.0%
Non-farm employment surged by 272k in May, well ahead of the consensus forecast calling for a more moderate gain of 185k. Job gains in the two prior months were revised slightly lower, subtracting a combined 15k from the previously reported figures.
Private payrolls rose 229k, with most of the gains concentrated in health care & social assistance (+83.5k), government (+43k), leisure & hospitality (+42k), and professional & business services (33k).
In the household survey, civilian employment (-408k) plummeted by more than the labor force (-250k), pushing the unemployment rate higher by 0.1 percentage points to 4.0% – a 28-month high. Meanwhile, the labor force participation rate dipped by 0.2 percentage points to 62.5%.
Average hourly earnings (AHE) were up 0.4%% month-on-month (m/m) – two-tenths stronger than April's gain. On a twelve-month basis, AHE ticked up to 4.1% (from 4.0% in April), while the three-month annualized rate jumped by more than a percentage point and also sits at 4.1%.
Key Implications
Payroll growth defied expectations in May, coming in well above the consensus forecast. On a trend basis, job gains have averaged a still strong 249k over the past three-months. However, this pace of job growth is unlikely to be sustained indefinitely. By most other metrics, the labor market is already showing clear signs of cooling. Job openings have narrowed to a three-year low, the unemployment rate now sits at a 28-month high, and both the hire and quit rates are now holding steady below pre-pandemic levels after having trended lower over the past year.
The uptick in average hourly earnings will be something closely watched by Fed officials. Still elevated wage pressures are helping to sustain strong gains in service spending and are working against the Federal Reserve's efforts to bring down inflation across the service sector. For that reason, we think it's unlikely that the FOMC will be ready to start cutting rates before December – a view supported by current market pricing.
Canada’s Unemployment Rate Continued to Rise in May, as Job Gains Lag Population Growth
The Canadian labour market geared down from its April hiring surge, adding a modest 27k new positions in May. The gain was entirely in part-time jobs (+62k), while full-time employment declined (-36k).
The unemployment rate continued its upward trend in May. The unemployment rate rose one tenth from April to 6.2% in May, as 54.5k labour market entrants exceeded the number of people who found jobs. Related unemployment indicators also paint a picture of increased challenges finding work. For example, long-term unemployment (>27 weeks) has risen from 13.2% last year, to 18.2% in May.
The service sector saw most of the hiring. The biggest increases in jobs were business, building and other support services (+19k; +2.7%), finance, insurance, real estate, rental and leasing (+29k; +2.0%), health care and social assistance (+30k; +1.1%) and accommodation and food services (+13k; +1.1%). Meanwhile, construction lost jobs (-30k) as did transportation and warehousing.
Lastly, total hours were flat, and are up 1.6% over the past year. That is despite employment rising 2% over the same period. Wage growth picked up to 5.1% year-on-year in May from 4.7% in April, largely due to base effects which are expected to peter out after June.
Key Implications
The Canadian labour market geared down in May and shows many signs of cooler job market conditions. Hiring continues, but Canada's population has grown 3.4% over the past year and 2% growth in employment is not strong enough to keep the unemployment rate from rising. And it's not just population growth, signs of softness are widespread: people are unemployed longer, job gains over the past year have been skewed towards the public sector, and the more cyclical goods sector has lost jobs over the past year.
Typically the jobs data is the week's marquee star, but the Bank of Canada's interest rate cut on Wednesday (see analysis) stole the show. There is plenty in May's jobs data that supports the case for lower interest rates. However, the economy has cooled, but it has not fallen off a cliff. We expect that will lead to a gradual pace of interest rate reductions this year, with the BoC likely to cut at every other meeting. We expect a further 50 basis points in reductions in the policy rate by the end of the year easing this year.
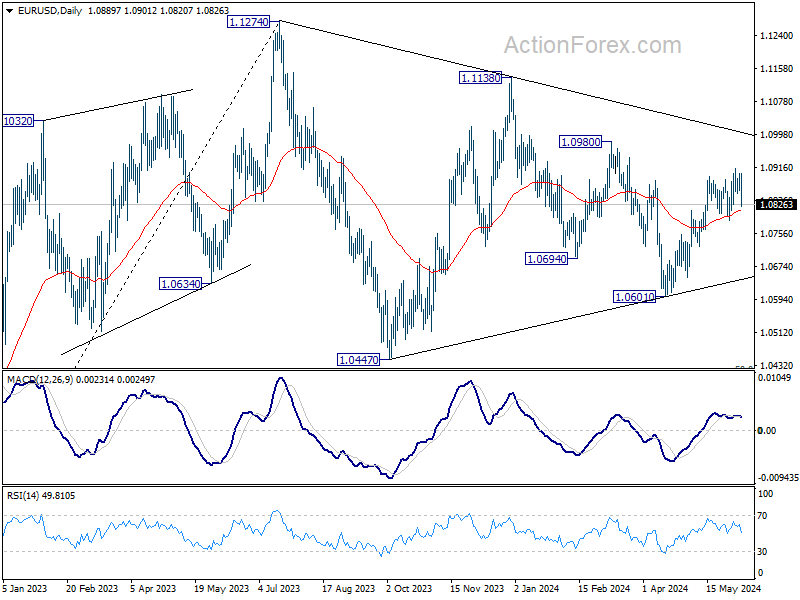
EUR/USD Mid-Day Outlook
Daily Pivots: (S1) 1.0867; (P) 1.0884; (R1) 1.0907; More…
EUR/USD dips notably in early US session but stays above 1.0788 support. Intraday bias remains neutral first. Considering bearish divergence condition in 4H MACD, firm break of 1.0788 will argue that rebound from 1.0601 has completed and turn bias to the downside for this low. Nevertheless, break of 10915 will resume the rally to 1.0980 resistance instead.
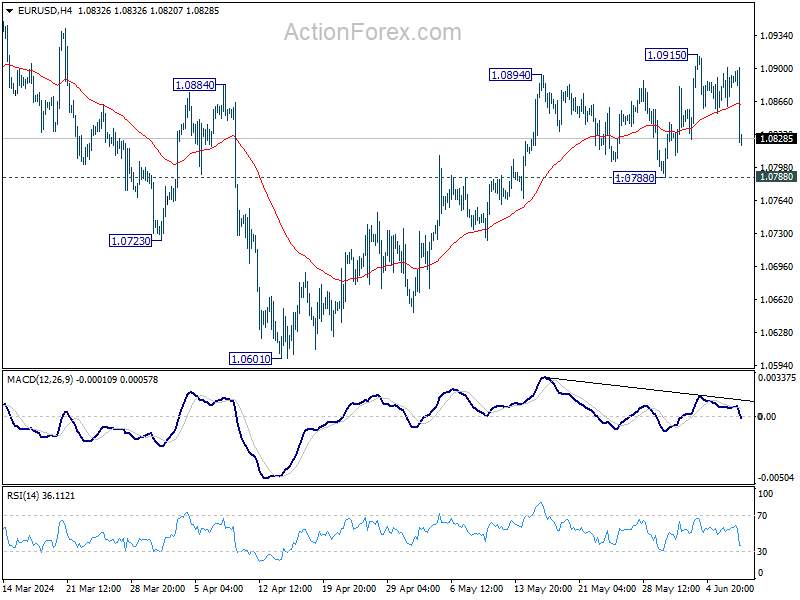
In the bigger picture, price actions from 1.1274 are viewed as a corrective pattern. Fall from 1.1138 is seen as the third leg and could have completed. Firm break of 1.1138 will argue that larger up trend from 0.9534 (2022 low) is ready to resume through 1.1274 high. On the downside, break of 1.0788 support will extend the corrective pattern instead.