Sample Category Title
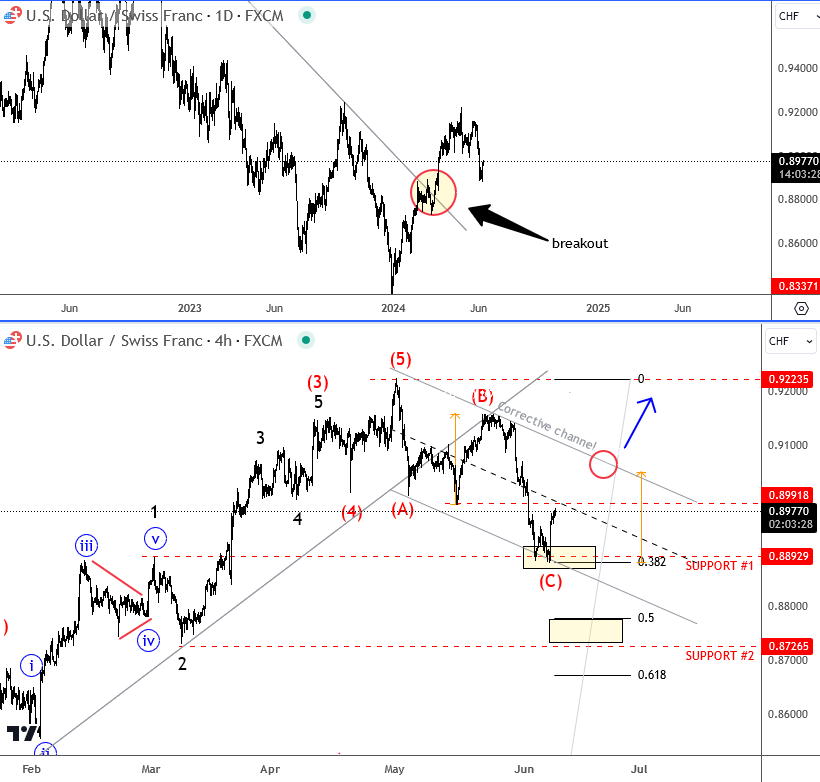
Elliott Wave Analysis: USD/CHF Bounces from the sSupport
USDCHF is coming higher this year, after breaking some important trendline connected from 2022 highs on a daily chart, where a breakout would lead to higher prices within big triangle range.
Looking at the 4-hour chart, it looks like pair is in a higher degree corrective setback after a completed five-wave rally and broken trendline. We are tracking an A-B-C corrective decline, where wave C is already testing first 0.8900 support zone so there can be some price stabilization in the near-term. But for bullish resumption, we need sharp turn back above 0.9 level, and move out of a channel. In case of deeper and more extended C wave, the next support would be around 0.87 - 0.86 area. In either case, we think that CHF weakness will still show up this year, maybe not only vs USD, but also vs some other currencies.
French Election Risk Likely to Keep Euro Under Pressure in the Build-up
Markets
The US market needle again points in the direction of a December rather than a September (50% probability from 85%) Fed policy rate cut after Friday’s consensus-beating payrolls. 272k net job growth and accelerating wage growth (0.4% M/M & 4.1% Y/Y) triggered a massive sell-off in US Treasuries. Daily changes on the US yield curve ranged between +12 bps (30-yr) and +16 bps (2-yr). The US 10-yr yield that way managed to get away from the 4.3% support area. We don’t expect another US Treasury rebound in the run-up to Wednesday’s May CPI inflation figures and Fed meeting. The consensus bar for headline inflation (0.1% M/M) seems rather low suggesting upside risks for Y/Y inflation (3.4%) also given last year’s equally low comparison base (0.1%). The pace of core inflation is expected stable compared to April (0.3% M/M) with base effects (0.4% last year) more in favour of a disinflation narrative (3.5% Y/Y expected). The Fed will keep policy rates unchanged but both the statement and the updated summary of economic projections risk showing a further hawkish shift. The updated dot plot will be a very close between a more market-friendly consensus of two rate cuts this year and sell-off triggering one rate cut. The path for 2025 risks being slower as well (current end of year median of 3.75%-4%) The neutral rate is equally vulnerable to a new upward (median) revision from 2.56% in March (2.5% in December). US yields can revisit this year’s highs is this scenario materializes.
The dollar rallied following US payrolls to a weekly close of EUR/USD 1.08 and ending the topside test of the 1.09 sideways range. The pair this morning sinks to the 1.0750 area after French president Macron conceded defeat in EU elections by calling snap elections at the end of this month. This election risk (strong showing of far right RN) is likely to keep the euro under pressure in the build-up. We expect to see some widening in sovereign spreads as well this week. EUR/GBP fell below the 0.85 support zone to currently change hands around 0.8450. Those are the weakest levels since August 2022. If the Bank of England turns out more hawkish than the ECB next this week, it could add to EUR/GBP selling pressure.
News & Views
French President Macron will dissolve parliament after Marine Le Pen’s Rassemblement National secured almost 1/3rd of the votes in EU elections compared to less than 15% for Macron’s centrist alliance. Snap elections will be held on June 30 and July 07. Macron sees a need for clarification and a clear majority to act in serenity and harmony. The overall outcome of European elections showed a strong outcome for the center-right EPP, securing 184 seats in the 720 seat EU parliament. Current coalition partners Socialists and Democrats and the pro-European Renew managed 139 and 80 seats respectively. Together, they again have a majority but it’s unsure whether this will be enough for outgoing President of the EC (von der Leyen) to secure a second term as several members of parliament of the three groups might not support her candidacy. The EC President also needs a qualified majority of 15 of the 27 EU leaders of countries that together represent 65% of the EU population. The far-right and Euro-sceptic group Identity and Democracy raised its number of seats from 49 to 58 with the German AfD gaining another 15 seats.
At the same time of the elections for the EU parliament, Belgium held elections for the national and its regional parliaments. On a federal level (150 seats), the center-right Flemish NVA secured 24 seats (-1) and remains the biggest party, staying ahead of the far-right Vlaams Belang (20 seats; +2). Among the families that are represented with parties in both the French and Flemish speaking part of the country, the liberal family obtained 27 seats (thanks to a strong showing of MR (20 seats) in Wallonia; +1 combined), the social democrats won 29 seats (stable) and Christian democrats 25 seats (+8). The Green group is decimated from a combined 21 seats to only 9 while the far-left group PTB-PVBA collected 15 seats (+3). Even as political fragmentation might complicate the formation of a new government, the leader of the NVA party is expected to take the lead to form a new center-right government.
Graphs
GE 10y yield
The ECB cut its key policy rates by 25 bps at the June policy meeting. A more bumpy inflation path in H2 2024, the EMU economy gradually regaining traction and the Fed’s higher for longer US strategy make follow-up moves difficult. Markets are coming to terms with that. The German 10y yield set a new YtD top at 2.7%.
US 10y yield
The Fed in May acknowledged the lack of progress towards the 2% inflation objective, but Fed Chair Powell indicated that further tightening was unlikely. However, the FOMC Minutes still showed internal debate on whether policy is restrictive enough. Sticky inflation suggests any rate cut will be a tough balancing act while several policy makers hint at a higher neutral rate. The US 10-y yield is stuck in the 4.3/4.7% trading range.
EUR/USD
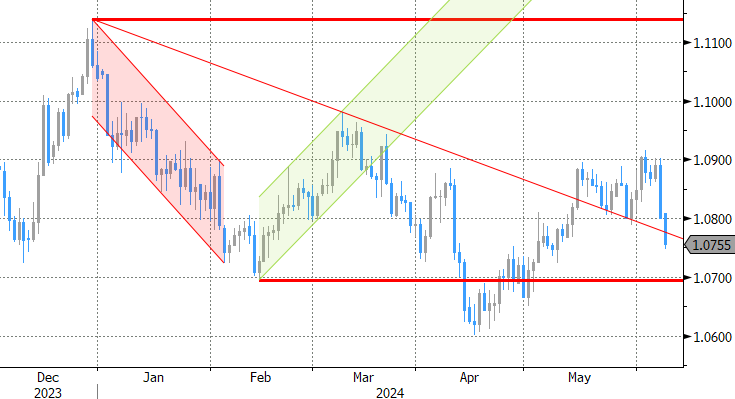
EUR/USD is stuck in the 1.06-1.09 range. The desynchronized rate cut cycle with the ECB exceptionally taking the lead, strong US May payrolls and a swing to the right in European elections pulled the pair away from 1.09 resistance. Focus turns to the US side of the story with May CPI inflation numbers and a more hawkish Fed looming on the horizon.
EUR/GBP
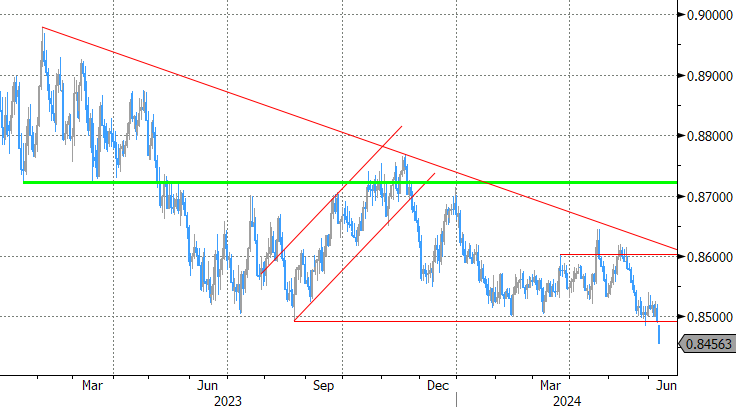
Debate at the Bank of England is focused at the timing of rate cuts. Slower than expected April disinflation and a surprise general election on July 4 suggest that a June cut in line with the ECB looks improbable. Sterling gained momentum with money markets now discounting a Fed-like scenario. EUR/GBP tested the 2023 & 2024 lows near 0.85. Euro weakness eventually pulled the trick after French president Macron called snap elections following a weak showing in EU elections.
EUR/USD Daily Outlook
Daily Pivots: (S1) 1.0768; (P) 1.0835; (R1) 1.0870; More....
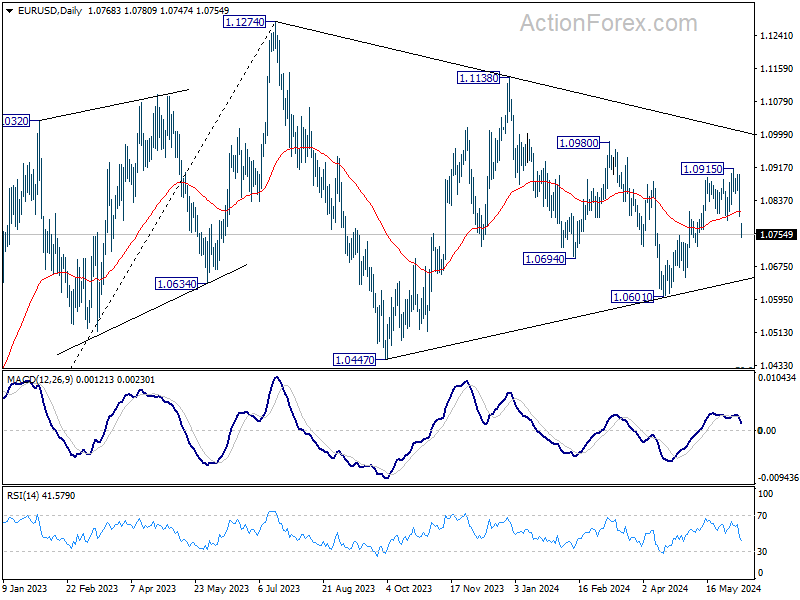
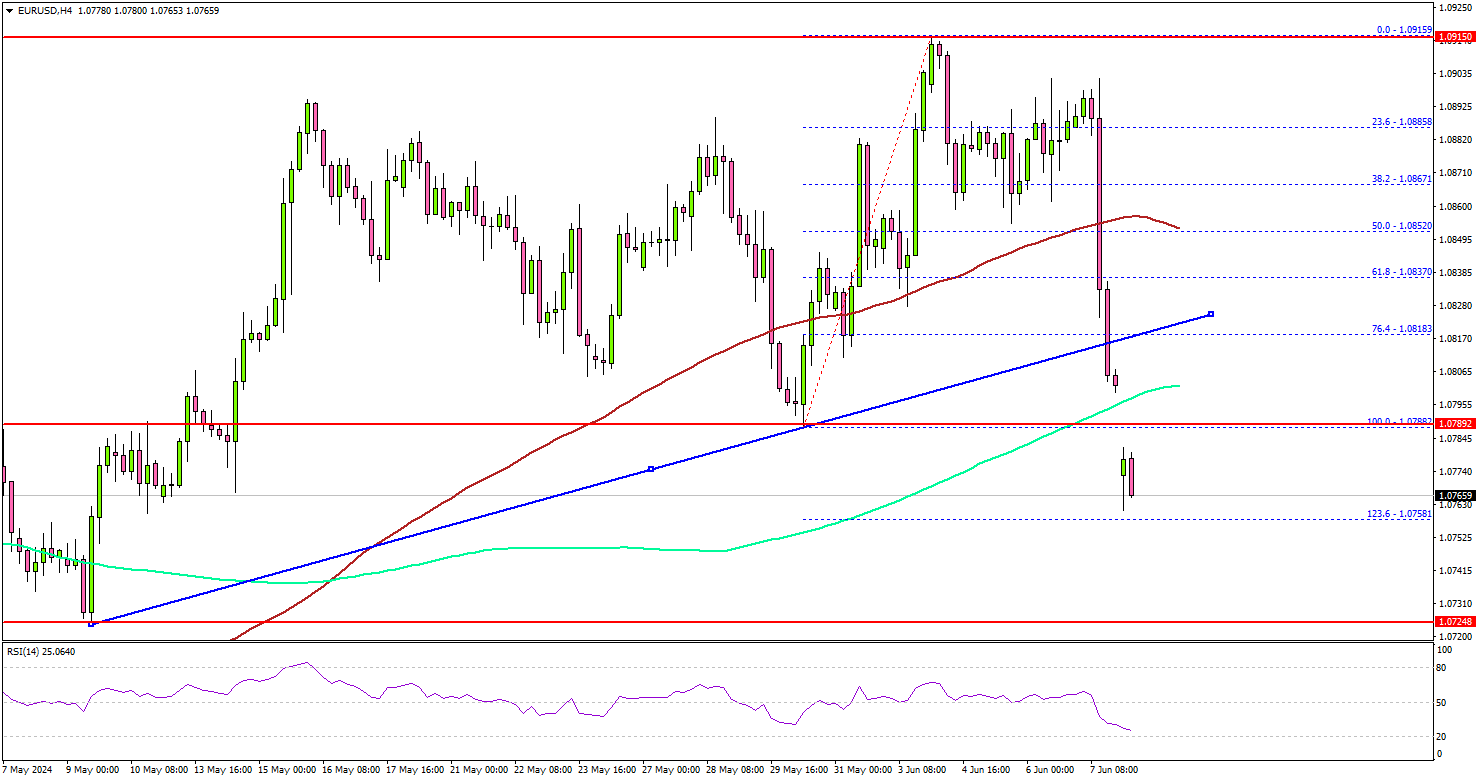
EUR/USD's steep decline today and strong break of 55 D EMA (now at 1.0810) indicates short term topping at 1.0915. more importantly, rebound from 1.0601 might have completed already, and EUR/USD is now is another falling leg of the corrective pattern from 1.1274. Intraday bias is back on the downside for 1.0601 support next. For now, risk will be mildly on the downside as long as 1.0915 resistance holds, in case of recovery.
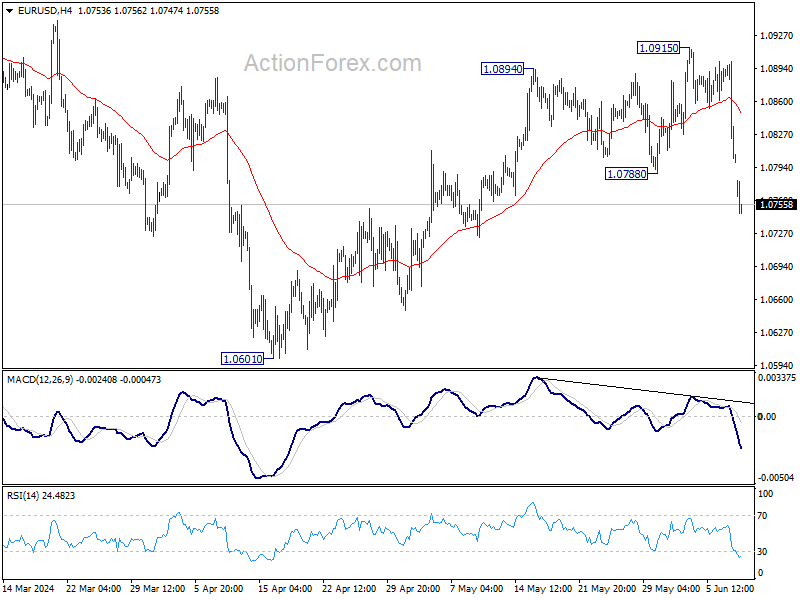
In the bigger picture, price actions from 1.1274 are viewed as a corrective pattern, which might still be in progress. Break of 1.0601 will target 1.0447 support and possibly below. Nevertheless, on the upside, firm break of 1.1138 will argue that larger up trend from 0.9534 (2022 low) is ready to resume through 1.1274 high.
Euro Tumbles Amid Political Uncertainty, Market Eyes FOMC Dot Plot and US CPI This Week
In holiday-thinned Asian trading today, Euro's sharp decline was the focal point. Investors' reaction to European Parliament election results was overwhelmingly negative. The far-right's significant gains have sparked concerns, driving the common currency through key support level against both Sterling, and a near term support again Dollar. This technical development suggests further downside risks for Euro, which may persist at least until the political uncertainties within the EU are resolved.
Dollar, on the other hand, managed to hold most of the gains achieved from last week's robust job data, although it has shown some struggle to extend its rally against commodity currencies today. The market's attention is now shifting towards the upcoming FOMC rate decision and the closely watched dot plot. However, the forthcoming May CPI data could be an even more significant market mover. Any indication that disinflation is stalling again could constrain Fed's ability and desire to ease monetary policy this year.
As of today, Australian Dollar leads as the strongest among commodity currencies, including the New Zealand Dollar and the Canadian Dollar, which are also showing strength. Japanese Yen and Swiss Franc trail behind Euro, marked as weaker performers. Dollar and British Pound hold middle ground in the currency rankings.
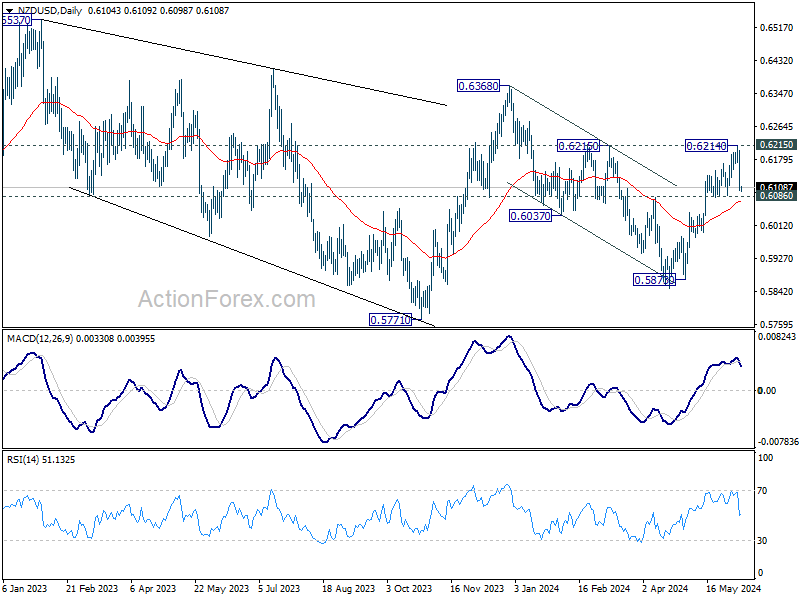
Technically, NZD/USD was rejected by 0.6215 resistance and fell sharply on Friday. But it's holding above 0.6086 support so far. The favored outlook is still that rise from 0.5870 is resuming rally from 0.5771. Firm break of 0.6215 resistance will strengthen this case, and target 0.6368 and above. However, firm break of 0.6086 will bring deeper fall back to 0.5870 instead. Such bearish development, if accompanied by decisive break of 0.6578 support in AUD/USD will affirm Dollar's overall strength.
In Asia, Nikkei rose 0.92%. Japan 10-year JGB yield is up 0.0611 at 1.034. Singapore Strait Times is down -0.23%. Hong Kong and China are on holiday.
Euro dives as eurosceptics gain in European Parliament Elections
Euro spiked sharply lower in thin Asian session today, breaking a crucial support level against Sterling. This decline was sparked by the results of European Parliament elections, where Eurosceptic nationalists made notable gains, although the Centre, liberal, and Socialist parties are still expected to hold a majority.
The election outcomes prompted a dramatic response from French President Emmanuel Macron, who called for a parliamentary election with the first round set for June 30. This move gives the far-right an opportunity to gain substantial political power, potentially weakening Macron's presidency three years ahead of its end. In Germany, Chancellor Olaf Scholz's Social Democrats experienced their worst electoral result ever, losing ground to both mainstream conservatives and the hard-right Alternative for Germany.
The announcement of snap elections in France introduces significant uncertainty for the EU, likely impacting economic and market confidence, particularly in France.
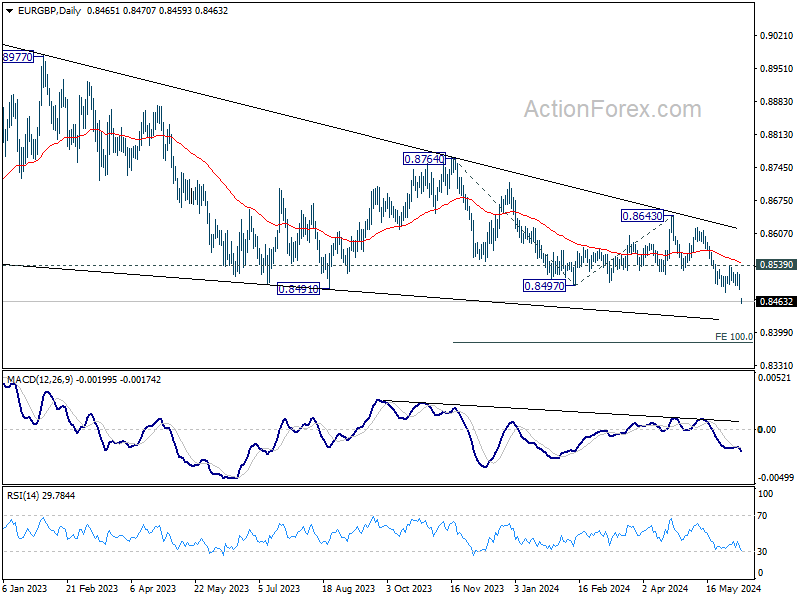
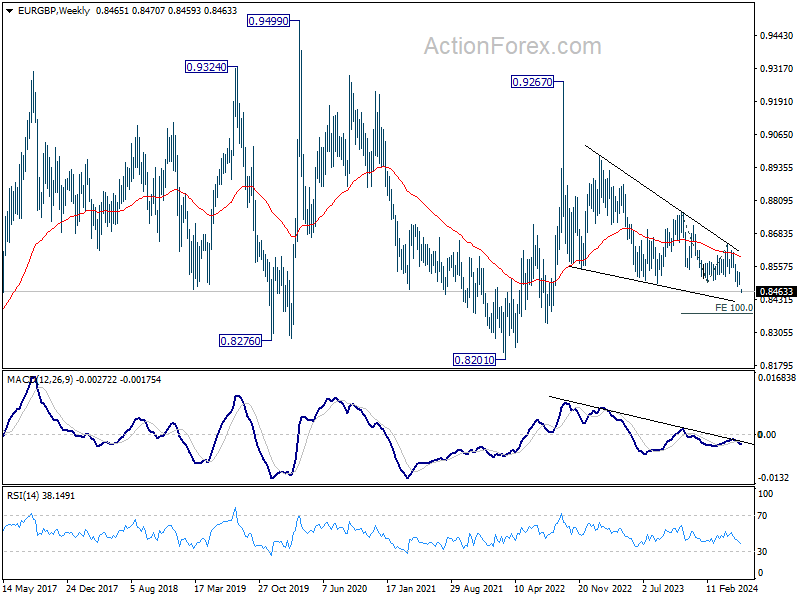
Technically, EUR/GBP's strong break of 0.8491 support confirms resumption of whole down trend from 0.9267 (2022 high) Outlook will stay bearish as long as 0.8529 resistance holds. Next target is 100% projection of 0.8764 to 0.8497 from 0.8643 at 0.8376.
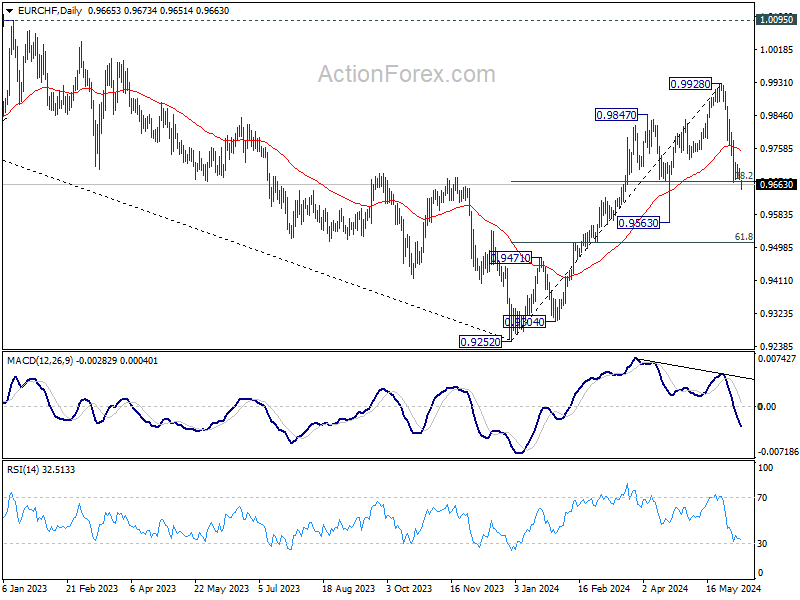
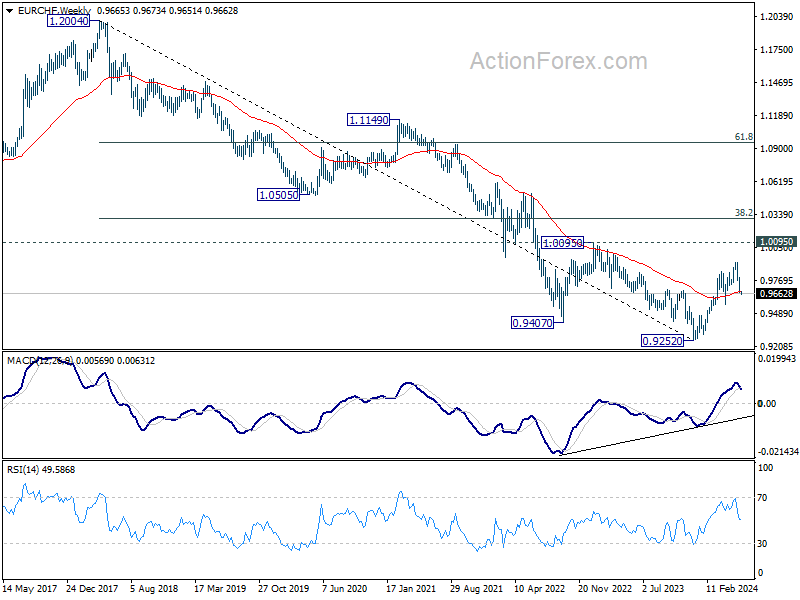
As for EUR/CHF, sustained trading below 38.2% retracement of 0.9252 to 0.9928 at 0.9670 and 55W EMA (now at 0.9672) will raise the chance that whole rise from has completed at 0.9928 already. Deeper decline would be seen to 0.9563 support first. Further break there will strengthen this bearish case.
ECB's Holzmann cautions on risks of further rate cuts
ECB Governing Council member Robert Holzmann expressed concerns on Saturday about the risks of further reductions in ECB borrowing costs, particularly regarding their impact on the Euro exchange rate and inflation.
Holzmann warned, "If the original assumption of three rate cuts were to materialize, and the Federal Reserve didn't respond, it would certainly have an impact on the exchange rate, and with it inflation."
Holzmann was the lone dissenter against ECB's rate cut last week but stated that the decision didn't yet make him concerned about inflation risks.
He explained that ECB officials' implicit commitment to a rate cut was a significant factor in last week's decision. "There was a review of the data and a discussion about it with different points of view," he said. "The council's opinion was that there was no other way, also because it had been announced that such a decision would be made in June."
Fed to stand pat, markets await new dot plot
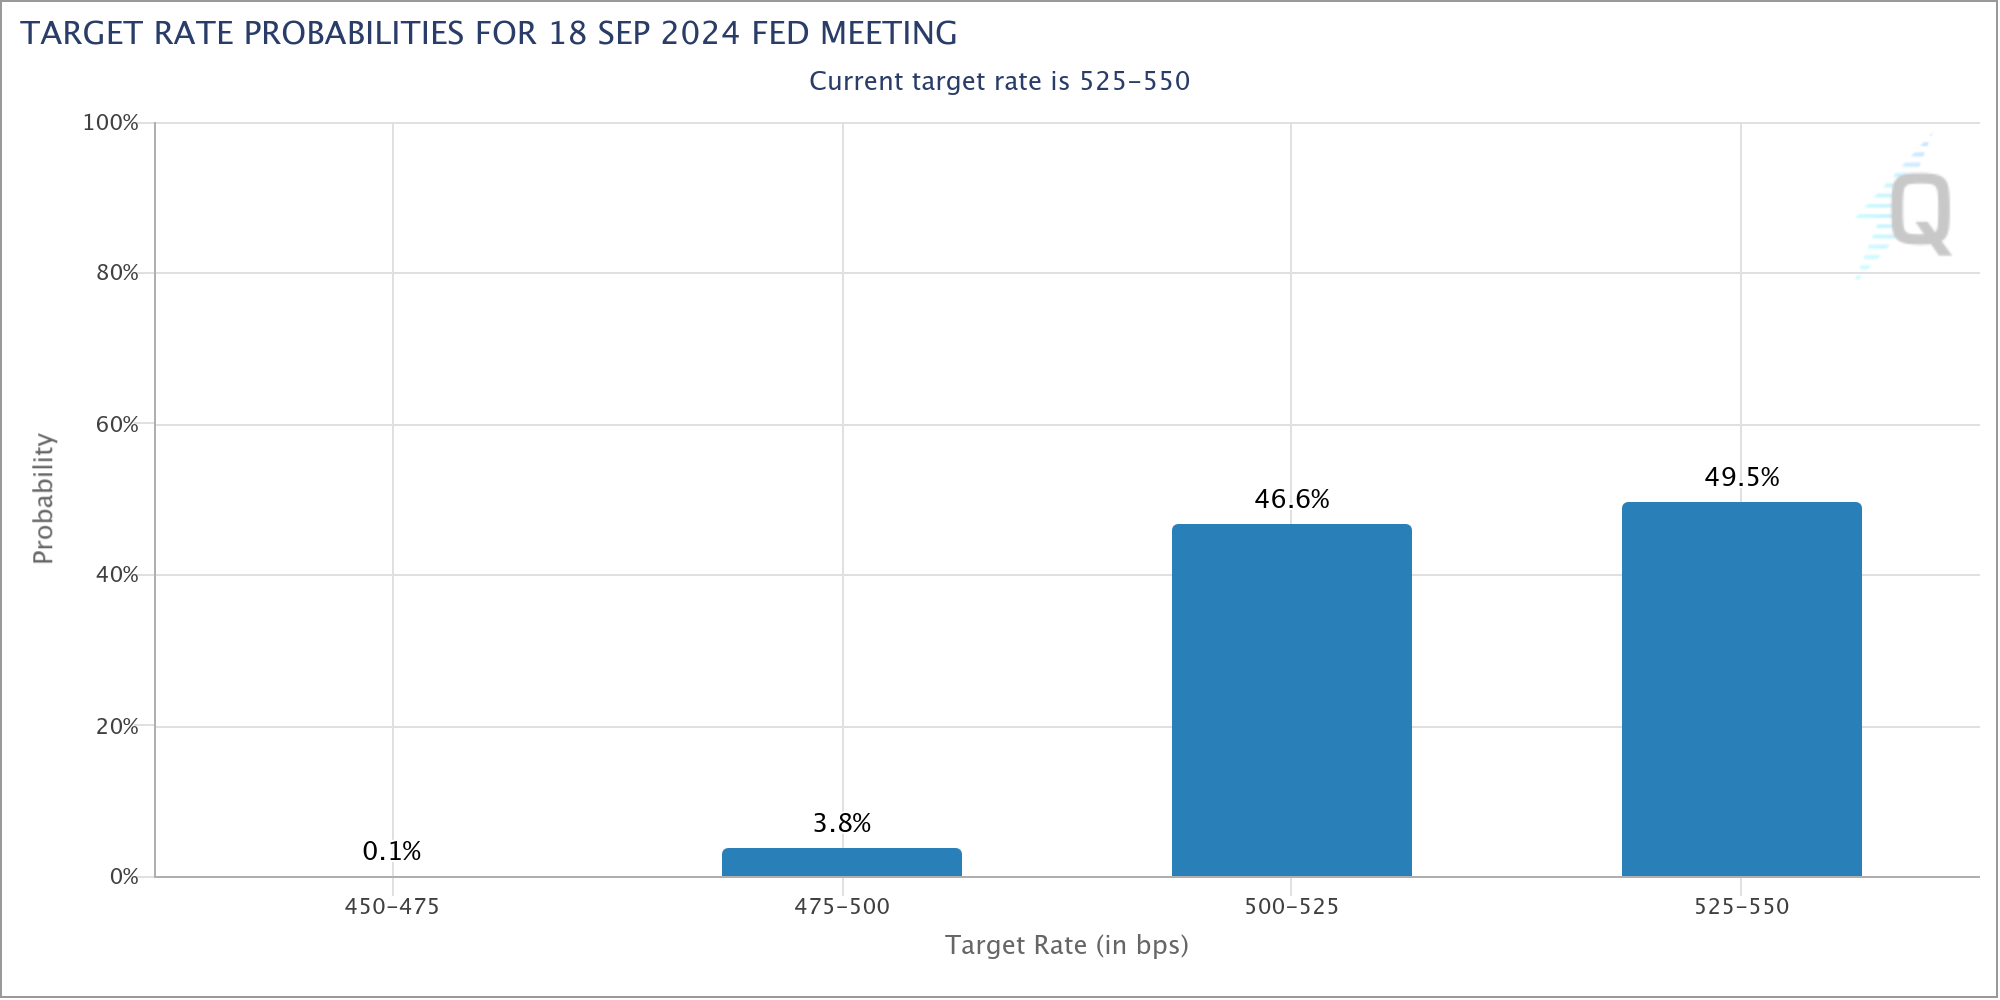
FOMC meeting is the major focus of the week, and Fed is widely expected to keep interest rates unchanged at 5.25-5.50%. Market expectations are fluctuating around 50% chance for a rate cut in September. The upcoming economic projections and dot plot may hopefully provide clearer guidance.
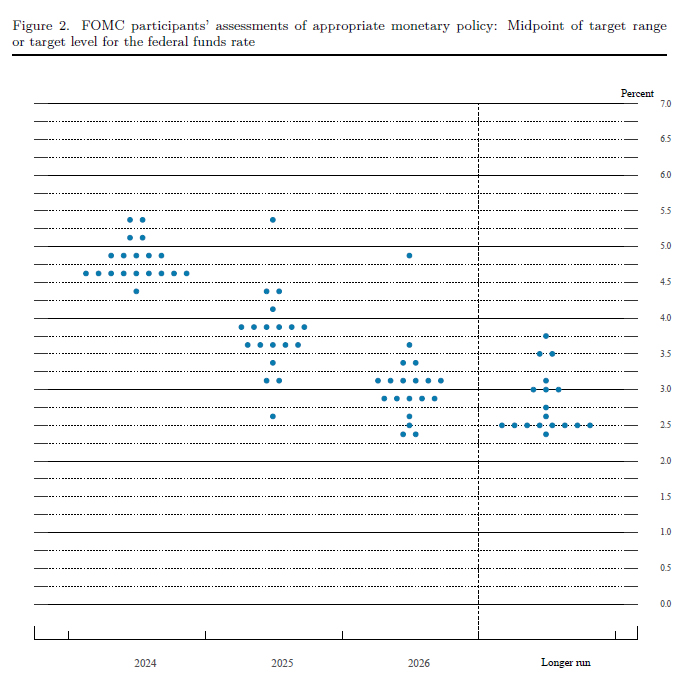
Back in March, Fed's dot plot revealed a divided outlook among policymakers: ten anticipated up three rate cuts this year, while nine foresaw rates holding steady or increasing, including four who projected additional hikes. This division is expected to shift towards a more hawkish stance in the upcoming update.
Key questions include how many policymakers now foresee two or less cuts this year and whether any still consider further hikes necessary. A scenario where more policymakers lean towards two cuts while fewer envision hikes could be market neutral. .
For Dollar and broader markets, more significant movements might be spurred by the latest CPI and PPI data, rather than Fed's rate decision alone.
Simultaneously, BoJ is expected to keep its policy rates steady at 0-0.10%. A Bloomberg survey suggests a slight majority of economists predict BoJ might begin reducing its JPY 6T monthly bond purchases. Regarding interest rate hikes, about one-third expect an increase in July, with 41% looking to October, though signals for another rate hike remain premature.
In the UK, upcoming GDP and employment data will be crucial, especially as BoE Governor Andrew Bailey indicated that a June rate cut is not guaranteed. The MPC has been more divided than its counterparts globally, making this week's data particularly significant in shaping both market expectations and the MPC's forthcoming decisions.
Additionally, global economic indicators such as Eurozone Sentix investor confidence, Australian employment and NAB business confidence, along with China's CPI, are also on the radar and could impact market sentiment.
Here are some highlights for the week:
- Monday: Japan GDP final, current account, Eco Watcher sentiment; Swiss SECO consumer climate; Italy industrial production; Eurozone Sentix investor confidence.
- Tuesday: Australia NAB business confidence; UK employment; US NFIB small business index; Canada building permits.
- Wednesday: Japan PPI; China CPI, PPI; Germany CPI final; UK GDP, production, trade balance; US CPI, FOMC rate decision.
- Thursday: Japan BSI manufacturing; Australia employment; Swiss PPI; Eurozone industrial production; US PPI, jobless claims.
- Friday: New Zealand BNZ manufacturing; BoJ rate decision, tertiary industrial index; Eurozone trade balance; Canada manufacturing sales, wholesale sales; U of Michigan consumer sentiment.
EUR/USD Daily Outlook
Daily Pivots: (S1) 1.0768; (P) 1.0835; (R1) 1.0870; More....
EUR/USD's steep decline today and strong break of 55 D EMA (now at 1.0810) indicates short term topping at 1.0915. more importantly, rebound from 1.0601 might have completed already, and EUR/USD is now is another falling leg of the corrective pattern from 1.1274. Intraday bias is back on the downside for 1.0601 support next. For now, risk will be mildly on the downside as long as 1.0915 resistance holds, in case of recovery.
In the bigger picture, price actions from 1.1274 are viewed as a corrective pattern, which might still be in progress. Break of 1.0601 will target 1.0447 support and possibly below. Nevertheless, on the upside, firm break of 1.1138 will argue that larger up trend from 0.9534 (2022 low) is ready to resume through 1.1274 high.
Economic Indicators Update
| GMT | Ccy | Events | Actual | Forecast | Previous | Revised |
|---|---|---|---|---|---|---|
| 23:50 | JPY | Bank Lending Y/Y May | 3.00% | 3.10% | 3.10% | |
| 23:50 | JPY | GDP Q/Q Q1 F | -0.50% | -0.50% | -0.50% | |
| 23:50 | JPY | GDP Deflator Y/Y Q1 F | 3.40% | 3.70% | 3.60% | |
| 23:50 | JPY | Current Account (JPY) Apr | 2.52T | 2.06T | 2.01T | |
| 05:00 | JPY | Eco Watchers Survey: Current May | 45.7 | 48.9 | 47.4 | |
| 08:00 | EUR | Itay Industrial Output M/M Apr | 0.30% | -0.50% | ||
| 08:30 | EUR | Eurozone Sentix Investor Confidence Jun | -1.9 | -3.6 |
Strong US Jobs, European Elections Hammer EUR/USD
The sight of the 272K new nonfarm job additions and the fastening wages growth above 4% on a yearly basis smashed the dovish Federal Reserve (Fed) expectations on Friday, and sent the US 2-year yield from around 4.70% to 4.90% in a single move, the 10-year yield spiked to 4.45% and the US dollar index cleared the 100 and 200-DMA without hesitation and jumped over the 50-DMA this morning in Asia. We are back to the starting point where the Fed could hardly justify a rate cut when jobs data remains strong and inflation is not easing as fast as it should.
Happily, suspense about what the Fed thinks about this won’t last long; the Fed will start its two-day policy meeting tomorrow and announce its latest decision on Wednesday, just after the CPI update for May due the same day. Price pressures in the US may have steadied and even slightly eased for the core figure in May. But the numbers are still hanging around the 3.4-3.5% levels, well above the Fed’s 2% target, and the last mile – easing from these levels to lower levels – proves to be harder than many thought. Therefore the Fed and its Chair Jerome Powell will probably ask for more patience and their quarterly dot plot will more likely than not show lesser rate cuts this year than they predicted in March. I believe that the median forecast on the dot plot will show one, or maximum two rates penciled in by the Fed members – down from 3 rate cuts that were still flashing back in March. And let me tell you one thing: two rate cuts would hint that the Fed officials are worried about a hard landing and a recession. To me, the best outcome for the mood would be a single rate cut.
All eyes on Apple
Equity markets’ reaction to Friday’s strong jobs data was contained. The S&P500 and Nasdaq closed last Friday slightly in the negative after having advanced to a fresh record. The GameStop frenzy probably came to an end last Friday, when fun couldn’t overweigh fundamentals anymore. While Roaring Kitty was on yet another mission to pump the market on livestream, GameStop decided to reveal its latest quarterly results earlier – and the results were unsurprisingly bad because it’s a non-profitable company. But they also happened to be worse than expected: the revealed a 29% drop in revenue and a quarterly loss of 12 cents of a dollar per share. So the GME shares finished the day 40% lower. I guess this is the end of this wave.
More seriously, if the major US indices could eke out weekly gains last week, it was mostly thanks to a decent rally in chip stocks that saw the Computex event in Taipei give them a platform to show off their new chips and talk about their future plans. This week, tech investors’ focus will be on Apple’s annual WWDC event, where it’s expected to reveal a roadmap regarding its own AI ambitions. Apple fell off the early AI race as it hasn’t come up with a solid AI plan while its tech competitors like Microsoft and Google have been racing relentlessly to get out the most efficient and impressive AI models to gain field. Interestingly, Apple’s stock price recovered a lot of its AI-related losses on hope that a partnership will eventually pop and make Apple devices appealing again. Happily, many investors don’t see Apple as a cutting-edge technology company but rather as a luxury brand that sells millions of hardware that could be home to any reasonably appreciated AI model. But everyone agrees that Apple should develop their AI offering fast, and this week’s WWDC is a line in the sand. Either Apple will come up with a satisfactory AI plan and see its share price pushed to a record, or the week will end with disappointment and Apple will give back the AI-hope related gains. What’s sure is: the world is watching.
Euro hammered
The post-jobs data rally in the US dollar pushed the USJDPY above the 157 level and the EURUSD off a cliff. The yen traders lack conviction that Friday’s Bank of Japan (BoJ) meeting could bring any hawkish shift after the latest growth numbers showed a contraction in the Q1. The BoJ could make minor adjustments to its JGB purchases to keep the yen’s weakness contained.
In Europe, the EURUSD got smashed from around 1.09 to 1.08 after Friday’s surprisingly strong US jobs data and got a further hit to 1.0735 at the weekly open, after the weekend’s European Parliament elections ended in tears for France’s Emmanuel Macron and Germany’s Olaf Scholz’s parties. The far-right Marine Le Pen secured 32% of the votes from the French, a shocker that pushed Macron to call a snap election in France to get things straight. As such, the French 10-year yield kicks off the week with a 2% advance, and the advance is similar elsewhere, as well. The EURUSD returns to the bearish consolidation after taking out the major 38.2% Fibonacci support on the April to June rally. The outlook turns negative, again. I believe that the impact of the political shenanigans will remain short-lived but a hawkish Fed outcome this Wednesday could prove to be harder to shake off.
Strong US Labour Market Report Sends Yields Sharply Higher
In focus today
Today, in the euro area, we receive the Sentix investor confidence indicator which will give us the first estimate of sentiment in June.
We expect little to no market reaction to the European Parliament elections this past weekend, despite its status as a significant political event. Historical data suggests that these elections typically have a minimal effect on markets, and we anticipate a similar scenario this time. For more details, see European Parliament election will not move markets, 14 May 2024
In the coming week, particular focus is on the US May CPI print and subsequent FOMC rate decision on Wednesday, where we expect the Fed to maintain the current level. On Friday, we will get a rate decision from the BoJ. While we expect no change in the policy rate, we do expect it to signal tapering of its bond purchases which have so far remained unchanged at JPY 6tn. a month.
Economic and market news
What happened over the weekend
In France, President Emmanuel Macron has called a snap domestic parliament vote with the first round set for June 30 and the second for July 7. This follows a disappointing result for his party in the European parliamentary elections, where Marine Le Pen's National Rally (RN) party won 32% of the votes against the 15% of Macron's Renaissance party. The RN would gain the power to control domestic policy if they win a majority in the upcoming domestic elections, while Macron would still direct foreign policy.
What happened Friday
In the US, May labour market data was profoundly hawkish, showing a labour market that is still tight - the opposite of what the Fed wants to see. Nonfarm payrolls increased 272k (cons.: +190k), average hourly earnings rose 0.4% m/m (prev.: 0.2%), and data showed that the labour force declined by 250k persons. The greenback gained (DXY +0.76%) and treasury yields rose (10Y +15bps) as markets returned to pricing in just a single December cut.
Euro area wage growth picked up by some 10-20bps in y/y terms in Q1 which was slightly to the high side compared to what the ECB expected. However, the current figures reflect in part a catch-up of previously lost purchasing power from wage agreements that are infrequently negotiated, and the forward-looking indicators show wage pressures that are elevated but also declining. Final GDP for Q1 gave the same signal as its 0.3% q/q growth was almost entirely driven by net exports while domestic pressure remained muted.
Market movements
Equities: Global equities ended lower on Friday, yet still higher for the week. The ECB meeting and the NFP data were the two major takeaways from last week, both supporting the prolonged bullish narrative in our opinion. Despite a significant increase in yields on Friday, it was intriguing to see the relative resistance in equities. Small cap stocks, which lost almost 3% against large-cap last week, suffered the most from this extended bullishness and yield lift. REITs were heavily sold off on Friday due to rising yields and stories about a challenging refinancing environment related to CRE. Cyclical growth, quality, and momentum led the rally once again.""Higher for longe"" for the right reason took VIX down to the low 12s, with the risk of breaking below this level if Wednesday's US CPI report and FOMC is benign. In the US on Friday, Dow fell by 0.2%, S&P 500 by 0.1%, Nasdaq by 0.2%, and Russell 2000 by 1.1%.
FI: The strong US labour market report sent yields sharply higher on Friday, particular led by the belly of the curve. The 272k new jobs was almost 100k better than consensus expectations. The 10y Bunds ended 7bp higher on the day at 2.62%. The knee-jerk reaction from the US, spilled over to the EUR, where markets at one point priced less than 31bp of additional cuts from the ECB by year end, albeit some of it was reversed. The ECB GC member'' comment on Friday was mainly cautioning against assuming a particular move on further rate cuts.
FX: USD rallied on Friday on the back of the stronger than expected US jobs report, while Scandies were among the biggest losers in G10. EUR/USD fell to 1.08, EUR/SEK jumped close to 11.40 and EUR/NOK rose towards 11.60.
EUR/USD Tumbles: Euro Faces Bearish Pressure
Key Highlights
- EUR/USD started a fresh decline from the 1.0915 resistance.
- It traded below a key bullish trend line with support at 1.0810 on the 4-hour chart.
- GBP/USD rallied toward 1.2700 before the bears appeared.
- Gold prices dipped again and traded below $2,320.
EUR/USD Technical Analysis
The Euro started a decline after it failed near 1.0915 against the US Dollar. EUR/USD declined heavily below the 1.0880 and 1.0850 support levels.
Looking at the 4-hour chart, the pair settled below the 1.0820 level, the 100 simple moving average (red, 4-hour), and the 200 simple moving average (green, 4-hour). Besides, it traded below a key bullish trend line with support at 1.0810.
The pair is now trading below the 1.0800 level. Immediate support is near the 1.0750 level. The next major support is near the 1.0720 zone.
A downside break and close below the 1.0720 support zone could open the doors for a larger decline. In the stated case, the pair could decline toward the 1.0650 level.
On the upside, immediate resistance is near the 1.0800 zone. The first major resistance is near the 1.0820 level. A clear move above the 1.0820 resistance might send it toward the 1.0850 level. Any more gains might call for a move toward the 1.0880 level in the near term.
Looking at gold, the bears stepped again and they were able to push the price below the key support at $2,320.
Economic Releases
- Euro Zone Sentix Investor Confidence for June 2024 - Forecast -2.0, versus -3.6 previous.
Euro dives as eurosceptics gain in European Parliament Elections
Euro spiked sharply lower in thin Asian session today, breaking a crucial support level against Sterling. This decline was sparked by the results of European Parliament elections, where Eurosceptic nationalists made notable gains, although the Centre, liberal, and Socialist parties are still expected to hold a majority.
The election outcomes prompted a dramatic response from French President Emmanuel Macron, who called for a parliamentary election with the first round set for June 30. This move gives the far-right an opportunity to gain substantial political power, potentially weakening Macron's presidency three years ahead of its end. In Germany, Chancellor Olaf Scholz's Social Democrats experienced their worst electoral result ever, losing ground to both mainstream conservatives and the hard-right Alternative for Germany.
The announcement of snap elections in France introduces significant uncertainty for the EU, likely impacting economic and market confidence, particularly in France.
Technically, EUR/GBP's strong break of 0.8491 support confirms resumption of whole down trend from 0.9267 (2022 high) Outlook will stay bearish as long as 0.8529 resistance holds. Next target is 100% projection of 0.8764 to 0.8497 from 0.8643 at 0.8376.
As for EUR/CHF, sustained trading below 38.2% retracement of 0.9252 to 0.9928 at 0.9670 and 55W EMA (now at 0.9672) will raise the chance that whole rise from has completed at 0.9928 already. Deeper decline would be seen to 0.9563 support first. Further break there will strengthen this bearish case.
ECB’s Holzmann cautions on risks of further rate cuts
ECB Governing Council member Robert Holzmann expressed concerns on Saturday about the risks of further reductions in ECB borrowing costs, particularly regarding their impact on the Euro exchange rate and inflation.
Holzmann warned, "If the original assumption of three rate cuts were to materialize, and the Federal Reserve didn't respond, it would certainly have an impact on the exchange rate, and with it inflation."
Holzmann was the lone dissenter against ECB's rate cut last week but stated that the decision didn't yet make him concerned about inflation risks.
He explained that ECB officials' implicit commitment to a rate cut was a significant factor in last week's decision. "There was a review of the data and a discussion about it with different points of view," he said. "The council's opinion was that there was no other way, also because it had been announced that such a decision would be made in June."
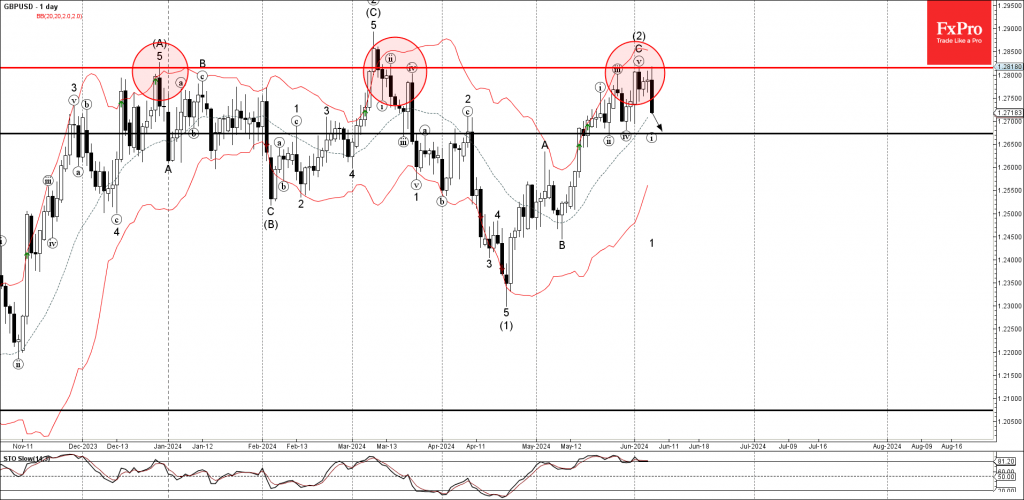
GBPUSD Wave Analysis
- GBPUSD reversed from resistance level 1.2800
- Likely to fall to support level 1.2675
GBPUSD currency pair recently reversed down from the key resistance level 1.2800 (which has been repeatedly reversing the price from December) standing near the upper daily Bollinger Band.
The downward reversal from the resistance level 1.2800 stopped the previous intermediate ABC correction (2).
Given the strength of the resistance level 1.2800, strongly bullish USD sentiment, and the overbought daily Stochastic, GBPUSD currency pair be expected to fall further to the next support level 1.2675, which stopped the previous waves ii and iv.