Sample Category Title
ECB’s Lane specifies three guiding factors for speed and scale of rate cuts
ECB Chief Economist Philip Lane reiterated the central bank's cautious stance on interest rate policy in a speech overnight, underscoring that rate decisions will remain "data-dependent" and determined on a "meeting-by-meeting" basis. While ECB is open to rate cuts if inflation converges to target in sustainable manner, Lane emphasized that the bank is "not pre-committing to a particular rate path."
Lane elaborated on the factors that will guide ECB's decisions on the "speed and scale" of rate cuts. Firstly, he noted that the effects of previous interest rate hikes are "still unfolding", with their full impact on inflation expected to manifest gradually. While the impact on GDP peaked in 2023, the "bulk of impact on inflation is comparatively backloaded" with substantial pass-through effects yet to occur.
Additionally, the evolution of inflation expectations remains a critical consideration for the ECB's policy calibration. Lane also pointed out the dual risks associated with the timing of policy adjustments: easing too soon or too quickly could undermine stabilization efforts, while maintaining overly restrictive rates could hinder economic recovery.
Could They? Should They?
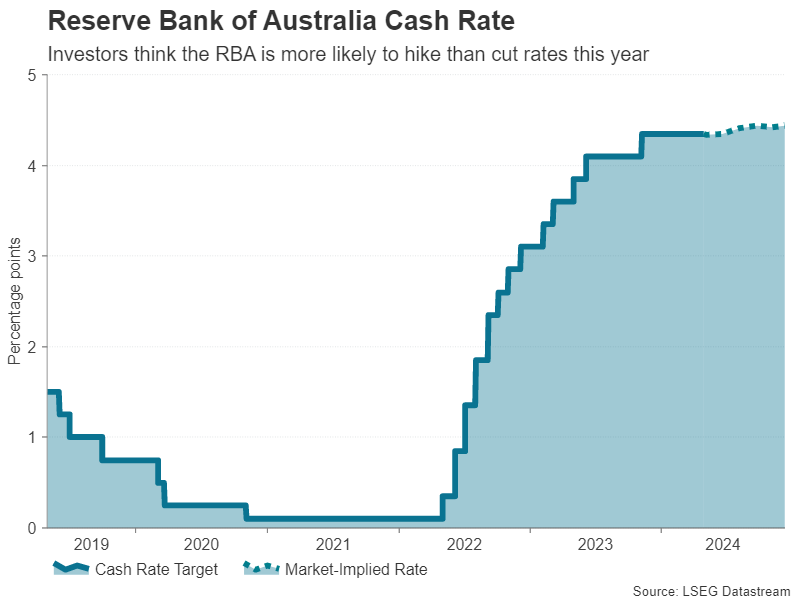
The RBA is on hold until inflation falls further. A scenario necessitating a rate hike is not impossible, but it is unlikely, and it would only take shape later in the year.
With the inflation surprise in the March quarter and some further upside possible in the June quarter, the outlook for rate cuts in Australia has been pushed out. The timing of expected rate cuts in the United States has also been pushed out.
One body of opinion goes further, though, holding that rate hikes are necessary and likely in Australia. The reasoning seems to be that, because the RBA raised rates less than the Federal Reserve, it has (by definition) not done enough and will therefore end up having to do more. The unstated presumption behind this reasoning is that both countries face the same shock and the same context, and therefore the appropriate stance of policy is the same (and produced by the same level of the policy rate). Another unstated assumption in this line of argument is that the feasible rate of unemployment is well described by past averages or minimums, and therefore current rates are too low.
In our view, these presumptions are unjustified. As we have noted in the past, the United States is something of an outlier among peer economies. Domestic demand growth is outstripping that in peer economies; headline inflation is stabilising not still falling; and consumption per capita consistently rising. Both countries have tight labour markets, but our assessment is that next year will see labour market slack emerge in Australia.
More broadly, the two countries are facing very different fiscal contexts, which helps explain why domestic demand growth remains strong in the United States and weak in Australia.
This different fiscal context is in part shaped by the actual and perceived interest-sensitivity of the Australian household sector. Nowhere else in the advanced world is the discourse so aghast at the idea that fiscal policy might add to demand, thereby slowing the hoped-for disinflation and delay (or even reverse) the hoped-for rate cuts. Likewise, nowhere else in the world is the fiscal policymaker so incentivised to avoid a further rate hike.
Recall that while tax cuts are coming, these mostly give back recent bracket creep and are necessary to achieve even the small improvement in growth we expect over the second half of this year. They are also already in everyone’s forecasts. So they cannot be used as a reason to hike rates unless and until evidence emerges that the consumption (and so inflation) response to the tax cuts is larger than anticipated. That evidence, if it were to emerge, will not do so until late this year or early next year. In the here and now, retail spending and consumption more broadly are weak, and consumer sentiment remains extremely subdued.
A reasonable counter to this view is that the state governments are adding to demand. There are also longer-term issues around the structural budget balance. That is a separate issue from macroeconomic management over the cycle, though. State governments are in any case showing themselves to be sensitive to the need to be seen not to add to measured inflation. This week’s announcement by the Queensland government of an increase to electricity rebates is a case in point. Actual electricity bills will be lower, and so measured CPI inflation will be slightly lower, in the second half of the year as a result of that announcement.
Another line of argument for a rate hike hangs off the surprise in the March quarter inflation and labour force data. And maybe that argument is compelling to some of the decision-makers in Chifley Square. The nagging doubt around that course of action is that this was what happened last November, only to see a significant downside surprise in the December quarter inflation and real-side data. The result was that the RBA’s February 2024 forecast for trimmed mean inflation over 2025 reversed the upward revision in the November 2023 forecast round. Past surprises are most relevant for what they say about the future. There is no point warning that the disinflation journey could be bumpy if you then treat every bump as a change in trend.
There is a state of the world in which the RBA would need to raise rates. Consider a scenario where services inflation fails to decline further, the federal Budget later this month is more expansionary than expected, and the Fair Work Commission hands down a decision for an increase in the minimum wage not much below last year's outsized result, even though inflation is much lower one year on. None of these outcomes seem likely given the atmospherics, but it is understandable that policymakers might want to see the actual results, and a bit more progress on inflation, before even thinking about cutting rates.
Could they hike? Not yet, and probably not given the current run of data. The language following next week’s meeting could be more hawkish. In the end, though, the Board will and should remain forward looking. We continue to expect the next move to be a cut, down the track.
Cliff Notes: Confidence Over Inflation Requires More Time
Key insights from the week that was.
In Australia, partial updates on consumption came in on the softer side. Growth in nominal retail sales turned negative in March, down –0.4% (0.8%yr), the decline broad-based across sectors, with food retailing the only segment to record a gain. Downward revisions to prior months also weighed on Q1’s nominal result, leaving it materially below expectations at just 0.2%. Based on data from the Q1 CPI, prices look to be offering nominal growth less support, with outright price declines observed across clothing and several consumer durables in recent months.
Real retail sales (due May 7) are expected to again be weak, up a forecast 0.1%qtr. Further, our Westpac Card Tracker, including transaction data through to late-April, suggests the nominal spending pulse remained poor at the start of Q2. Our latest Red Book provides an in-depth assessment of the current health of the Australian consumer.
On housing, in April tension remained between the official unadjusted CoreLogic’s home value index and Westpac’s seasonally adjusted equivalent, a reported 0.6% gain moderated to just 0.2% once seasonality is accounted for. Annual growth is strong at 9.4% but is moderating. Conditions also differ by city, with Sydney and Melbourne experiencing soft growth as the smaller capital cities continue to post robust gains.
Additionally, the underlying trend for dwelling approvals remains uncertain. Volumes are holding in line with the cycle-lows of last year, and there is a material risk of a further deterioration. The ‘front-end’ of Australia’s residential project pipeline has shrunk materially and will have a long lasting effect on construction activity.
Finally, a note on trade. Australia’s goods trade surplus surprisingly shrunk to a three-year low of $5.0bn in March, extending the trend narrowing since November’s surplus of $11.5bn. The chief culprit was imports which surged 4.2% higher in March after a 4.4% gain in February, with the gains broad based across capital, intermediate and consumer goods. Meanwhile, export earnings were flat in the month, the recovery in iron ore volumes from Cyclone Lincoln offset by a moderation in commodity prices.
Offshore, the big event was the FOMC’s May meeting. Overall, a balanced view of the outlook was given. Risks to the inflation outlook were highlighted, the Committee noting that in "recent months, there has been a lack of further progress toward the Committee's 2 percent inflation objective". However, Chair Powell’s Q&A emphasised the FOMC still expect inflation to ease towards target over the remainder of the year, with the policy stance viewed as “sufficiently restrictive”. All together this points to the question being when (not whether) to cut. The starting point for the labour market and economic activity gives the FOMC scope to take their time assessing inflation risks. This week’s ECI and JOLTs surveys again pointed to a fully employed labour market, though the ISM manufacturing survey employment index again warned of a loss of momentum in job creation. As long as activity growth only slows to around trend and employment growth remains positive, we expect the FOMC to hold off on the first cut until September. Beyond that event, lingering inflation risks and the robust health of the US economy is anticipated to result in the FOMC only slowly easing policy, one 25bp cut forecast per quarter until a mid-2026 low of 3.375%, a terminal rate we regard as modestly contractionary.
Inflation in Europe remained at 2.4%yr in April, with services inflation down a tad to 3.7%yr from 4.0%yr the prior three months. Activity growth meanwhile recovered to 0.3%qtr in Q1, more than reversing the contraction suffered during the technical recession of H2 2023. While there are upside risks for inflation, progress continues to be seen. And there are also downside risks to growth from trade and credit conditions. This sets the stage for the ECB to deliver their first cut at the June meeting.
China's NBS manufacturing PMI was broadly consistent with long-term average levels in April, the price sub-component an exception – 2 points below the 5-year pre-COVID average. This is consistent with overcapacity in many existing factories and industry’s drive to continue expanding. The services sector remains challenged, but the ‘expectations’ component 5-point gain points to optimism returning. The Government’s growth aim being achieved without aggressive policy stimulus likely helping matters.
Gold Price Could Restart Increase Above This Resistance
Key Highlights
- Gold started a downside correction and traded below $2,350.
- A connecting bearish trend line is forming with resistance at $2,325 on the 4-hour chart.
- Oil prices extended losses but remained stable above $80.00.
- Bitcoin price traded to a new weekly low below $60,000.
Gold Price Technical Analysis
Gold prices started a downside correction from the $2,431 high against the US Dollar. It traded below the $2,400 and $2,365 support levels.
The 4-hour chart of XAU/USD indicates that the price even broke the $2,325 support and settled below the 100 Simple Moving Average (red, 4 hours). However, the bulls are now active above the $2,280 support and the 200 Simple Moving Average (green, 4 hours).
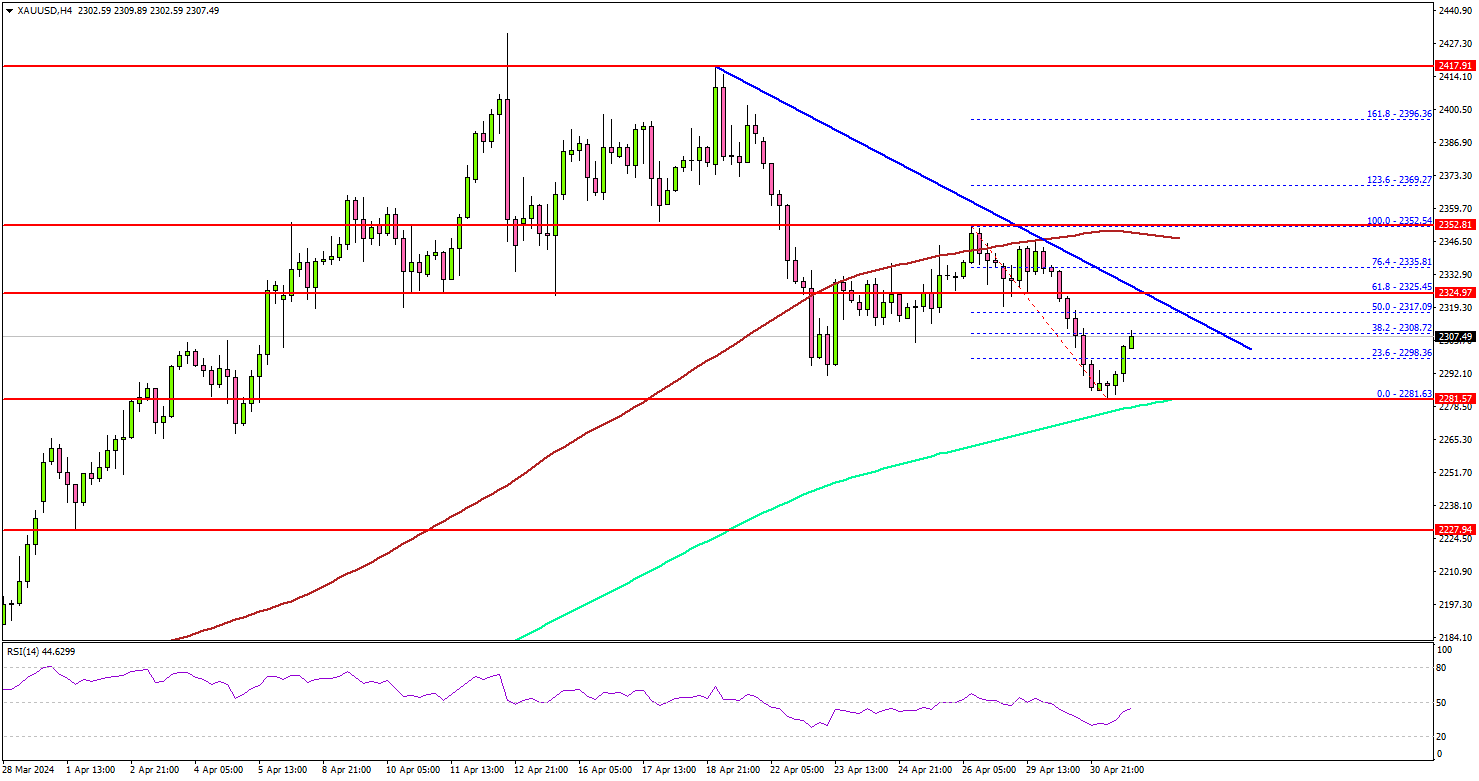
The price is now consolidating losses, with an immediate resistance at $2,318. The first major resistance is now forming near connecting bearish trend line at $2,325.
The main resistance is now forming near $2,350 and the 100 Simple Moving Average (red, 4 hours), above which the price could accelerate higher toward $2,395.
On the downside, the 200 Simple Moving Average (green, 4 hours) is the key at $2,280. A downside break below the $2,280 support might call for more downsides. The next major support is near the $2,250 level. Any more losses might send Gold prices toward $2,220.
Looking at Bitcoin, there was a strong decline, and the bears were able to push the price below the $60,000 and $58,500 support levels.
Economic Releases to Watch Today
- Germany’s Manufacturing PMI for March 2024 - Forecast 42.2, versus 42.2 previous.
- Euro Zone Manufacturing PMI March 2024 – Forecast 45.6, versus 45.6 previous.
- US Initial Jobless Claims - Forecast 212K, versus 207K previous.
Elliott Wave Analysis on EURJPY Expects Support Soon
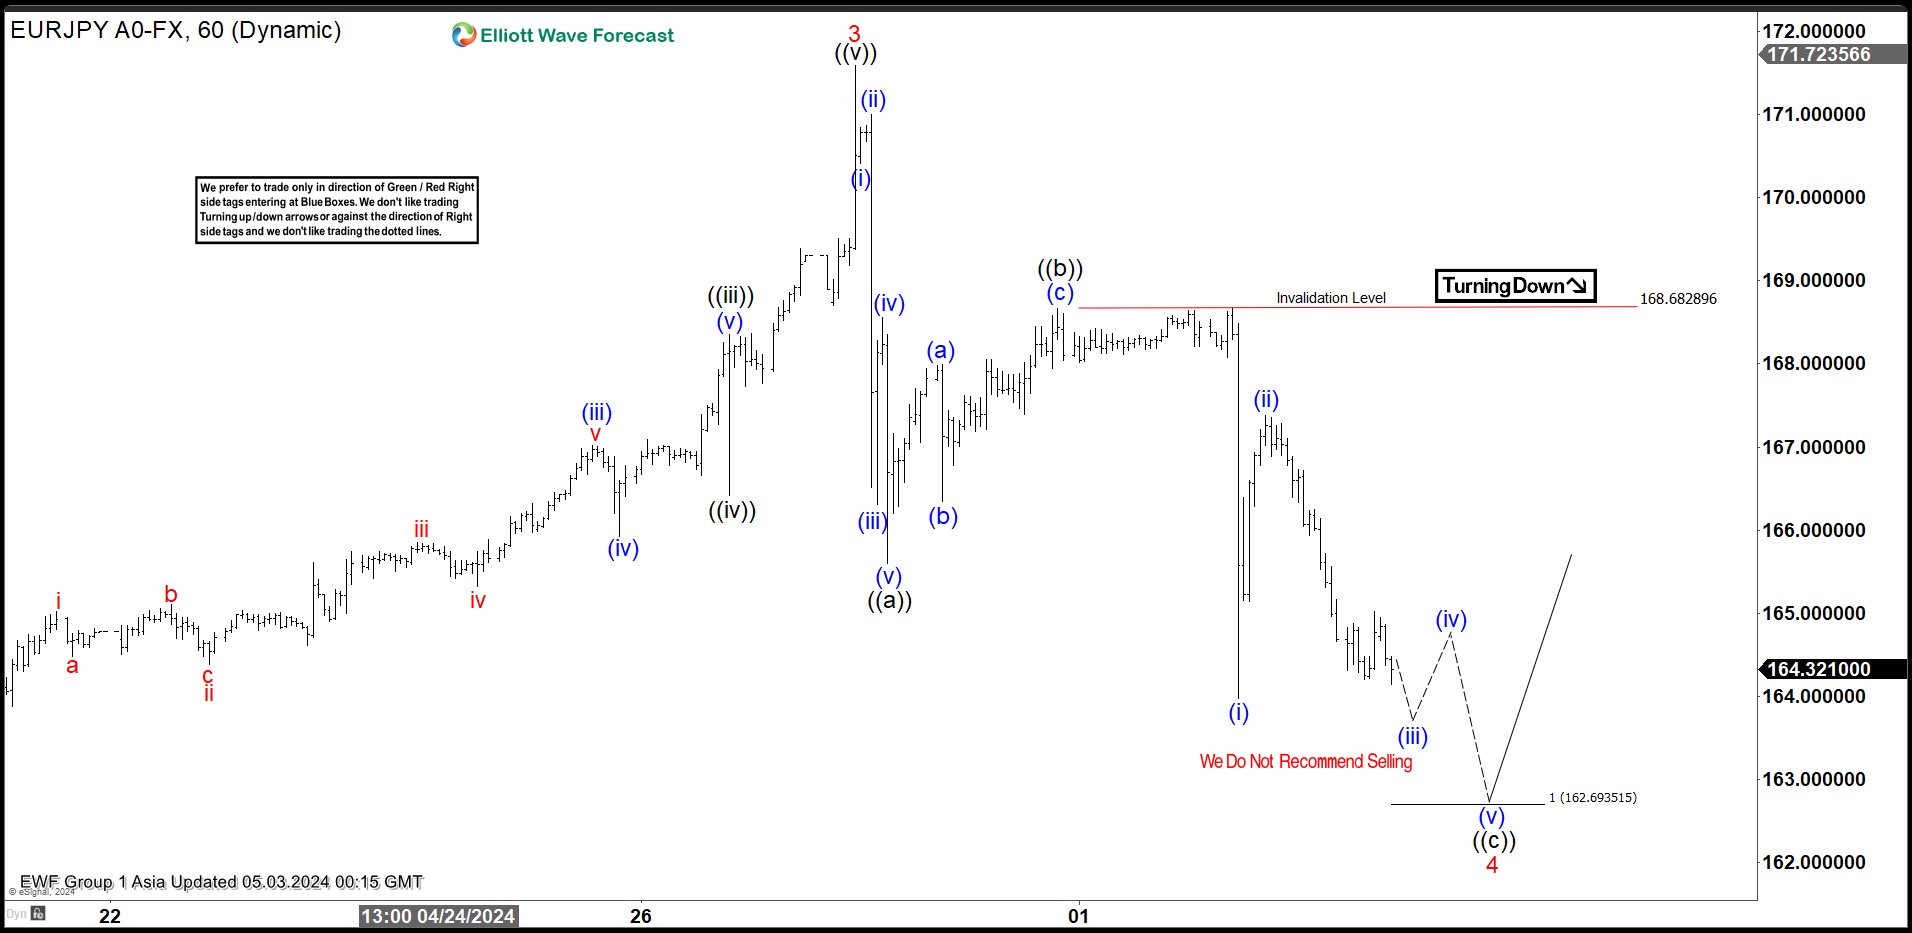
Short Term Elliott Wave View on EURJPY suggests the rally from 12.7.2023 low is in progress as a 5 waves. Up from 12.7.2023 low, wave 1 ended at 163.71 and pullback in wave 2 ended at 160.21. Pair extended higher in wave 3 towards 171.58. The 60 minutes time frame below shows the rally which ended wave 3. Wave 4 pullback is currently in progress with internal subdivision as a zigzag Elliott Wave structure. Down from wave 3, wave (i) ended at 170.41 and rally in wave (ii) rally ended at 171. Pair extended lower in wave (iii) towards 166.31 and rally in wave (iv) ended at 168.55.
Final leg wave (v) lower ended at 165.6 which completed wave ((a)) in higher degree. Pair then bounced in wave ((b)) with internal subdivision as a zigzag in lesser degree. Up from wave ((a)), wave (a) ended at 167.99 and pullback in wave (b) ended at 166.34. Final leg wave (c) higher ended at 168.68 which completed wave ((b)) in higher degree. Pair extended lower in wave ((c)) with internal subdivision as 5 waves. Down from wave ((b)), wave (i) ended at 163.97 and wave (ii) rally ended at 167.38. Near term, as far as pivot at 168.68 high stays intact, expect pair to continue lower. Potential target lower is 100% – 161.8% Fibonacci extension of wave ((a)). This area comes at 159 – 162.7 area where support can be seen.
EURJPY 60 Minutes Elliott Wave Chart
EURJPY Elliott Wave Video
https://www.youtube.com/watch?v=dH3o60R9TwY
EURJPY Wave Analysis
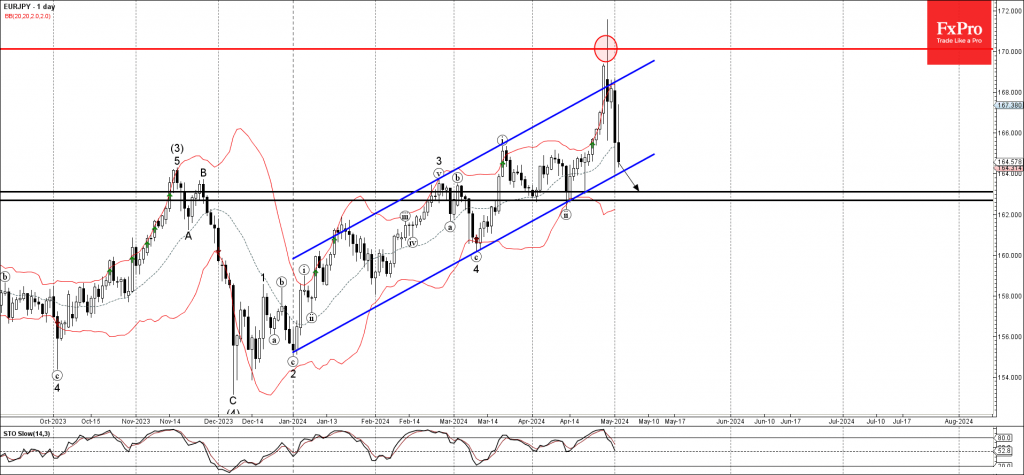
- EURJPY under strong bearish pressure
- Likely to fall to support level 163.10
EURJPY under the strong bearish pressure after the price reversed down from the major multi-year resistance level 170.00 (which started the sharp weekly downtrend back in 2007).
The resistance level 170.00 was strengthened by the upper daily Bollinger Band and by the resistance trendline of the daily up channel from January.
EURJPY can be expected to fall further to the next support level 163.10 (which reversed the price twice in April).
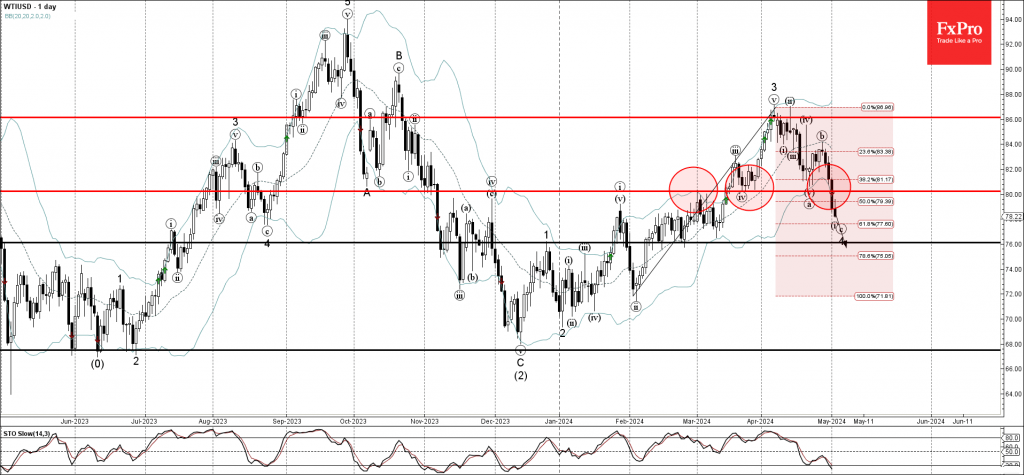
WTI Crude Oil Wave Analysis
- WTI broke round support level 80.00
- Likely to fall to support level 76.00
WTI crude oil recently broke the round support level 80.00 (which has been reversing the price from the middle of March) standing close to the 38.2% Fibonacci correction of the upward impulse from February.
The breakout of the support level 80.00 accelerated the active minor impulse wave c of the ABC correction 4 from the start of April.
Given the strength of the active impulse wave c, WTI crude oil can be expected to fall further to the next support level 76.00 (target price for the completion of the active wave c).
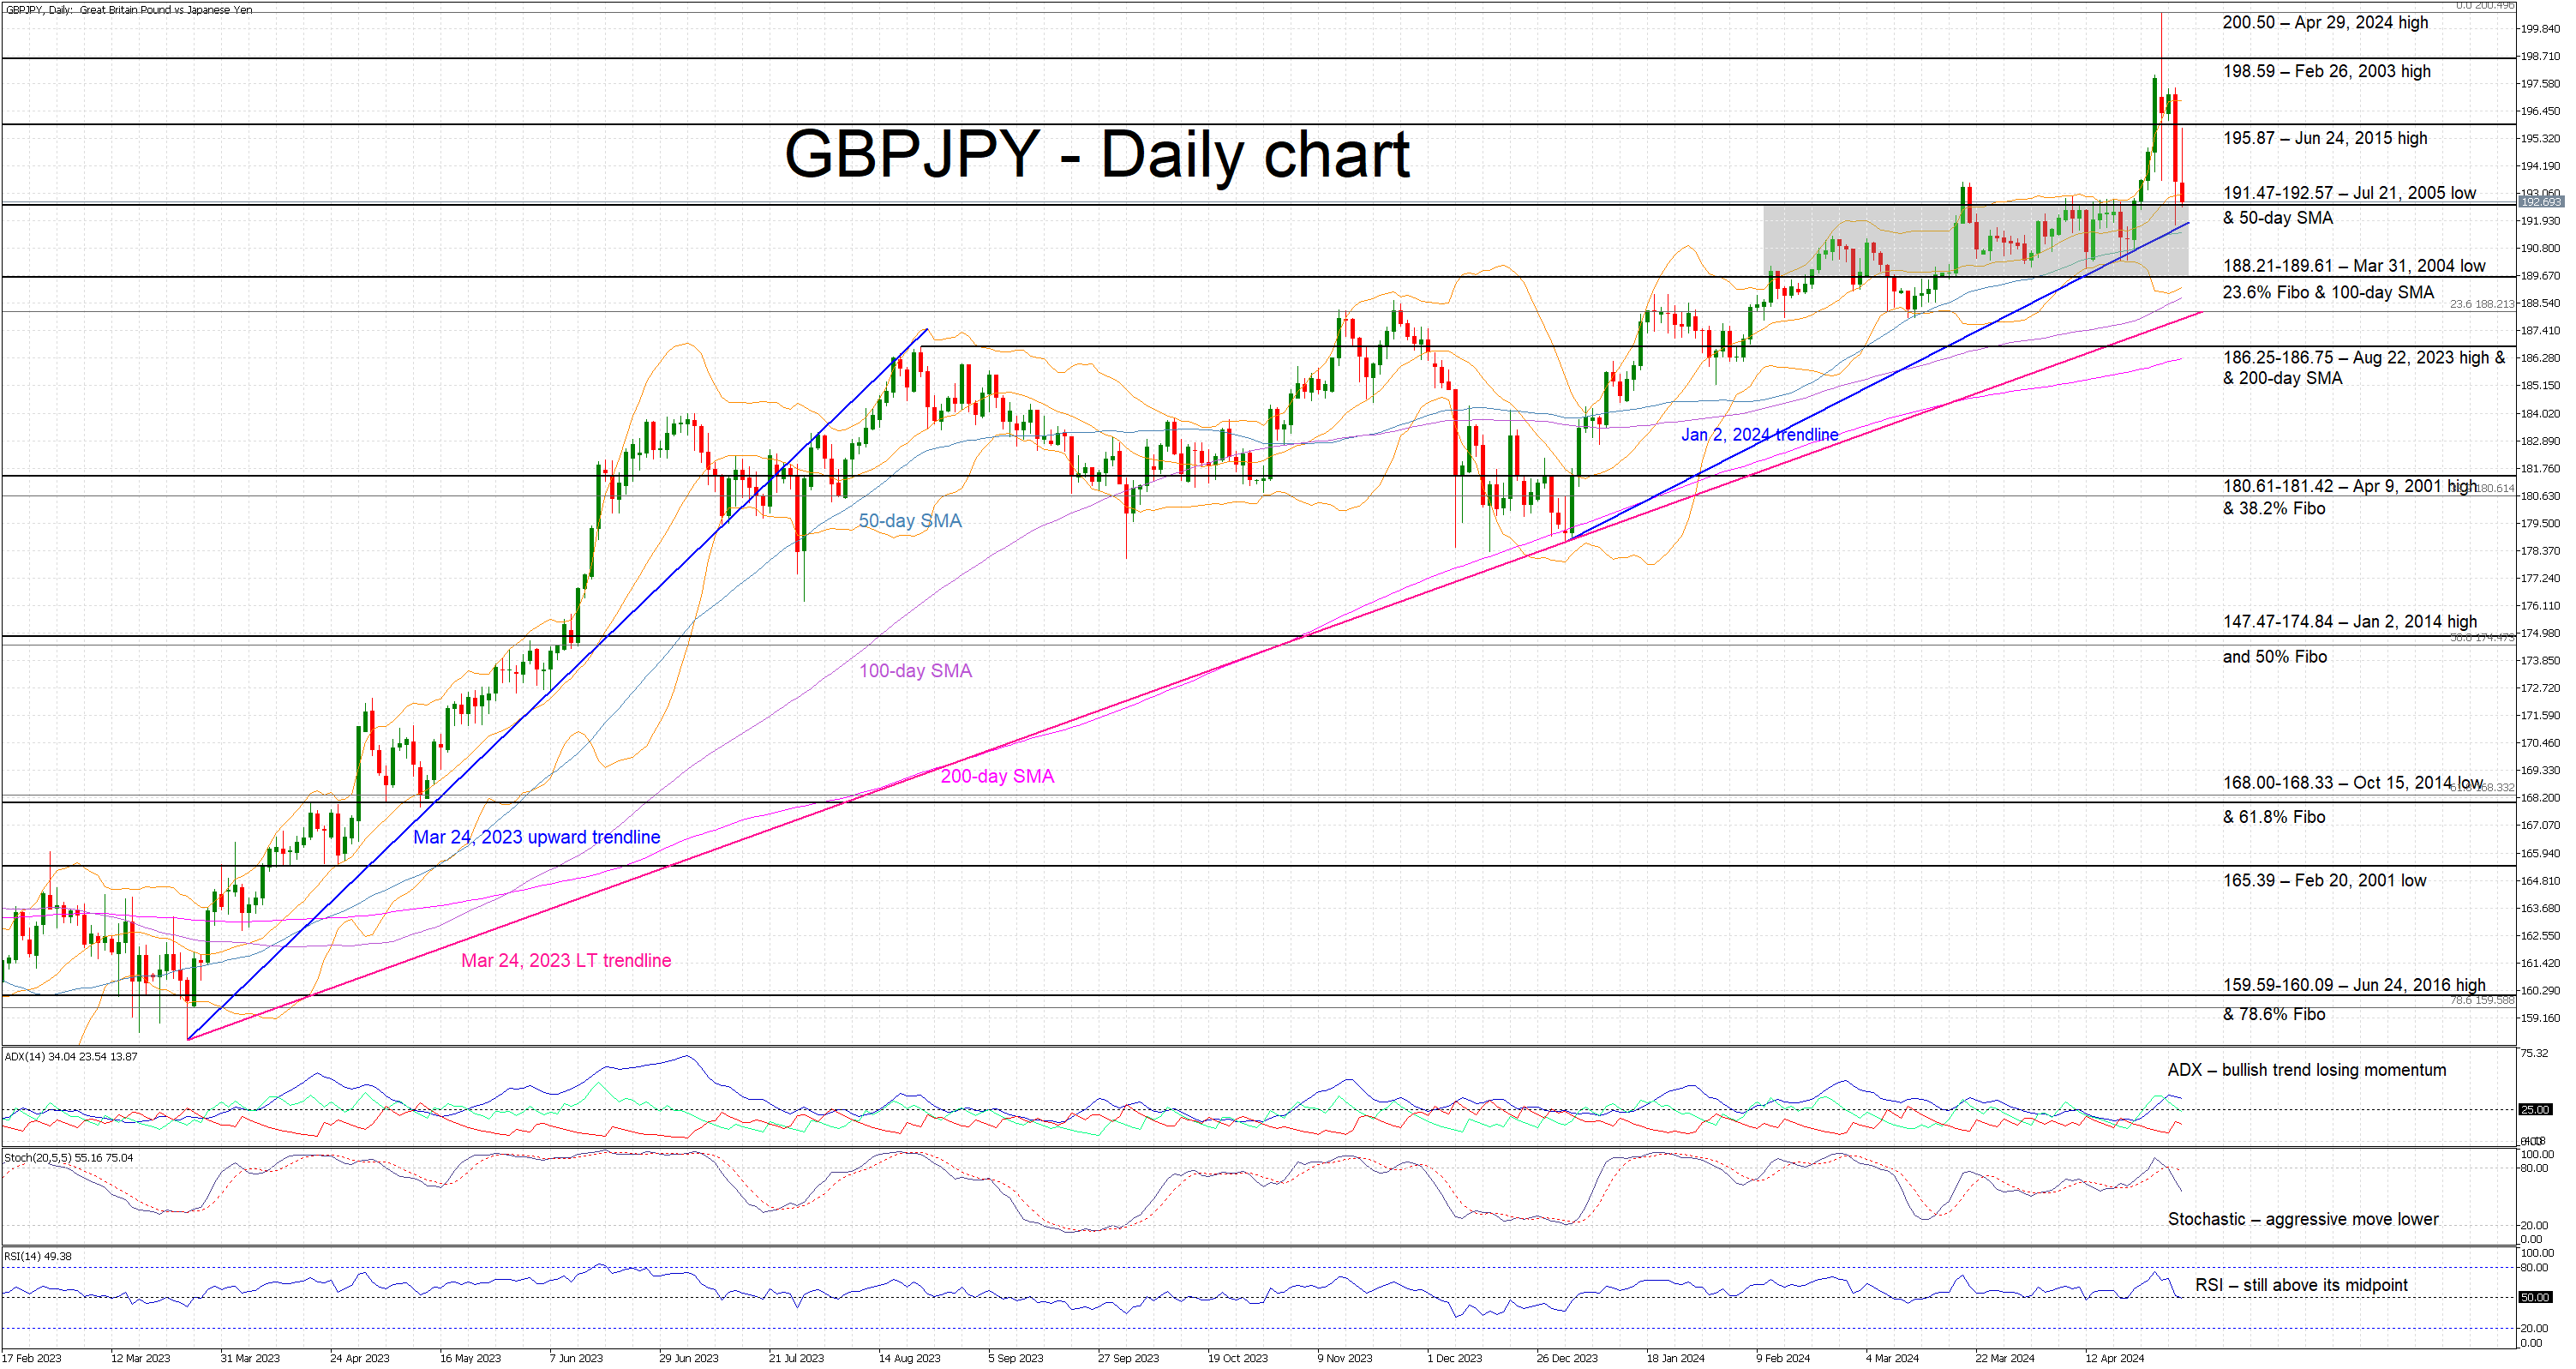
GBPJPY Returns to Pre-intervention Levels
- GBPJPY tries to record another red candle, well below its recent record high level
- The BoJ intervenes again since the Fed remains concerned about inflation
- Momentum indicators are mixed, stochastics acknowledge the bearish pressure
GBPJPY is hovering around the busy 191.47-192.57 range and far below its new 16-year high of 200.50. The market is digesting the repeated BoJ interventions with the latest action most likely caused by the Fed’s unwillingness to open the door to rate cuts. Japanese authorities could stick with their plan if yen remains under pressure.
Momentum indicators have taken notice of these market interventions. More specifically, the Average Directional Movement Index (ADX) is trading above its 25-threshold, but it is signaling that the recent bullish trend has probably run its course. Interestingly, the RSI has returned to its midpoint, but it appears unable to dip below it and record a new 4-month low.
More importantly, the stochastic oscillator has broken aggressively below its moving average and it is edging towards its midpoint. Should this move continue, it would be seen as a strong bearish signal.
Should the bulls remain confident, they could try to regain market control and push GBPJPY towards the June 24, 2015 high at 195.87. They could then stage a rally towards the 198.59 level and possibly set their eyes on a much bigger prize - the April 29, 2024 high at 200.50.
On the other hand, the bears are trying to take advantage of the repeated BoJ interventions and push GBPJPY below the 191.47-192.57 area, which is populated by the July 21, 2005 and the 50-day simple moving average (SMA), as well as the January 2, 2024 ascending trendline. They could then test the support set by the 188.21-189.61 range and, if successful, pave the way for the busier 186.25-186.75 area.
To sum up, GBPJPY remains at the mercy of the BoJ with some key support levels coming up and possibly testing the bulls’ commitment.
RBA Decision: Will a Rate Hike be Back on the Table?
- RBA meets amid uptick in Australian inflation
- Muddied economic outlook may complicate policy path
- Aussie remains choppy ahead of Tuesday's decision (04:30 GMT)
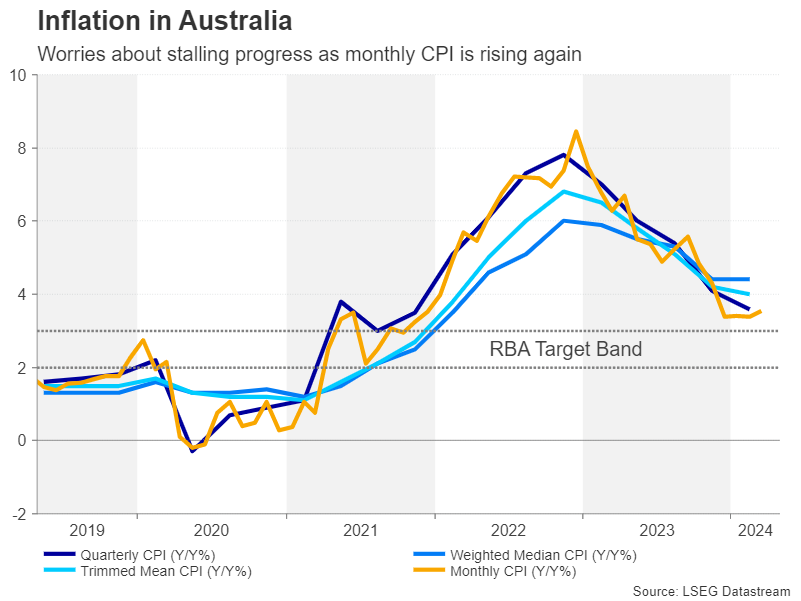
Inflation setback
The Reserve Bank of Australia is no stranger to policy flip-flops and the May decision may just add to the tally. Having dropped their tightening bias as recently as the last meeting in March, policymakers are staring at an unpleasant inflation picture.
The monthly CPI reading ticked up to 3.5% y/y in March, while two closely watched underlying measures came in hotter than expected in the first quarter. Moreover, despite the labour market having somewhat cooled over the past year, wage growth has kept on accelerating, reaching 4.2% y/y in the fourth quarter of 2023.
The Q1 figure for wage costs isn’t due until May 15 and the next CPI report will be released even later on May 29. Both pieces of data could be crucial to deciding whether the latest setback in the fight against inflation is just a blip or a warning that monetary policy is not restrictive enough.
Focus on new CPI forecasts
Without the additional data, however, the RBA will probably maintain a neutral stance in May, keeping the cash rate at 4.35%. But the Bank will also publish its quarterly Monetary Policy Statement containing updated economic projections. In the previous report, the Bank did not see inflation falling within its 2-3% target band before the end of 2025.
It’s unlikely that Governor Michelle Bullock would tolerate any further delay to meeting the inflation goal so the new forecasts may well provide a vital clue to future policy even if there’s little modification to the statement.
Economic growth has been patchy
Looking at the economy more broadly, recent indicators support a wait-and-see approach by the RBA. Employment unexpectedly fell in March while the jobless rate crept up slightly. Retail sales also defied forecasts of an increase, suggesting consumers remain cautious about spending.
But there’s been a marked improvement in the services PMI since December and the housing market is booming again. More importantly perhaps for Australian exporters, China’s economy seems to be on a steady path to recovery.
Yet, none of the above pose an outsize danger to inflation, so the main debate for board members will more likely be about how comfortable they are to let CPI run above the target for a prolonged duration rather than how to contain a resurgence.
Aussie stuck in a downward trajectory
If there is a hawkish tilt and the RBA reinstates its tightening bias, the aussie could recover above its moving averages and challenge the descending trendline around $0.6590. A step higher would bring the April peak of $0.6644 into range before attention shifts to the $0.6700 level.
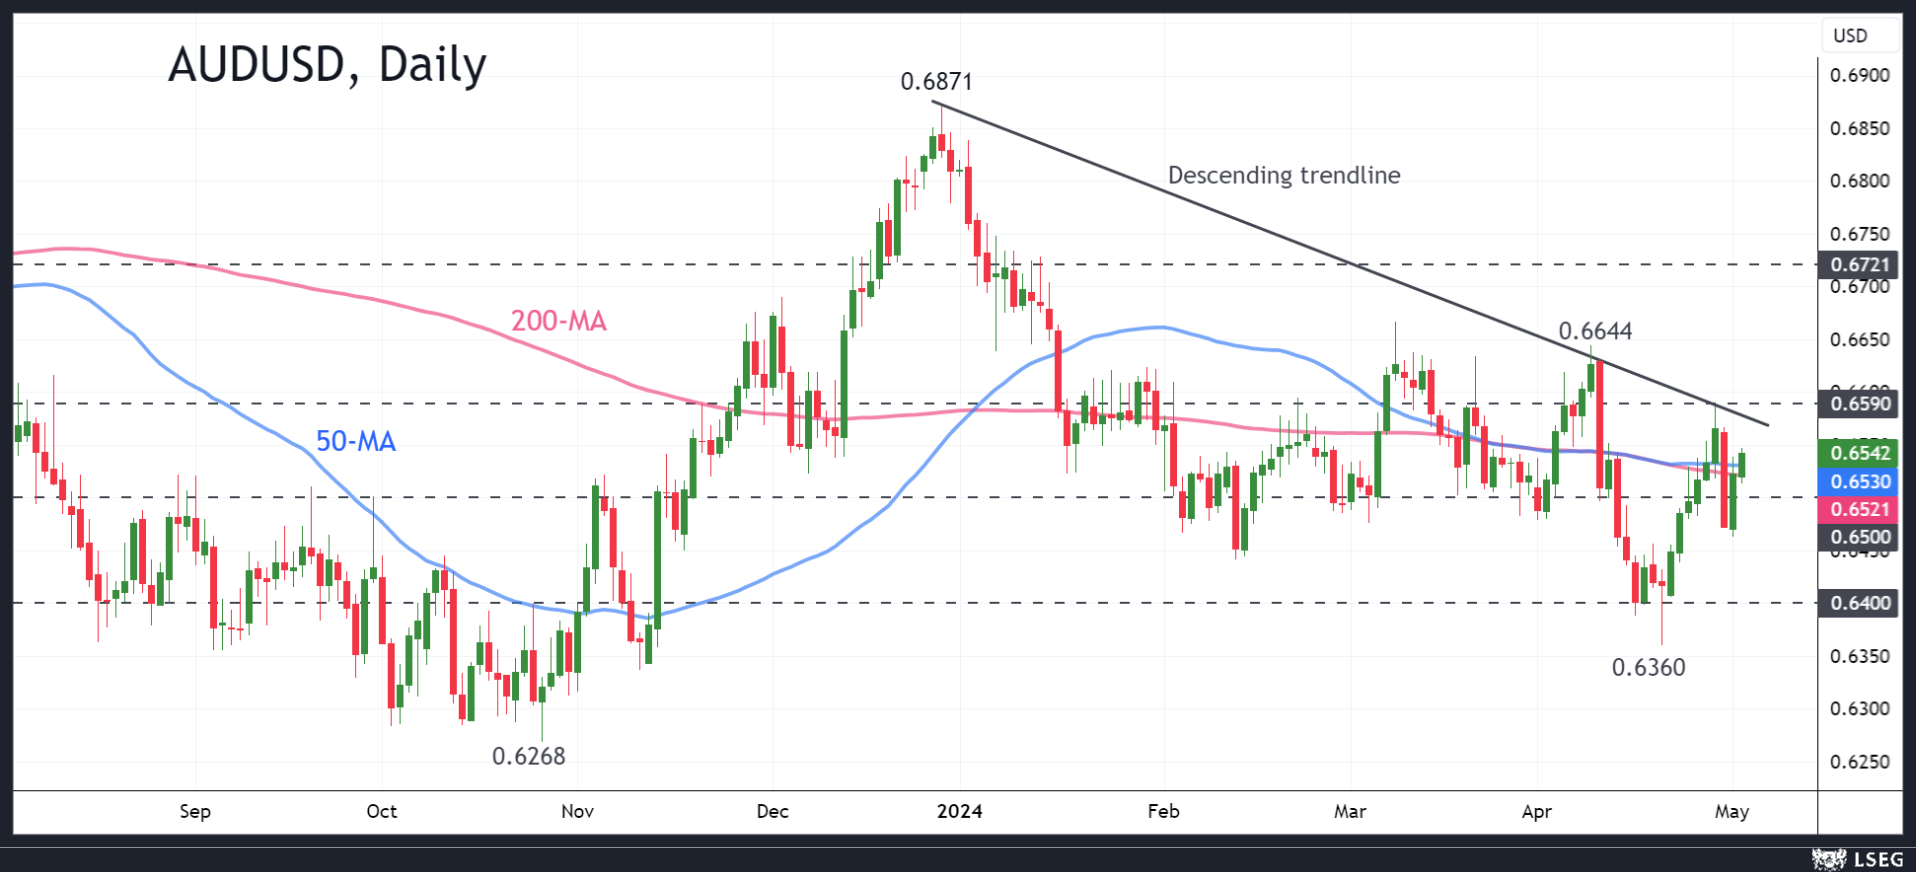
In the scenario that the RBA overlooks the latest signs of price stickiness, the aussie could head back towards the April trough of $0.6360 before revisiting the October low of $0.6268.
Is there a risk of a surprise rate hike?
With sticky inflation in the US also proving problematic for the Fed, there’s already been a sharp repricing of rate cut expectations for the major central banks. For the RBA, investors have gone a step further and priced in around a 40% probability of a 25-basis-point rate increase by year end. Hence, a hawkish tone alone might not necessarily spur a significant reaction in the markets on Tuesday.
However, it is worth considering Governor Bullock’s greater urgency in beating inflation compared to her predecessor. So a surprise rate hike cannot be completely ruled out, particularly as policymakers have the option of a smaller increase of 15 bps at their disposal.