Sample Category Title
Brent Crude Oil Hits Seven-Week Low
Brent crude oil prices have dropped to $83.95 per barrel on Thursday, marking the lowest level in seven weeks. This decline follows recent US statistics indicating a significant increase in crude oil inventories and production. According to the Department of Energy, inventories rose by 7.30 million barrels last week, contrary to the forecasted decrease of 2.3 million barrels. Additionally, February's oil production escalated to 13.15 million barrels per day from January's 12.58 million, the most substantial monthly increase in three and a half years.
These developments have provided bearish signals for the market, mirroring similar trends on the commodity platform.
Amidst falling oil prices, there is ongoing discussion about potential US actions to replenish their strategic hydrocarbon reserves, particularly if prices drop to $79.00 per barrel or below.
The oil market is also influenced by some stabilisation in the Middle East, with emerging hopes for a ceasefire between Israel and Hamas, facilitated by Egypt. This development has reduced the risk of a broader conflict in the region, contributing to the decrease in oil prices.
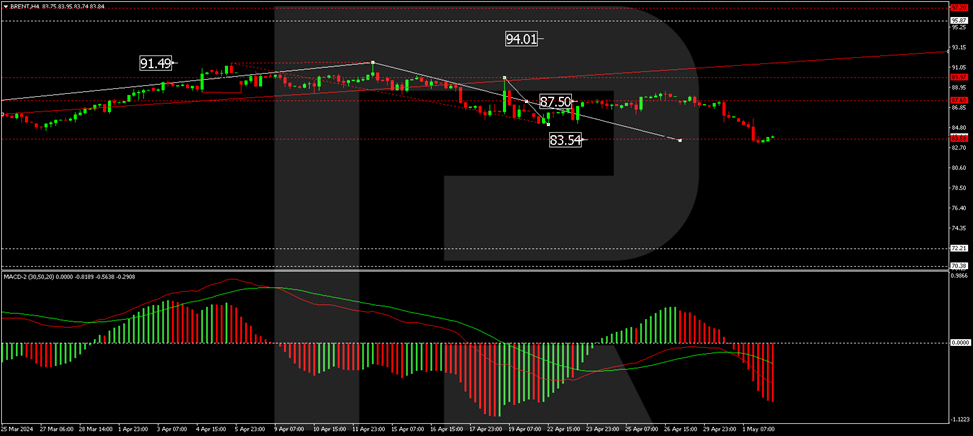
Brent technical analysis
On the H4 chart, Brent oil has formed a consolidation range around the $87.50 level, with the current correction wave extending downwards. The price has already reached $83.50, and a further stretch to $82.82 is possible. Upon completing this correction, a new wave of growth towards $88.60 is anticipated, potentially continuing to $95.00. This bullish scenario is supported technically by the MACD indicator, whose signal line is below zero, suggesting a forthcoming update of the lows.
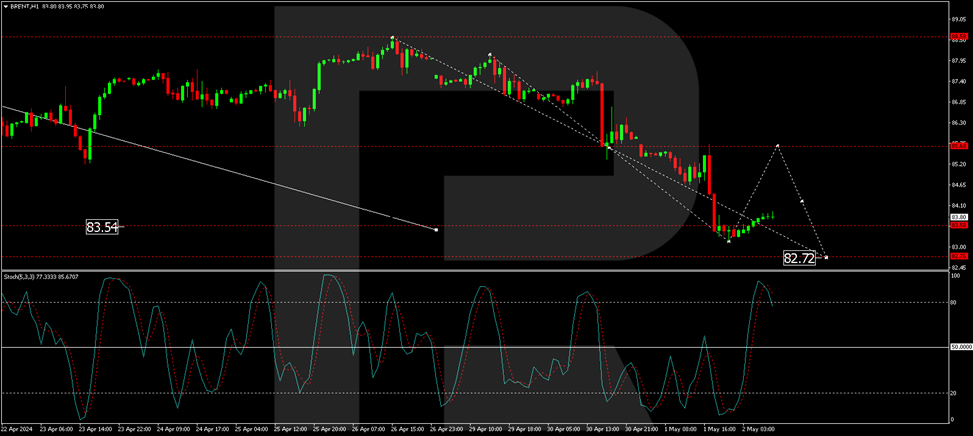
On the H1 chart, a fifth correction structure is developing towards $82.72. Once this target is achieved, a growth phase to $88.58 is expected, marking the first target of the new growth wave. This outlook is corroborated by the Stochastic oscillator, with its signal line currently above 80 and poised to descend to 20.
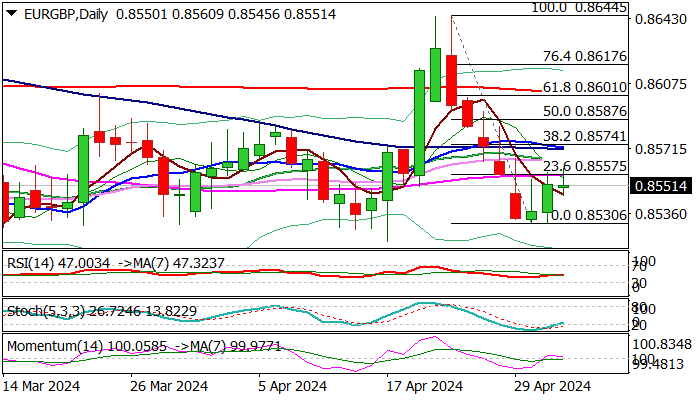
EUR/GBP outlook: Thin Daily Cloud Provides a Lot of Headwinds and Keeps Risk of Recovery Stall
Two-day recovery seems to be running out of steam, following repeated failure to break above thin daily cloud, with long upper shadows on daily candles, warning of persisting pressure.
Technical picture on daily chart is bearishly aligned as MA’s remain in full bearish setup and 14-day momentum turned south and nearing the centreline.
Another failure to clear cloud top, reinforced by 55DMA would add to signals of recovery stall and increase risk of fresh weakness and retest of 0.8530 (Apr 30 low) and 0.8520 (Apr 14 low).
Only acceleration and close above 0.8560 /75 zone, where a cluster of daily MA’s (10/20/100) and Fibo 38.2% of 0.8644/0.8530 bear-leg) would provide relief and shift near-term focus to the upside.
Res: 0.8560; 0.8575; 0.8587; 0.8605.
Sup: 0.8545; 0.8530; 0.8520; 0.8503.
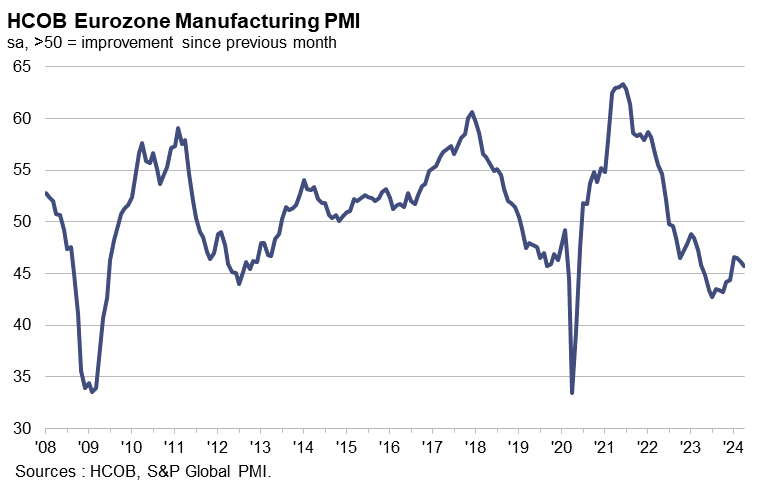
Eurozone PMI manufacturing finalized at 45.7, deepens recession despite bright spots in Spain and Netherlands
Eurozone's manufacturing sector remains entrenched in recession as April's PMI figures highlight ongoing challenges and disparities within the region. The overall Manufacturing PMI for the Eurozone was finalized at 45.7, a slight decrease from March's 46.1.
Among the member states, Greece led with a PMI of 55.2, though it marked a three-month low for the country. Spain and the Netherlands exhibited positive trends, with Spain reaching a 22-month high at 52.2 and the Netherlands achieving a 20-month high at 51.3. Conversely, major economies like Germany, France, and Italy continued to struggle. Germany's PMI slightly improved to a two-month high of 42.5, and France's was a three-month low at 45.3, despite a slight uptick from the flash estimate.
Cyrus de la Rubia, Chief Economist at Hamburg Commercial Bank, noted the manufacturing sector is prolonging its drawn-out recession into April." He highlighted the significant downturn in new orders, which he described as "a rapid decline unmatched in speed over the past four months and devoid of international support." De la Rubia also pointed out the concerning trends in the capital goods sector, which is usually a bellwether for broader industrial health but has been "hit particularly hard" in the current cycle.
Spain stands out as an anomaly within the Eurozone, continuing to demonstrate economic resilience with sustained growth in its manufacturing sector. This divergence is notable, especially against the backdrop of more subdued economic performances in other major Eurozone economies like Germany, France, and Italy, which have failed to gain similar momentum.
USD/JPY: US Dollar Weakens After Statements from Federal Reserve Chair
Last night, the Federal Reserve's decision regarding interest rates was published, which, as expected, remained unchanged at 5.5%. The subsequent press conference by Powell was of particular interest to market participants.
According to CNBC, during the conference, the Fed Chair almost ruled out a rate hike as the next step, emphasizing the monetary policy's independence from the upcoming presidential elections. Additionally, he stated that:
- Concerns regarding stagflation are exaggerated;
- The Fed intends to lower rates smoothly and gradually;
- The duration of maintaining high rates is increasing indefinitely.
The market's reaction to the Fed's news was a weakening of the dollar – apparently, concerns about another rate hike as the next step have diminished.
The dollar weakened significantly against the yen – the USD/JPY rate dropped from 157.50 to 153.10 yen per dollar yesterday evening (approximately -2.7%) in less than an hour, although the rate later recovered. The reason lies in the context, specifically the yen's strong strengthening on Monday, when the rate exceeded 160 yen per dollar, as we wrote on the morning of April 29. Perhaps there was another intervention yesterday?
However, official sources refuse to comment. Tokyo may be adhering to a tactic of keeping investors in the dark about its currency intervention strategy. Although, as reported by the Japan Times, fluctuations of 5 yen per dollar indicate interventions.
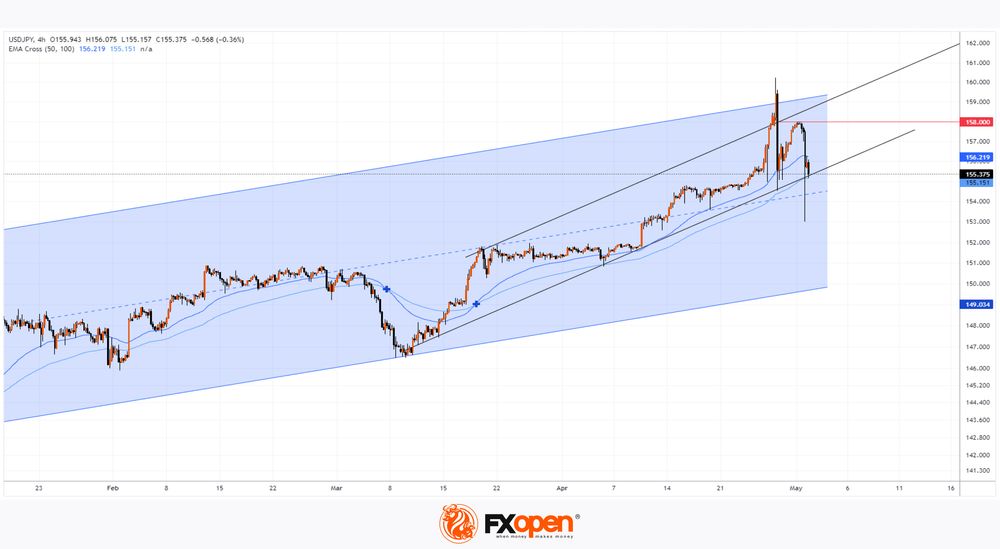
Today's technical analysis of the USD/JPY chart shows:
- Following Monday's intervention (assuming it occurred), the USD/JPY rate rebounded from the lower boundary of the ascending channel shown in black;
- At the rebound peak, the 158 yen per dollar level acted as resistance;
- After yesterday's weakening of the US dollar, the rate broke below the previous week's minimum, falling below the median line of the blue channel.
Although the EMA 50 is above the EMA 100, a change in market sentiment can be assumed. This would be evidenced by the price consolidating below the short-term (black) channel, which would open the path towards the long-term (blue) channel's lower boundary.
Trade over 50 forex markets 24 hours a day with FXOpen. Take advantage of low commissions, deep liquidity, and spreads from 0.0 pips. Open your FXOpen account now or learn more about trading forex with FXOpen.
This article represents the opinion of the Companies operating under the FXOpen brand only. It is not to be construed as an offer, solicitation, or recommendation with respect to products and services provided by the Companies operating under the FXOpen brand, nor is it to be considered financial advice.
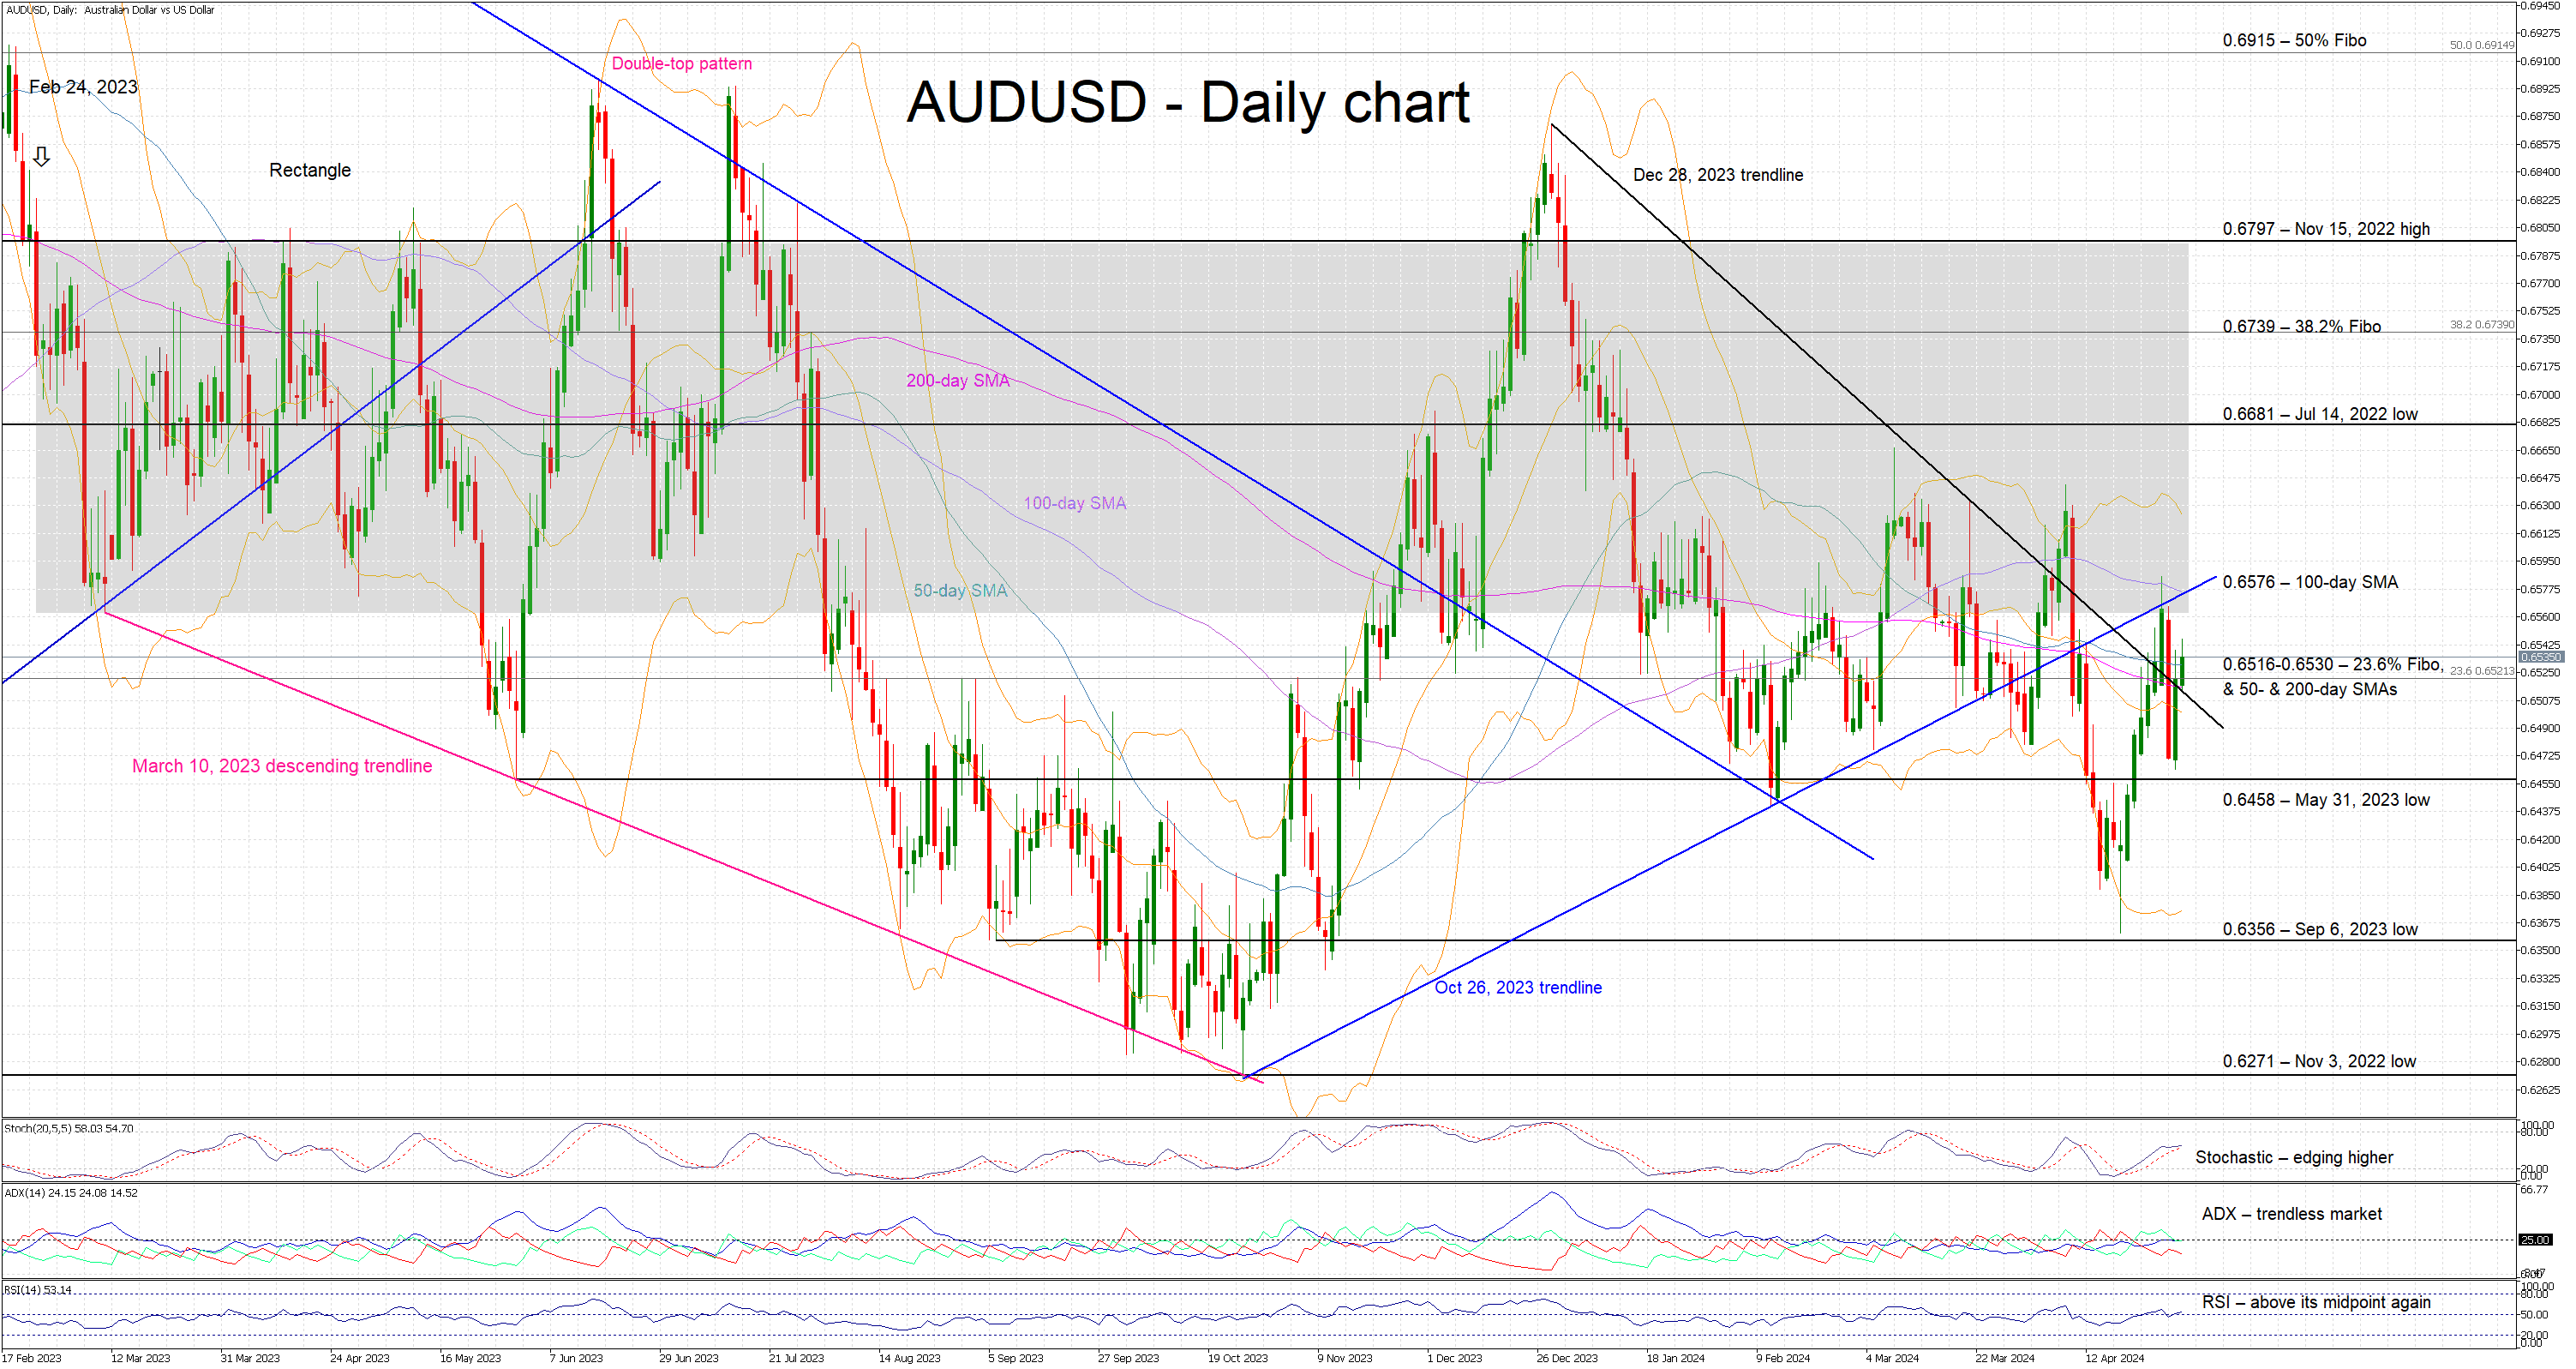
Bullish Pressure in AUDUSD Lingers
- AUDUSD in the green again today, above the 50-day SMA
- The bullish tendency manifesting since the April low persists
- Momentum indicators mostly mixed; stochastics could send a bullish signal
AUDUSD is recording another green candle as the market appears to be relieved that Fed Chairman Powell did not mention rate hikes as a viable policy option at Wednesday's press conference. AUDUSD is currently battling with the 50-day simple moving average (SMA) and possibly on its way to break the recent series of lower highs and lower lows.
The bullish tendency since the April lows persists but it is not entirely reflected in the momentum indicators. In more detail, the Average Directional Movement Index (ADX) is hovering around its 25-threshold, signaling a trendless market, and the RSI is tentatively edging above its 50-midpoint. More interestingly, the stochastic oscillator is trying to stay above its moving average, setting a course for a higher high and possibly opening the door to a similar move in AUDUSD.
Should the bulls remain confident, they could try to complete their move above the 0.6516-0.6530 range and then test the resistance set by the 100-day SMA at 0.6576. If successful, they could then stage a move towards the July 14, 2022 low at 0.6681 with the 38.2% Fibonacci retracement level of the April 5, 2022 – October 13, 2022 downtrend at 0.6739 also being in the vicinity.
On the flip side, the bears are probably keen to put a stop to the current bullish move. They could try to push AUDUSD back below the 0.6516-0.6530 area, which is populated by the 23.6% Fibonacci retracement level and the 50- and 200-day SMAs, as well as the December 28, 2023 downward sloping trendline. They could then test the support set by May 31, 2023 low at 0.6458.
To sum up, AUDUSD bulls remain in control, but they probably need to rally above the recent 0.6586 high in order to confirm that a new bullish trend is in place.
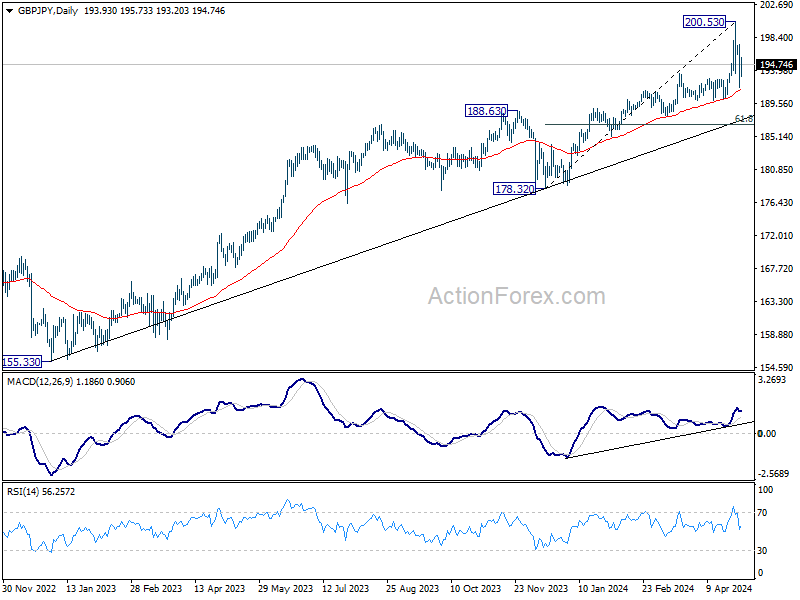
GBP/JPY Daily Outlook
Daily Pivots: (S1) 191.01; (P) 194.22; (R1) 196.66; More..
GBP/JPY's fall from 200.53 resumed and hit 191.77 before recovering. For now, further decline is in favor as long as 197.40 minor resistance holds, as correction to rise from 178.32. Sustained break of 55 D EMA (now at 191.42) will pave the way to 61.8% retracement of 178.32 to 200.53 at 186.80.
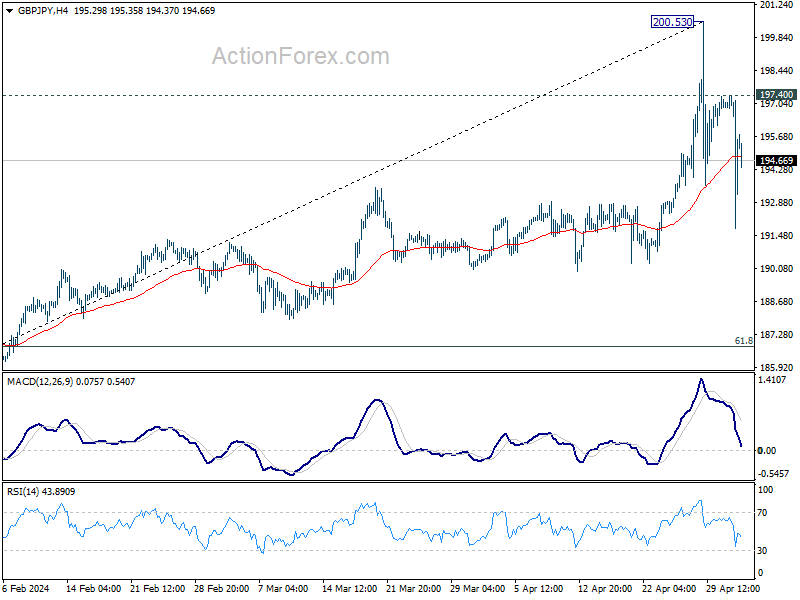
In the bigger picture, current rally is part of the up trend from 123.94 (2020 low). Sustained break of 61.8% projection of 155.33 to 188.63 from 178.32 at 198.89 will pave the way to 100% projection at 211.65. Break of 189.97 support is needed to be the first sign of medium term topping. Otherwise, outlook will remain bullish in case of retreat.
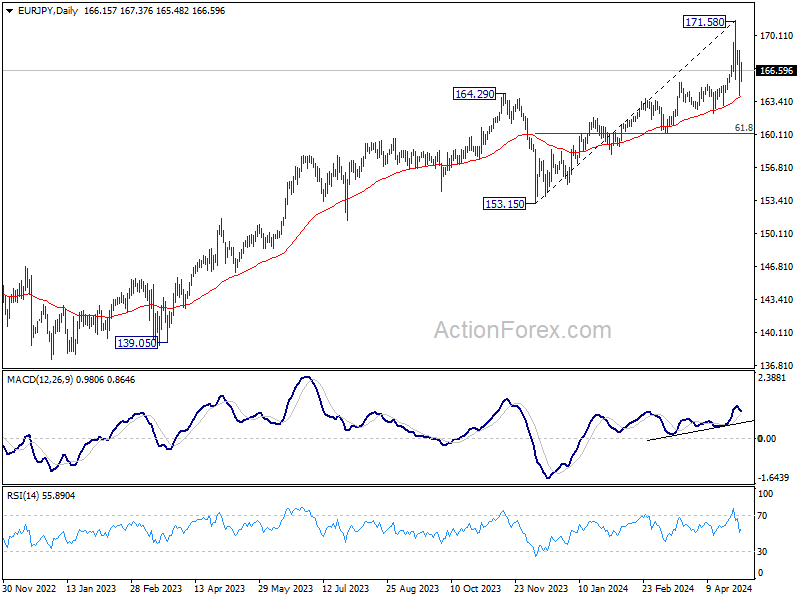
EUR/JPY Daily Outlook
Daily Pivots: (S1) 163.45; (P) 166.06; (R1) 168.06; More...
EUR/JPY's fall from 171.58 resumed and dipped to 164.04 but quickly recovered. Further fall is now in favor as long as 168.64 resistance holds, as a correction to rise from 153.15. Sustained break of 55 D EMA (now at 163.94) will target 61.8% retracement of 153.15 to 171.58 at 160.19.
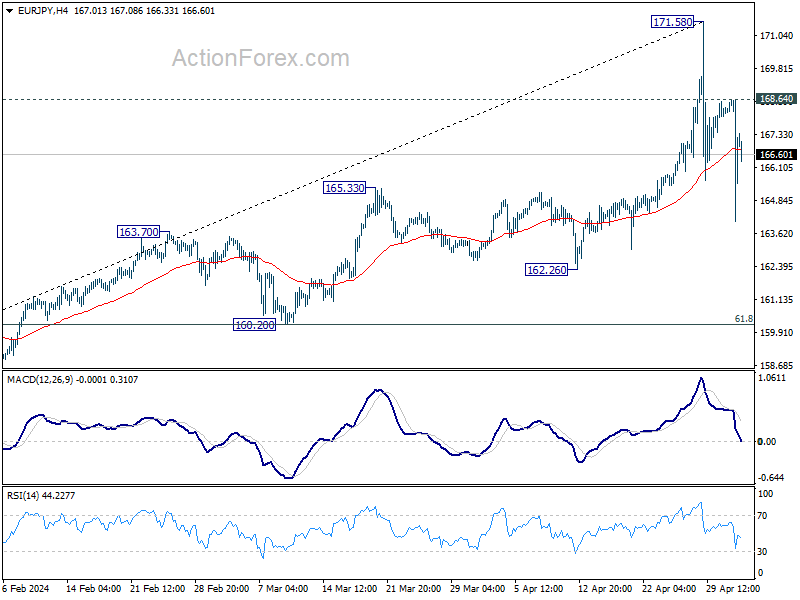
In the bigger picture, current rally is part of the up trend from 114.42 (2020 low), which is still in progress. Decisive break of 169.96 (2008 high) will pave the way to 100% projection of 139.05 to 164.29 from 153.15 at 178.39. On the downside, break of 162.26 support is needed to be the first sign of medium term topping. Otherwise, outlook will stay bullish in case of retreat.
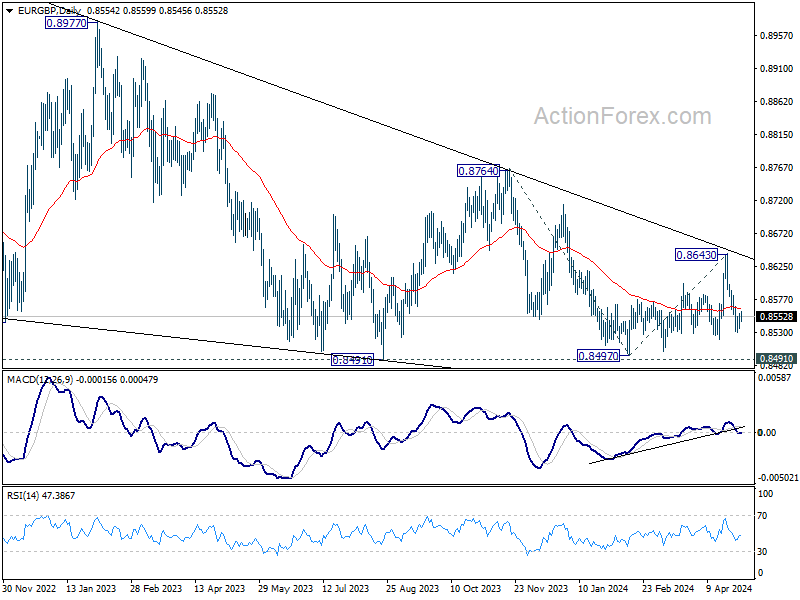
EUR/GBP Daily Outlook
Daily Pivots: (S1) 0.8539; (P) 0.8549; (R1) 0.8562; More...
Intraday bias in EUR/GBP remains neutral and some more consolidations would be seen above 0.8529 temporary low. But further decline is expected as long as 0.8582 resistance holds. Below 0.8529 will target 0.8491/7 support zone.
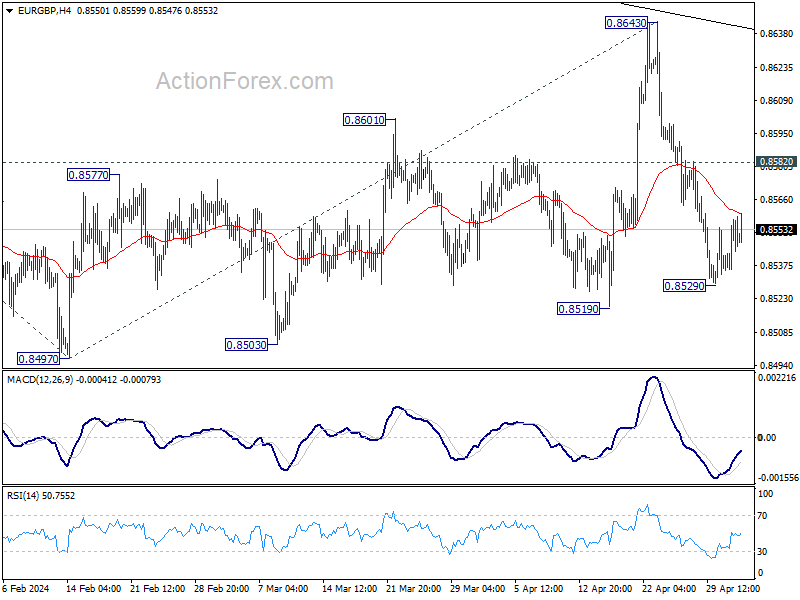
In the bigger picture, outlook remains bearish as EUR/GBP is capped below medium term falling trendline. That is, down trend from 0.9267 (2022 high) is still in progress. Firm break of 0.8491/7 will target 100% projection of 0.8764 to 0.8497 from 0.8643 at 0.8376.
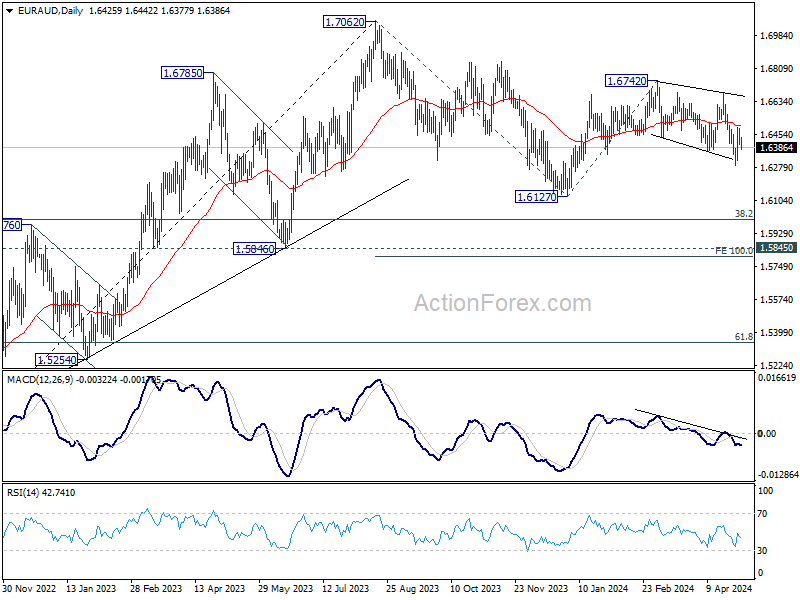
EUR/AUD Daily Outlook
Daily Pivots: (S1) 1.6390; (P) 1.6442; (R1) 1.6477; More...
Intraday bias in EUR/AUD remains neutral and outlook is unchanged. Further decline is expected as long as 1.6484 resistance holds. Below 1.6288 will resume the fall from 1.6742 to 1.6127 support, or further to 100% projection of 1.7062 to 1.6127 from 1.6742 at 1.5807. However, break of 1.6484 will turn bias back to the upside for further rebound.
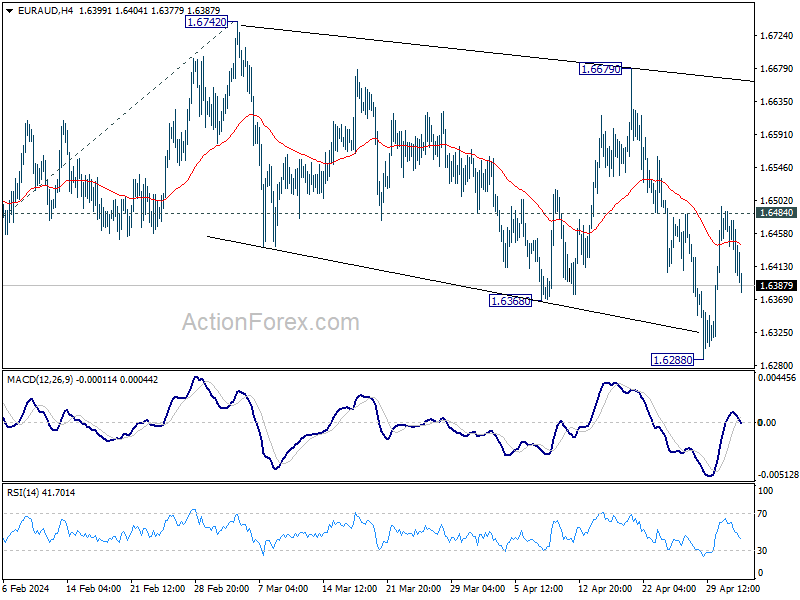
In the bigger picture, fall from 1.7062 medium term top is seen as a correction to the up trend from 1.4281 (2022 low). In case of another fall, strong support is expected around 1.5846 and 38.2% retracement of 1.4281 to 1.7062 at 1.6000 to bring rebound. Break of 1.7062 is in favor as a later stage.
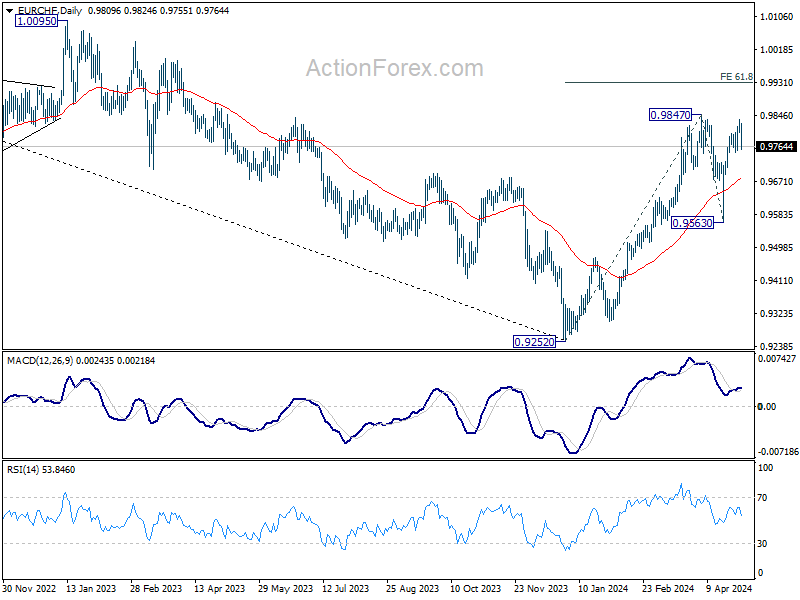
EUR/CHF Daily Outlook
Daily Pivots: (S1) 0.9787; (P) 0.9812; (R1) 0.9837; More...
Intraday bias in EUR/CHF is turned neutral again with current retreat. on the upside, firm break of 0.9847 resistance will resume larger rise from 0.9252 to 61.8% projection of 0.9252 to 0.9847 from 0.9563 at 0.9931 next. However, break of 0.9748 will extend the corrective pattern from 0.9847 with another falling leg instead.
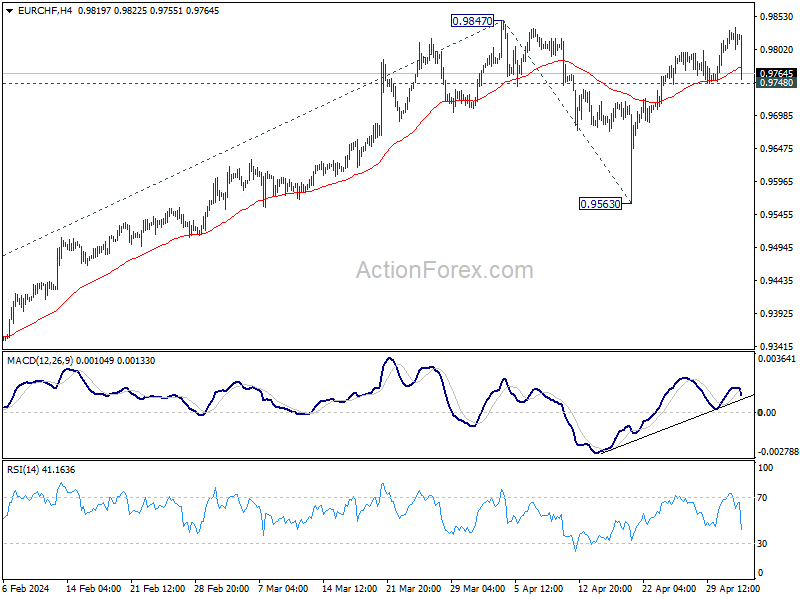
In the bigger picture, while 55 D EMA (now at 0.9644) was breached, EUR/CHF rebounded strongly since then. Rise from 0.9252 medium term bottom should still be in progress. Break of 0.9847 will target 38.2% retracement of 1.2004 (2018 high) to 0.9252 (2023 low) at 1.0303, even as a correction to the down trend from 1.2004. However, sustained trading below 55 D EMA will argue that the rebound has completed.