Sample Category Title
Worst of Both Worlds: Are the Risks of Stagflation Elevated? Part III
Part III: Where Is Stagflation Headed from Here?
Summary
- In the first installment of this series, we presented a simple framework to characterize stagflation and identified 13 instances in the United States since 1950. We briefly summarized past episodes of stagflation in the second installment. In this final report, we consider the risk of stagflation in the coming years.
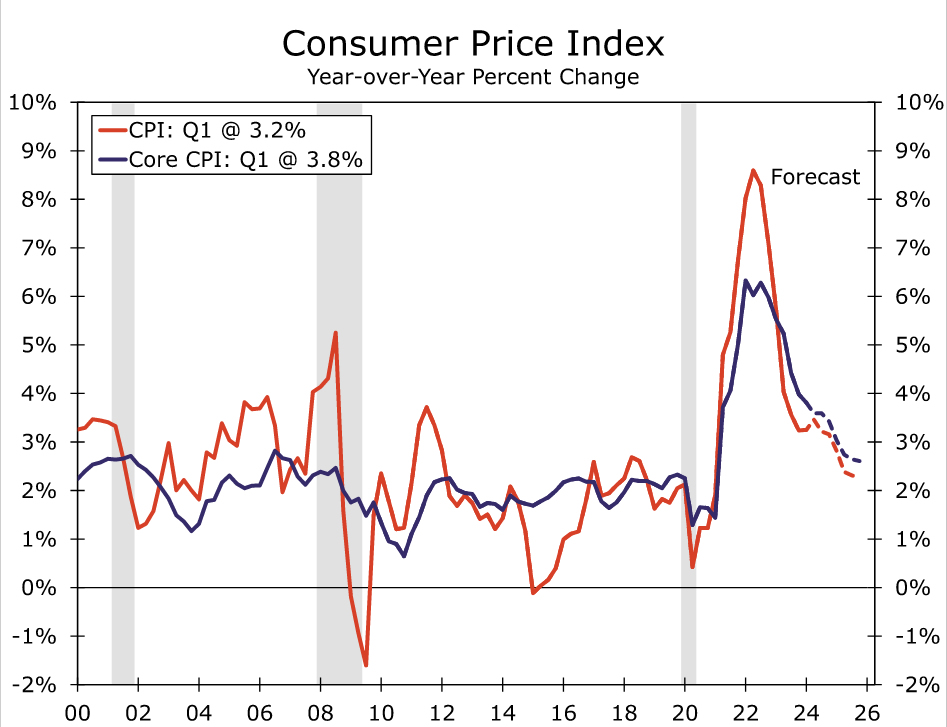
- Inflation gained significant momentum in 2021 and has remained persistent since, though the drivers have shifted. Gummed up supply chains and limited labor availability in 2020 helped push selling prices higher in 2021 and 2022. By our framework, the CPI broke into "severe" territory in Q4-2022 after spending six straight quarters more than three deviations above 2.0% on an annual basis. In 2023, supply chain and labor dynamics improved, but strong consumer demand continued to pressure prices higher.
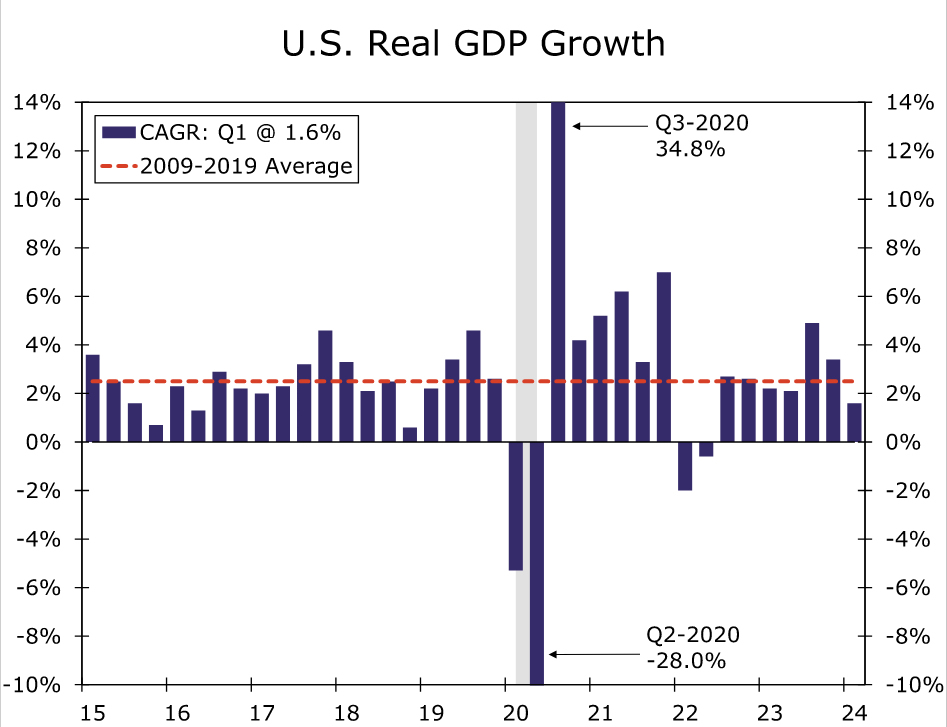
- Economic output has been mostly strong, and ample fiscal stimulus has supported household liquidity and consumption in the face of elevated price growth. That said, real GDP growth slowed below its prior cycle's average in the first half of 2023 and in Q1-2024, pointing to a moderation in growth and a gradual loosening in demand.
- Though the Federal Open Market Committee has hiked the target range of the federal funds rate by 525 bps in just under two years, output growth remains respectable and inflation remains sticky. Fiscal support has ramped up over the past few years, further boosting aggregate growth, and the federal debt has increased to levels not seen since WWII.
- We suspect government purchases will moderate in coming quarters, which will dampen its contribution to real GDP growth. Though the unemployment rate is at a decades' low today, we expect the labor market to gradually loosen as restrictive monetary policy continues to filter through. Less marked job growth will weigh on real disposable income, further dampening real GDP growth and inflation by pressuring consumer spending.
- Should our forecast come to fruition, our framework says the current bout of stagflation will end in the fourth quarter of this year. What was once a severe episode of stagflation in 2022 has downgraded to a mild case in the opening innings of 2024, but the path of inflation remains uncertain. We suspect the risk of stagflation remains elevated in coming years, especially if the labor market does not loosen as presently anticipated.
The Good, Bad and the Ugly
In the first installment of this series, we presented a simple framework to characterize stagflation using real GDP growth and CPI inflation. Using the framework, we identified 13 episodes of stagflation in the United States since 1950, with six of those episodes occurring in the 1970s. We then briefly summarized historical instances of stagflation in the second installment and left the latest episode to this final report.
Back in 2021, inflation gathered significant momentum. CPI inflation averaged 6.7% year-over-year in Q4-2021, up from an average of just 1.9% year-over-year in Q1-2021. Despite the moonshot in prices, real GDP growth remained well above its prior cycle's average throughout the year amid surging labor demand and falling unemployment. Yet when the calendar turned to 2022, real GDP growth downshifted to -2.0% in Q1 and -0.6% in Q2. At the same time, CPI inflation continued to tear higher, averaging 8.0% and 8.6% in Q1 and Q2, respectively, on a year-ago basis.
As discussed in the first report of this series, our framework deems inflation as "severe" when the year-over-year percent change in the CPI comes in more than three standard deviations above 2.0%—the Federal Reserve's inflation target—for at least six consecutive quarters. We use the standard deviation of CPI inflation in the prior business cycle as the benchmark; the CPI averaged 1.7% on a year-over-year basis with a standard deviation of 0.98 percentage points over the 2009-2019 economic expansion. By these measures, the CPI broke into "severe" territory in Q4-2022 after spending six straight quarters more than three standard deviations above 2.0% on an annual basis.
The drivers of inflation have shifted as the aftershocks from the pandemic have unwound. Immediately following the early lockdown days in 2020, businesses faced skyrocketing material and labor costs amid gummed up supply chains and limited labor availability. These cost dynamics helped push selling prices higher over the course of 2021 and into 2022. In 2023, strong consumer demand continued to pressure prices higher even as supply chain and labor dynamics improved, thereby shifting inflation toward the demand-pull variety.
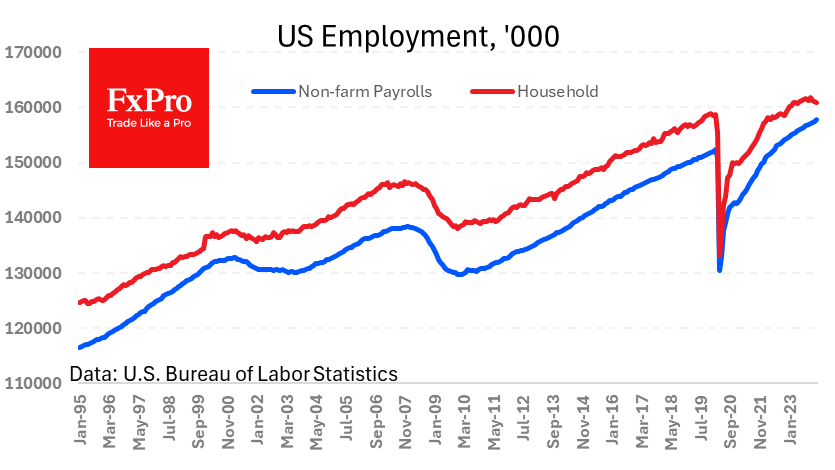
While inflation has been persistent, economic output has been mostly strong. Real GDP expanded 5.8% in 2021, 1.9% in 2022 and 2.5% in 2023. Ample fiscal stimulus, in the form of relief checks and tax credits, has supported household liquidity and consumption in the face of elevated price growth. Despite the momentum in consumption, the framework designates this period as stagflation due to the two consecutive quarters of negative real GDP growth in the first half of 2022. We readily acknowledge that the drivers of real GDP's contraction in those quarters were primarily net exports and inventories, which suggests underlying demand remained intact. That said, real GDP growth slowed below its prior cycle's average of 2.5% in the first half of 2023 and in Q1-2024 (Figure 1). The moderation in growth, albeit teetering, points to a gradual loosening in demand.
A moderation in demand would come as welcome news to the Federal Reserve, if it helps to quell inflation. The Federal Open Market Committee has responded to the recent inflation bout by hiking the target range of the federal funds rate 525 bps in just under two years to 5.25-5.50% at present. The real fed funds rate (i.e., the upper bound target less CPI inflation) has been above 1% the past four quarters, suggesting that monetary policy settings are restrictive.
Yet the economy has seemingly defied the weight of higher interest rates, as output growth remains respectable and inflation remains sticky. Beyond stimulus checks to households, fiscal support in the form of federal aid to state and local governments, infrastructure funding and spending on other policy initiatives, such as veterans support and national defense, have ramped up over the past few years.1 These policies have boosted the federal government's output and contribution to real GDP growth in recent quarters, which has helped to prop up aggregate demand. While supportive of economic growth, the federal debt has increased to levels not seen since the Second World War when measured as a share of GDP.
Stimulative fiscal policy typically puts upward pressure on inflation, although the degree to which inflation becomes entrenched depends on the labor market's slack. Back in the late 1960s, President Johnson's Great Society programs and other spending initiatives led to a ballooning federal deficit. At the same time, the unemployment rate was hovering below 4%, implying the labor market was near maximum employment. The mixture of ample fiscal support and a tight labor market meant that the economy did not have much capacity to keep wage pressures in check. Consequently, the CPI ramped up from 1968 and into 1970. The pressure on prices led to profit margin squeeze; the unemployment rate turned higher in 1970 and led the economy into a moderate recession.
Today, the unemployment rate is near a decades' low, labor cost growth is solid and the fiscal deficit is swelling. Long-run fiscal challenges are likely to remain amid a rapidly aging population and elevated debt service costs. We suspect government purchases to moderate in the coming quarters, which will dampen its contribution to real GDP growth. As outlined in our latest monthly U.S. Economic Outlook, we expect the labor market to gradually loosen as restrictive monetary policy continues to filter through; we look for the FOMC to begin cutting its target range in September, which will keep policy tight in the coming months. Less marked job growth will weigh on real disposable income growth, which would pressure consumer spending. The ebbing in demand is poised to lead real GDP growth below the prior cycle's trend and help inflation continue to ease (Figure 2).
Should our forecast come to fruition, our framework says the current bout of stagflation will end in the fourth quarter of this year. CPI inflation is no longer in "severe" territory, but it remains more than one standard deviation above 2% on an annual basis and real GDP growth has slipped below its previous cycle's average. Thus, what was once a severe episode of stagflation back in 2022 has downgraded to a mild case in the opening innings of 2024. That said, the path of inflation is increasingly uncertain given heightened geopolitical risks across the globe, which have the potential to send oil prices higher and hamper supply chains anew.
Furthermore, the severity at the beginning of this stagflation episode has not been matched since the 1970s, when years of restrictive monetary policy were necessary to stamp out the "Great Inflation." Structural inflation pressures today, such as the tight labor supply amid an aging demographic and deglobalization amid geopolitical tensions, point to a higher neutral rate of interest. Many analysts expect the FOMC to start cutting by the end of this year, but the stickiness in inflation has continually delayed the start date of easing and led to an upward drift in the median projection for the long-run federal funds rate. Unless the economy has meaningfully edged up its potential capacity, we suspect the risk of stagflation remains elevated in the coming years, especially if the labor market does not loosen as presently anticipated.2
Endnotes
1 - For more detail, see our colleagues special report, The Fiscal Tailwinds Are Still Blowing, from December 2023.
2 – This series is based on a 2024 American Economic Association Annual Meeting paper by Azhar Iqbal and Nicole Cervi titled "Characterizing Stagflation into Mild, Moderate and Severe Episodes: A New Approach". Please contact the authors if interested in the full paper.
US: Manufacturing Slips Back into Contraction in April, But Price Pressures Pick Up
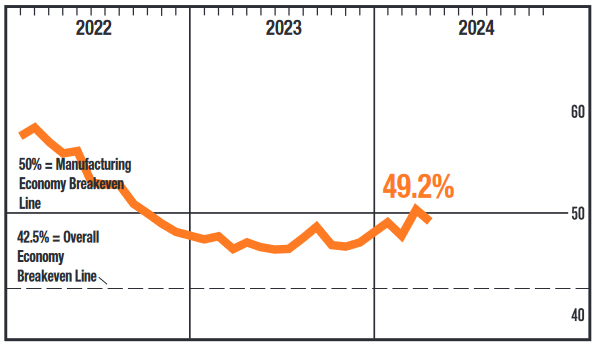
The ISM Manufacturing Index slipped back into contractionary territory in April, dipping to 49.2, from 50.3 in March. Even so, 9 of 16 industries reported growth in April – the same as in March.
Demand softness was reflected by the new orders and new export orders sub-indices both flipping back into contraction, after pointing to expansion in March. The backlog of orders index dropped slightly further into contractionary territory.
Output also moderated, but remained in positive territory. However, headcount reductions continued in April, but showed signs of easing.
Consistent with the resurgence in inflation seen in other measures, the prices paid sub-index rose 5.1 pp to 60.9, "as commodity-driven costs continue to climb". That is the highest level for this component since the summer of 2022.
Key Implications
The manufacturing sector's flirtation with expansionary territory in March proved brief. The ISM Institute characterizes demand as " at the early stages of recovery" and focused on the fact that production continued to expand.
The path towards recovery for the manufacturing sector has been bumpy, and April's dip may prove to be a blip on an continuing uptrend given overall strength in the U.S. economy. The index is often a market mover, but today investors are awaiting how the Fed will address hotter inflation readings in recent months.
USD/JPY Calm Ahead of Fed Decision
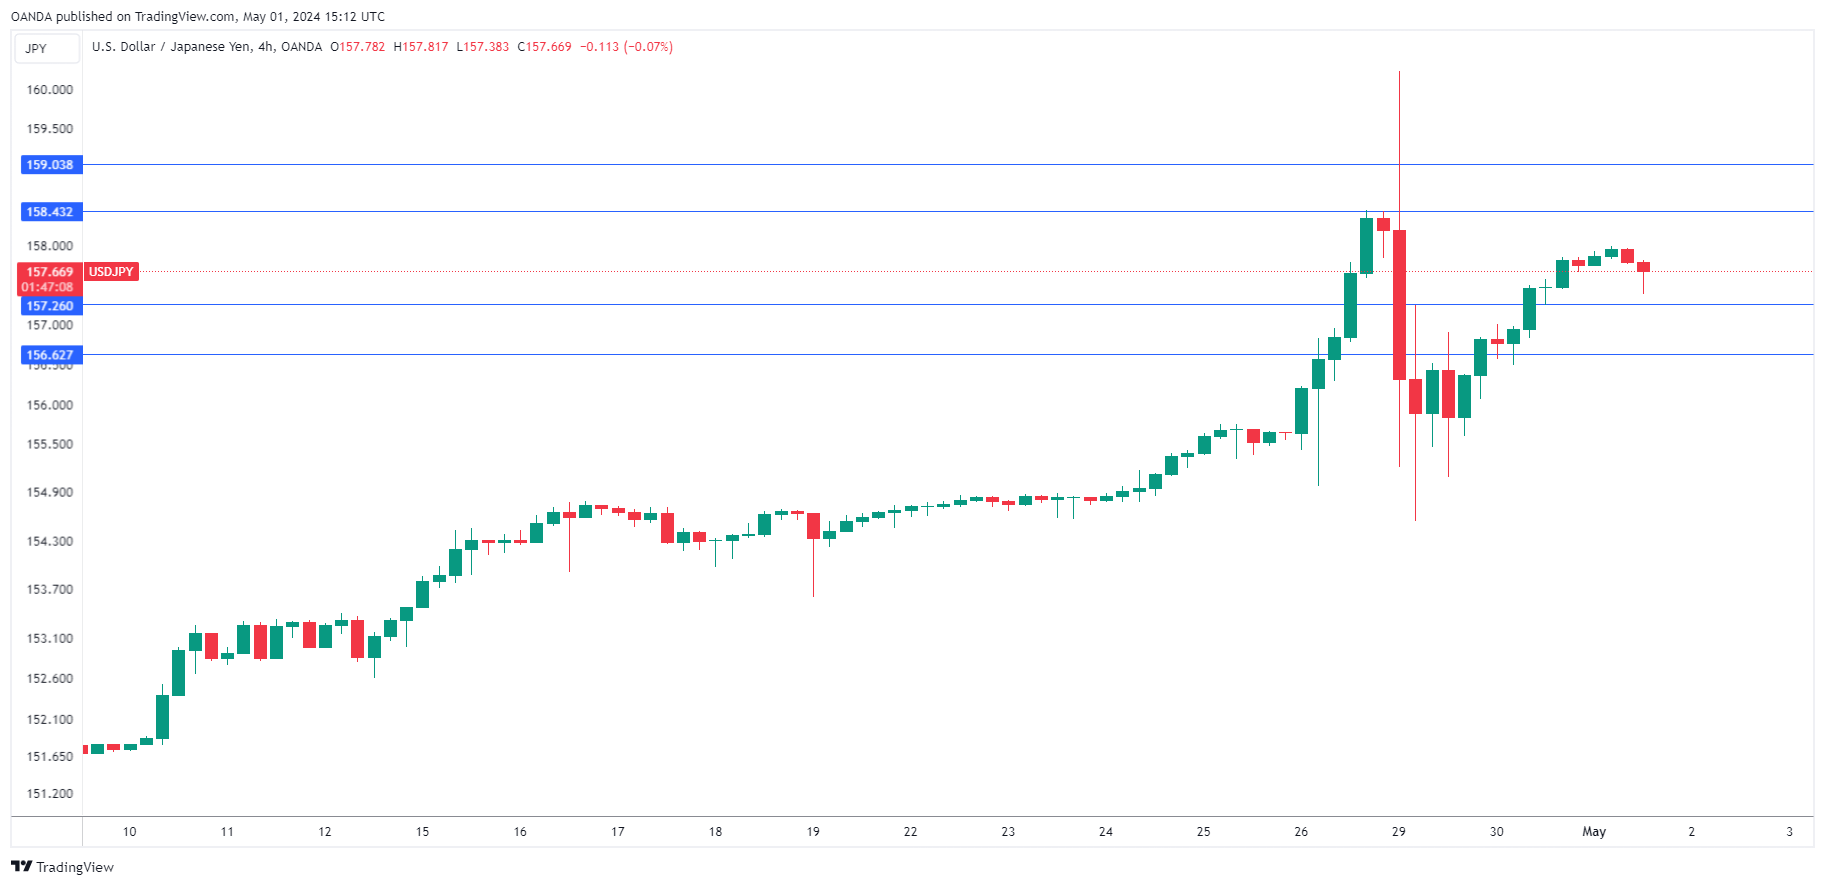
Japanese yen is trading quietly on Wednesday. USD/JPY is trading at 157.68, down 0.07% at the time of writing.
Fed expected to hold rates
The Federal Reserve meets later today and is widely expected to keep rates unchanged for a sixth straight time. The target range for the benchmark rate of 5.25% to 5.5% hasn’t changed since July and the Fed has shown that it is willing to prolong its “higher for longer” stance as long as is needed. Fed Chair Powell is expected to have a hawkish message for the market, which would likely provide the US dollar with a boost.
The Fed’s battle with inflation, which was running smoothly, has hit a bump in the road as consumer inflation is moving higher. Underlying inflation indicators have been hotter than expected and Fed Chair Powell has signaled that he will delay plans to cut rates. Powell could reiterate that message in today’s rates statement and the follow-up press conference.
The market will be looking for hints about the Fed’s rate cut plans. Earlier in the year, Powell signaled that he expected to lower rates three times in 2024, but that scenario is unlikely due to the unwanted inflation surprise. It’s conceivable that the Fed won’t raise rates until 2025, as Fed members will want to see evidence of sustainable price stability before shifting rate policy.
It has been a roller-coaster week for the Japanese yen, which spiked above the 160 level, a new 34-year record, on Monday, raising speculation that Tokyo had intervened in the currency markets to prop up the ailing yen. A hawkish Fed meeting later today could give the US dollar a boost against the majors, including the yen.
USD/JPY Technical
- USD/JPY has pushed above resistance at 156.62 and 156.80. Above, there is resistance at 157.30
- There is support at 156.30 and 156.12
ADP Hints at Another Strong NFP on Friday
The monthly ADP labour market report showed that America created 192K new jobs in April, above the forecasted 179K and following +208K in March (revised from 184K).
Overall, there was a slight slowdown in wage growth to 5% y/y from 5.1% a month earlier, which is still quite high because of high employment and the impressive pace of job creation by historical measures.
The report noted weakness in the information sector, which cut jobs and slowed wage growth. When broken down by company size, large companies with more than 500 employees contributed the largest portion (+98K).
When broken down by industry, Construction surprised (+35K), which is huge for an industry that makes up only 5% of the labour force. Among services, Leisure and hospitality (+56K) led the way once again.
The ADP report fuelled expectations of a strong Friday’s official statistics. Still, its impact on the market is tempered by the market’s focus on today’s FOMC meeting and the decline in predictive power in recent months.
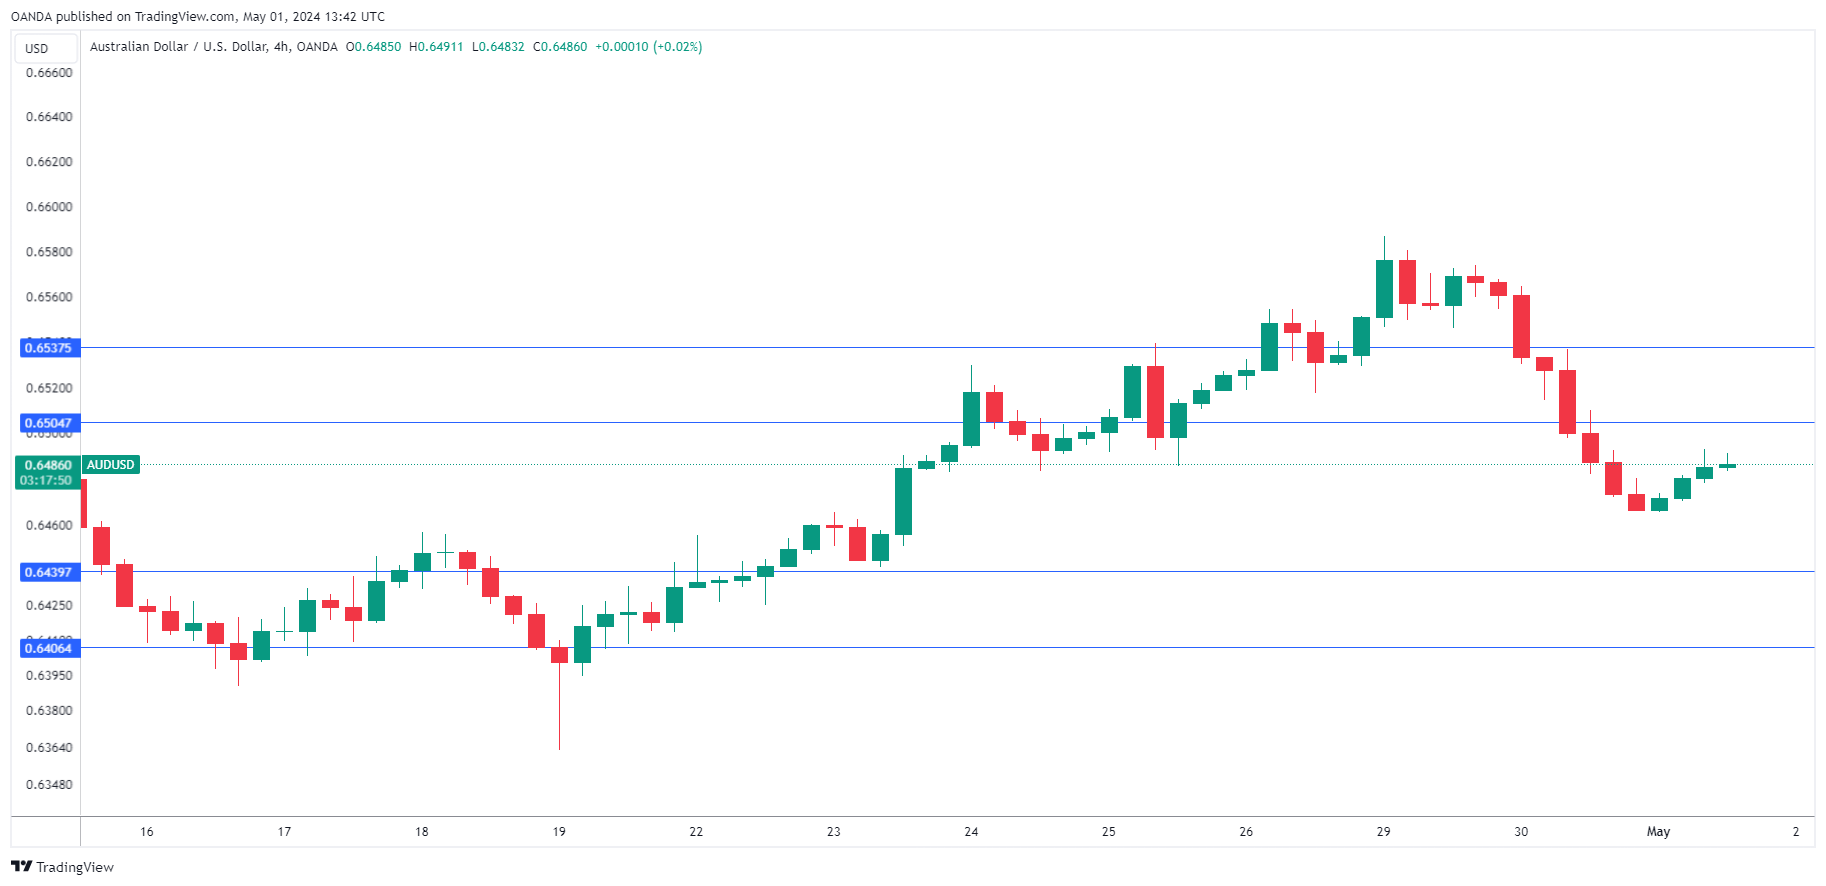
AUD/USD Stabilizes After Taking a Tumble, Fed Next
The Australian dollar has steadied on Wednesday after sliding 1.4% a day earlier. AUD/USD is up 0.19%, trading at 0.6489 at the time of writing in the North American session.
Australian dollar slides after soft retail sales
Retail sales in Australia fell 0.4% m/m in March, following a downwardly revised 0.2% gain in February and shy of the market estimate of 0.2%. The decrease in sales was felt across all industries, as consumers held tight to the purse strings. On an annualized basis, retail sales grew by just 0.8% in March, the lowest level since August 2021.
The Australian dollar responded with sharp losses to the disappointing retail sales release. China posted soft PMIs which also weighed on the Aussie. The manufacturing PMI eased to 50.4 in April, down from 50.8 and just above the market estimate of 50.3. The services PMI fell to 51.2, compared to 53.0 in March and below the market estimate of 52.2.
The data indicates that manufacturing and services are showing little growth, another sign of the slowdown in China, which is Australia’s largest export market. Weaker economic activity in China means less demand for Australian exports, which is weighing on the Australian dollar.
Will Powell make a hawkish pivot?
The Federal Reserve meets later today, with little doubt that it will maintain interest rates for a sixth straight time. The target range for the benchmark rate of 5.25% to 5.5% hasn’t changed since July and the Fed has shown that it is willing to prolong its “higher for longer” stance as long as is needed. Fed Chair Powell is expected to have a hawkish message for the market, which would likely provide the US dollar with a boost.
AUD/USD Technical
- AUD/USD is putting pressure on resistance at 0.6504. Above, there is resistance at 0.6537
- 0.6439 and 0.6406 are the next support levels
US ISM manufacturing falls to 49.2, prices surges to 60.9
US ISM Manufacturing PMI fell from 50.3 to 49.2 in April, below expectation of 50.1, and back in contraction. New orders fell from 51.4 to 49.1. Production fell from 54.6 to 51.3. Employment rose from 47.4 to 48.6. Prices surged from 55.8 to 60.9, highest reading since June 2022.
ISM said: "The past relationship between the Manufacturing PMI® and the overall economy indicates that the April reading (49.2 percent) corresponds to a change of plus-1.9 percent in real gross domestic product (GDP) on an annualized basis."
USD/JPY Mid-Day Outlook
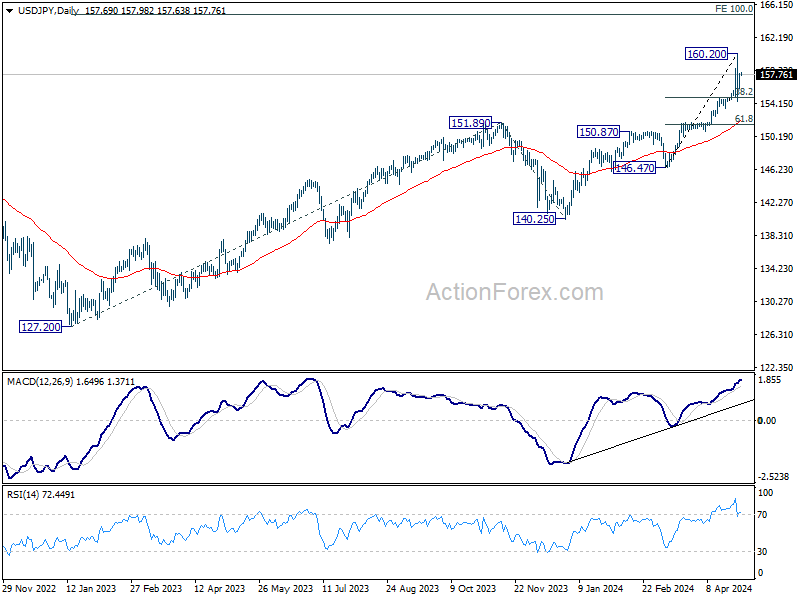
Daily Pivots: (S1) 156.64; (P) 157.25; (R1) 158.42; More...
USD/JPY is extending the consolidation pattern from 160.20 and intraday bias remains neutral. In case of another fall, downside should be contained by 38.2% retracement of 146.47 to 160.20 at 154.95 to bring recovery. For now, break of 160.20 is not envisaged in the near term. Meanwhile, firm break of 154.95 will turn bias to the downside for deeper correction to 55 D EMA (now at 152.24).
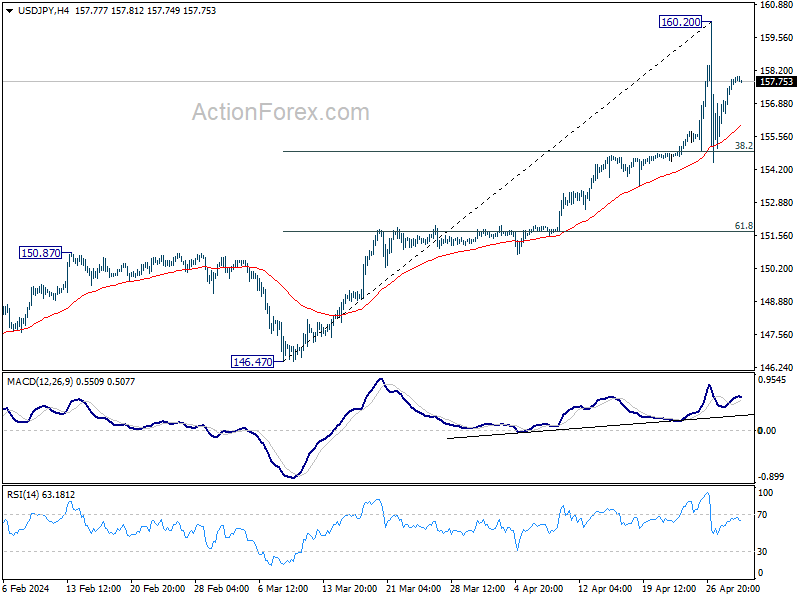
In the bigger picture, current rise from 140.25 is seen as the third leg of the up trend from 127.20 (2023 low). Next target is 100% projection of 127.20 to 151.89 from 140.25 at 164.94. Outlook will remain bullish as long as 150.87 resistance turned support holds, even in case of deep pullback.
USD/CHF Mid-Day Outlook
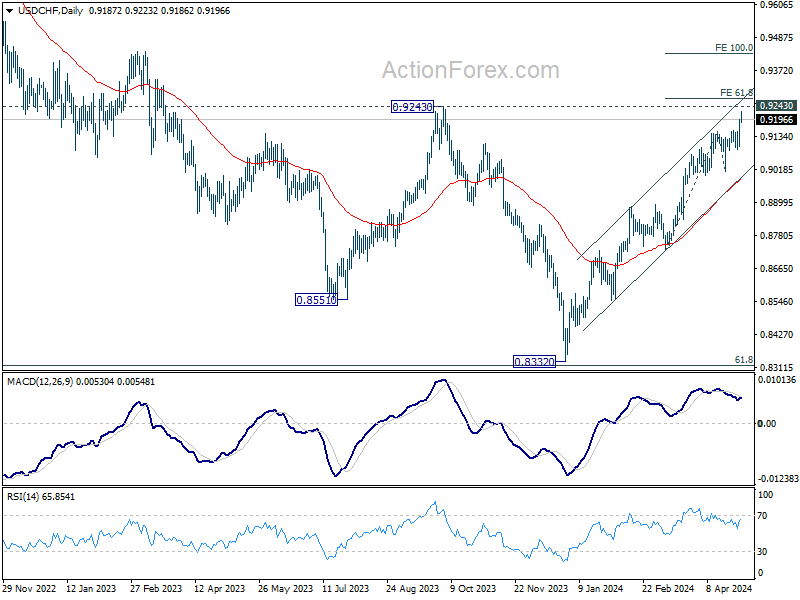
Daily Pivots: (S1) 0.9128; (P) 0.9162; (R1) 0.9231; More....
Intraday bias in USD/CHF remains on the upside for 0.9243 resistance. Decisive break there will carry larger bullish implications. Next target will be 61.8% projection of 0.8728 to 0.9151 from 0.9009 at 0.9270. For now, near term outlook will stay bullish as long as 0.9087 support holds, in case of retreat.
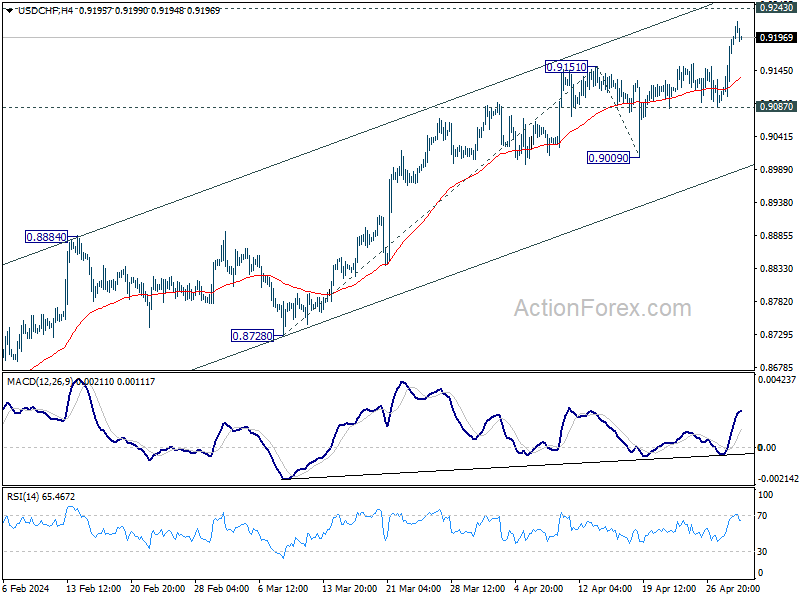
In the bigger picture, price actions from 0.8332 medium term bottom as tentatively seen as developing into a corrective pattern to the down trend from 1.0146 (2022 high). Further rise would be seen as long as 0.8884 resistance turned support holds. But upside should be limited by 0.9243 resistance, at least on first attempt. However, decisive break of 0.9243 will argue that the trend has already reversed and turn medium term outlook bullish for 1.0146.
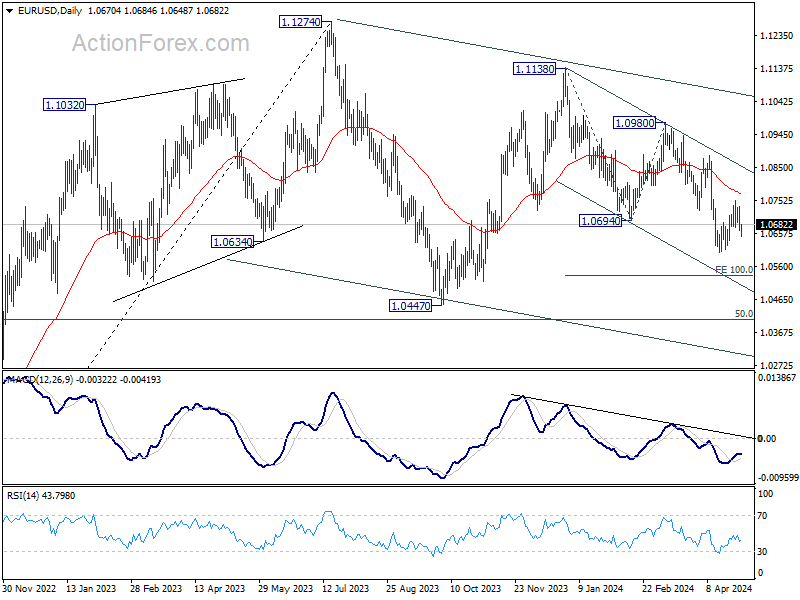
EUR/USD Mid-Day Outlook
Daily Pivots: (S1) 1.0642; (P) 1.0688; (R1) 1.0713; More...
Intraday bias in EUR/USD remains mildly on the downside at this point. Recovery from 1.0601 could have completed at at 1.0752 already. Further fall would be seen for retesting 1.0601 first. Firm break there will resume larger fall and target 100% projection of 1.1138 to 1.0694 from 1.0980 at 1.0536. For now, risk will stay on the downside as long as 1.0752 resistance holds, in case of recovery.
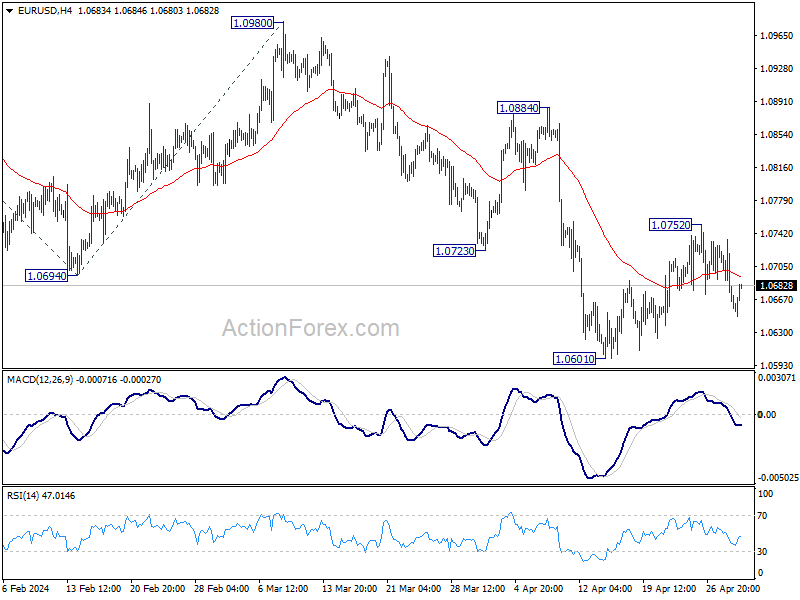
In the bigger picture, price actions from 1.1274 are viewed as a corrective pattern to rise from 0.9534 (2022 low). Current fall from 1.1138 is seen as the third leg. While deeper decline is would be seen to 1.0447 and possibly below, strong support should emerge from 61.8% retracement of 0.9534 to 1.1274 at 1.0199 to complete the correction.
GBP/USD Mid-Day Outlook
Daily Pivots: (S1) 1.2465; (P) 1.2517; (R1) 1.2544; More...
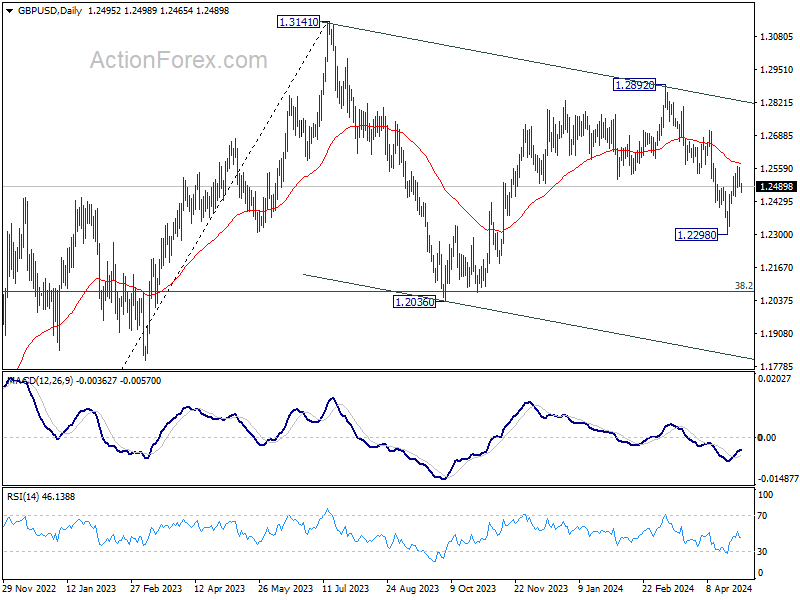
Intraday bias in GBP/USD remains neutral for the moment and outlook is unchanged. On the upside, above 1.2568 will resume the rebound from 1.2298 to 55 D EMA (now at 1.2578). Sustained break there will argue that fall from 1.2892 has completed already, and bring further rise to this resistance. Nevertheless, on the downside, break of 1.2448 minor support will indicate that rebound from 1.2298 has completed, and turn bias back to the downside for this low.
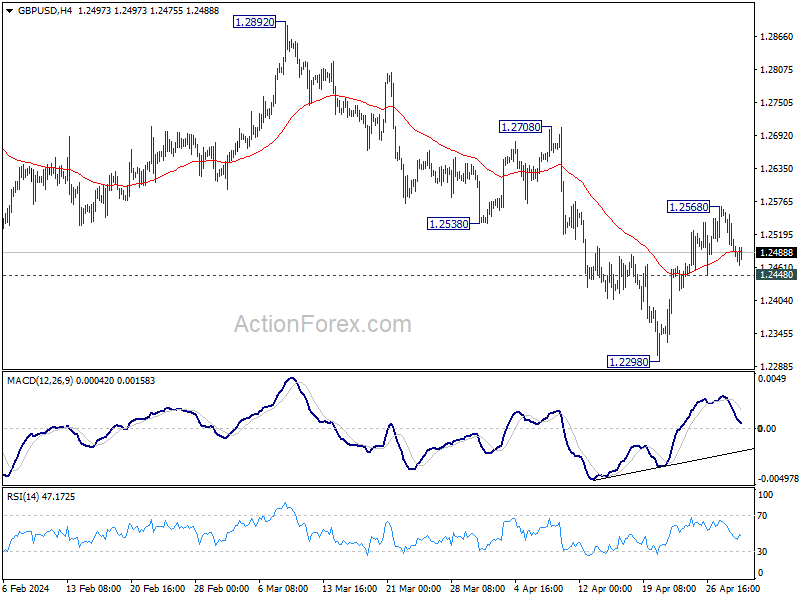
In the bigger picture, price actions from 1.3141 medium term top are seen as a corrective pattern to up trend from 1.0351 (2022 low). Fall from 1.2892 is seen as the third leg. Deeper decline would be seen to 1.2036 support and possibly below. But strong support should emerge from 61.8% retracement of 1.0351 to 1.2452 at 1.1417 to complete the correction.