Sample Category Title
GBP/USD Mid-Day Outlook
Daily Pivots: (S1) 1.2465; (P) 1.2517; (R1) 1.2544; More...
Intraday bias in GBP/USD remains neutral for the moment and outlook is unchanged. On the upside, above 1.2568 will resume the rebound from 1.2298 to 55 D EMA (now at 1.2578). Sustained break there will argue that fall from 1.2892 has completed already, and bring further rise to this resistance. Nevertheless, on the downside, break of 1.2448 minor support will indicate that rebound from 1.2298 has completed, and turn bias back to the downside for this low.
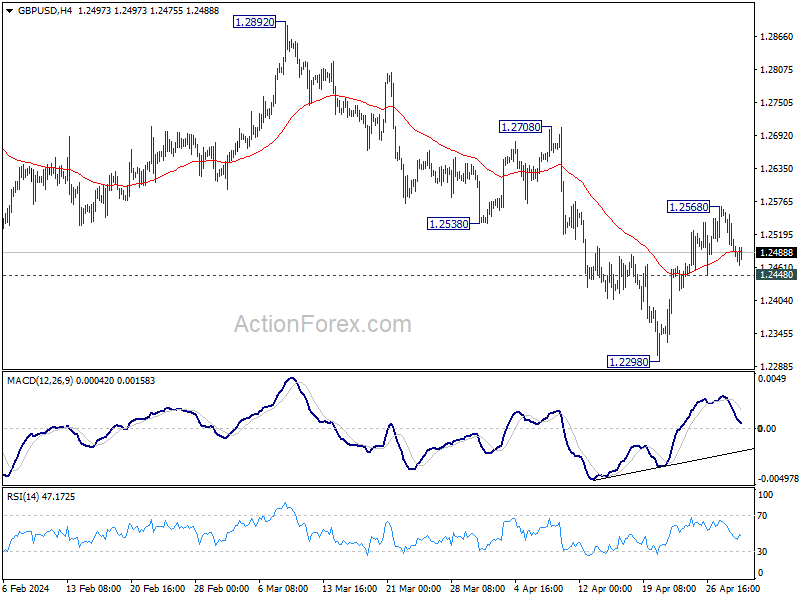
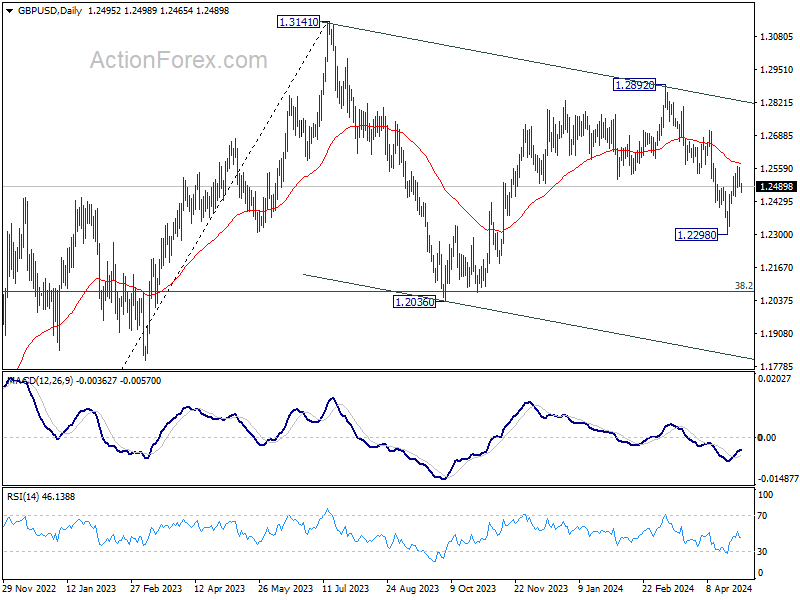
In the bigger picture, price actions from 1.3141 medium term top are seen as a corrective pattern to up trend from 1.0351 (2022 low). Fall from 1.2892 is seen as the third leg. Deeper decline would be seen to 1.2036 support and possibly below. But strong support should emerge from 61.8% retracement of 1.0351 to 1.2452 at 1.1417 to complete the correction.
Dollar’s Rebound Pauses ahead of FOMC, Oil Prices Decline
Dollar's rally slowed slightly in early US session despite robust ADP job data, as traders adopt a cautious stance ahead of the highly anticipated FOMC statement and Chair Jerome Powell's press conference. With a hawkish shift expected from Fed, the extent of Powell's hawkish tone remains the primary focus. Market participants are speculating on whether Powell will merely dismiss a rate cut in June, suggest fewer rate cuts throughout the year, or even hint at the possibility of a rate hike.
In the broader currency market, Yen is currently the strongest performer for the week, followed by Dollar and Sterling. Aussie lags as the weakest, with Kiwi and Loonie also underperforming. Euro and Swiss Franc hold their ground in the middle of the pack. The upcoming reactions to Fed's decisions are poised to be pivotal, influencing not just currencies but also the stock and bond markets, as well as their interactions.
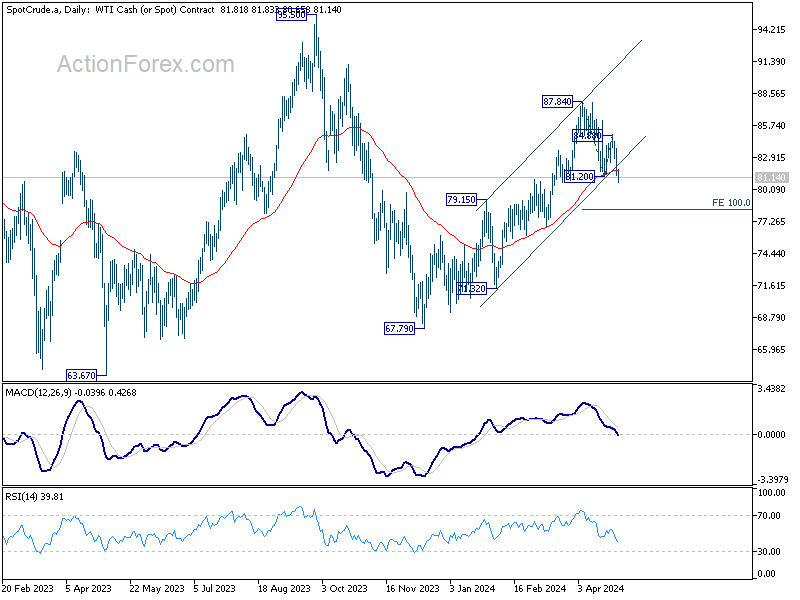
Technically, WTI crude oil's fall from 87.84 resumed through 81.20 support today. More importantly, the break of medium term rising channel support argues that rally from 67.79 might have completed. If that's true, WTI would now be in another falling leg of the sideway pattern from 63.67. Next that is 100% projection of 87.84 to 81.20 from 84.88 at 78.60. This potential decline in oil prices could have favorable implications for inflation, offering some relief from persistent price pressures.
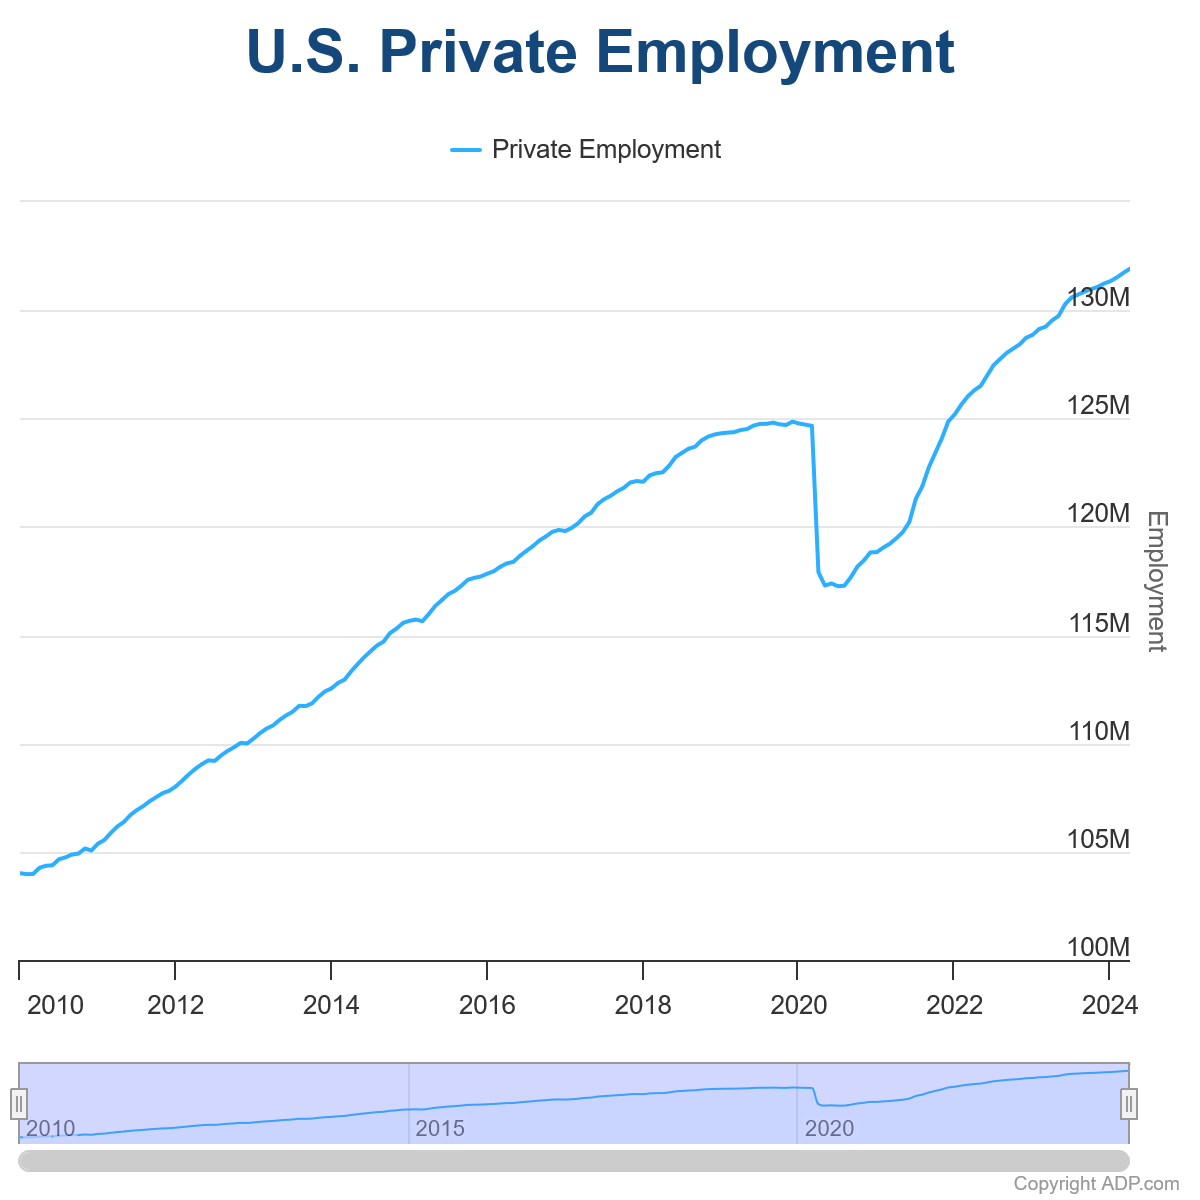
US ADP employment rises 192k in Apr, vs exp 180k
US ADP private employment grew 192k in April, above expectation of 180k. By sector, goods-producing jobs rose 47k, service-providing jobs rose 145k. By establishment size, small companies added 38k jobs, medium companies added 62k, large companies added 98k.
Year-over-year pay gains for job-stayers were little changed in April at 5%. Pay growth for job- changers fell from 10.1% in March to 9.3%.
"Hiring was broad-based in April," said Nela Richardson, chief economist, ADP. "Only the information sector – telecommunications, media, and information technology – showed weakness, posting job losses and the smallest pace of pay gains since August 2021."
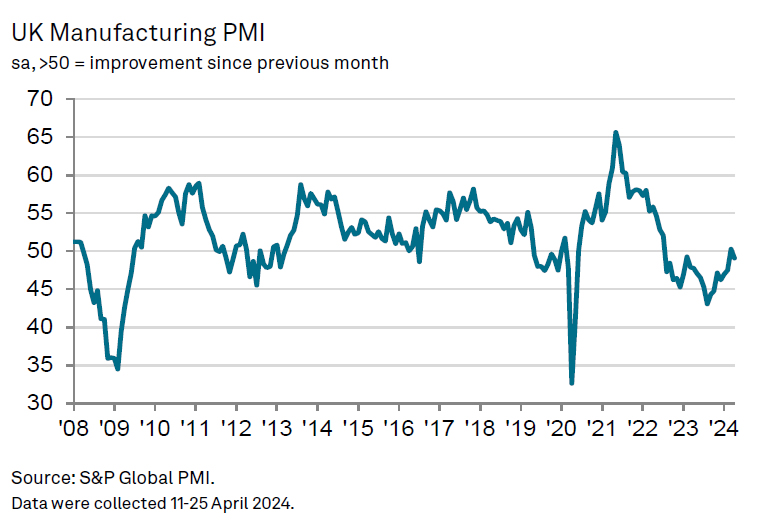
UK PMI manufacturing finalized at 49.1, sector faces multiple challenges
UK PMI Manufacturing was finalized at 49.1 in April, down from March's 50.3. This decline was also reflected in four key areas: output, new orders, employment, and stocks of purchases. Furthermore, input price inflation hit a 14-month high, exacerbating cost pressures for manufacturers.
Rob Dobson, Director at S&P Global Market Intelligence, highlighted the renewed downturn, attributing the challenges to weak market confidence, client destocking, and disruptions caused by the ongoing Red Sea crisis. These factors have notably hindered the sector's ability to secure new work from key international markets including Europe, the US, and Asia.
The manufacturing downturn is prompting firms to exercise "cost caution," leading to reduced employment levels, lower stock holdings, and cutbacks in purchasing activity. Dobson expressed concern over the implications for consumer price inflation, noting that the ongoing cost pressures within the manufacturing sector are complicating efforts to return inflation to target levels.
Japan's PMI manufacturing finalized at 49.6, moving towards stabilization
Japan's PMI Manufacturing was finalized at 49.6 in April, marking an increase from March's 48.2 and reaching its highest level in eight months. While the index remains below the pivotal 50.0 mark, which distinguishes expansion from contraction, the latest data suggests that the sector is moving towards stabilization in the near term.
Paul Smith from S&P Global Market Intelligence noted that the April PMI "continued to paint a fairly subdued picture of the Japanese manufacturing sector," but also pointed out that "another rise in the headline PMI points to a sector heading towards at least stabilization in the near-term."
The report also highlighted concerns about inflation, with a broad-based increase in input prices contributing to heightened cost pressures for manufacturers. Notably, the strength of market demand is allowing firms to pass these increased costs onto consumers, with the extent of charge hikes reaching the steepest level in nearly a year.
New Zealand employment falls -0.2% qoq in Q1, unemployment rate jumps to 4.3%
New Zealand employment fell -0.2% qoq in Q1, much worse than expectation of 0.3% qoq growth. Unemployment rate rose from 4.0% to 4.3%, above expectation of 4.0%. Underutilization rate rose 0.5% to 11.2%. Employment rate fell -0.6% to 68.4%. Labor force participation rate fell -0.3% to 71.5%.
For wages, average ordinary time hourly earnings growth slowed from 6.9% yoy to 5.2% yoy. All sector unadjusted labor cost index slowed slightly from 4.3% yoy to 4.1% yoy.
"Although wage cost inflation eased and average hourly earnings growth started to slow this quarter, annual growth remained high for the two surveys," business employment insights manager Sue Chapman said.
GBP/USD Mid-Day Outlook
Daily Pivots: (S1) 1.2465; (P) 1.2517; (R1) 1.2544; More...
Intraday bias in GBP/USD remains neutral for the moment and outlook is unchanged. On the upside, above 1.2568 will resume the rebound from 1.2298 to 55 D EMA (now at 1.2578). Sustained break there will argue that fall from 1.2892 has completed already, and bring further rise to this resistance. Nevertheless, on the downside, break of 1.2448 minor support will indicate that rebound from 1.2298 has completed, and turn bias back to the downside for this low.
In the bigger picture, price actions from 1.3141 medium term top are seen as a corrective pattern to up trend from 1.0351 (2022 low). Fall from 1.2892 is seen as the third leg. Deeper decline would be seen to 1.2036 support and possibly below. But strong support should emerge from 61.8% retracement of 1.0351 to 1.2452 at 1.1417 to complete the correction.
Economic Indicators Update
| GMT | Ccy | Events | Actual | Forecast | Previous | Revised |
|---|---|---|---|---|---|---|
| 22:45 | NZD | Employment Change Q1 | -0.20% | 0.30% | 0.40% | |
| 22:45 | NZD | Unemployment Rate Q1 | 4.30% | 4.30% | 4.00% | |
| 22:45 | NZD | Labour Cost Index Q/Q Q1 | 0.80% | 0.80% | 1.00% | |
| 00:30 | JPY | Manufacturing PMI Apr F | 49.6 | 49.9 | 49.9 | |
| 08:30 | GBP | Manufacturing PMI Apr F | 49.1 | 48.7 | 48.7 | |
| 12:15 | USD | ADP Employment Change Apr | 192K | 180K | 184K | 208K |
| 13:30 | CAD | Manufacturing PMI Apr | 50.2 | 49.8 | ||
| 13:45 | USD | Manufacturing PMI Apr F | 49.9 | 49.9 | ||
| 14:00 | USD | ISM Manufacturing PMI Apr | 50.1 | 50.3 | ||
| 14:00 | USD | ISM Manufacturing Prices Paid Apr | 55.6 | 55.8 | ||
| 14:00 | USD | ISM Manufacturing Employment Index Apr | 47.4 | |||
| 14:00 | USD | Construction Spending M/M Mar | 0.30% | -0.30% | ||
| 14:30 | USD | Crude Oil Inventories | -2.3M | -6.4M | ||
| 18:00 | USD | Fed Interest Rate Decision | 5.50% | 5.50% | ||
| 18:30 | USD | FOMC Press Conference |
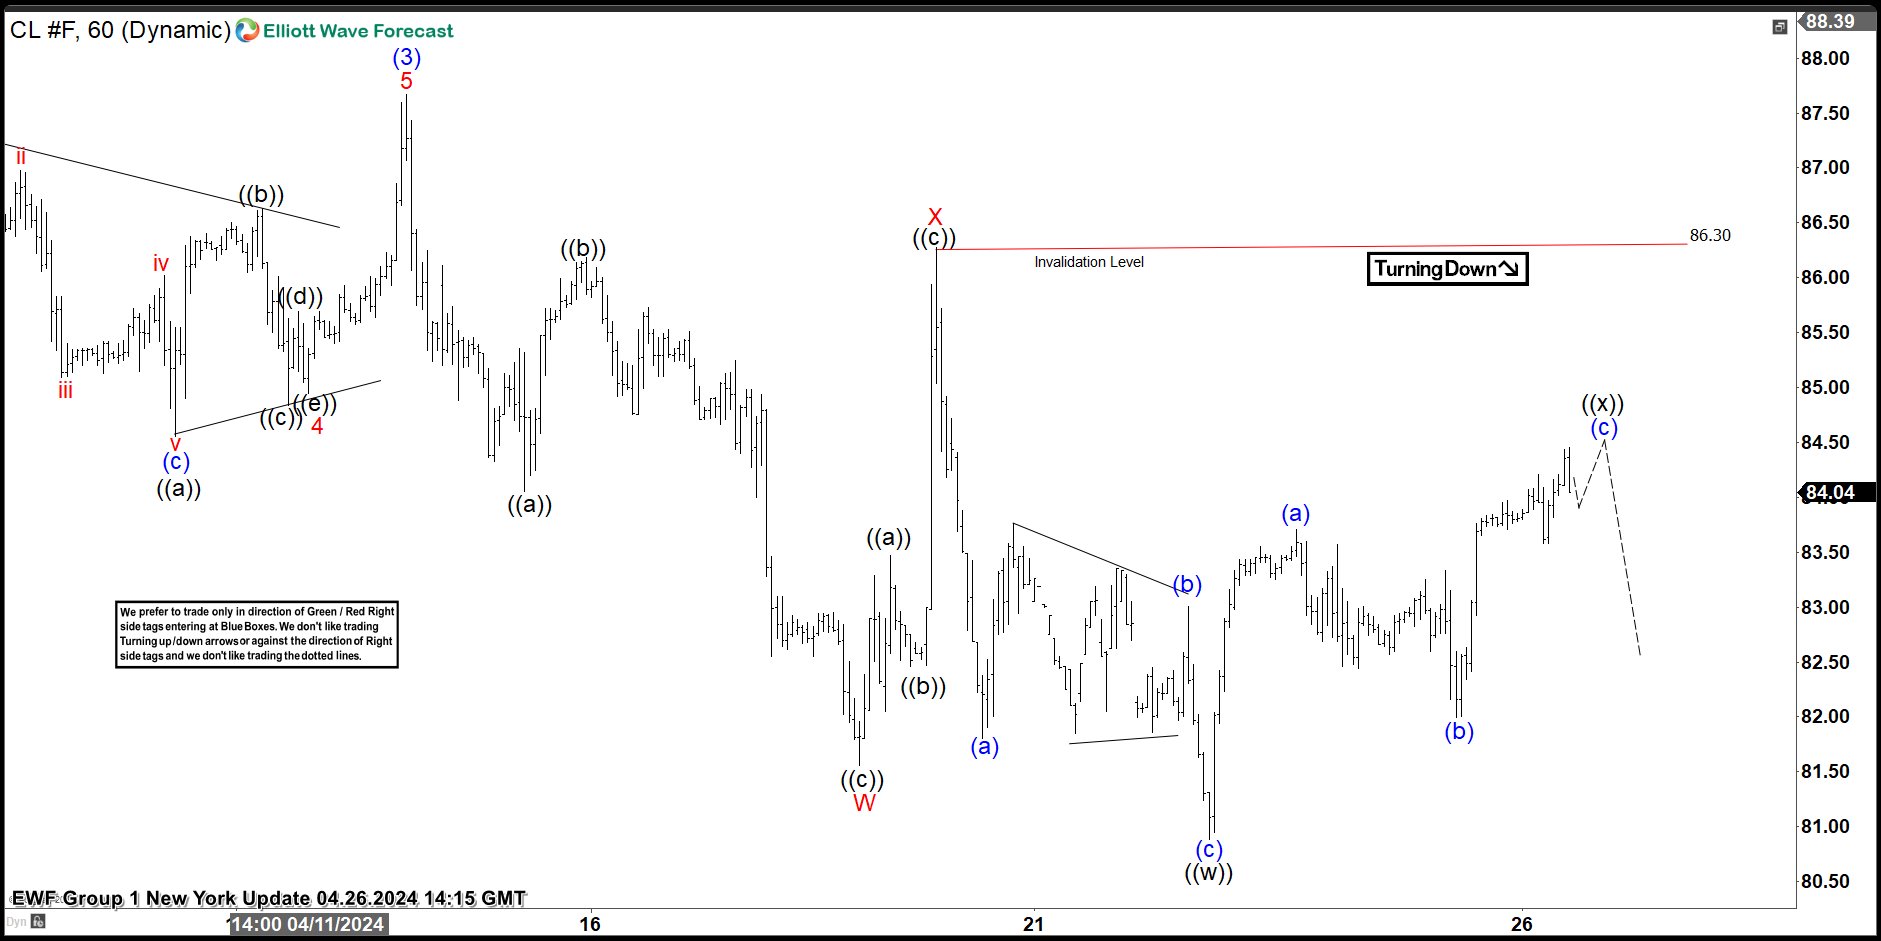
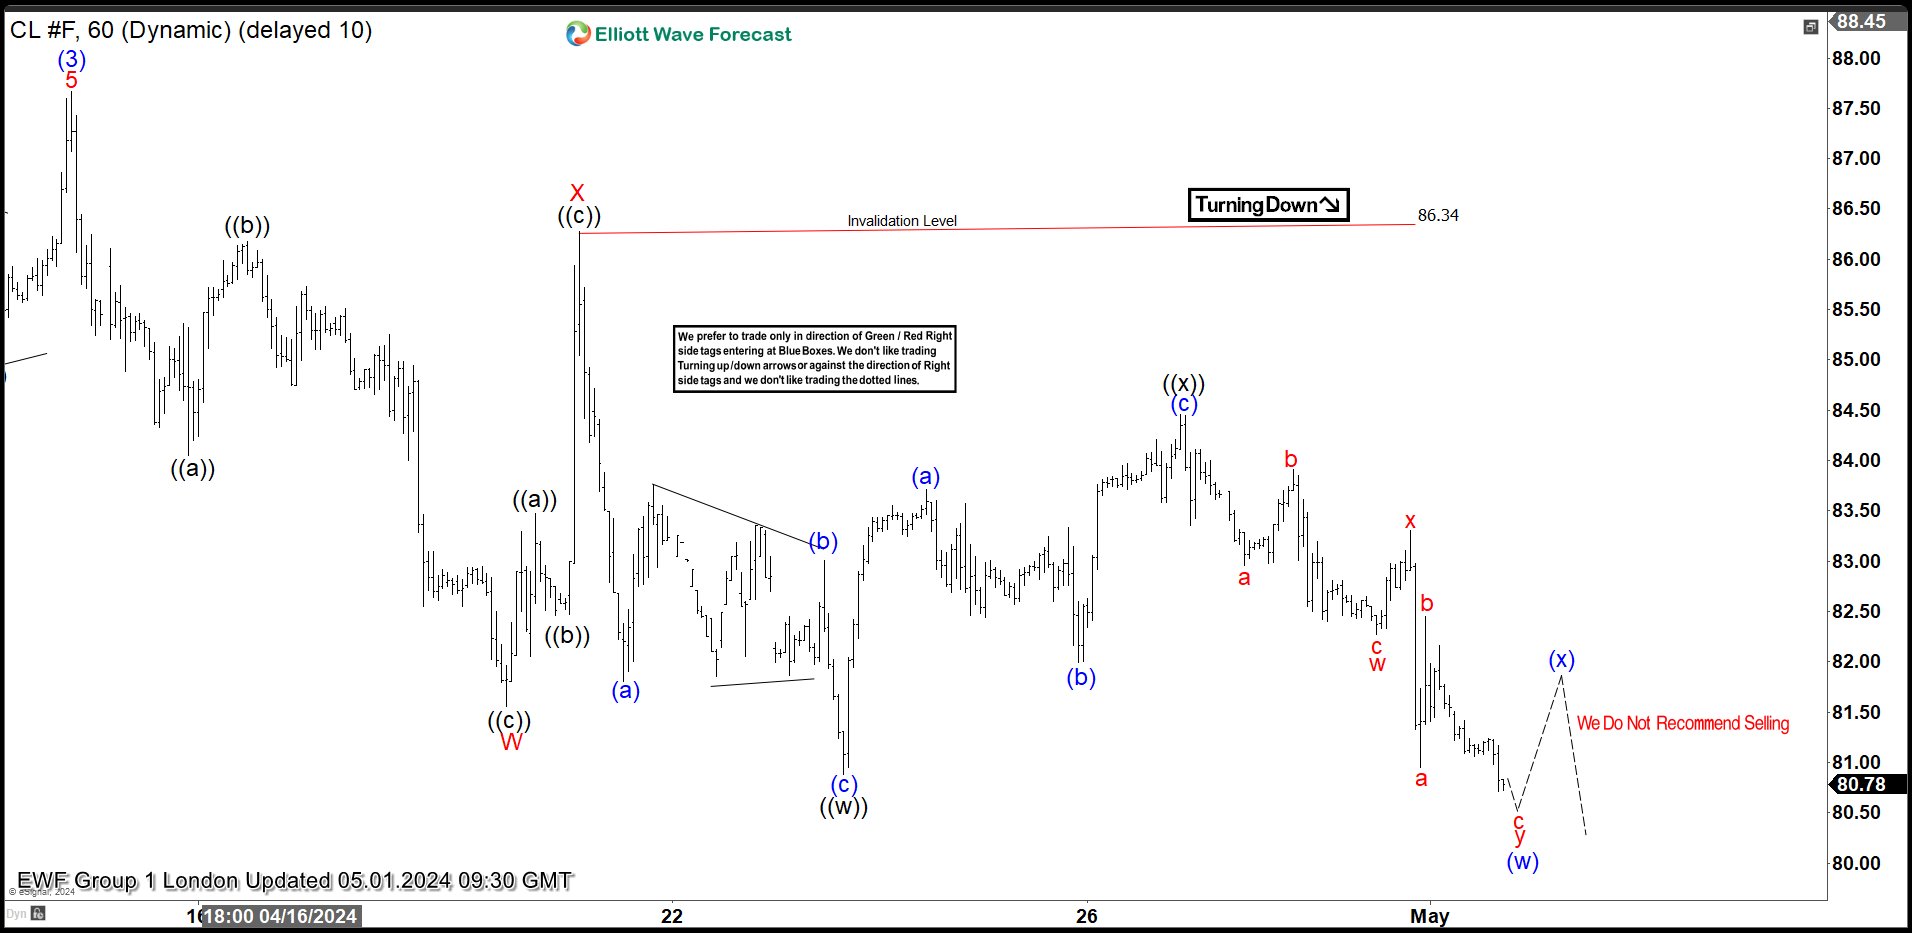
OIL (CL_F) Elliott Wave: Incomplete Sequences Forecasting The Path
Hello fellow traders. In this technical article we’re going to look at the Elliott Wave charts of Oil published in members area of the website. The commodity shows bullish sequences in the cycle from the 67.75 low. Consequently we are favoring the long side and recommending members to keep buying the dips in 3,7,11 swings when get a chance. However, short term cycle from the April 12th peak shows incomplete sequences, suggesting more downside in near term. In further text we’re going to explain the Elliott Wave analysis.
OIL Elliott Wave 1 Hour Chart 03.09.2024
Oil is showing incomplete sequences in the cycle from the April 12th peak. The price structure is calling for more downside as far as 86.3 pivot holds. Current view suggests we are about to complete wave ((x)) connector as Elliott Wave Zig Zag Pattern. We don’t recommend selling. Strategy is waiting for extreme zone to be reached before buying the commodity again.
OIL Elliott Wave 1 Hour Chart 03.13.2024
The commodity completed 3 waves correction as ((x)) black, and made decline toward new lows as expected. The price is heading toward our target area 80.19-76.42 where we would like to be buyers again. We don’t recommend selling the commodity and prefer the long side from the mentioned extreme zone.
US ADP employment rises 192k in Apr, vs exp 180k
US ADP private employment grew 192k in April, above expectation of 180k. By sector, goods-producing jobs rose 47k, service-providing jobs rose 145k. By establishment size, small companies added 38k jobs, medium companies added 62k, large companies added 98k.
Year-over-year pay gains for job-stayers were little changed in April at 5%. Pay growth for job- changers fell from 10.1% in March to 9.3%.
"Hiring was broad-based in April," said Nela Richardson, chief economist, ADP. "Only the information sector – telecommunications, media, and information technology – showed weakness, posting job losses and the smallest pace of pay gains since August 2021."
Will Post-FOMC Jobs Report Move Dollar?
- US nonfarm payrolls scheduled for release on Friday 12:30 GMT
- Another solid report could question rate cuts if Powell provides no clear guidance
- EURUSD at risk of plunging towards April’s low of 1.0600
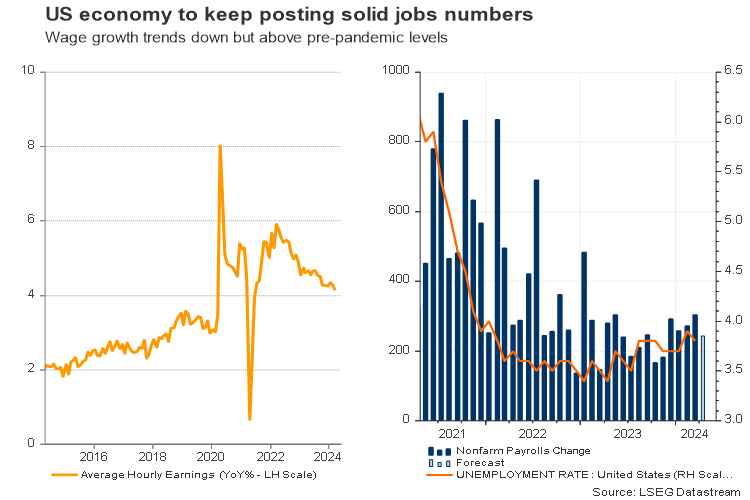
April's nonfarm payrolls might cause volatility
Friday will be a nonfarm payrolls day and investors expect the economy to have added 243k new job positions in April, keeping the unemployment rate steady at 3.8% and wage growth stable at 0.3% m/m.
The report will be the first release of the second quarter. Therefore, while the FOMC policy announcement may be the main event of the week, the data could still affect markets, particularly if Fed chief Powell offers no clarity on the rate path. Note that there will be no forecast updates during this week’s policy meeting.
Hotter-than-expected CPI inflation prints and signs of resurgence followed by hawkish Fed comments made investors think that the central bank will not cut interest rates as previously expected, at least not before November 2024.
Will Powell move the needle?
What is more striking is that talks for a rate hike resurfaced as some policymakers, including board member Williams, did not rule out the possibility of another increase. Of course, this is currently the least likely scenario, and policymakers might need inflation, and specifically the core measures, which exclude volatile food and energy prices, to shoot higher to confirm that the progress on inflation hasn't only halted but that it's also reversing.
Yet, with divisions growing within the board about the next rate action, Powell may not change his communication tone this week but repeat his recent commentary for "higher for longer" borrowing costs. However, if he does not provide further details such as how long will the central bank wait before it becomes confident inflation is sliding back towards the 2.0% target, traders might look at Friday’s jobs data for some direction.
Another solid jobs report expected
If forecasts are correct, April’s report may not generate any concerns about the US labor market. A growth of 243k compared to 303k in March would still be an outsize jump and perhaps an encouraging sign that the labor market can handle the increased migrant inflows, especially if the unemployment rate remains stable and below 4% for the 27th consecutive month – the longest stretch since the 1960s.
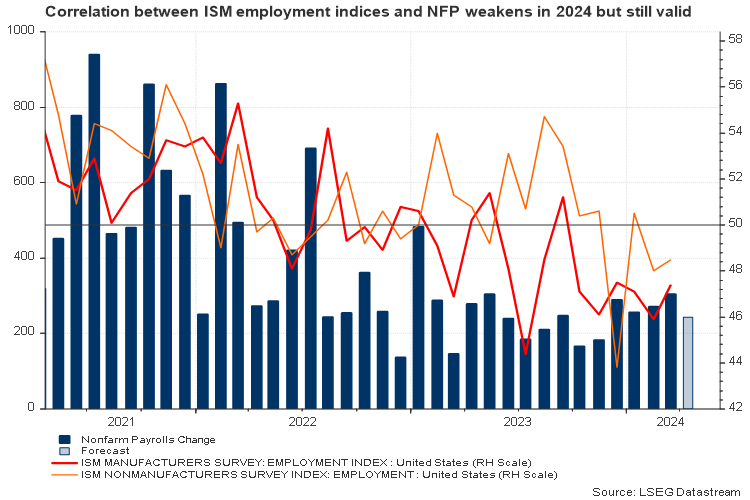
It’s worthy to note that the ISM business survey has been pointing to contracting employment conditions since the start of the year. But given its somewhat broken correlation with the NFP report and the healthy number of weekly initial jobless claims, there is little risk for employment growth disappointing significantly below 200k. Moreover, excluding the pandemic’s huge loss, April’s readings have been comfortably above that threshold since 2018. Perhaps if the Q1 GDP slowdown stretches into the next quarters, employers might start trimming demand for workers.
In other metrics, wage growth might attract special attention after the Bureau of Labor statistics revealed a higher-than-expected compensation increase of 1.2% in Q1 versus 0.9% at the end of December 2023. The annual change has stabilized at 4.2%, though this is still comfortably above the pace of 3.5% which the Fed considers more consistent with achieving its price stability target. Therefore, if April’s average hourly earnings surprise to the upside or appear more sticky, there will be less need for a rate cut.
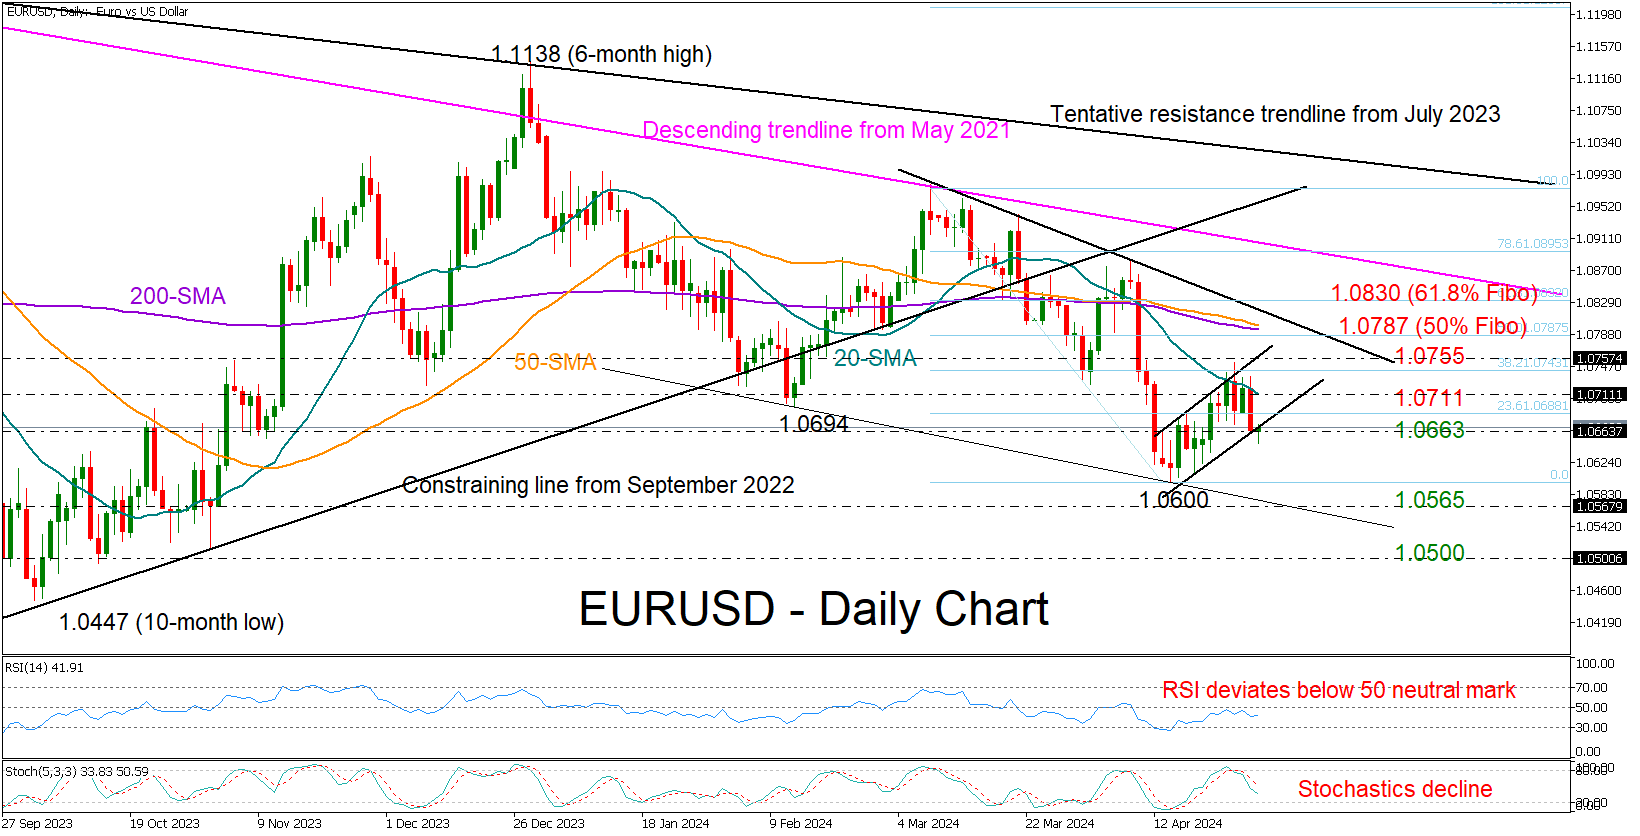
EUR/USD levels to watch
With investors trimming their 2024 rate cut projections from three to hardly one over the past month, another upbeat jobs report could overall support the case for higher for longer interest rates, adding more fuel to the dollar’s rally.
Looking at EURUSD, the pair is currently trading at the lower boundary of a bullish short-term channel around 1.0663 after getting a rejection from the 20-day simple moving average (SMA) on Tuesday. The market does not look oversold according to the technical indicators. Hence, more downside might be on the cards. In this case, the door would open for April’s low of 1.0600, while lower, the sell-off might pause near the 1.0565 former restrictive zone and then around 1.0500.
Alternatively, a wide miss in the jobs numbers might help the pair crawl higher. If the 20-day SMA gives way at 1.0711, the price might find resistance near the channel’s upper band at 1.0755 before meeting the 50- and 200-day SMAs around 1.0787.
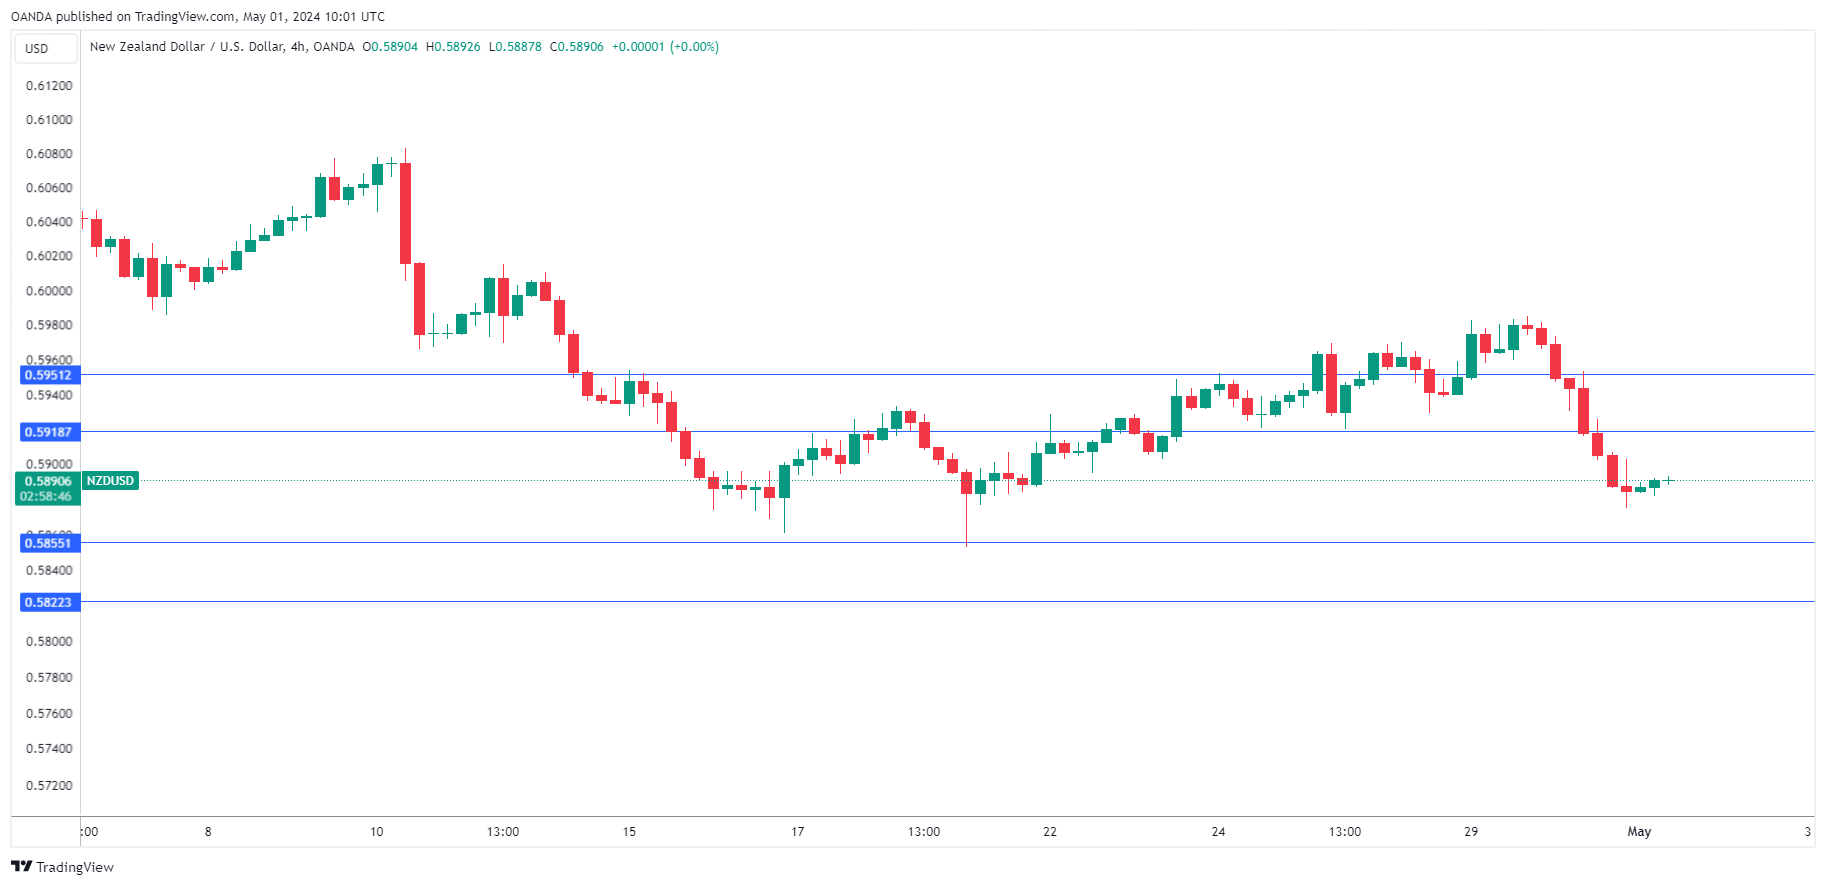
NZ Dollar Shrugs After Soft Jobs Report
The New Zealand dollar has steadied on Thursday, after a sharp decline of 1.5% a day earlier. NZD/USD is trading higher 0.08% on the day at 0.5890, at the time of writing.
New Zealand’s employment declines
New Zealand’s labor market is showing signs of cracks. Employment in the fourth quarter declined by 0.2% q/q, down from the 0.4% gain in Q4 2023 and shy of the market estimate of 0.3%. This marked the second decline in three months. The unemployment rate jumped to 4.3%, up from 4% in the fourth quarter and above the market estimate of 4.3%. Despite the weakness in the labor market, private sector wage growth remained high at 3.8% y/y.
How will the Reserve Bank of New Zealand react to the jobs report? The RBNZ has maintained the cash rate at 5.50% for six straight times, continuing its stance of “higher for longer”. The inflation rate fell in the first quarter from 4.7% to 4% but this remains above the upper band of the 1% to 3% target range. RBNZ policy makers will be keeping a close eye on key data, in particular inflation for second quarter, which will be released in July. Three of the four major banks expect a rate cut in the fourth quarter, while a fourth is projecting a cut in Q1 2025.
The New Zealand ANZ business confidence index fell to 14.9 in April, down from 22.9 a month earlier. Business confidence fell across all sectors and business activity compared to a year ago has decreased, with the retail and manufacturing sectors hit particularly hard.
NZD/USD Technical
- There is resistance at 0.5918 and 0.5951
- 0.5855 and 0.5822 are providing support
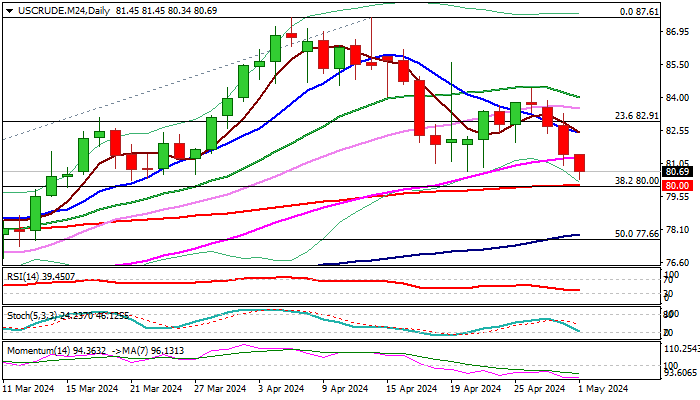
WTI: Crude Oil Price Continues to Trend Lower and Pressure Key Support Zone
WTI oil price remains in red for the third straight day, deflated by growing hopes of a ceasefire agreement in the Middle East and rising US crude inventories.
Also, stubbornly high US inflation continues to cool rate cut expectations and adds concerns that demand would weaken further in current conditions.
The daily chart shows growing negative signals as bearish momentum is strengthening, the price fell below 10/20/55DMA’s, and the action is about to complete a failure swing pattern.
The price hit five-week low in early trading on Wednesday and pressuring key support at $80.00 zone (psychological / Fibo 38.2% of $67.70/$87.61 / 200DMA / top of rising daily cloud).
Bears are likely to face increased headwinds here, though overall picture is negative, with widely expected decision of the US central bank to stay on hold today and keep high interest rates for prolonged period, which would further harm demand outlook.
Sustained break of $80 zone would generate strong bearish signal for deeper correction of Dec/Apr $67.70/$87.61 rally and expose targets at $77.86/66 (100DMA / 50% retracement).
Broken 55DMA ($81.33) marks initial resistance, ahead of falling 10DMA ($82.46) and upper breakpoint at $83.99 (20DMA).
Res: 81.33; 82.46; 82.91; 83.99.
Sup: 80.00; 79.27; 78.90; 77.86.
UK PMI manufacturing finalized at 49.1, sector faces multiple challenges
UK PMI Manufacturing was finalized at 49.1 in April, down from March's 50.3. This decline was also reflected in four key areas: output, new orders, employment, and stocks of purchases. Furthermore, input price inflation hit a 14-month high, exacerbating cost pressures for manufacturers.
Rob Dobson, Director at S&P Global Market Intelligence, highlighted the renewed downturn, attributing the challenges to weak market confidence, client destocking, and disruptions caused by the ongoing Red Sea crisis. These factors have notably hindered the sector's ability to secure new work from key international markets including Europe, the US, and Asia.
The manufacturing downturn is prompting firms to exercise "cost caution," leading to reduced employment levels, lower stock holdings, and cutbacks in purchasing activity. Dobson expressed concern over the implications for consumer price inflation, noting that the ongoing cost pressures within the manufacturing sector are complicating efforts to return inflation to target levels.
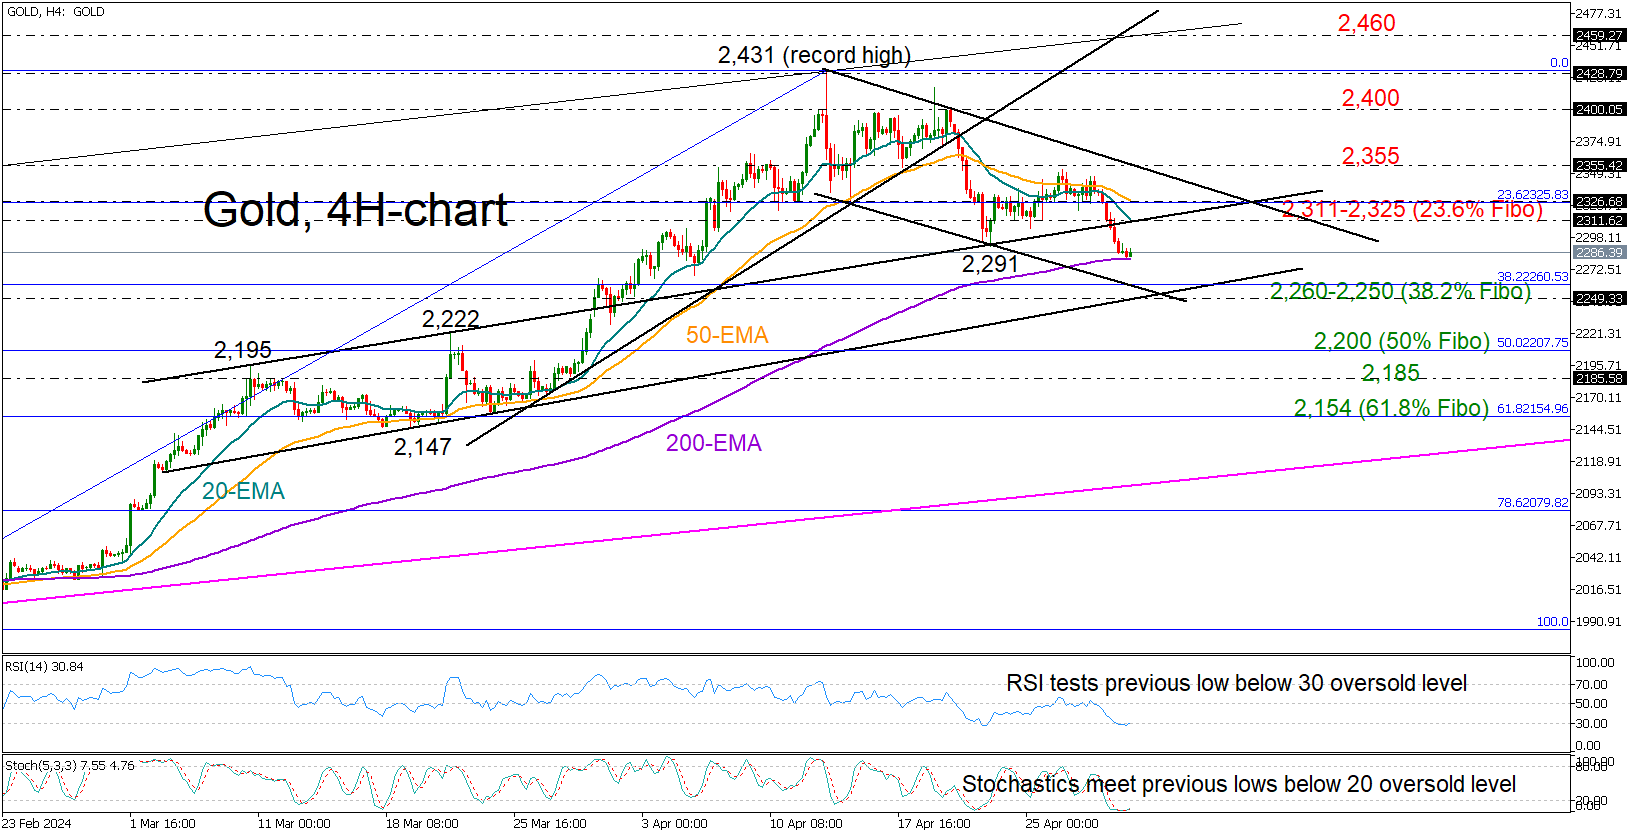
Gold Seeks Safety After Tuesday’s Drop
- Gold trends lower in the short-term picture, near oversold territory
- Stronger buying needed above 2,355 for a bullish outlook
- FOMC policy announcement due today at 18:00 GMT
Gold bears took control on Tuesday, pressing the price below the resistance-turned-support trendline, which halted last week’s decline, and towards the 200-period exponential moving average (EMA) in the four-hour chart at 2,280.
In the technical indicators, the RSI and the stochastic oscillator have stabilized their downfall near their previous lows within the oversold region and are looking for an upside reversal. That indicates an excessive bearish action, which might result in an upward correction or some stability. That said, the falling shorter-term EMAs suggest that the negative trend may continue to dominate.
Should the bears breach the floor at 2,280, support could initially develop within the 2,250-2,260 area, which includes the 23.6% Fibonacci retracement of the February-April uptrend, the lower boundary of the ongoing short-term bearish channel and the protective trendline from March 5. A step below that base could intensify selling pressures, sinking the precious metal to the 50% Fibonacci of 2,200. The 2,185 constraining zone from March could be the next pivot point.
Alternatively, there could be congestion between the 20- and 50-period EMAs at 2,311 and 2,325 respectively if the bounce off the 200-period EMA occurs. Running above the downward-sloping channel at 2,355 should be a bigger achievement and the key for a direct flight back to 2,400. Even higher, an extension above the 2,430 record high could face a barrier near 2,460.
To sum it up, there is a possibility that gold will seek to recover its positive momentum in the coming sessions because it is currently trading near a significant support zone. Still, for the outlook to brighten again, the price will have to jump back above 2,355.
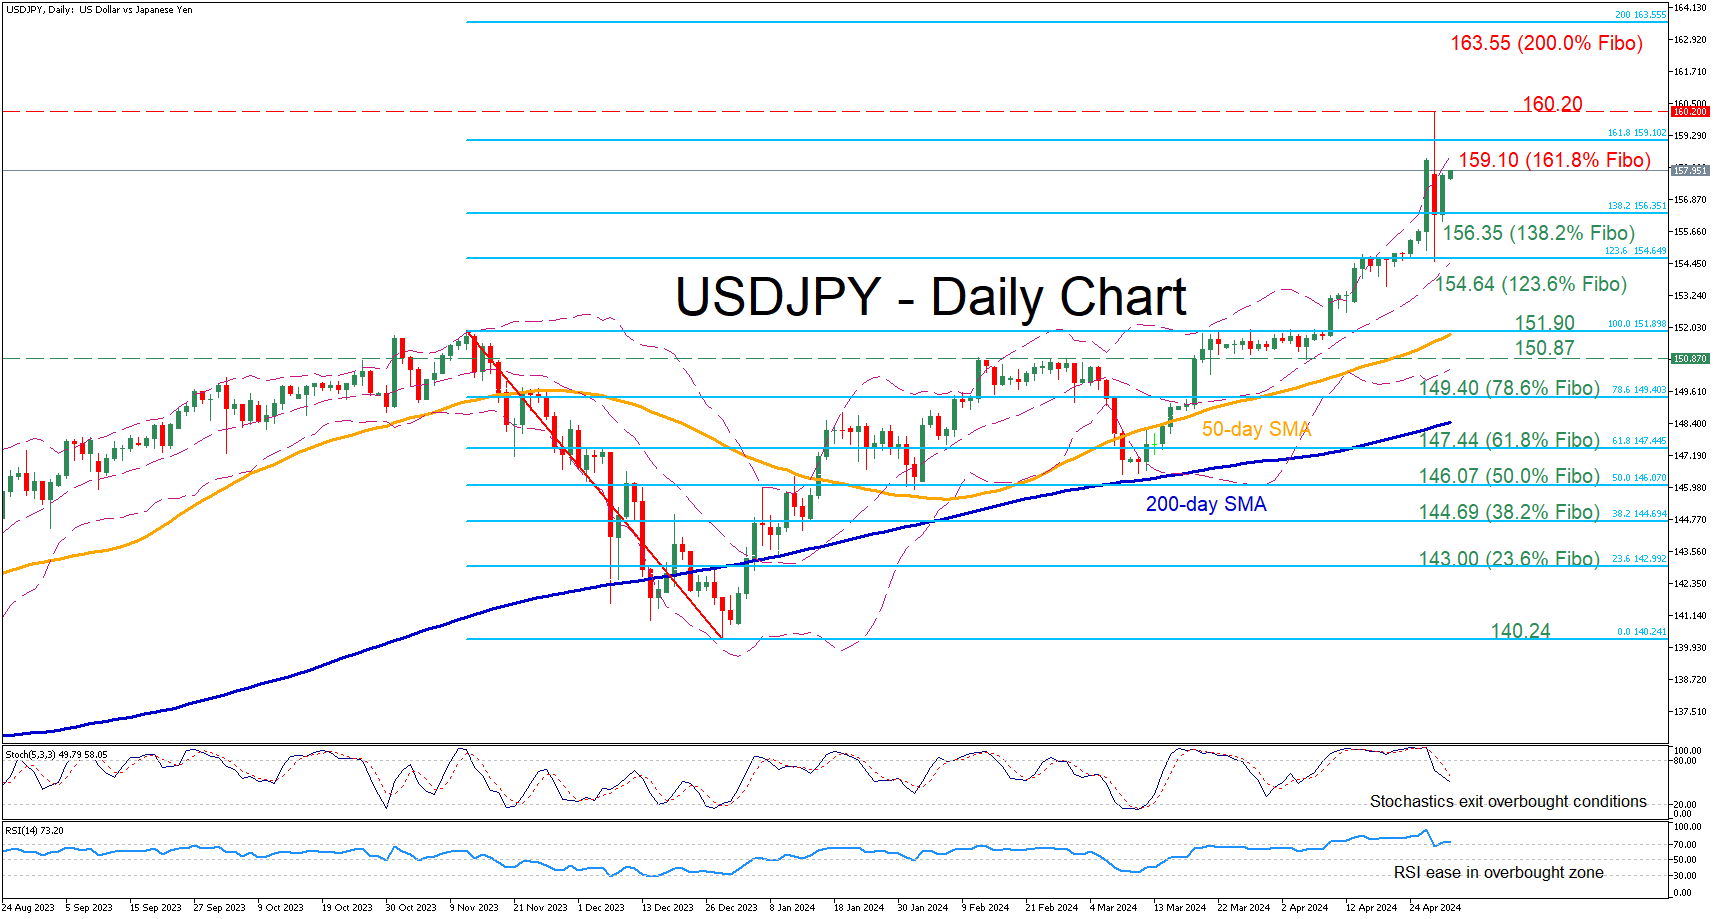
USDJPY Stabilizes a Tad Below 160.00
- USDJPY jumps to its highest level since April 1990
- A suspected Japanese intervention does not have meaningful impact
- Oscillators exhibit a divergence regarding overbought conditions
USDJPY has been in a steady uptrend since the beginning of the year, posting a fresh 34-year high on Monday. After a roller coaster session that day following speculation over a Japanese intervention, the pair experienced a strong sell off before recouping a significant part of its losses.
Should bullish pressures persist, the price could challenge could 159.10, which is the 161.8% Fibonacci extension of the 151.90-140.24 downleg. Further upside attempts could then come to a halt at the recent 34-year peak of 160.20. Conquering this barricade, the bulls may attack the 200.0% Fibo of 163.55.
On the flipside, if the pair comes under selling pressure, immediate support could be found at the 138.2% Fibo of 156.35. Failing to halt there, the price could descend towards the 123.6% Fibo of 154.64, a region that put a stop to the price’s decline on Monday. Lower, the November 2023 high of 151.90 could prove to be the next barrier for the bears to overcome.
In brief, despite a potential intervention by Japanese authorities on Monday, USDJPY remains under buying pressure. Hence, the outcome of a re-test of the 160.00 handle could decide the pair’s future.