Sample Category Title
EUR/USD Dives While USD/CHF Extends Rally
EUR/USD started a fresh decline below the 1.0695 support. USD/CHF is rising and might aim a move toward the 0.9250 resistance.
Important Takeaways for EUR/USD and USD/CHF Analysis Today
- The Euro struggled to clear the 1.0750 resistance and declined against the US Dollar.
- There was a break below a key bullish trend line with support at 1.0695 on the hourly chart of EUR/USD at FXOpen.
- USD/CHF is showing positive signs above the 0.9185 resistance zone.
- There was a break above a major bearish trend line with resistance at 0.9130 on the hourly chart at FXOpen.
EUR/USD Technical Analysis
On the hourly chart of EUR/USD at FXOpen, the pair failed to clear the 1.0750 resistance. The Euro started a fresh decline below the 1.0700 support against the US Dollar, as mentioned in the previous analysis.
There was a break below a key bullish trend line with support at 1.0695. Besides, the pair declined below the 50-hour simple moving average and 1.0675. The pair traded as low as 1.0654 and is currently correcting losses.
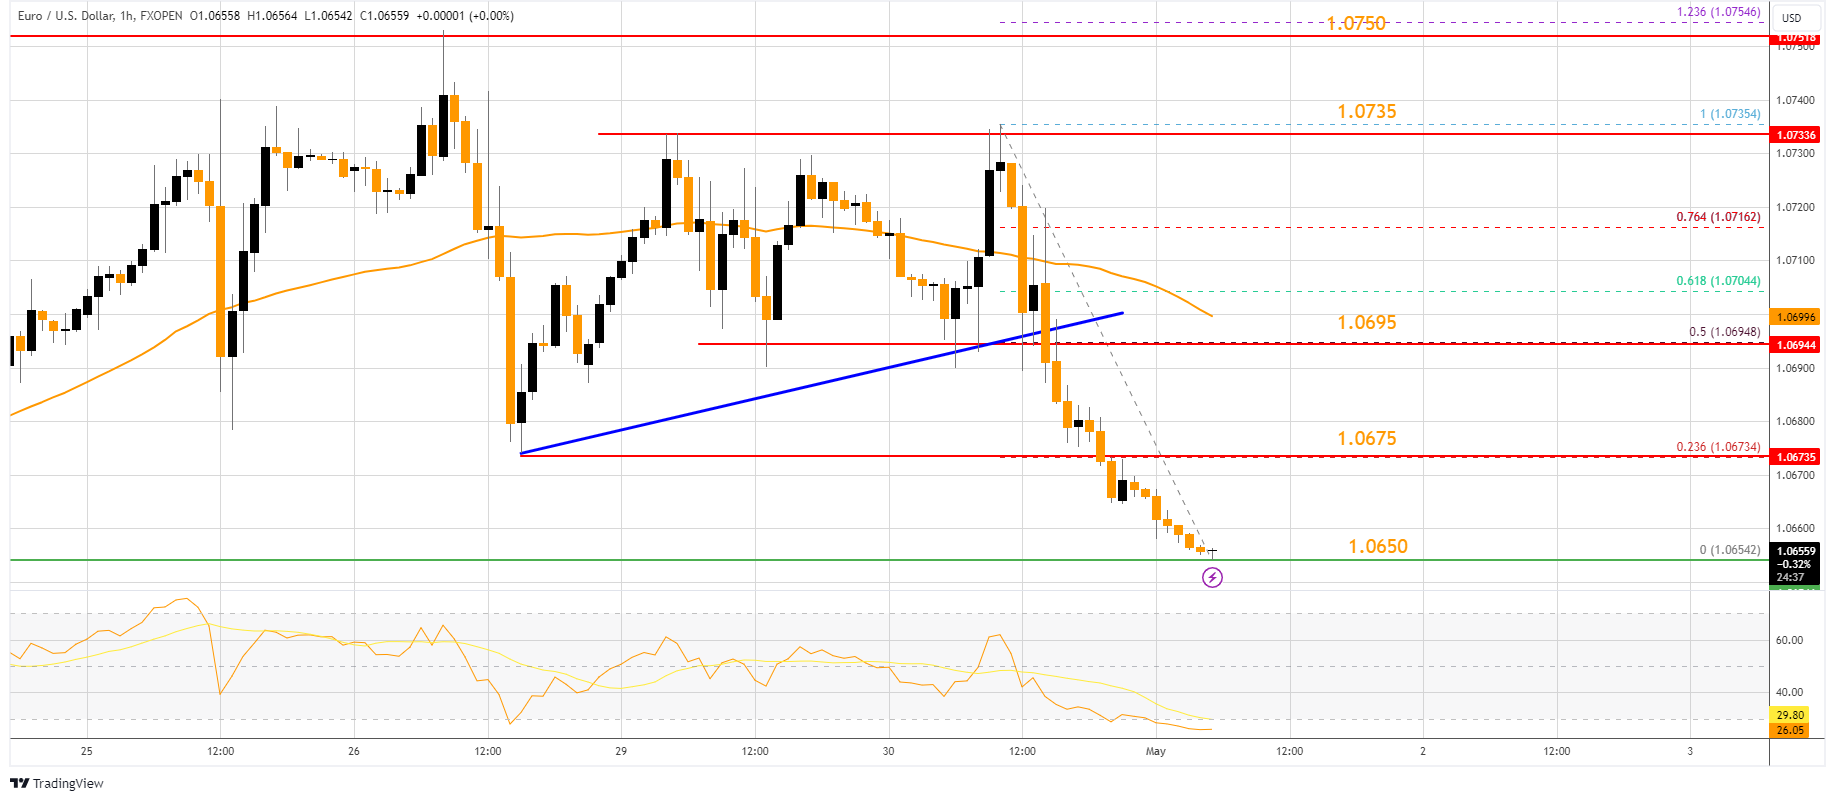
The pair is showing bearish signs, and the upsides might remain capped. Immediate resistance on the upside is near the 23.6% Fib retracement level of the downward move from the 1.0735 swing high to the 1.0654 low at 1.0675.
The next major resistance is near the 1.0695 zone or the 50-hour simple moving average. It is close to the 50% Fib retracement level of the downward move from the 1.0735 swing high to the 1.0654 low.
An upside break above the 1.0695 level might send the pair toward the 1.0735 resistance. Any more gains might open the doors for a move toward the 1.0750 level.
On the downside, immediate support on the EUR/USD chart is seen near 1.0650. The next major support is near the 1.0630 level. A downside break below the 1.0630 support could send the pair toward the 1.0580 level.
USD/CHF Technical Analysis
On the hourly chart of USD/CHF at FXOpen, the pair started a decent increase from the 0.9100 support. The US Dollar climbed above the 0.9120 resistance zone against the Swiss Franc.
There was a break above a major bearish trend line with resistance at 0.9130. The bulls were able to pump the pair above the 50-hour simple moving average and 0.9185. Finally, the pair tested the 0.9215 zone.
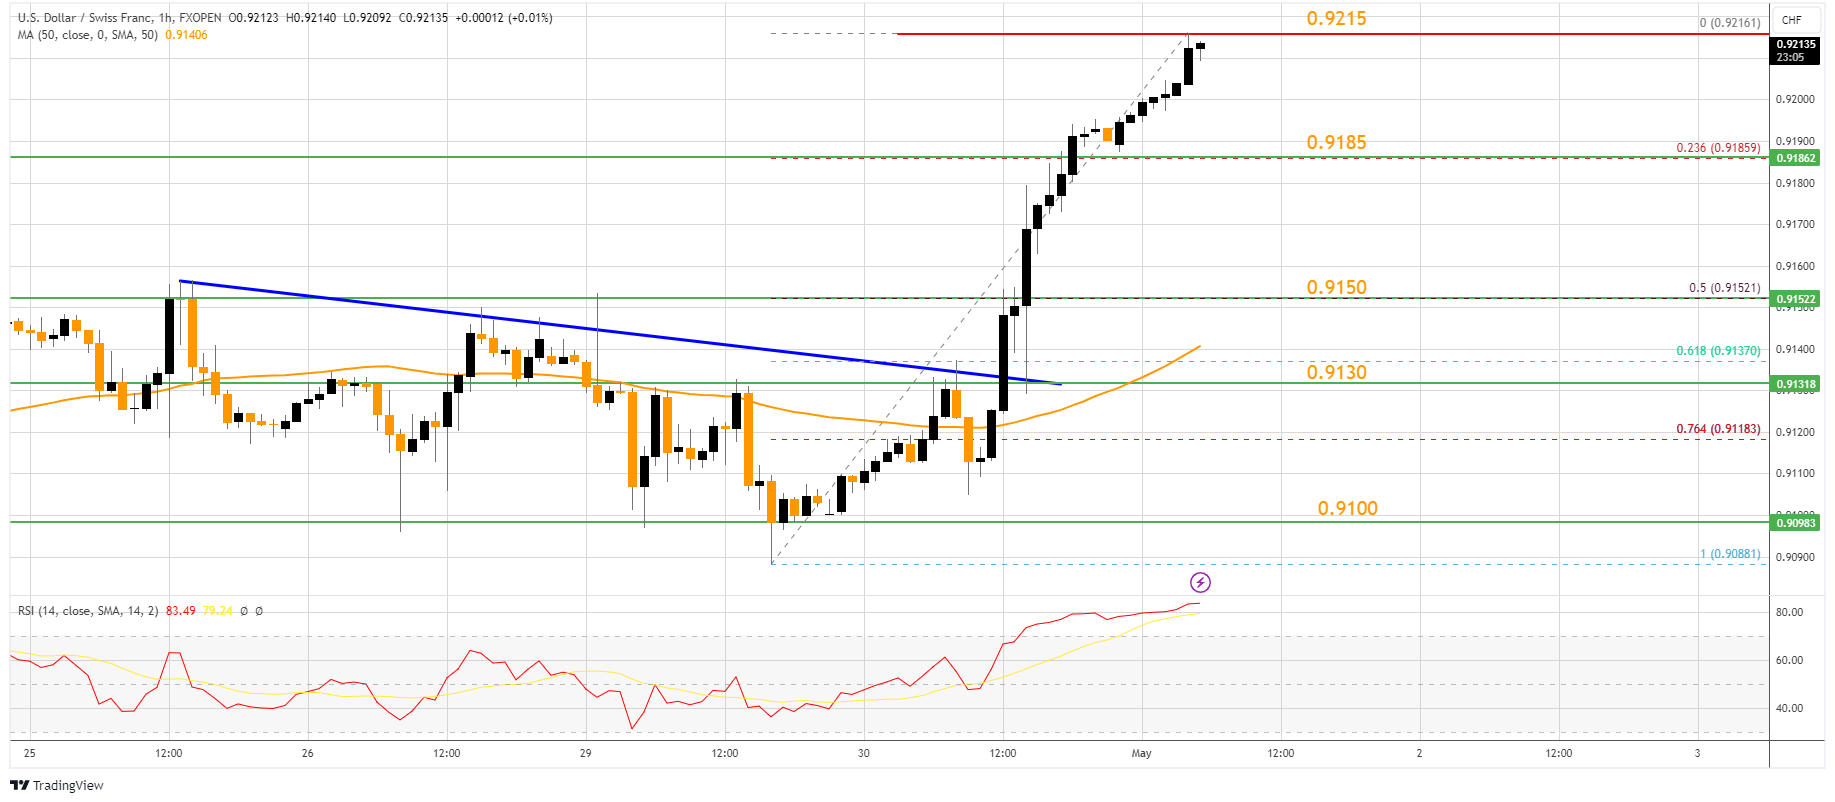
A high was formed near 0.9216 and the pair is still showing signs of more upsides. On the upside, the pair is now facing resistance near 0.9215.
The next major resistance is at 0.9240. The main resistance is now near 0.9250. If there is a clear break above the 0.9250 resistance zone and the RSI remains above 60, the pair could start another increase. In the stated case, it could test 0.9300.
If there is a downside correction, the pair might test the 23.6% Fib retracement level of the upward move from the 0.9088 swing low to the 0.9216 high at 0.9185.
The first major support on the USD/CHF chart is near the 50% Fib retracement level of the upward move from the 0.9088 swing low to the 0.9216 high at 0.9150. A downside break below 0.9150 might spark bearish moves. The next major support is near the 0.9130 pivot level. Any more losses may possibly open the doors for a move toward the 0.9100 level in the near term.
Trade over 50 forex markets 24 hours a day with FXOpen. Take advantage of low commissions, deep liquidity, and spreads from 0.0 pips. Open your FXOpen account now or learn more about trading forex with FXOpen.
This article represents the opinion of the Companies operating under the FXOpen brand only. It is not to be construed as an offer, solicitation, or recommendation with respect to products and services provided by the Companies operating under the FXOpen brand, nor is it to be considered financial advice.
A New Stage of Bitcoin’s Decline
Market Picture
Bitcoin’s closing price on Tuesday became the lowest since late February, confirming the downward trend and falling under March and April support and the psychologically important round level.
Bitcoin ended April down 15.5% to $59.9K, after six months of gains out of the last seven (January BTC ended virtually unchanged).
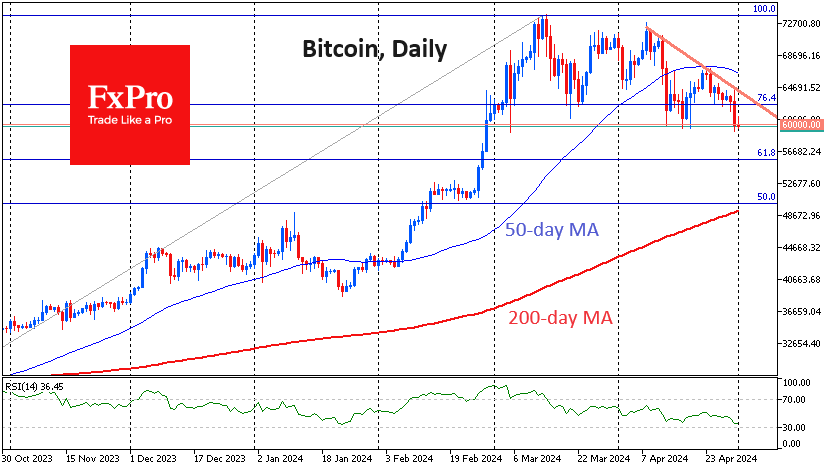
Technical downside targets now look to be $55.7K (61.8% Fibonacci retracement of the rise since October) and the $51-52K area (late January consolidation area). However, both FOMC announcements later today and monthly jobs data on Friday have enough potential to accelerate or reverse the downtrend.
In terms of seasonality, May is not a good month for BTC. Over the past 13 years, bitcoin has ended a given month up on seven occasions and down six times. The average rise was 31.3%, and the average decline was 14.5%. Meanwhile, over the last three years, during May, BTC has slid 20% on average.
News background
FTX Administrators has completed its second round of Solana (SOL) token sales at a price in the neighbourhood of $100. The company sold 1.8 million SOLs in an auction format over the past few weeks.
CryptoQuant has seen no signs of Bitcoin miners capitulating despite the halving of the block reward. Mining has become dangerously centralised. One unnamed organisation holds the coins mined by nine large pools, controlling around 47% of the network’s hashrate, according to a BitMEX report.
According to SoSoValue, outflows from spot bitcoin ETFs have continued for five consecutive days. Since the products were approved on 11 January, investors have cumulatively invested $11.94 billion in these instruments. During April, there was a multidirectional flow pattern.
The passage of the US payment-stablecoin bill could surpass the approval of spot bitcoin-ETFs, according to Bitwise. The law would allow banks like JPMorgan to enter the “stablecoin” market.
Ex-Binance CEO Changpeng Zhao was sentenced to four months in prison. The US Department of Justice had demanded a three-year prison sentence.
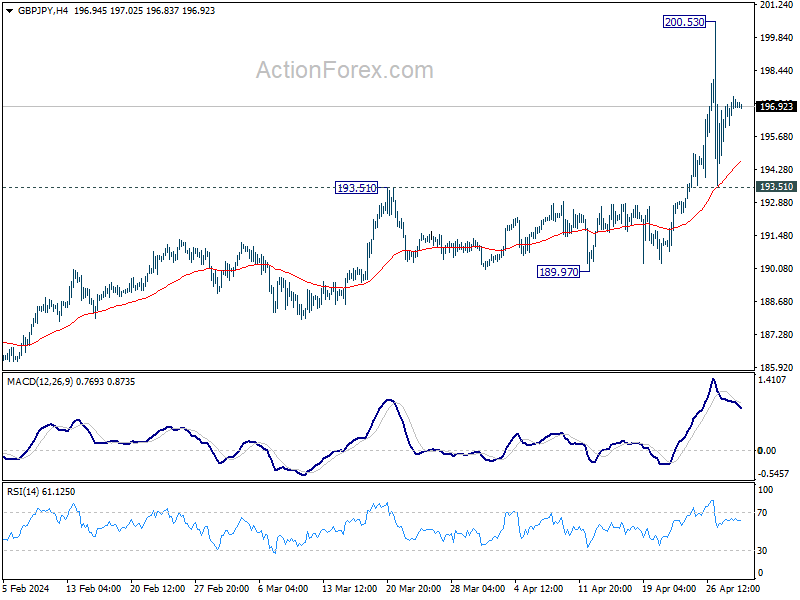
GBP/JPY Daily Outlook
Daily Pivots: (S1) 196.27; (P) 196.82; (R1) 197.70; More..
GBP/JPY is extending consolidation from 200.53 and intraday bias remains neutral. Outlook will remain bullish as long as 193.51 resistance turned support holds. Firm break of 200.53 will resume larger up trend.
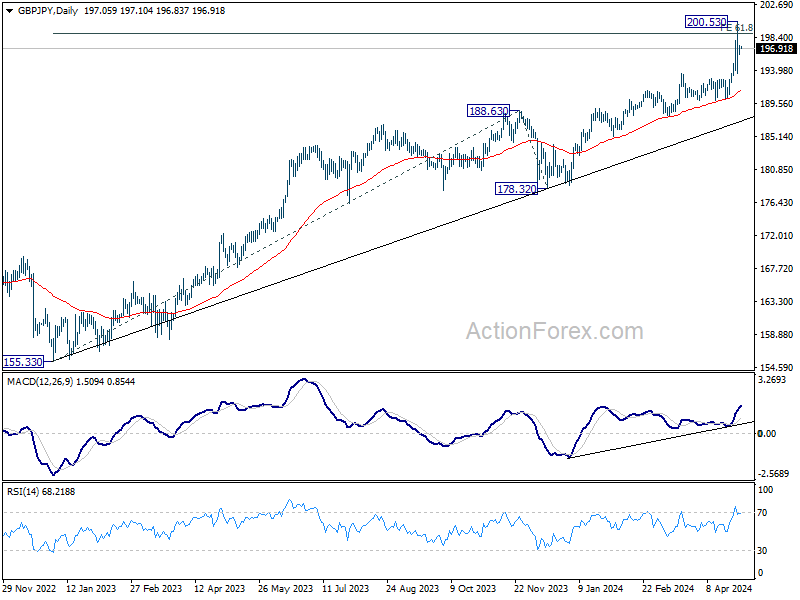
In the bigger picture, current rally is part of the up trend from 123.94 (2020 low). Sustained break of 61.8% projection of 155.33 to 188.63 from 178.32 at 198.89 will pave the way to 100% projection at 211.65. Break of 189.97 support is needed to be the first sign of medium term topping. Otherwise, outlook will remain bullish in case of retreat.
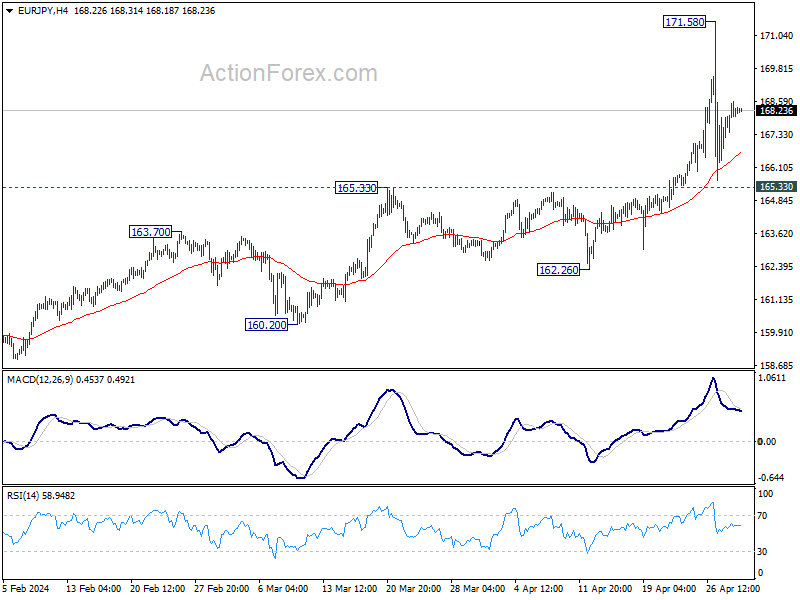
EUR/JPY Daily Outlook
Daily Pivots: (S1) 167.45; (P) 168.02; (R1) 168.82; More...
EUR/JPY is extending consolidation from 171.58 short term top and intraday bias remains neutral. Overall outlook will remain bullish as long as 165.33 resistance turned support holds. Above 171.58 will resume larger up trend to 178.39 projection level next.
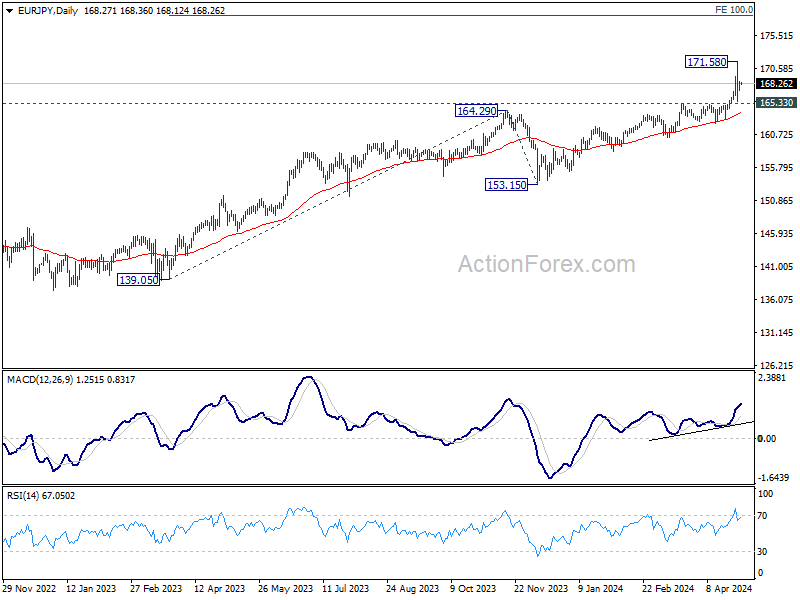
In the bigger picture, current rally is part of the up trend from 114.42 (2020 low), which is still in progress. Decisive break of 169.96 (2008 high) will pave the way to 100% projection of 139.05 to 164.29 from 153.15 at 178.39. On the downside, break of 162.26 support is needed to be the first sign of medium term topping. Otherwise, outlook will stay bullish in case of retreat.
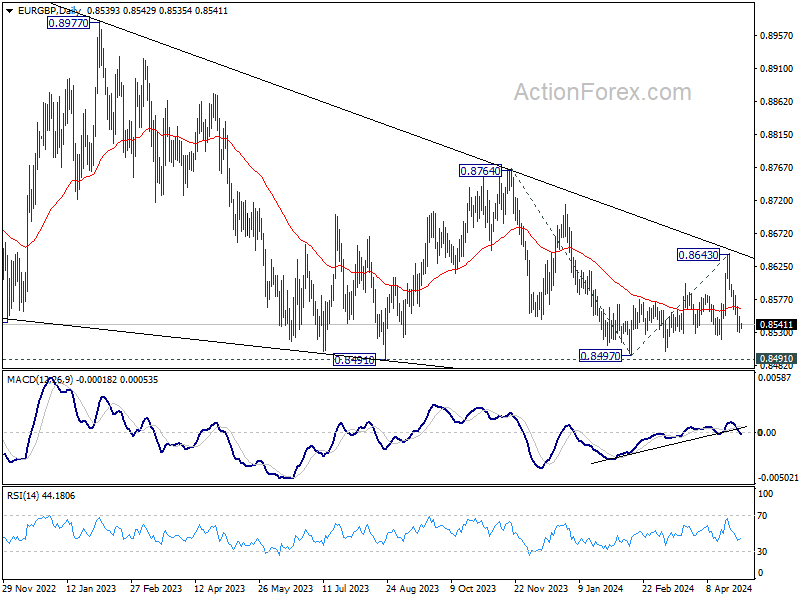
EUR/GBP Daily Outlook
Daily Pivots: (S1) 0.8527; (P) 0.8541; (R1) 0.8553; More...
Intraday bias in EUR/GBP is turned neutral with current recovery. Some consolidations would be seen above 0.8529 temporary low. But further decline is expected as long as 0.8582 resistance holds. Below 0.8529 will target 0.8491/7 support zone.
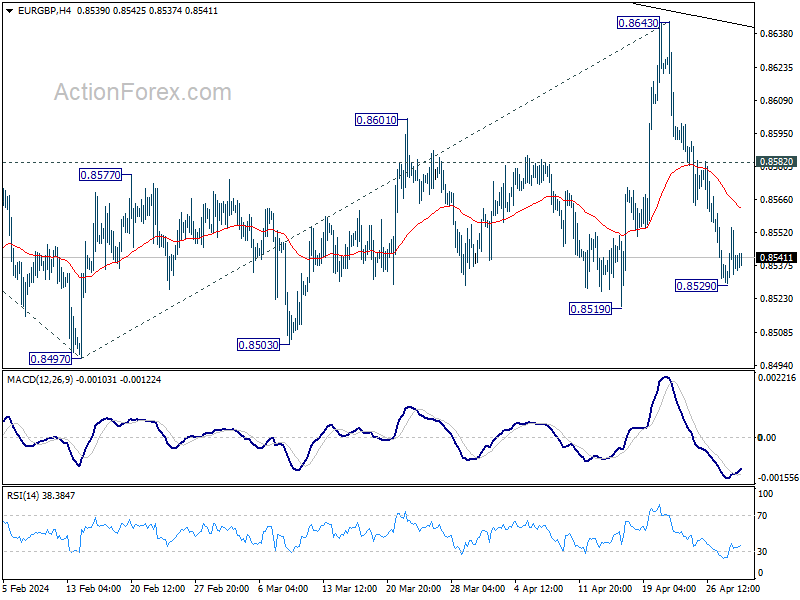
In the bigger picture, outlook remains bearish as EUR/GBP is capped below medium term falling trendline. That is, down trend from 0.9267 (2022 high) is still in progress. Firm break of 0.8491/7 will target 100% projection of 0.8764 to 0.8497 from 0.8643 at 0.8376.
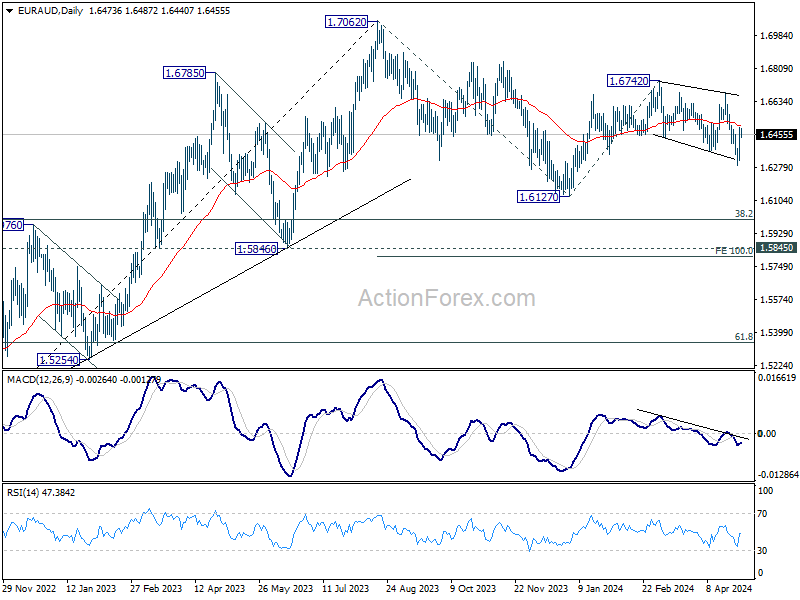
EUR/AUD Daily Outlook
Daily Pivots: (S1) 1.6368; (P) 1.6433; (R1) 1.6544; More...
Intraday bias in EUR/AUD remains neutral at this point. Further decline is expected as long as 1.6484 resistance holds. Below 1.6288 will resume the fall from 1.6742 to 1.6127 support, or further to 100% projection of 1.7062 to 1.6127 from 1.6742 at 1.5807. However, break of 1.6484 will turn bias back to the upside for further rebound.
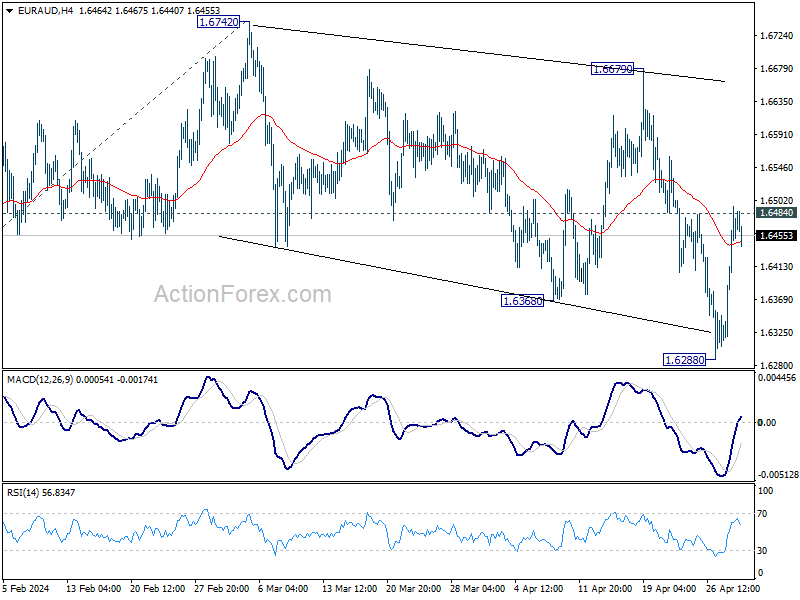
In the bigger picture, fall from 1.7062 medium term top is seen as a correction to the up trend from 1.4281 (2022 low). In case of another fall, strong support is expected around 1.5846 and 38.2% retracement of 1.4281 to 1.7062 at 1.6000 to bring rebound. Break of 1.7062 is in favor as a later stage.
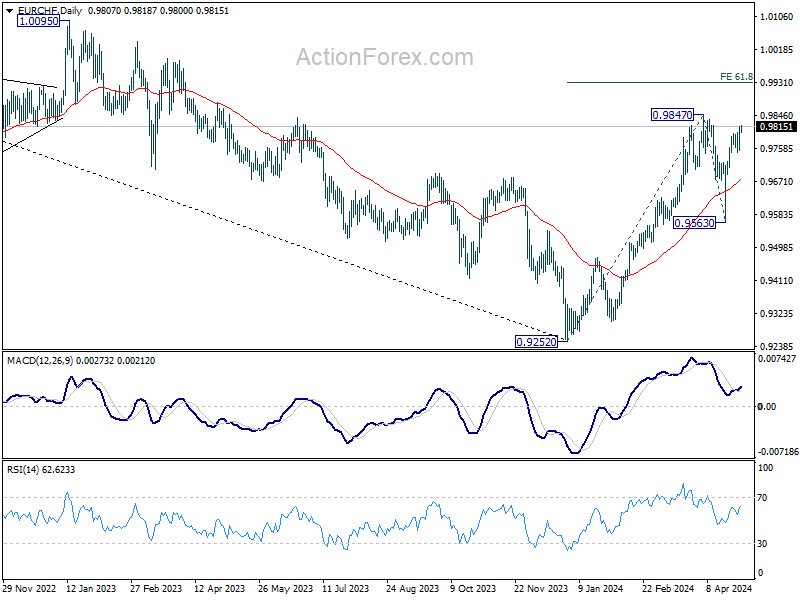
EUR/CHF Daily Outlook
Daily Pivots: (S1) 0.9765; (P) 0.9791; (R1) 0.9833; More...
Intraday bias in EUR/CHF is back on the upside with break of 0.9800 temporary top. Retest of 0.9847 resistance should be seen. Firm break there will resume larger rise from 0.9252 to 61.8% projection of 0.9252 to 0.9847 from 0.9563 at 0.9931 next. Further rally is now expected as long as 0.9748 support holds, in case of retreat.
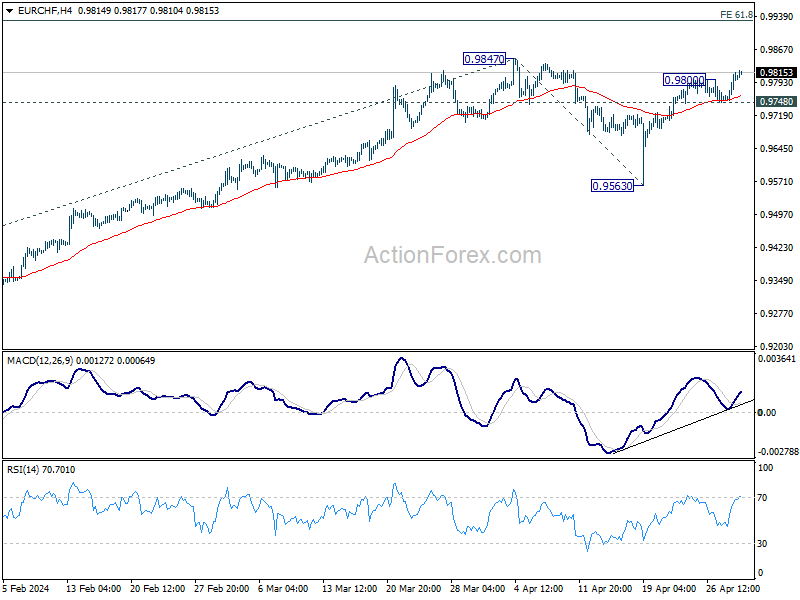
In the bigger picture, while 55 D EMA (now at 0.9644) was breached, EUR/CHF rebounded strongly since then. Rise from 0.9252 medium term bottom should still be in progress. Break of 0.9847 will target 38.2% retracement of 1.2004 (2018 high) to 0.9252 (2023 low) at 1.0303, even as a correction to the down trend from 1.2004. However, sustained trading below 55 D EMA will argue that the rebound has completed.
Focus Turns to Fed
In focus today
Today's main event will be the FOMC meeting, where we and the markets expect no changes to the Fed's policy rate. With no new economic projections, focus will be on Powell's verbal guidance as well as on any hints on the Fed's plans to taper the pace of QT. Read more in Research US - Fed preview - Cuts still in the horizon, 26 April.
Just ahead of the rate decision, ISM Manufacturing index and ADP private sector employment report will be released for April alongside JOLTs labour turnover data for March.
Economic and market news
What happened over night
Markets in Asia have kicked off the first trading session of May ahead of the Fed decision in mixed fashion, with Australian and Japanese stock indices trading lower, and South Korean indices trading marginally higher. This also comes on the back of US equities yesterday closing their worst month since September last year. US equities ended up taking a turn for the worse yesterday after the release of the Employment Cost Index (read more below). Most US futures are also in the red as of this morning with only Dow Jones futures trading slightly up.
In Japan, data indicated that Japanese authorities had intervened in FX markets Monday using upwards of USD35bn supporting the yen, which hit a 34-year low against the dollar (USDJPY). This morning the yen is trading around 157.9 against the dollar.
With today marking International Labour Day, Hong Kong and Chinese markets are closed. China will also be out for the remainder of the week.
What happened yesterday
In the euro area, headline HICP inflation for April came in at 2.4% y/y as was expected, and unchanged from the month prior. Core inflation stood slightly higher than expected at 2.7% y/y (consensus 2.6% y/y), although it declined from 2.9% y/y the month before. Headline was unchanged despite the lower core inflation due to a rise in both food and energy inflation.
The much-important momentum in services inflation came in at 0.35% m/m s.a. which does not rhyme with 2% annual inflation. As such it poses an upside risk to the aggregate inflation outlook. Momentum in services inflation has been strong in the first months of 2024 and this has likely caused some concerns at the ECB.
The euro area economy grew more than what consensus expected in Q1 2024, as the economy saw 0.3% growth q/q (consensus: 0.1% q/q). However, the Q4 2023 number was revised down from 0.0% q/q to -0.1% q/q. We are yet to receive a full and detailed picture of what subcomponents stood out as growth drivers. However, country data suggests that demand especially from outside the euro zone contributed to and drove economic growth in Q1.
In the US, consumer confidence numbers for April surprised to the downside, as it the confidence metric stood at index 97 (prior: 104.7), whereas index 104 had been expected.
Conversely, the Employment Cost Index surprised to the upside, as it rose 1.2% q/q in Q1 2024 (prior: 0.9% q/q) compared to expectations of 1.0% q/q. The subcomponents for wages and benefits both rose 1.1% q/q (prior: 0.9% q/q and 0.7% q/q, respectively). Markets reacted by sending yields higher and EUR/USD lower.
Is Fed Still on Track for a 2024 Rate Cut?
Mood among investors is not cheery into the Federal Reserve’s (Fed) latest monetary policy decision due later today. And it’s understandable. The Fed must respond to three straight month jump in inflation and probably take a step back in its plans to cut the interest rates this year. There is even a risk that the Fed drops the expectation of a rate cut in 2024; that’s the most dovish statement that could reasonably be expected from the Fed at this point, and in the light of the latest economic data.
Speaking of data, figures released yesterday came to back the idea that the Fed’s inflation battle doesn’t necessarily continue to move toward the right direction. The employment cost index rose more than expected in the Q1. The consumer confidence on the other hand sank below 100, it should yet result in slowing spending to help inflation tame – a thing that we haven’t seen yet. The S&P500 fell more than 1.5% yesterday and posted the worse performance this year, the US 2-year yield – which best tracks the Fed rate bets – advanced past the 5% level ahead of the Fed decision and the US dollar extended gains for the fourth month. Investors will watch the ADP, JOLTS and PMI numbers today, but it won’t change the fact that the first quarter of the year was marked with strong jobs data and a notably rise in US inflation. The Fed must address the inflation issue by keeping its rates higher for longer.
Holly AI
If the first few months of the year ended in tears for the Fed doves, the AI-related stocks lived up to very high expectations in the Q1. All the Maginficent 7 stocks that reported earnings so far – except from Tesla – surpassed high market expectations. Amazon posted the best beat among them, as its AWS cloud platform grew 17% compared to the same time last year thanks to sustained AI demand and its advertising services jumped 24% over the same period thanks to new ads on Prime Video.
All in all, Amazon added another piece to the AI puzzle revealing that demand for AI remained robust in the first three months of the year, but the stock price rose less than 2% in the afterhours trading as a weak sales forecast for the current quarter tempered optimism regarding the Q1 results. So maybe – but just maybe – we will see AI growth level out in Q2, and trigger a certain profit taking tech stocks?
Regardless, Amazon remains a strong AI play. They not only benefit directly from AI investments through the AWS unit, but AI also enhances the company’s ad business, as well as automated operations and logistics.
Eurozone exits recession
Eurozone grew at the fastest pace in 18 months and exited recession in the Q1. Germany, France, Italy and Spain – all - exceeded forecasts. Core inflation also slowed in April, though it slowed less than expected. Yesterday’s better-than-expected growth and hotter-than-expected inflation figures could’ve weighed on European Central Bank (ECB) doves, but traders were too busy pricing in the Fed expectations that yesterday’s minor surprises from the Eurozone couldn’t help the euro counter the increased bullish pressure in the dollar. The EURUSD slipped to 1.0650, and risks are tilted to the downside at today’s FOMC announcement.
In energy, US crude cleared the 50-DMA and slipped below the $82pb level after the latest AI report posted an almost 5-mio-barrel build in US oil inventories last week. Hope of easing geopolitical tensions keep the bears in a dominant position while the fading expectations of a Fed rate cut threatens the reflation boost. That also explains why we saw such a sharp drop in copper futures yesterday. Back to oil, the next natural target for the oil bulls stands at $80pb level, that shelters the 200-DMA and the major 38.2% Fibonacci retracement on ytd rise.
USD/CAD Daily Outlook
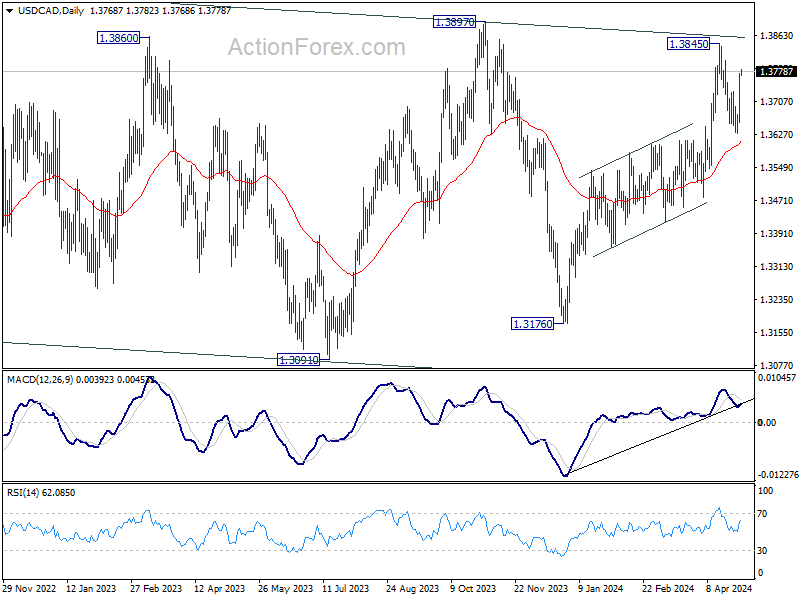
Daily Pivots: (S1) 1.3694; (P) 1.3739; (R1) 1.3824; More...
USD/CAD's break of 1.3730 minor resistance suggests that pullback from 1.3845 has completed at 1.3613. Intraday bias is back on the upside for retesting 1.3845 first. Firm break there will resume larger rise from 1.3176 towards 1.3976 key resistance next. For now, risk will stay on the upside as long as 1.3613 support holds, in case of retreat.
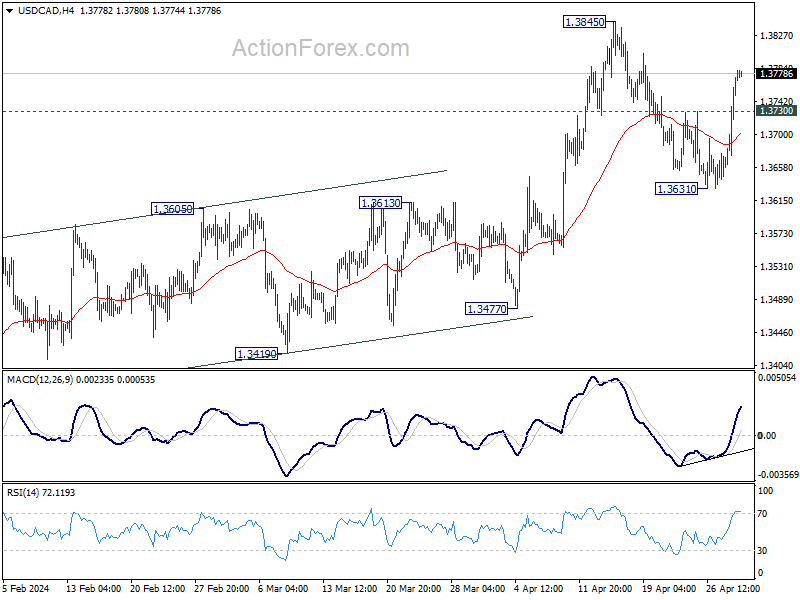
In the bigger picture, price actions from 1.3976 (2022 high) are viewed as a corrective pattern only. In case of another fall, strong support should emerge above 1.2947 resistance turned support to bring rebound. Firm break of 1.3976 will confirm up resumption of whole up trend from 1.2005 (2021 low). Next target is 61.8% projection of 1.2401 to 1.3976 from 1.3176 at 1.4149.