Sample Category Title
U.S. Consumer Spending and Income Rise in March, Inflation Holds Steady
Personal income grew 0.5% month-on-month (m/m) in March, an increase relative to February's 0.3% gain and in line with market expectations.
Accounting for inflation and taxes, real personal disposable income rose 0.2% in March, a recovery from the -0.1% decline in February.
Personal consumption expenditures rose by 0.8% m/m for a second consecutive month, above market expectations (0.6%). Spending in real terms rose by a solid 0.5% m/m – the same as in February. The increase in real spending reflected growth in both goods (1.1%) and services (0.2%) outlays.
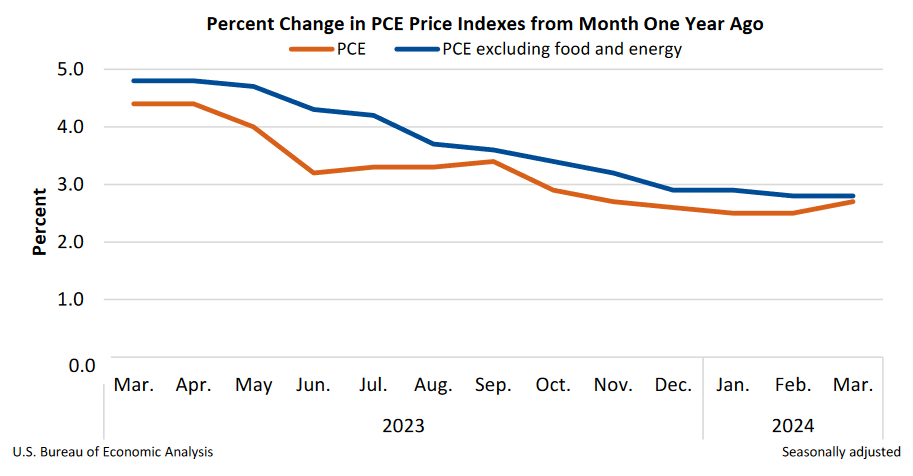
On inflation, the Fed's preferred inflation metric, the core PCE price deflator, remained steady on both a monthly and annual basis. The measure came in at 0.3% month-over-month and 2.8% annually – the same pace as in February. While the monthly change was in line with market expectations, the annual number was higher (markets expected 2.6% y/y).
The personal savings rate fell in March to 3.2% from February's 3.6% reading.
Key Implications
Today's report fills in some of the details of the headline numbers reported yesterday in the Q1 GDP advance release. Despite mounting challenges and dwindling savings, the U.S. consumer powered ahead, closing out the first quarter on solid footing. As such, real personal consumption expenditure growth was 2.5% annualized in 2024 Q1 (down from 3.3% in 2023 Q4). Most of the quarterly strength came from spending on services, despite a solid showing from goods spending in the final month of the quarter. Ultimately, with a decent handoff to Q2, consumer spending is set to remain resilience.
While both annual and core PCE inflation did not decelerate, holding steady was the next best alternative. The outturn suggests that much less of the recent hot CPI inflation readings has filtered through to the Fed's preferred metric. Not so great however was the fact that while the 6-month annualized change held steady at 3%, the 3-month annualized measure continued to trek up (from 3.7% to 4.4%) pointing to some near-term stickiness. Core services excluding housing, or supercore inflation, also suggest that near-term price pressures persists. Taken together, these developments point to the Fed continuing to exercise patience with respect to rate cuts, with markets currently betting on a first cut in the fall.
False Alert with Yen Interventions?
Even though the Bank of Japan left the key rate and parameters of the QE programme unchanged, the central bank’s inaction increased the pressure on the national currency. This resulted in USDJPY reaching 156.80 and EURJPY reaching 2007–2008 levels, which started a sharp decline due to the global financial crisis and related deleveraging.
USDJPY has already surpassed the levels where the October 2022 intervention took place and where the market reversal occurred about a year later. This begs the question of ‘when’, although the question of ‘will they’ is still relevant.
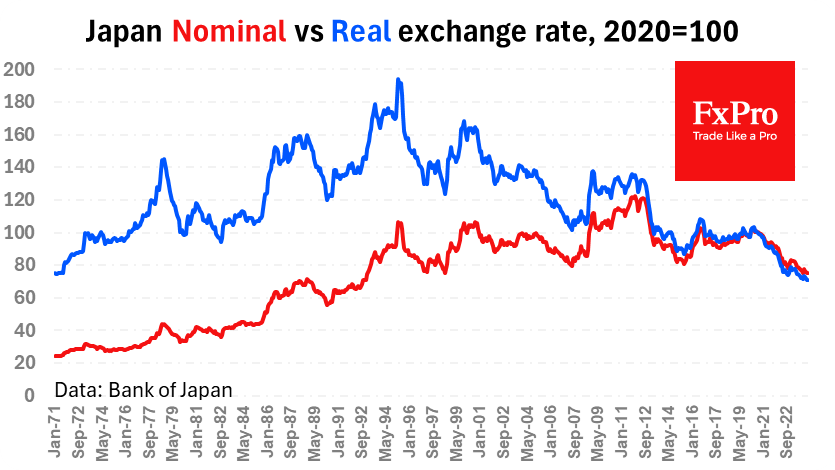
Central banks and governments do not focus on the nominal levels of individual currency pairs. They care about dynamics, as abrupt changes can cause inflation and economic shock. Therefore, it is more useful to look at the dynamics to a basket of currencies.
The nominal effective exchange rate of the yen has retreated to its lowest levels since the 1990s. The yen reversal to growth in 1997 on the back of crises in developing countries was at about the same level. The pressures of the global financial crisis in 2007 turned the yen up 5% higher. Thus, the current levels are not an anomaly, and the yen has fluctuated near these levels many times in the last 34 years.
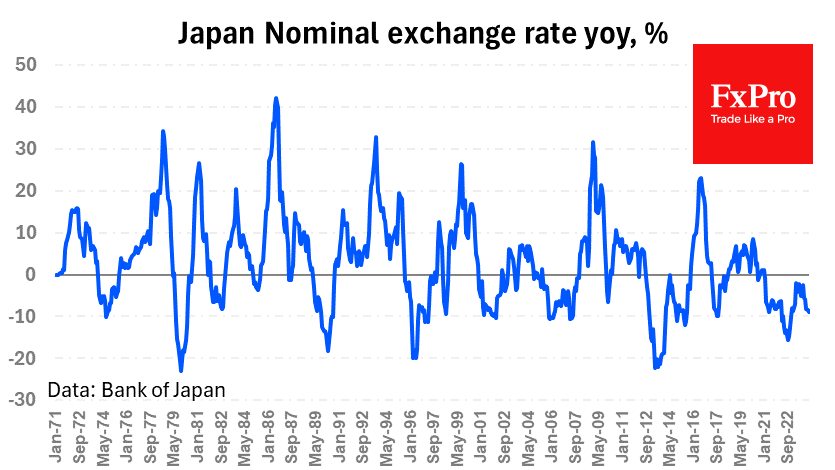
A weakening yen potentially poses risks of inflating inflation. We have noticed that the government and CB intervene in the market when year-to-year changes approach 20%. USDJPY is adding 17% y/y, EURJPY is up 13% y/y. This is quite a lot but allows the authorities not to share the passions of the financial media and traders.
Yen weakening is measured by historical standards, not allowing to talk about a currency shock for the economy.
As the nearest turning points, we can consider the area of 160 on USDJPY – the point of market reversal in April 1990. EURJPY has a similar point near 170. At these levels, intervention cannot be certain. The chance of intervention in free forex pricing will clearly increase if the yen collapses rather than slowly creeping there.
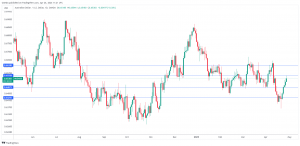
EUR/USD Mid-Day Outlook
Daily Pivots: (S1) 1.0692; (P) 1.0716; (R1) 1.0754; More...
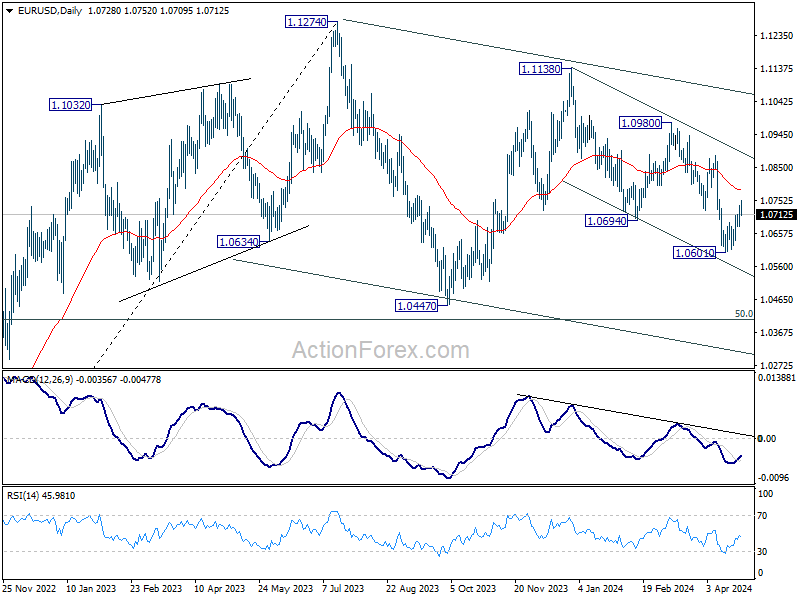
Intraday bias in EUR/USD remains mildly on the upside at this point. Rebound from 1.0601 could extend to 55 D EMA (now at 1.0784). On the downside, break of 1.0677 minor support will turn intraday bias to the downside for retesting 1.0601 low.
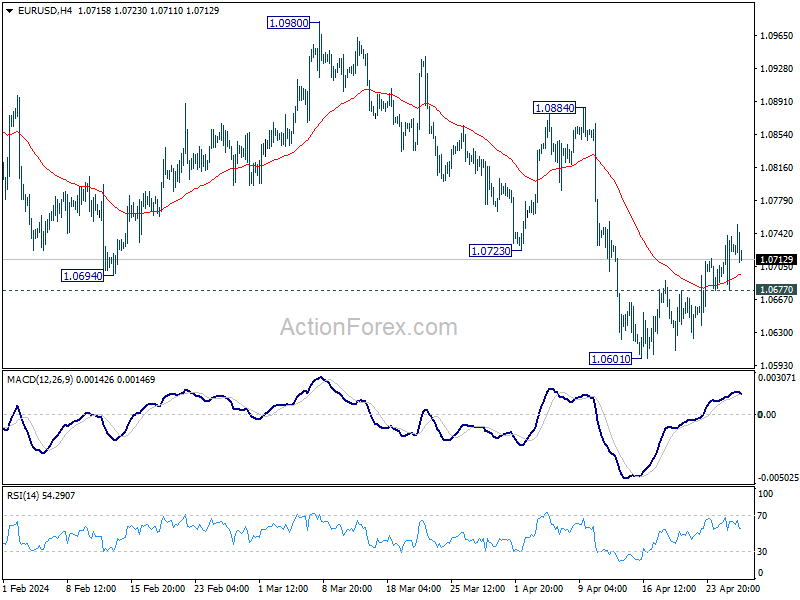
In the bigger picture, price actions from 1.1274 are viewed as a corrective pattern to rise from 0.9534 (2022 low). Current fall from 1.1138 is seen as the third leg. While deeper decline is would be seen to 1.0447 and possibly below, Strong support should emerge from 61.8% retracement of 0.9534 to 1.1274 at 1.0199 to complete the correction.
GBP/USD Mid-Day Outlook
Daily Pivots: (S1) 1.2464; (P) 1.2495; (R1) 1.2543; More...
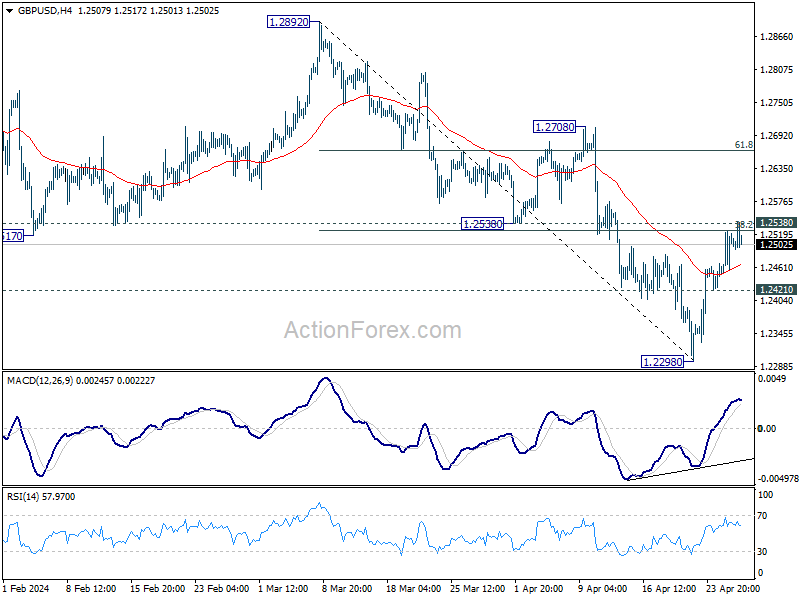
No change in GBP/USD's outlook and intraday bias stays neutral. Near term outlook stays bearish as long as 1.2538 support turned resistance holds. Break of 1.2421 minor support will argue that rebound from 1.2298 has completed and bring retest of this low. However, decisive break of 1.2538 will bring stronger rally to 55 D EMA (now at 1.2583) and above.
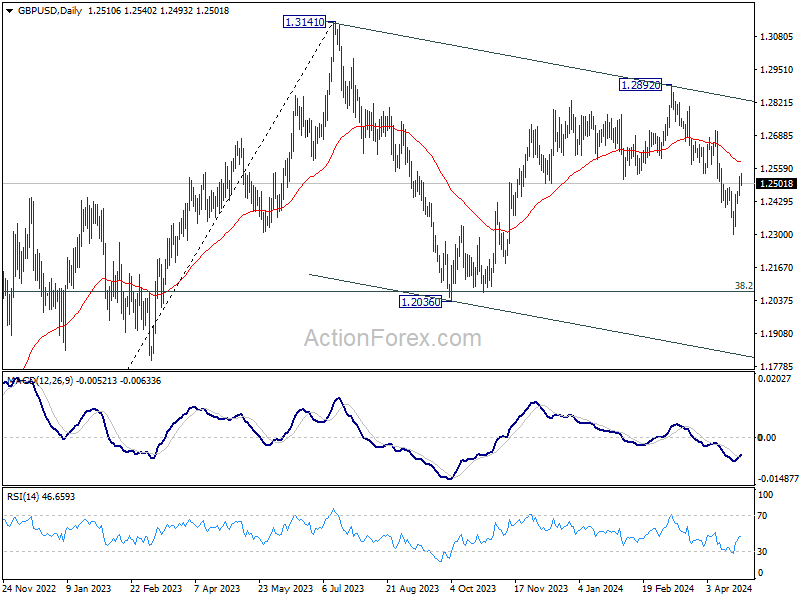
In the bigger picture, price actions from 1.3141 medium term top are seen as a corrective pattern to up trend from 1.0351 (2022 low). Fall from 1.2892 is seen as the third leg. Deeper decline would be seen to 1.2036 support and possibly below. But strong support should emerge from 61.8% retracement of 1.0351 to 1.2452 at 1.1417 to complete the correction.
USD/CHF Mid-Day Outlook
Daily Pivots: (S1) 0.9104; (P) 0.9137; (R1) 0.9155; More....
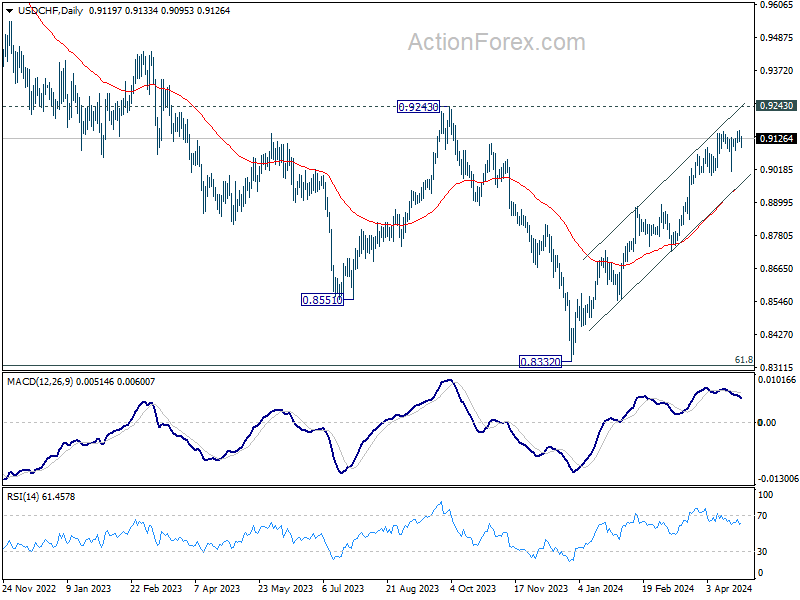
Intraday bias in USD/CHF remains neutral for the moment. On the upside, firm break of 0.9151 will resume the rally from 0.8332 and should target 0.9243 key resistance next. On the downside, break of 0.9085 will turn bias to the downside for deeper pullback.
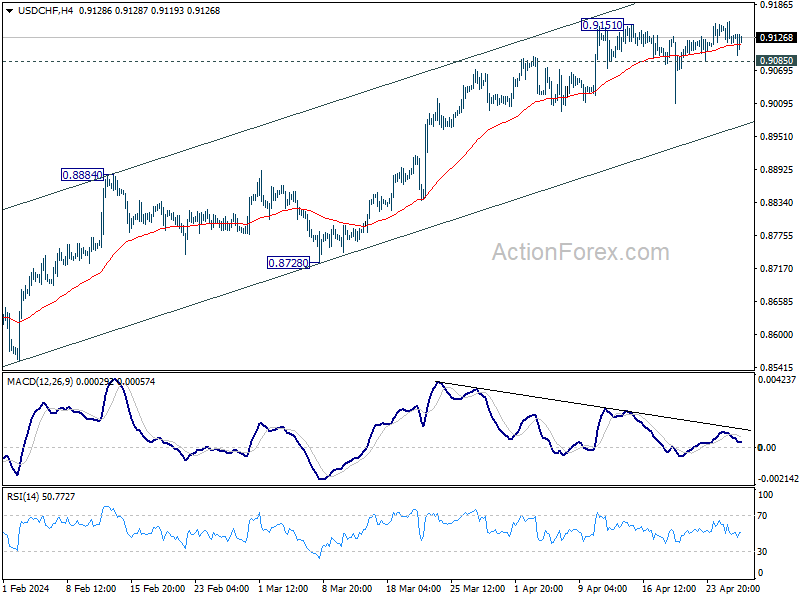
In the bigger picture, price actions from 0.8332 medium term bottom as tentatively seen as developing into a corrective pattern to the down trend from 1.0146 (2022 high). Further rise would be seen as long as 0.8728 support holds. But upside should be limited by 0.9243 resistance, at least on first attempt. However, decisive break of 0.9243 will argue that the trend has already reversed and turn medium term outlook bullish.
USD/JPY Mid-Day Outlook
Daily Pivots: (S1) 155.32; (P) 155.53; (R1) 155.87; More...
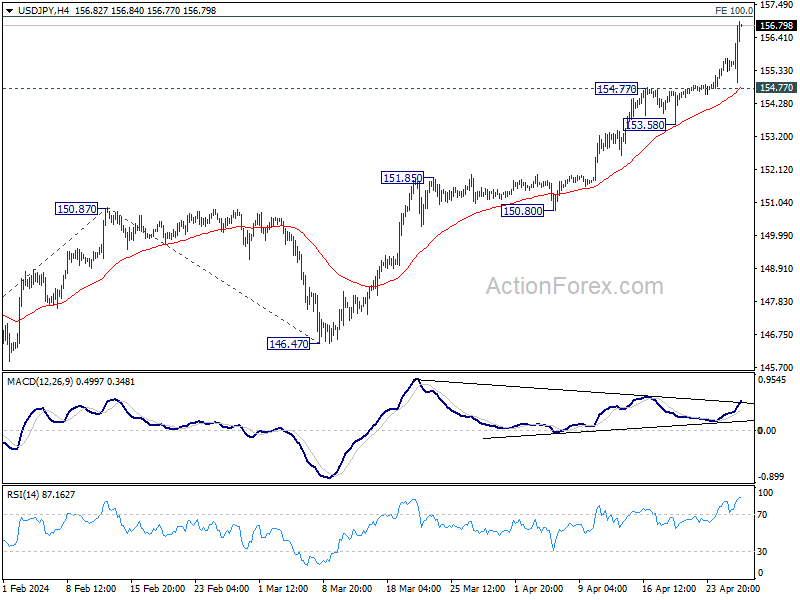
Intraday bias in USD/JPY remains on the upside for 100% projection of 140.25 to 150.87 from 146.47 at 157.09. Some resistance could be seen there to bring retreat. But further rally is expected as long as 154.77 resistance turned support holds. Sustained break of 157.09 will target 138.2% projection at 161.14 next.
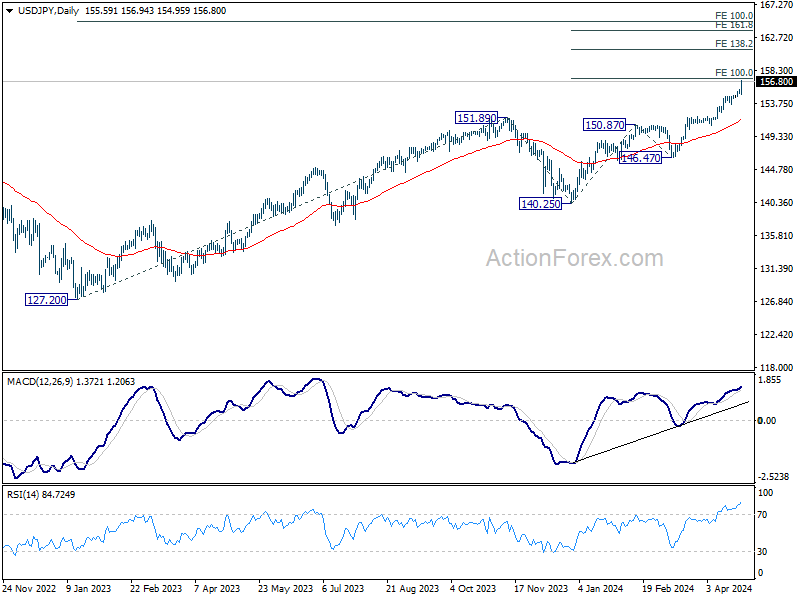
In the bigger picture, current rise from 140.25 is seen as the third leg of the up trend from 127.20 (2023 low). Next target is 100% projection of 127.20 to 151.89 from 140.25 at 164.94. Outlook will remain bullish as long as 150.87 resistance turned support holds, even in case of deep pullback.
Stronger Inflation Data Fails to Lift Dollar; Yen’s Decline Persists
Dollar remains stable in early US session despite release of another set of persistently high inflation figures. The strong rebound in DOW futures suggest that investors are somewhat relieved to see no disastrous surge in inflation rates. Additionally, robust spending growth appears set to continue bolstering the US economy, even as Fed is set to maintain higher interest rates for an for much longer.
Attention is turning back to Japanese Yen for the last hours of the week, which continues its steep decline. During his post-meeting press conference, BoJ Governor Kazuo Ueda provided little support to stabilize Yen. Ueda mentioned that the central bank would consider raising interest rates if new data supports its latest price forecasts or if inflation exceeds expectations. However, he did not specify any clear timing for rate adjustments. Furthermore, Ueda dismissed the possibility of a comprehensive reduction in bond purchases at this stage.
Regarding the exchange rate, Ueda remarked that the current weakness of the Yen has not significantly impacted the core inflation rates yet. He also noted that weak Yen could have some positive effects on demand which might influence core inflation in the medium to long term. The lack of heightened concern seems to indicate that it's not time for Japan to intervene yet.
The weekly performance chart hasn't changed too much. Yen is staying as the worst performer, followed by Swiss Franc and then Dollar. Aussie is the best, followed by Sterling, and then Kiwi. Euro and Canadian are positioning in the middle.
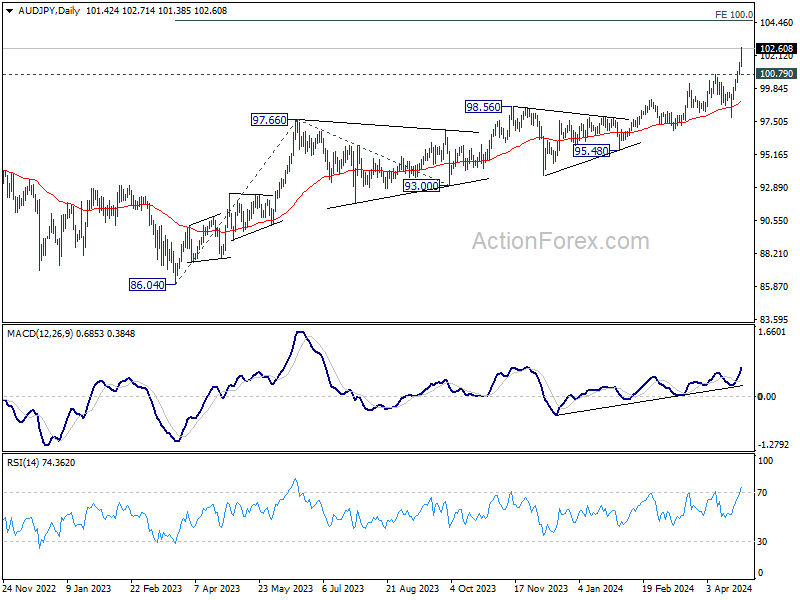
Technically, AUD/JPY is currently the top gainer for the day and the week. Further rally is expected as long as 100.79 resistance turned support holds. Next target is 100% projection of 86.04 to 97.66 from 93.00 at 104.62
In Europe, at the time of writing, FTSE is up 0.56%. DAX is up 0.90%. CAC is up 0.57%. UK 10-year yield is down -0.024 at 4.347. Germany 10-year yield is down -0.034 at 2.600. Earlier in Asia, Nikkei rose 0.81%%. Hong Kong HSI rose 2.12%. China Shanghai SSE rose 1.17%. Singapore Strait Times fell -0.23%. Japan 10-year JGB yield surged 0.0304 to 0.928.
US PCE inflation rises to 2.7% yoy in Mar, core PCE steady at 2.8% yoy
US personal income rose 0.5% mom or USD 122.0B in March, matched expectations. Personal spending rose 0.8% mom or USD 160.9B, above expectation of 0.6% mom.
Both headline and core PCE price index rose 0.3% mom, matched expectations. Prices for services increased 0.4% mom and prices for goods increased 0.1% mom. Food prices decreased less than -0.1% mom and energy prices increased 1.2% mom.
Over the 12-month period, headline PCE accelerated from 2.5% yoy to 2.7% yoy, above expectation of 2.6% yoy. Core PCE price index was unchanged at 2.8% yoy, above expectation of 2.6% yoy. Prices for services increased 4.0% yoy and prices for goods increased 0.1% yoy. Food prices increased 1.5% yoy and energy prices increased 2.6% yoy.
SNB's Jordan: New shocks can occur any time
Speaking at SNB's annual shareholder meeting, President Thomas Jordan highlighted the achievement in lowering inflation to below 2%, a milestone that enabled the bank to implement a rate cut last month.
Despite this progress, Jordan emphasized the continuing high levels of uncertainty in the global economic environment, acknowledging the potential for new shocks at any time.
"In the current environment, uncertainty remains elevated, and new shocks can occur at any time," he noted. "We will therefore monitor the ongoing development of inflation closely and adjust our monetary policy again if necessary."
BoJ stands pat, lower growth and higher inflation this year
BoJ left overnight call rate unchanged at 0-0.10% as widely expected, by unanimous vote. The BOJ says it will continue its Japanese government bond (JGB) purchases "in accordance with the decisions made at the March 2024 monetary policy meeting."
Real GDP growth forecasts for fiscal 2024 was lowered sharply to 0.8%. But growth is expected to pick up moderately to 1.0% subsequently. CPI core forecasts was fiscal 2024 was raised to 2.8% and then slowed to 1.9% onwards. CPI core- core forecasts were left unchanged for both fiscal 2024 and 2025 at 1.9%. Fiscal 2026 CPI core-core is projected to pick up to 2.1%, which is a positive sign.
Real GDP growth forecasts:
- Fiscal 2024 at 0.8% (downgraded from 1.2%).
- Fiscal 2025 at 1.0% (unchanged).
- Fiscal 2026 at 1.0% (new).
CPI core forecasts:
- Fiscal 2024 at 2.8% (upgraded from 2.4%).
- Fiscal 2025 at 1.9% (upgraded from 1.8%).
- Fiscal 2026 at 1.9% (new).
CPI core-core forecasts:
- Fiscal 2024 at 1.9% (unchanged).
- Fiscal 2025 at 1.9% (unchanged).
- Fiscal 2026 at 2.1% (new).
Japan's Tokyo CPI falls sharply to 1.6% yoy in Apr, vs exp 2.2% yoy
Japan's Tokyo CPI showed significant slowdown in April. CPI core (excluding food) dropped from 2.4% yoy to 1.6%, substantially below the expected 2.2% yoy.
CPI core-core, which excludes both food and energy, also slowed from 2.9% yoy to 1.8% yoy, marking the slowest pace since September 2022.
Services inflation, a significant component of the CPI, decreased from 2.7% yoy to 1.6% yoy. This notable drop is largely attributed to policy interventions by the Tokyo metropolitan government to make some educational tuition free.
Overall headline CPI, which includes all items, also fell from 2.6% yoy to 1.8% yoy.
USD/JPY Mid-Day Outlook
Daily Pivots: (S1) 155.32; (P) 155.53; (R1) 155.87; More...
Intraday bias in USD/JPY remains on the upside for 100% projection of 140.25 to 150.87 from 146.47 at 157.09. Some resistance could be seen there to bring retreat. But further rally is expected as long as 154.77 resistance turned support holds. Sustained break of 157.09 will target 138.2% projection at 161.14 next.
In the bigger picture, current rise from 140.25 is seen as the third leg of the up trend from 127.20 (2023 low). Next target is 100% projection of 127.20 to 151.89 from 140.25 at 164.94. Outlook will remain bullish as long as 150.87 resistance turned support holds, even in case of deep pullback.
Economic Indicators Update
| GMT | Ccy | Events | Actual | Forecast | Previous | Revised |
|---|---|---|---|---|---|---|
| 23:01 | GBP | GfK Consumer Confidence Apr | -19 | -20 | -21 | |
| 23:30 | JPY | Tokyo CPI Y/Y Apr | 1.80% | 2.60% | ||
| 23:30 | JPY | Tokyo CPI ex Fresh Food Y/Y Apr | 1.60% | 2.20% | 2.40% | |
| 23:30 | JPY | Tokyo CPI ex Food & Energy Y/Y Apr | 1.80% | 2.90% | ||
| 01:30 | AUD | Import Price Index Q/Q Q1 | -1.80% | 0.10% | 1.10% | |
| 01:30 | AUD | PPI Q/Q Q1 | 0.90% | 0.90% | ||
| 01:30 | AUD | PPI Y/Y Q1 | 4.30% | 4.10% | ||
| 03:22 | JPY | BoJ Interest Rate Decision | 0.10% | 0.10% | 0.10% | |
| 08:00 | EUR | Eurozone M3 Money Supply Y/Y Mar | 0.90% | 0.50% | 0.40% | |
| 12:30 | USD | Personal Income M/M Mar | 0.50% | 0.50% | 0.30% | |
| 12:30 | USD | Personal Spending Mar | 0.80% | 0.60% | 0.80% | |
| 12:30 | USD | PCE Price Index M/M Mar | 0.30% | 0.30% | 0.30% | |
| 12:30 | USD | PCE Price Index Y/Y Mar | 2.70% | 2.60% | 2.50% | |
| 12:30 | USD | Core PCE Price Index M/M Mar | 0.30% | 0.30% | 0.30% | |
| 12:30 | USD | Core PCE Price Index Y/Y Mar | 2.80% | 2.60% | 2.80% | |
| 14:00 | USD | Michigan Consumer Sentiment Index Apr F | 77.9 | 77.9 |
Australian Dollar Extends Gains as PPI Surges
The Australian dollar has posted four straight winning sessions this week and is in positive territory on Friday. In the European session, AUD/USD is trading at 0.6534, up 0.24%. The Aussie has powered higher this week, climbing 1.82%.
Australia’s PPI blows past estimate
Australia’s Producer Prices index jumped 4.3% y/y in the first quarter, up from 4.1% in Q4 2023 and crushing the market estimate of 2.6%. Quarterly, PPI was unchanged at 0.6%, above the market estimate of 0.6%.
The unexpectedly strong PPI release follows the first-quarter CPI report, in which annual CPI dropped in April from 4.1% to 3.6% but was higher than the market estimate of 3.4%. Producers are likely to pass on their higher costs to consumers, which will boost consumer inflation.
The Australian dollar has posted sharp gains this week thanks to the hotter-than-expected CPI and PPI releases. The Reserve Bank of Australia could respond by prolonging its “higher for longer” stance, which would likely dampen consumer spending. We could even see talk of an RBA rate hike, as policy makers remain concerned about a rebound in inflation. The battle with inflation isn’t over, as the final stretch to the 2% target is proving to be difficult, as the Federal Reserve experience has shown.
The week wraps up with the US Core PCE Price Index, which is the Federal Reserve’s preferred inflation gauge. The index is expected to ease to 2.6% y/y in April, down from 2.8% in May. On a monthly basis, the index is expected to remain unchanged at 0.3%. Consumer inflation has been rising in the US, forcing the Fed to delay plans to cut lower rates.
AUD/USD Technical
- AUD/USD is putting pressure on resistance at 0.6555.
- Above, there is pressure at 0.6618.
- 0.6487 and 0.6424 are the next support levels
US PCE inflation rises to 2.7% yoy in Mar, core PCE steady at 2.8% yoy
US personal income rose 0.5% mom or USD 122.0B in March, matched expectations. Personal spending rose 0.8% mom or USD 160.9B, above expectation of 0.6% mom.
Both headline and core PCE price index rose 0.3% mom, matched expectations. Prices for services increased 0.4% mom and prices for goods increased 0.1% mom. Food prices decreased less than -0.1% mom and energy prices increased 1.2% mom.
Over the 12-month period, headline PCE accelerated from 2.5% yoy to 2.7% yoy, above expectation of 2.6% yoy. Core PCE price index was unchanged at 2.8% yoy, above expectation of 2.6% yoy. Prices for services increased 4.0% yoy and prices for goods increased 0.1% yoy. Food prices increased 1.5% yoy and energy prices increased 2.6% yoy.
Gold Price Recovers Amid Uncertain US Economic Outlook
The price of a troy ounce of gold climbed to 2330.00 USD on Friday. This surge was driven by investors' ongoing evaluation of the potential direction of the US Federal Reserve's monetary policy following mixed macroeconomic data.
The US GDP for Q1 did not meet expectations, marking the slowest recovery in two years. The economy expanded by only 1.6%, significantly lower than the forecasted 2.5%. In contrast, GDP growth in Q4 2023 reached 3.4%. The Fed's consensus forecast for 2024 expects economic growth of 2.1%.
The underwhelming economic performance might prompt the Fed to consider a reduction in interest rates. However, a localised acceleration in consumer inflation suggests that monetary policy might remain restrictive for longer.
As long as interest rates remain high, gold's appeal as an investment option is somewhat diminished since it does not generate its yield as bonds do. Nonetheless, in times of rising inflation, gold increasingly becomes a valuable hedge against currency devaluation.
Today, the stock exchange will focus on the March Core PCE figures. These data are expected to provide further insights into the Federal Reserve's monetary policy outlook.
Technical analysis of XAU/USD
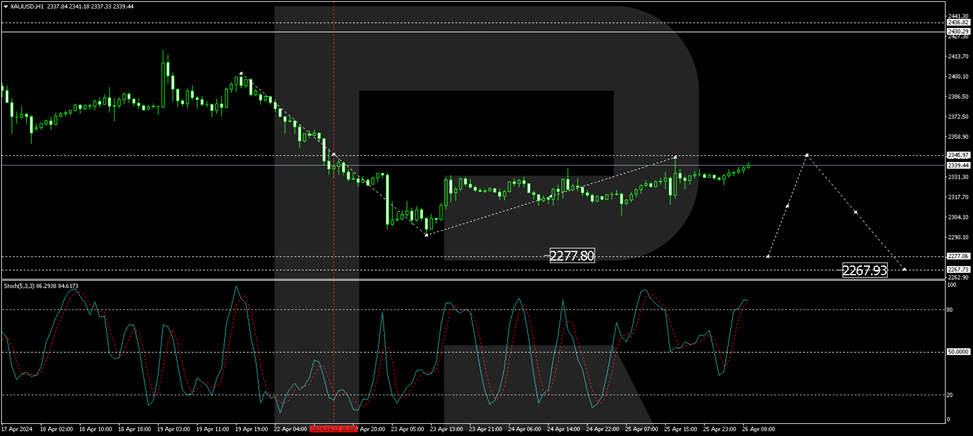
On the H4 chart of XAU/USD, a consolidation range has formed above 2346.00, with the ongoing development of the third wave of decline aiming for 2262.22. The local target for this wave at 2296.96 has been reached. Today, a corrective move towards 2346.00 is expected, followed by an anticipated further decline to 2262.22. This bearish scenario is supported technically by the MACD indicator, whose signal line is below zero and is trending downwards towards new lows.
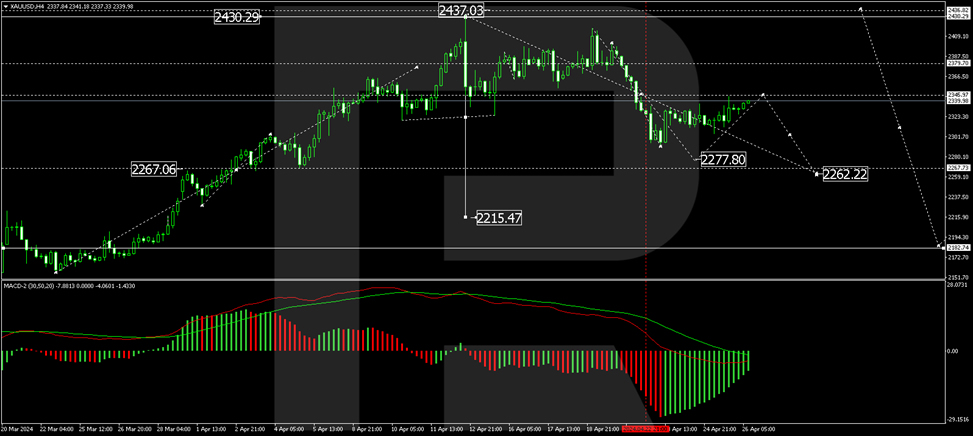
On the H1 chart, the corrective movement towards 2346.00 (testing from below) is continuing. Once completed, a new downward wave towards 2277.00 is expected, potentially reaching 2262.22. This outlook is confirmed by the Stochastic oscillator, with its signal line currently above 80 but poised for a decline towards 20.