Sample Category Title
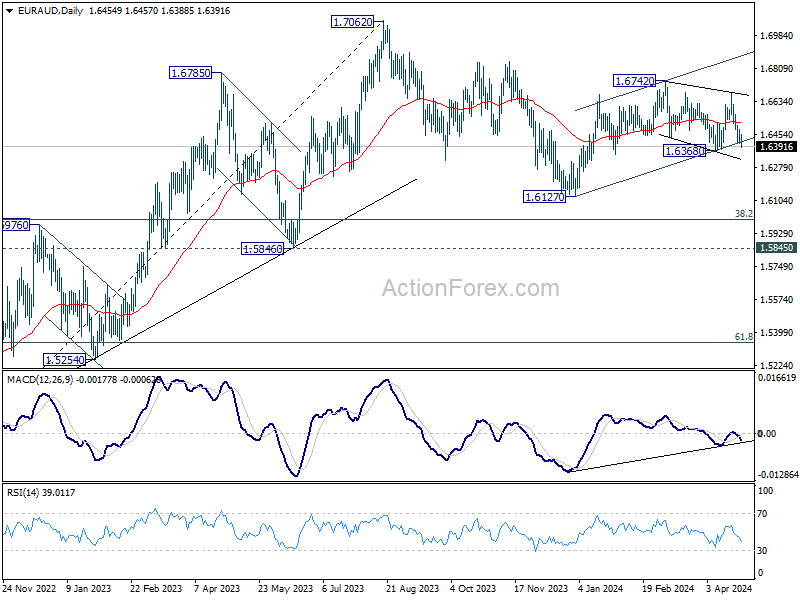
EUR/AUD Daily Outlook
Daily Pivots: (S1) 1.6419; (P) 1.6453; (R1) 1.6495; More...
Intraday bias in EUR/AUD remains neutral first. On the downside, firm break of 1.6368 support will revive that case that rebound from 1.6127 has completed at 1.6742. Fall from there is seen as the third leg of the pattern from 1.7062. Deeper decline would then be seen to 1.6127 support and below.
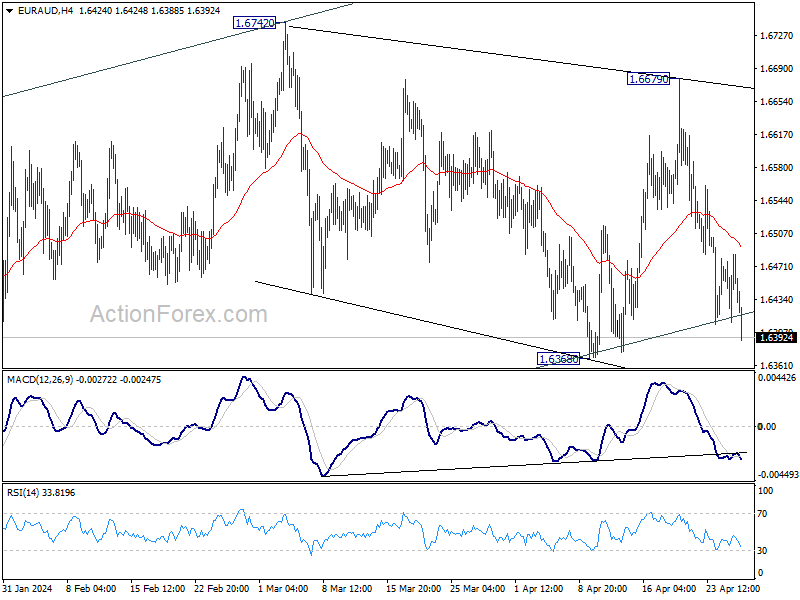
In the bigger picture, fall from 1.7062 medium term top is seen as a correction to the up trend from 1.4281 (2022 low). In case of another fall, strong support is expected around 1.5846 and 38.2% retracement of 1.4281 to 1.7062 at 1.6000 to bring rebound. Break of 1.7062 is in favor as a later stage.
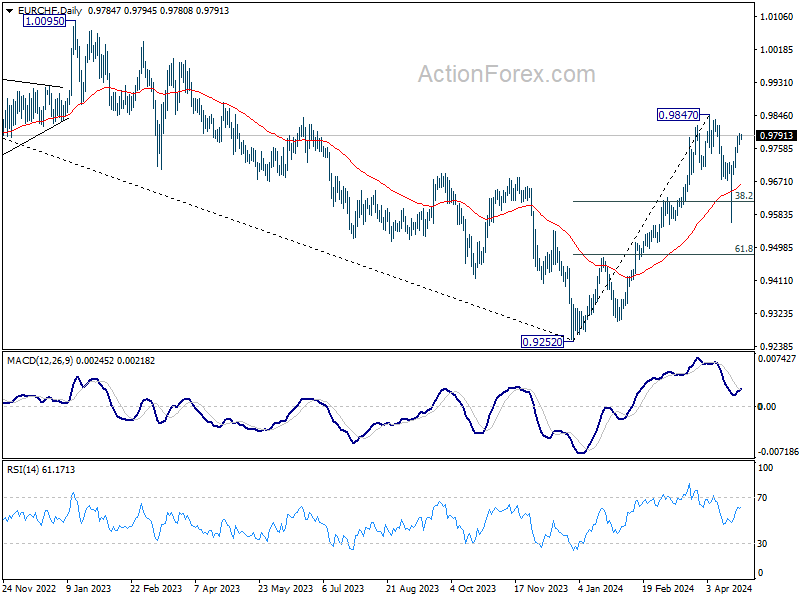
EUR/CHF Daily Outlook
Daily Pivots: (S1) 0.9773; (P) 0.9786; (R1) 0.9801; More...
Intraday bias in EUR/CHF stays mildly on the upside at this point. Rise from 0.9563 would target a retest on 0.9847. Decisive break there will resume larger rally from 0.9252 high. On the downside, below 0.9708 minor support will turn intraday bias to the downside for another leg of the corrective pattern from 0.9847.
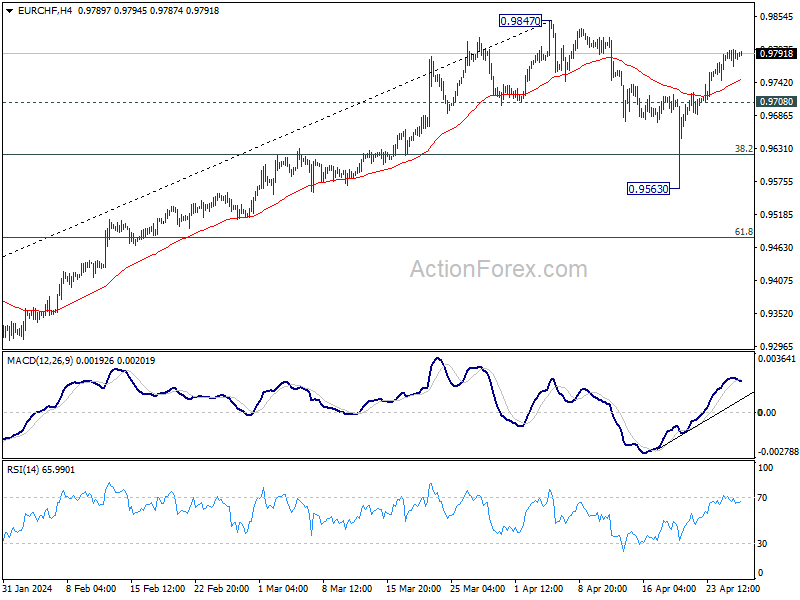
In the bigger picture, while 55 D EMA (now at 0.9655) was breached, EUR/CHF rebounded strongly since then. Rise from 0.9252 medium term bottom should still be in progress. Break of 0.9847 will target 38.2% retracement of 1.2004 (2018 high) to 0.9252 (2023 low) at 1.0303, even as a correction to the down trend from 1.2004. however, sustained trading below 55 D EMA will argue that the rebound has completed.
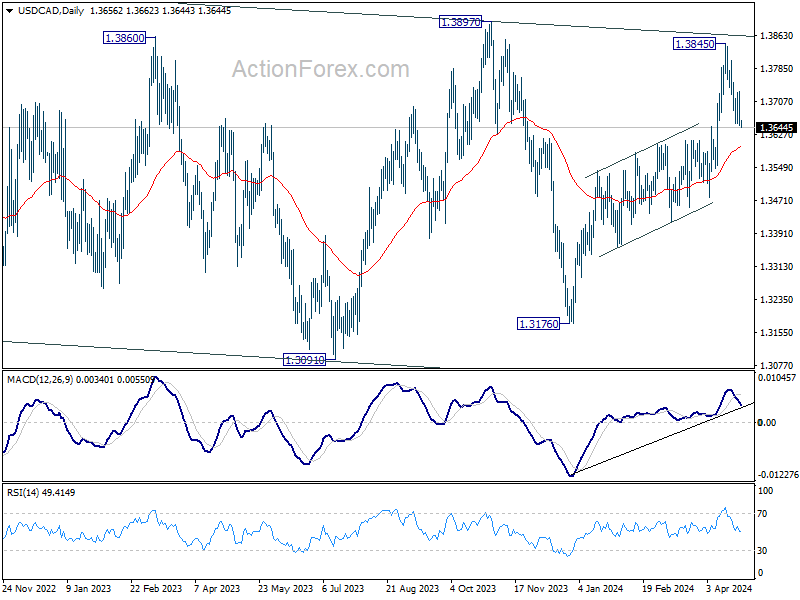
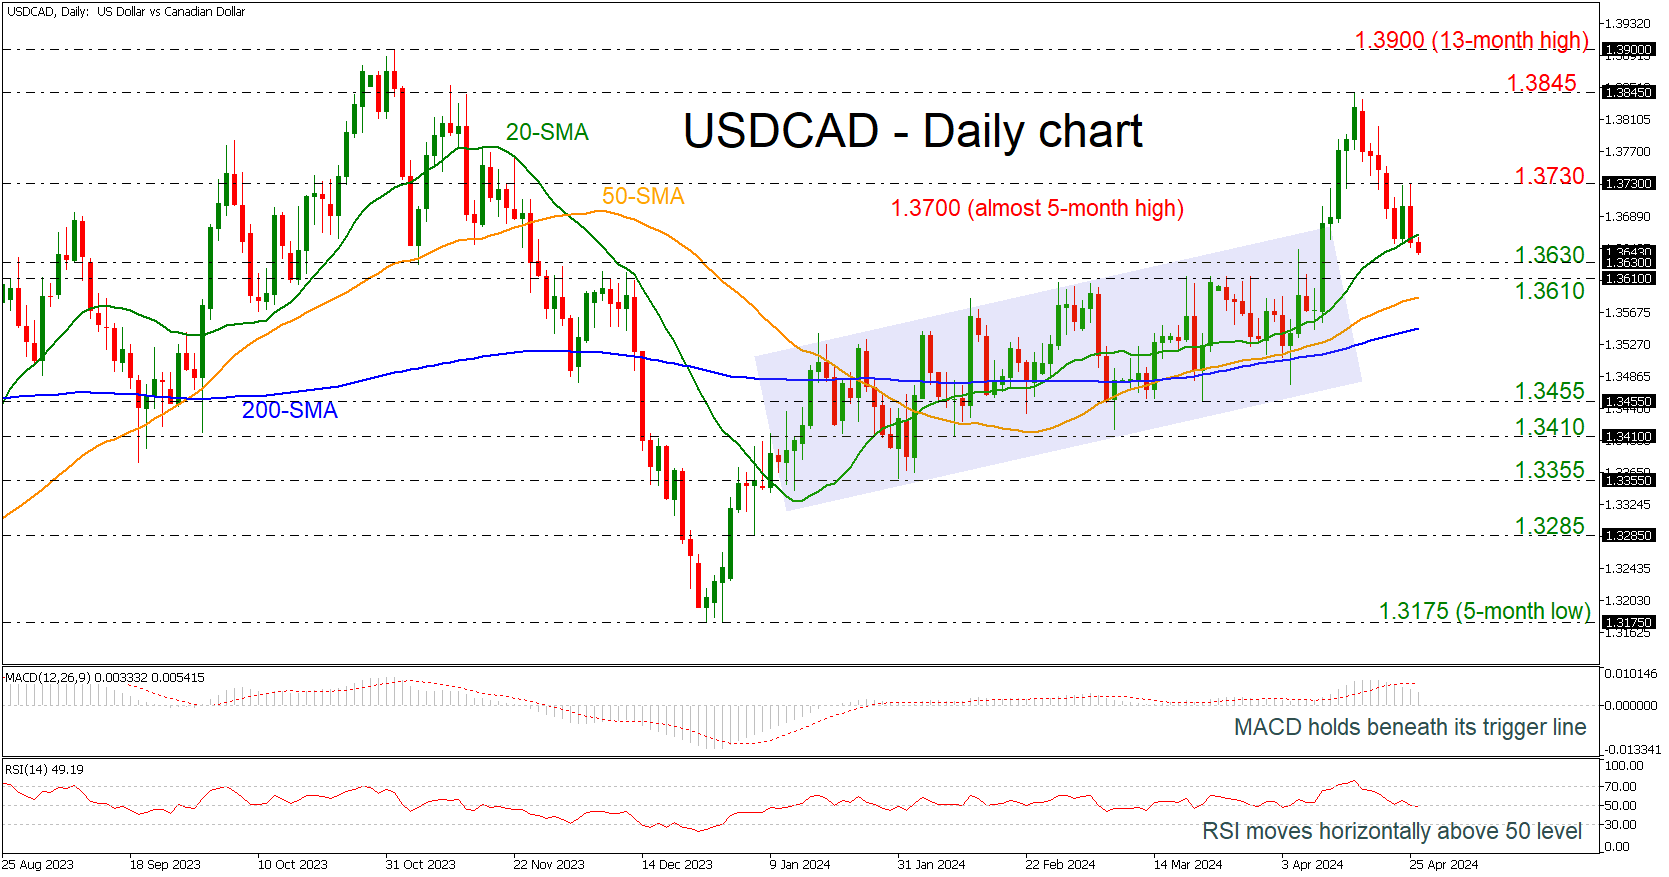
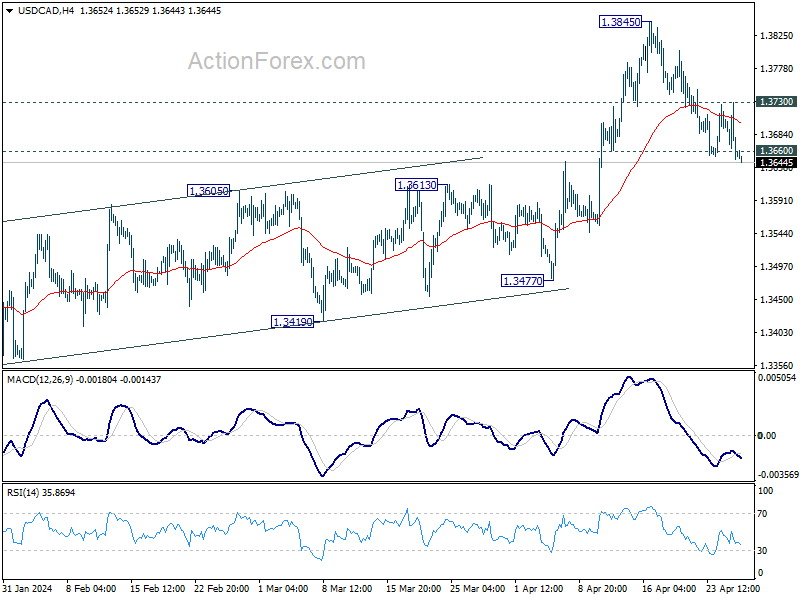
USDCAD Retreats Beneath 20-day SMA
- USDCAD is in bearish correction mode
- MACD and RSI suggest weak momentum
USDCAD is heading south erasing the rally towards the 1.3845 peak, slipping beneath the 20-day simple moving average (SMA). However, the broader outlook remains positive as the price is posting higher highs and higher lows above the 200-day SMA.
Technically, the MACD oscillator is holding beneath its trigger line in the positive area, while the RSI is moving horizontally near the neutral threshold of 50.
If the market continues to dive further, immediate support could come from the 1.3610-1.3630 restrictive region before plunging to the 50-day SMA currently at 1.3585. Even lower, the 200-day SMA at 1.3550 may act as a turning point for traders.
Alternatively, an earlier rebound around the 1.3630 support may send the pair higher towards the 1.3730 resistance. If the bullish efforts are successful, the price may advance towards the previous top of 1.3845 with the 1.3900 round number being the next destination.
In brief, USDCAD has been in a downside correction over the last ten days and any declines below the 200-day SMA may switch the longer-term picture to neutral.
US Yields Reached New YTD Highs Across the Curve
Markets
US yields reached new YTD highs across the curve following Q1 US GDP data. The 1.6% Q/Qa headline print missed consensus by quite a margin (2.5% Q/Qa), but details showed underlying strength in consumption and investments. The biggest drag came from net exports with imports rising faster than exports, which we consider a sign of resilient demand. Inventories also weighed on growth in another hint of firm domestic demand. Final sales to domestic purchasers grew at a much stronger 2.8% pace. Higher spending on services was partly offset by a decrease in goods. Quarterly PCE price gauges flanked the GDP number with the core PCE accelerating more than expected, from 2% Q/Qa to 3.7% Q/Qa and matching the fastest pace since Q1 of last year. The PCE figures strengthen the view coming from CPI reports that inflation is reaccelerating away from the (never-reached) 2% inflation target. They warrant the current higher for longer market positioning which we expect to be cemented at next week’s FOMC meeting. Another very low weekly jobless claims figure and stronger pending home sales offered US Treasuries no way back. Daily changes on the US yield curve ranged between +4.1 bps (30-yr) and +7.1 bps (2-yr) yesterday. The 2-yr yield closed at 4.9975%. We stick to the view that it will take anticipation on rate hikes instead of cuts to push this tenor above this psychologic mark. Therefore we think that the long end of the curve remains most vulnerable. German Bunds followed US Treasuries south in the aftermath of the GDP/PCE. German yields rose by 2.8 bps (30-yr) to 5.2 bps (3-yr). The German 2-yr yield closed above 3% for the first time since November of last year. The 10-yr yield broke through 2.6% resistance (62% retracement on Q4 decline) giving the technical thumbs up for a full return to last year’s 3.02% high. Market correlation between Fed delaying rate cuts and the ECB holding rates after a flagged 25 bps cut in June is high. Especially since latest European confidence indicators hint at green shoots following last year’s standstill. The dollar clawed back immediately after the data (EUR/USD 1.0720 to 1.0680) but failed to hold on to these gains with the pair eventually closing at 1.0725. Stock markets offer part of the explanation with Nasdaq for example able to limit an opening loss of 2.25% (!) to only 0.5% in the close. Today’s eco calendar contains US income and spending data and March PCE deflators. Those shouldn’t come as a surprise after yesterday. We expect bonds to remain under pressure going into a data-heavy week with EMU CPI’s, US ISM’s, ADP, payrolls and FOMC meeting.
News & Views
The Bank of Japan kept its target policy rate unchanged at 0-0.1% and will continue to buy bonds in line with the guidance it gave in March. In its quarterly economic update, the BoJ projects inflation (CPI ex. fresh food) in the range of 2.5-3% for fiscal 2024 and at around 2% for fiscal 2025 and 2026. Underlying CPI inflation is expected to increase gradually, since it is projected that the output gap will improve and as medium- to long-term inflation expectations will rise with a virtuous cycle between wages and prices continuing to intensify. This will keep inflation at a level consistent with the inflation target also in the later part of the projection period. The BoJ didn’t give any concrete guidance on the time for further rate hikes but governor Ueda still gives a press conference later today. The lack of policy engagements this morning results in a further decline of the yen with USD/JPY touching a new 34-year top north of USD/JPY 156. Markets are now again looking at the Ministry of Finance for potential interventions to stop a too fast decline of the currency. Aside from the BoJ meeting, Tokyo April CPI data decelerated sharply (ex fresh food from 2.4% from 1.6%). However, the data were distorted due to the start of education subsidies, which also makes the link less tight with the national data that will be published later.
UK consumer confidence (GfK) improved further in April from -21 to -19, matching the best level since early 2022.. Consumers are turning more confident on their personal finances, on the economic situation (last and next 12 months) and climate for major purchases. The improvement was supported by “the impact on household budgets of lower inflation and the anticipation of further tax cuts”. It is in line with other recent survey evidence, also from the corporate sector, that the UK is likely moving toward better growth going forward.
Graphs
GE 10y yield
ECB President Lagarde clearly hinted at a summer (June?) rate cut and seems to have broad backing. EMU disinflation will continue in April and bring headline CPI (temporary) at/below the 2% target. Together with weak growth momentum, this gives backing to deliver a first 25 bps rate cut. A more bumpy inflation path in H2 2024 and the Fed’s higher for longer strategy make follow-up moves difficult. Markets come to terms with that, pushing yields up.
US 10y yield
The March dot plot contained several hawkish elements including a symbolically higher neutral rate. In our view they set the stage for a later (September at the earliest, likely December) start of a possibly shallower cutting cycle. Upcoming CPI readings (through base effects) and resilient eco data should confirm this. US yields continue their uptrend across the maturity spectrum, setting fresh YTD highs.
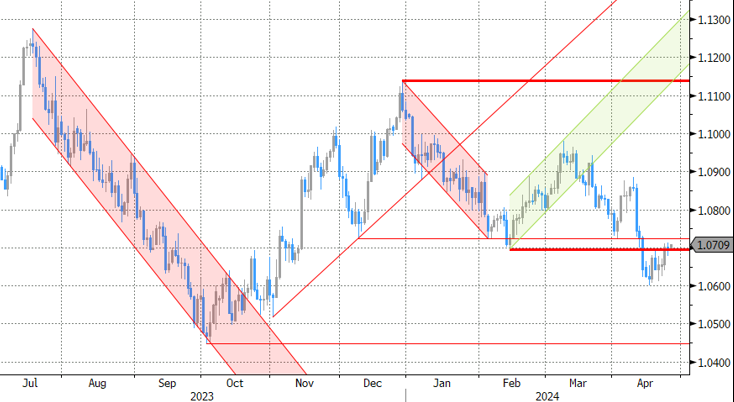
EUR/USD
Economic divergence (US > EMU) and a likely desynchronized rate cut cycle with the ECB exceptionally taking the lead pulled EUR/USD towards the YTD low at 1.0695. Stronger-than-expected US March inflation figures forced a technical break, opening the path to last year’s low at 1.0494.
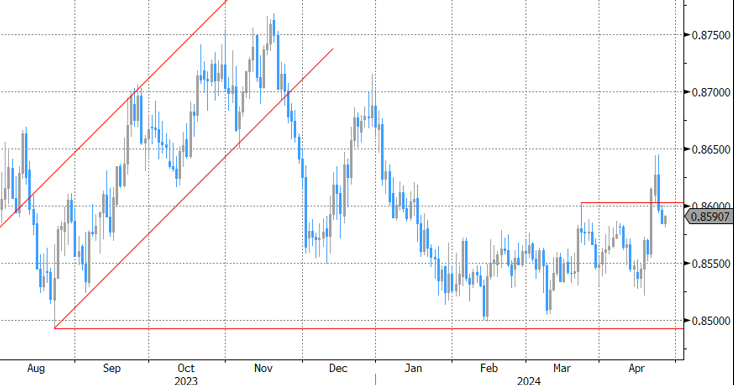
EUR/GBP
Debate at the Bank of England is focused at the timing of rate cuts. Most BoE members align with the ECB rather than with Fed view, suggesting that the disinflation process provides a window of opportunity to make policy less restrictive (in the near term). Sterling’s downside turned more vulnerable with the topside of the sideways EUR/GBP 0.8493 - 0.8768 trading range serving as the first real technical reference.
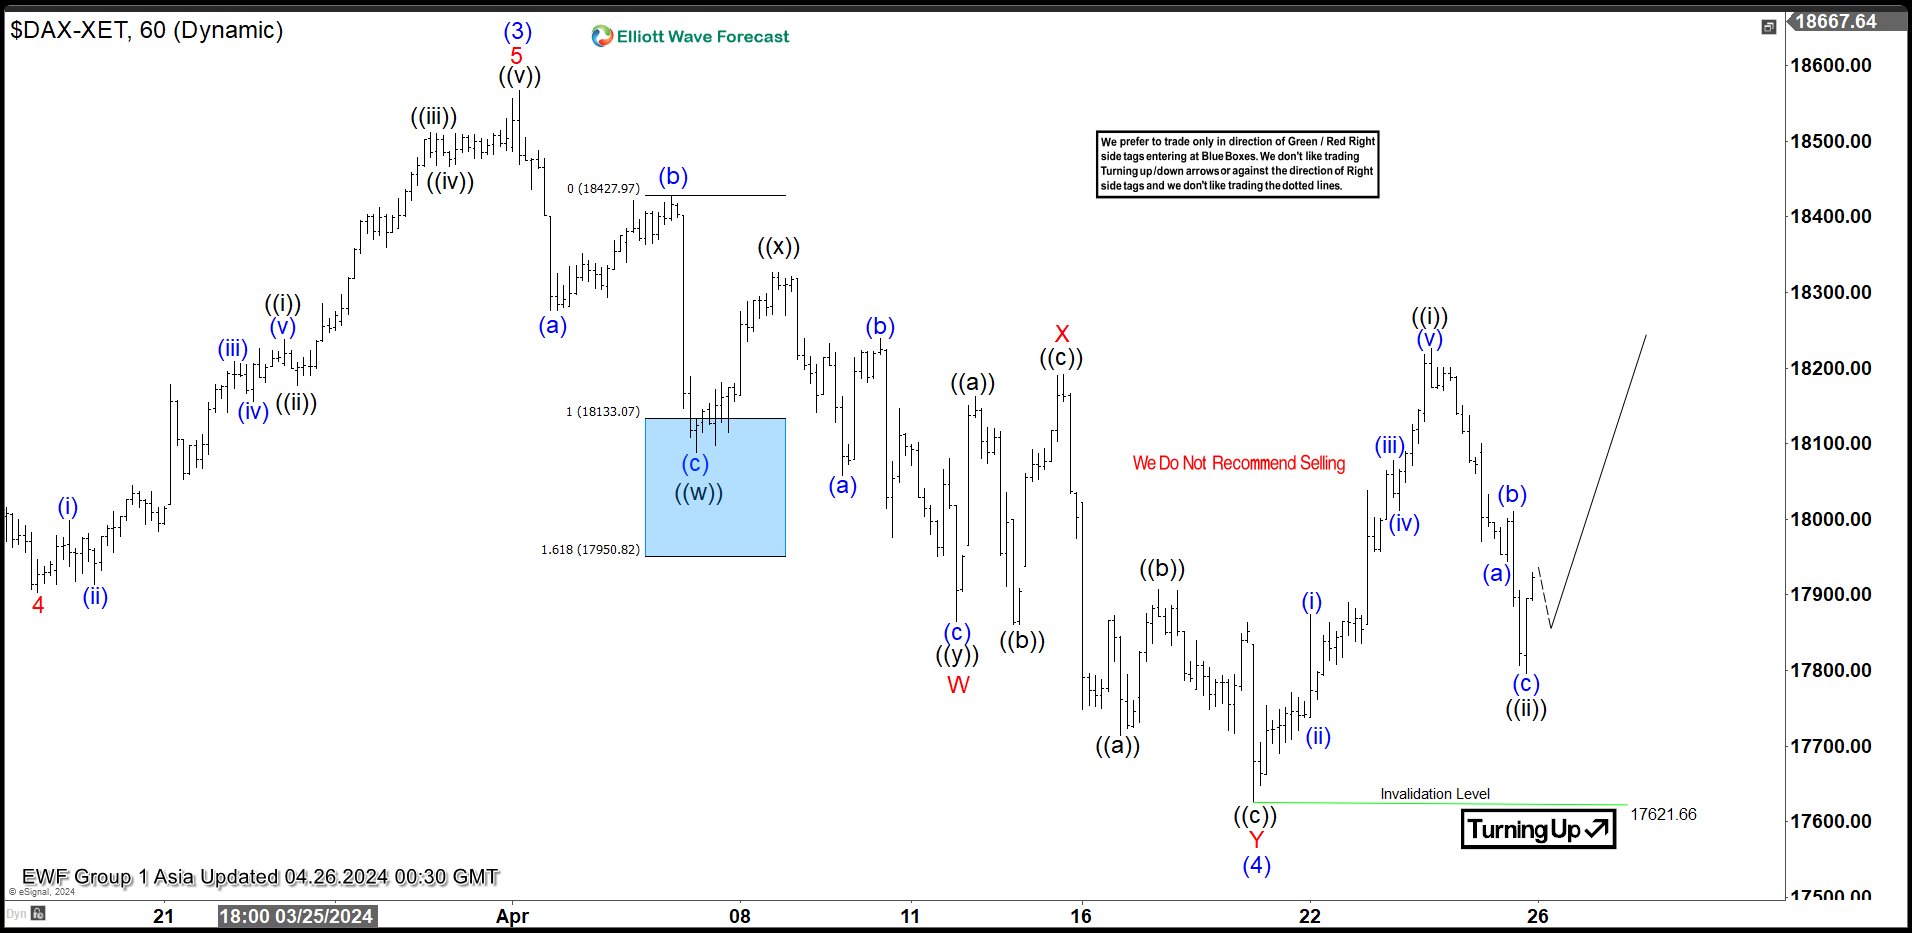
Elliott Wave Analysis Favors DAX to Extend Higher
Short Term Elliott Wave View on DAX suggests rally from 10.23.2023 low is unfolding as a 5 waves impulse. Up from 10.23.2023 low, wave (1) ended at 17003.28 and dips in wave (2) ended at 16345.02. The Index extended higher in wave (3) towards 18567.16 as the 1 hour chart below shows. Down from there, wave (4) unfolded as a double three Elliott Wave structure. Down from wave (3), wave ((w)) ended at 18088.03 and wave ((x)) ended at 18326.37. Wave ((y)) lower ended at 17864.69 which completed wave W in higher degree. Wave X rally ended at 18191.95 with internal subdivision as expanded flat.
The Index then extended lower in wave Y towards 17621.66 which completed wave (4). The Index has turned higher in wave (5). Up from wave (4), wave (i) ended at 17873.58 and wave (ii) pullback ended at 17738.04. the Index extended higher in wave (iii) towards 18078.1 and pullback in wave (iv) ended at 18011. Last leg wave (v) ended at 18226.32 which completed wave ((i)). Pullback in wave ((ii)) ended at 17795.96 as a zigzag. Near term, as far as pivot at 17621.6 low stays intact, expect the Index to extend higher.
DAX 60 Minutes Elliott Wave Chart
DAX Elliott Wave Video
https://www.youtube.com/watch?v=EDM9-T1sr3U
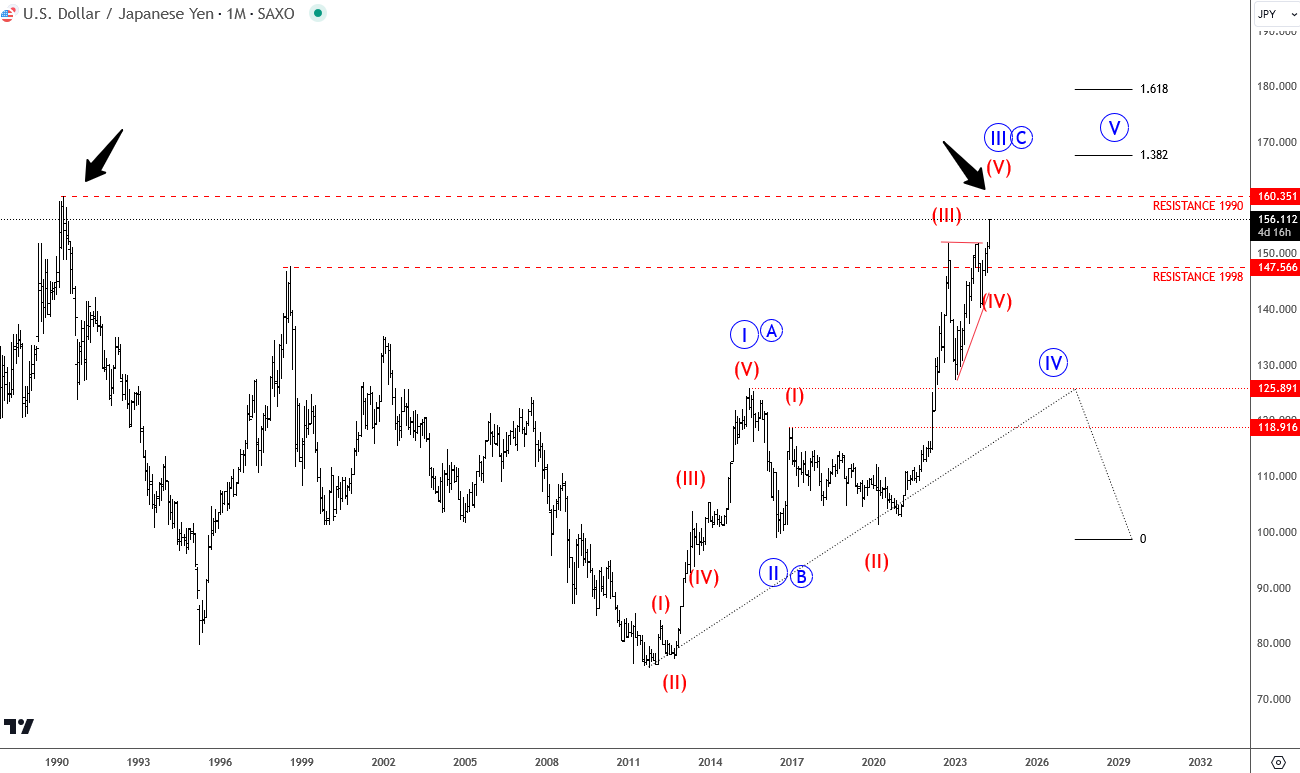
USD/JPY Remains Bullish After BoJ Stays on Hold
Japan FinMin Suzuki: Will Deal With Forex Appropriately But Declines To Say Whether Forex Moves Are Excessive
USDJPY breaks higher as inflation came at 1.8% down from 2.5% expectations, and 2.6% prev reading. Thats very interesting reading. Who would think of this data considering how expensive are commodities for them, including oil, with recent drop of JPY. But it puts less pressure on BoJ to hike. Maybe more time is needed for inflation to show up and that's when they will hike, in coming months.
In Elliott wave cycles, we see big third leg up with room for 160, potential resistance for this year.
US National Account Figures Spook Markets, Bank of Japan Stays Put
In focus today
In the US, today's main data focus will be on the March PCE. Consensus expects both headline and core PCE inflation to remain steady at 0.3% m/m after mixed signals from March CPI and PPI reports. After yesterday's GDP release, we got the quarterly PCE print as well, showing increased price pressures in Q1 (details under what happened yesterday). In the afternoon, University of Michigan's revised April consumer sentiment survey will be released, the preliminary data showed a worrying uptick in inflation expectations.
In the euro area, we look out for data on monetary aggregates and credit growth. We look for signs that the credit data gives further signs of a bottoming out of the credit cycle.
In Norway, we get retail sales from March. After some signs of stabilisation over the autumn of last year, Norwegian retail sales has continued to trend downwards since November. Although real wage growth is about to become positive, this is still counteracted by higher mortgage rates weakening purchasing power. Hence, we expect that retail sales fell by 0.3% in March but emphasise that the March estimates are extremely uncertain due to Easter, which makes seasonal adjustment challenging.
Economic and market news
What happened overnight
In Japan, as widely expected, the Bank of Japan (BoJ) kept monetary policy unchanged at a policy meeting concluding this morning. This meeting follows the March decision to hike the overnight rate out of negative territory in March and exit yield curve control. Unlike at the March meeting, the policy decision this morning was taken unanimously with BoJ revealing new forecasts for the fiscal year 2026. The BoJ expects core inflation of 2.1% by FY 2026, signalling confidence in the longevity of inflation. We see this as a clear message that the BoJ expects to hike the overnight rate target again.
Hours before the decision, Tokyo inflation data slid significantly to 1.6% in April from 2.4% (2.2% expected). The capital data is usually a reliable indicator for the countrywide figures and thus, this must be a concern for the BoJ. The full price effect from the solid spring wage hikes has yet to play out, though. The market has reacted by trading USD/JPY a bit higher to the 156-level this morning, which likely first and foremost reflects the lack of concrete action on the latest JPY depreciation than the rate decision itself.
We expect the BoJ to hike one more time this year, especially if the JPY remains weak. We look for the July meeting by which the final wage tally will also shed more light on the SME segment, which has not seen much wage growth in recent years.
What happened yesterday
In the US, we received the first Q1 GDP print. GDP surprised to the downside at 1.6% y/y SA AR (cons: 2.4%) but more importantly for markets quarterly core PCE prices surprised markets considerably to the top side rising to 3.7% y/y (cons: 3.4%) thereby driving a considerable sell-off in US fixed income.
Real consumption growth eased from Q4, but this was purely driven by lower goods consumption. Services demand actually picked up on a q/q basis. Net exports and public investment also seemed to explain the downside surprise. On the side of private investments, residential investments picked up and non-residential growth also held up. Overall, the details did not seem too weak even if the headline GDP growth number was below expectations. Combined with services price inflation accelerating (in line with signals from CPI), the EUR/USD ended the day higher despite higher treasury yields. The dollar strengthened slightly overnight.
Two of the Big Tech companies, Alphabet and Microsoft, both beat earnings forecasts and sent their respective stocks higher after the US close. Alphabet announced their first ever dividend, which helped their stock rise as well.
In the euro area, ECB's Panetta, a well-known dove, said that the ECB should cut rates in small progressive steps to monitor the inflation situation, and allow them to stop cutting, at no cost if upside shocks to inflation would materialise. He also said that he feared monetary policy being too tight, such that ECB would need ultra-low rates later. ECB's Schnabel said that ECB has a bumpy last mile back to inflation target, as service inflation seems to prove persistent, staying above 4% in 2024 until now. We continue to see the June rate cut as close to a done deal and expect three rate cuts of 25bp in 2024.
In Turkey, the central bank kept its main interest rate at 50% in line with consensus forecast, pausing its aggressive hiking cycle for now. The central bank has been fighting inflation rates above 60% since last June, when interest rate was at 8.5%. It paused in February but surprised markets again with a large 500bp hike in March. Now, the CBRT argued lagged effects of past tightening are still at play, and hence a pause was warranted, but they remain "highly attentive to inflation risks".
Yesterday's market movements
Equities: Global equities were lower yesterday with macro and micro challenging investors and making it yet another rollercoaster day. At the end, most sectors were lower with communication services massively underperforming on weak earnings while energy and materials outperformed, and we saw stagflationary macro data. Some of these rotations could very well revert today based on the afterhours earnings results yesterday and toda'’s macro calendar. In the US yesterday Dow -1.0%, S&P 500 -0.5%, Nasdaq -0.6% and Russell 2000 -0.7%. Asian markets are mixed this morning while both European and US futures are higher.
FI: The sell-off in the global bond markets continued yesterday on the back of slower US growth and higher US inflation raising speculation regarding the"“stagflatio"” scenario. The US GDP data for Q1 was lower than expected as growth in Q1 was only 1.6% q/q, while the core-PCE inflation rose 3.7% y/y. The curve flattened from the short end as 2Y US Treasury yield is back at the 5% level, as the market continue to price out rate cuts from the Federal Reserve. 10Y US Treasuries is heading towards 4.75%.
FX: The USD soared along rising yields initially on the above-expectations Q1 inflation report but gave back most of its gains towards the end of the session. EUR/USD closed the day flat, whereas USD/Scandies edged slightly higher. The BoJ did little to support the yen at their monetary policy meeting and USD/JPY ventured to new highs above 156.
AI Saves the Day
Facebook’s Meta went on a 10% freefall yesterday, even after the company announced better-than-expected earnings. This being said, yesterday’s selloff ended up being less than suggested in the afterhours trading. CEO Mark Zuckerberg said that, in the past, the company also experienced high price volatility during a period of investment when the results were not yet visible. Meta could successfully turn its AI investments into profit – it’s just that it will take a bit longer than expected. All in all, some investors think that Meta is worth buying at the dip. The question is, where’s the dip?
One positive news is that Meta didn’t pull the rest of the tech stocks down with it yesterday. Nvidia gained more than 3% while Tesla jumped another 5% - don’t ask me why.
On the macroeconomic stage, the news were not bright. The first estimate for the US Q1 growth showed that the US economy slowed way more than expected in Q1. A soft print could’ve at least revived the dovish Federal Reserve (Fed) expectations, but the notable jump in core PCE prices to 3.7%, from 2% printed a quarter earlier, didn’t give much room for optimism. Yesterday's data threw a wrench into the soft-landing dream and sparked fears of stagflation, where the economy slows down while inflation persists – which would force the Fed to keep its policy tight. The US 2-year yield continues to test the 5% mark to the upside, as the 10-year paper yields near 4.70%.
Today, all eyes are on the US core PCE print for March, expected to decline to 2.6% from 2.8% printed a month earlier. The fear is to see a higher inflation print, of course, which would further batter the Fed cut expectations. But the ‘good’ news is, it looked like yesterday’s price action already embedded today’s core PCE print. Therefore, bad news are – at least – partially priced in.
Diving a bit deeper into yesterday’s GDP print: The slowdown was mainly caused by a lower inventory accumulation and a wider trade gap. But a gauge of underlying demand still came in above 3% for the third straight quarter. The latter explains why we see inflation persists as the headline GDP slows down. In conclusion, inflation which slowed last year thanks to fading post-pandemic boost is now fueled by still-robust demand. And that’s something the Fed could address … by keeping its policy tight. Swap traders now price in 35bp cut for the entire 2024, down from six rate cuts priced in at the start of the year.
AI buzz continues
Microsoft and Google’s Alphabet both jumped in the afterhours trading after announcing sufficiently strong results that met and surpassed expectations. Microsoft gained more than 4% on better-than-expected sales and profit thanks to robust corporate demand for its cloud and AI offerings, while Google jumped 11% boosted by its own cloud business. Nasdaq futures are up by more than 1% this morning.
The yen selloff continues
The US dollar index is slightly better bid this morning, as the USDJPY shot above the 156 level after the Bank of Japan (BoJ) decided to leave its rates unchanged. The decision was expected, the BoJ even lifted its 2024 inflation forecast from 2.4% to 2.8%, but in vain. The absence of a clear hawkish message and the lack of intervention news strengthened appetite for a further rise to 160.
Elsewhere, the euro and sterling retreat this morning against the US dollar following this week’s rebound. US crude recovers past the $84pb level despite the US GDP disappointment and the further decline in Fed rate cut expectations. The geopolitical risks remain tilted to the upside as Israel is said to be preparing for an all-out war with Iran-backed Hezbollah.
On the corporate front, Exxon and Chevron are expected to announce their Q1 results today. Despite rising crude oil prices, both companies are expected to report a decline in Q1 profits compared to the same period last year due to a global glut in nat gas supplies and narrower refining margins. If all goes well and crude prices continue to climb, the energy giants’ fortunes could reverse in the Q2. Exxon closed yesterday’s session above $121 per share, as Chevron climbed past $165 per barrel. While the reflation trade is expected to boost appetite for energy companies, the unwelcomed return of inflation may put the reflation trade on hold.
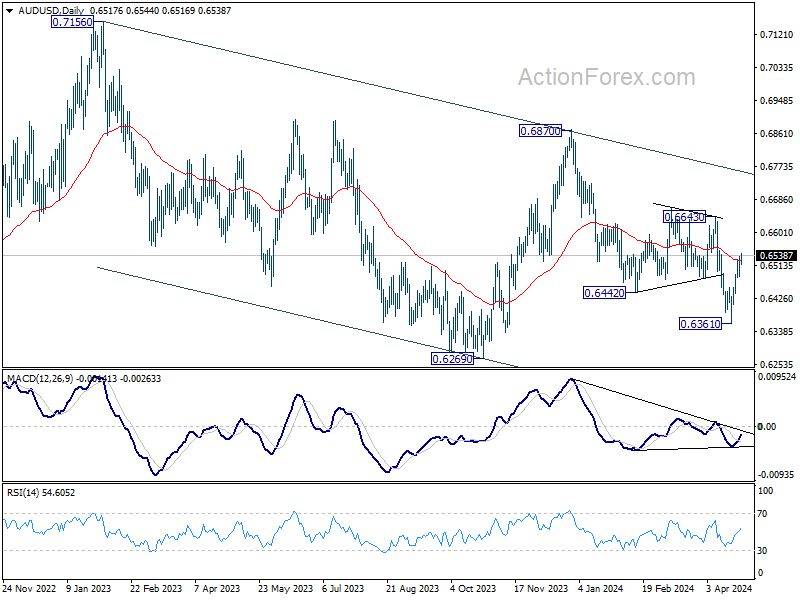
AUD/USD Daily Report
Daily Pivots: (S1) 0.6490; (P) 0.6515; (R1) 0.6543; More...
Intraday bias in AUD/USD remains on the upside for the moment. Sustained break of 55 D EMA (now at 0.6527) will argue that fall from 0.6870 has completed, and bring further rally to 0.6643 resistance next. On the downside, though, break of 0.6464 minor support will turn bias back to the downside for retesting 0.6361 instead.
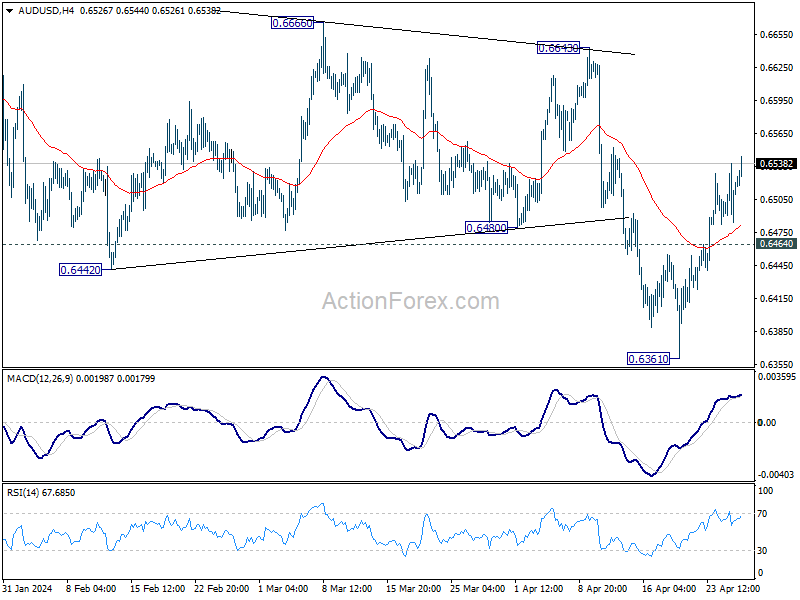
In the bigger picture, price actions from 0.6169 (2022 low) are seen as a medium term corrective pattern to the down trend from 0.8006 (2021 high). Fall from 0.7156 (2023 high) is seen as the second leg, which is still in progress. Overall, sideway trading could continue in range of 0.6169/7156 for some more time. But as long as 0.7156 holds, an eventual downside breakout would be mildly in favor.
USD/CAD Daily Outlook
Daily Pivots: (S1) 1.3629; (P) 1.3680; (R1) 1.3710; More...
Intraday bias in USD/CAD is back on the downside with break of 1.3660 support. Fall from 1.3845 short term top would extend to 55 D EMA (now at 1.3597). On the upside, above 1.3730 minor resistance will turn bias back to the upside for retesting 1.3845 instead.
In the bigger picture, price actions from 1.3976 (2022 high) are viewed as a corrective pattern only. In case of another fall, strong support should emerge above 1.2947 resistance turned support to bring rebound. Firm break of 1.3976 will confirm up resumption of whole up trend from 1.2005 (2021 low). Next target is 61.8% projection of 1.2401 to 1.3976 from 1.3176 at 1.4149.