
Sample Category Title
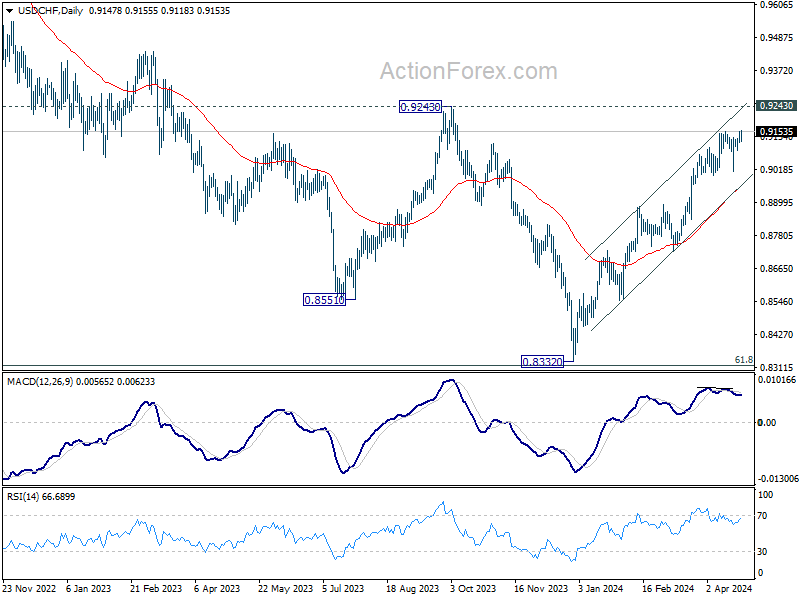
USD/CHF Mid-Day Outlook
Daily Pivots: (S1) 0.9121; (P) 0.9138; (R1) 0.9167; More....
Intraday bias in USD/CHF is back on the upside with breach of 0.9151 resistance. Current rally from 0.8332 should target 0.9243 key resistance next. On the downside, though, below 0.9085 minor support will turn intraday bias neutral again.
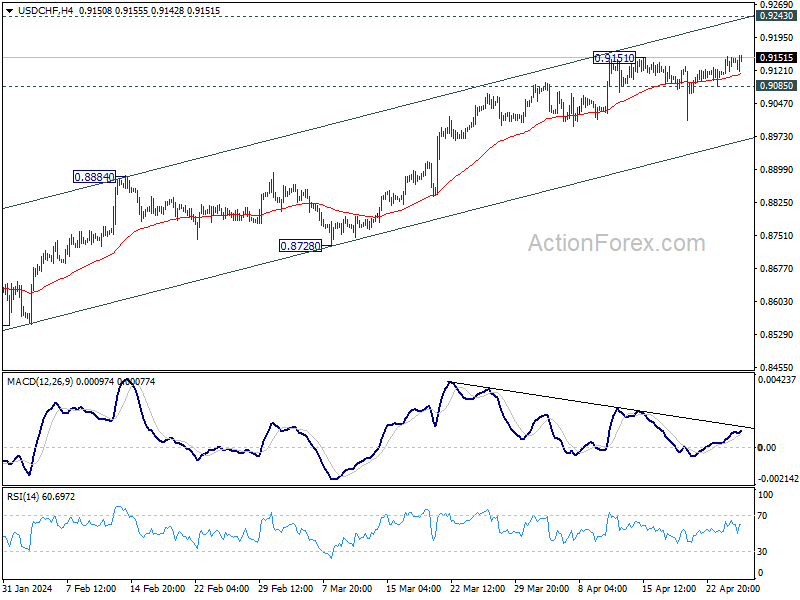
In the bigger picture, price actions from 0.8332 medium term bottom as tentatively seen as developing into a corrective pattern to the down trend from 1.0146 (2022 high). Further rise would be seen as long as 0.8728 support holds. But upside should be limited by 0.9243 resistance, at least on first attempt. However, decisive break of 0.9243 will argue that the trend has already reversed and turn medium term outlook bullish.
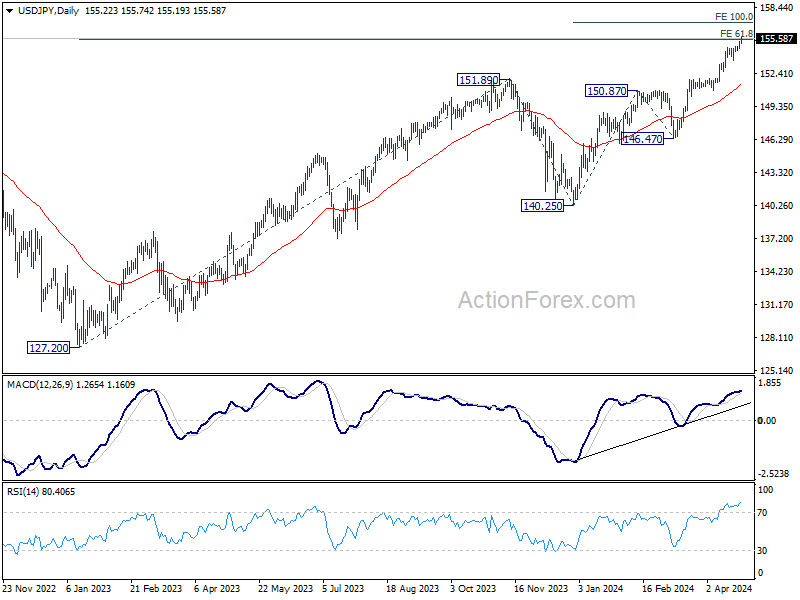
USD/JPY Mid-Day Outlook
Daily Pivots: (S1) 154.91; (P) 155.15; (R1) 155.58; More...
Intraday bias in USD/JPY remains on the upside at this point. Sustained trading above 155.20 fibonacci level will pave the way 100% projection of 140.25 to 150.87 from 146.47 at 157.09. Considering bearish divergence condition in 4H MACD, break of 154.77 resistance turned support will turn bias back to the downside for deeper pull back to 153.58 support first.
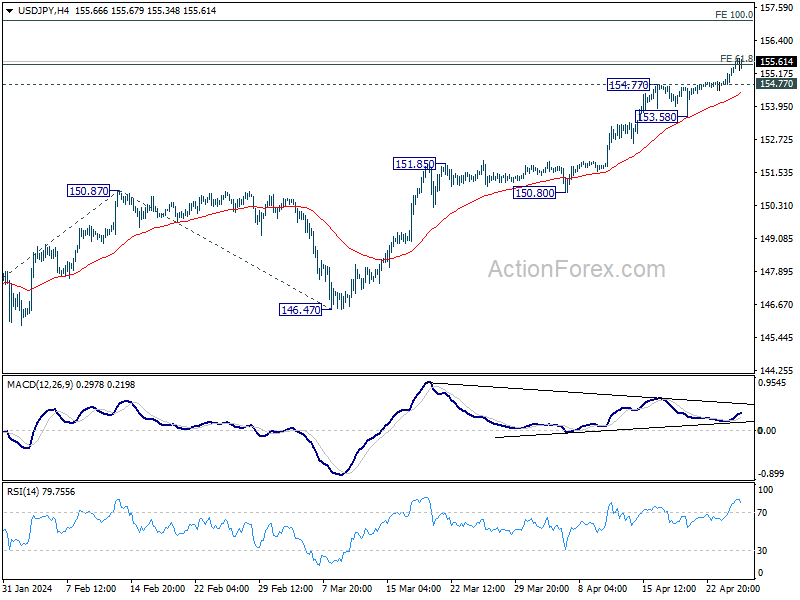
In the bigger picture, current rise from 140.25 is seen as the third leg of the up trend from 127.20 (2023 low). Next target is 61.8% projection of 127.20 to 151.89 from 140.25 at 155.20. Firm there will target 100% projection of 140.25 to 150.87 from 146.47 at 157.09., Outlook will remain bullish as long as 150.87 resistance turned support holds, even in case of deep pullback.
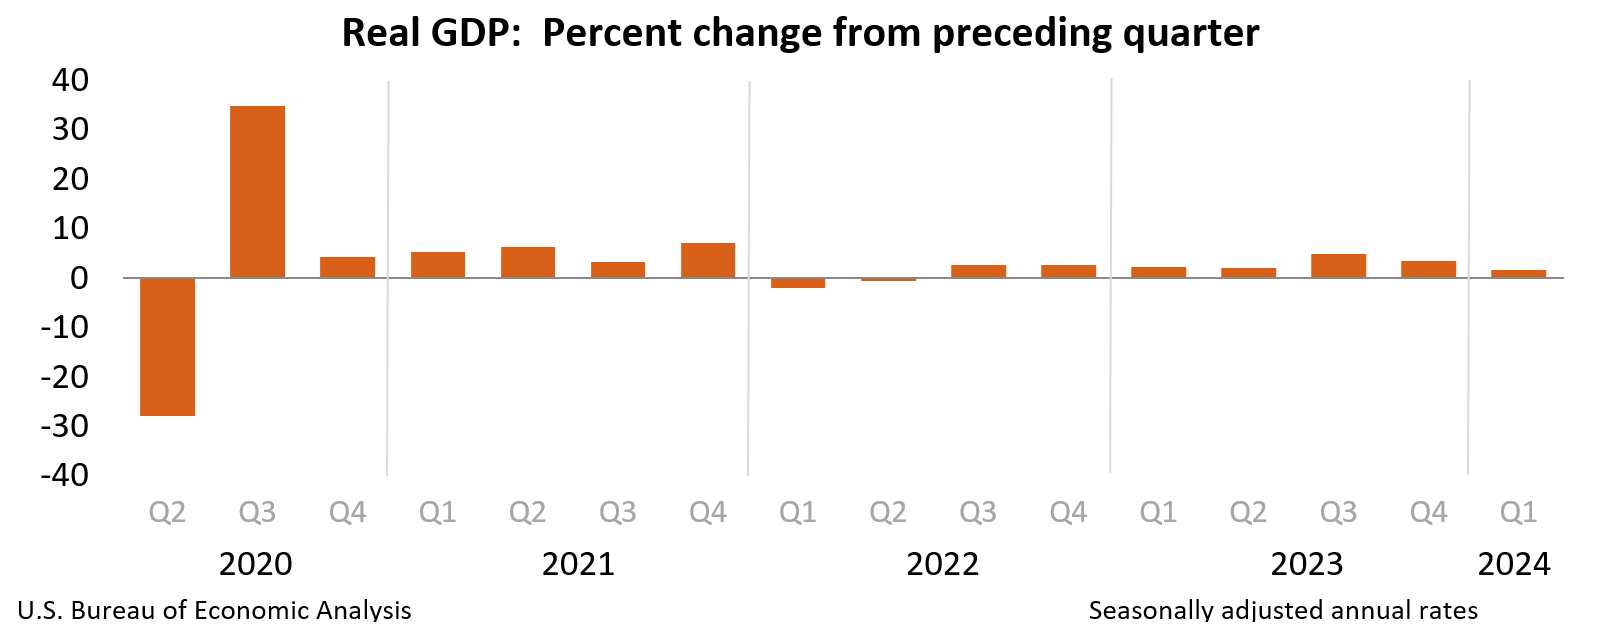
US Q1 GDP Comes in Lower Than Expected, But Details Show a Resilient Economy
Real GDP expanded by 1.6% quarter-over-quarter (q/q, annualized) in the first quarter of 2024 – below the consensus forecast of 2.5%.
Consumer spending expanded by 2.5% – a modest deceleration from last quarter's 3.3% gain. Service spending (+4.0%) accounted for all of last quarter's gain, while spending on goods (-0.4%) was flat.
Non-residential business investment expanded by 2.9%, with gains seen across equipment (+2.1%) and intellectual property products (+5.4%). Residential investment (13.9%) rose by its fastest pace in over three years, alongside a sharp rebound in new & existing home sales.
Government consumption & gross investment rose 1.2%, with state & local spending up 2.0% while federal spending (-0.2%) was flat.
Next exports shaved 0.9 percentage points (pp) from growth, as a modest uptick in exports (+0.9%) was eclipsed by a sharp gain in imports (+7.2%).
Inventory investment was also a net drag on growth, shaving 0.4 pp from GDP.
Core PCE inflation rose 3.7% (q/q, annualized) – a sharp acceleration from the 2% gain seen through H2-2023.
Key Implications
The advance estimate of first quarter GDP showed the U.S. economy having downshifted relative to the strong pace of growth averaged through the second half of last year. That said, net exports and inventory investment were a sizeable drag on Q1 growth and helped to mask some of the underlying strength. Importantly, domestic demand (i.e., the sum of consumption, fixed investment, and government expenditures) expanded by a still strong 2.8% and showed only a modest deceleration from last quarter's gain of 3.6%.
Consumer resilience is likely to remain a key driver supporting economic growth over the near-term. Job gains remain plentiful and have shown little indication of slowing. This is helping to support aggregate gains in household income and providing a sustained tailwind to consumer spending. Tomorrow's release of the March personal income and spending data will give a better sense of the monthly spend pattern in Q1, but for now, it looks like spending momentum has carried over into Q2. Our current tracking has real GDP growth holding steady in the 1.5%-2% range in the second quarter.
GBP/USD Mid-Day Outlook
Daily Pivots: (S1) 1.2368; (P) 1.2414; (R1) 1.2495; More...
Intraday bias in GBP/USD remains neutral for the moment. Near term outlook stays bearish as long as 1.2538 support turned resistance holds. Break of 1.2421 minor support will argue that rebound from 1.2298 has completed and bring retest of this low. However, decisive break of 1.2538 will bring stronger rally to 55 D EMA (now at 1.2585) instead.
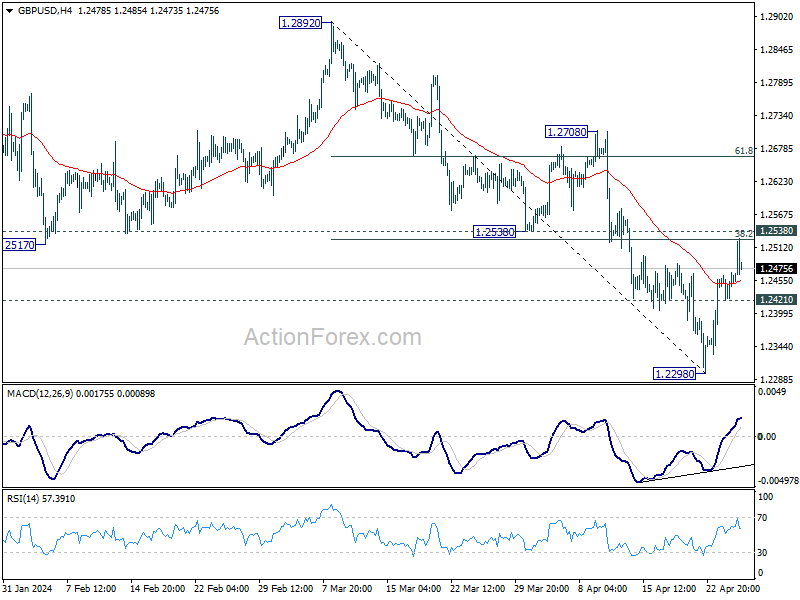
In the bigger picture, price actions from 1.3141 medium term top are seen as a corrective pattern to up trend from 1.0351 (2022 low). Fall from 1.2892 is seen as the third leg. Deeper decline would be seen to 1.2036 support and possibly below. But strong support should emerge from 61.8% retracement of 1.0351 to 1.2452 at 1.1417 to complete the correction.
Disappointing GDP Growth and Rising Inflation Spark Risk Sentiment U-Turn
Risk sentiment took a sharp downturn following the release of US Q1 GDP data, which revealed weaker-than-expected economic growth alongside an acceleration in both headline and core PCE price indexes. This combination suggests that the US economy may be caught in a challenging cycle where high interest rates are dampening economic activity without effectively curbing inflationary pressures. In response, DOW futures plummeted by over -300 pts at the time of writing, signaling a steep market open, while 10-year Treasury yield is making moves to break 4.7% mark.
In the currency markets, Dollar is attempting a rebound driven by the shift in risk sentiment, though it remains uncertain whether it can fully offset this week's losses. Currently, Japanese Yen remains the weakest performer for the week, followed by Swiss Franc. Australian Dollar continues to hold the lead as the strongest, with British Pound and New Zealand Dollar also showing resilience. Euro and Canadian Dollar are positioned in the middle. But these standings could shift dramatically if the risk-off mood intensifies throughout the remainder of the week.
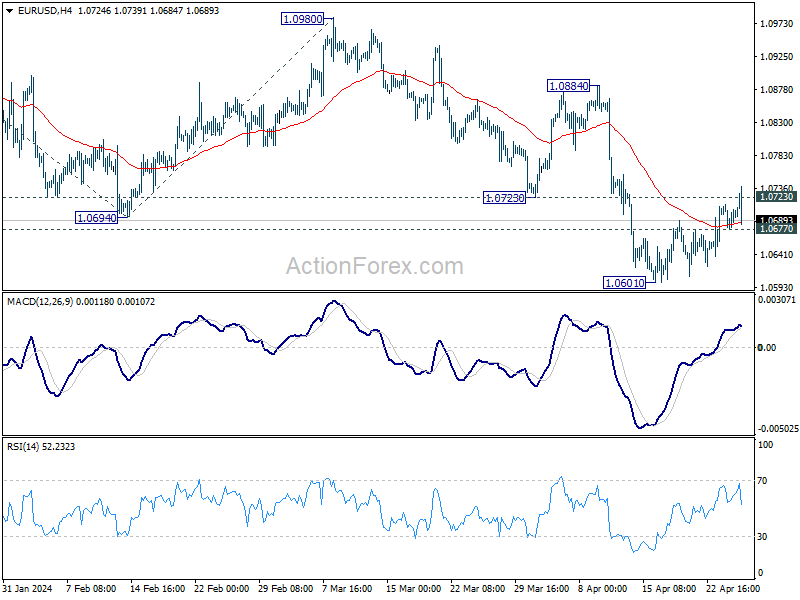
Technically, EUR/USD failed to sustain above 1.0723 support turned resistance despite breaching it briefly. Immediate focus is now on 1.0677 minor support. Firm break there will argue that recovery from 1.0601 has completed as a correction, and retain near term bearish next. EUR/USD might then be resume to resume the fall from 1.0980 through 1.0601.
In Europe, at the time of writing, FTSE is up 0.41%. DAX is down -0.93%. CAC is down -1.24%. UK 10-year yield is up 0.0399 at 4.374. Germany 10-year yield is up 0.0236 at 2.616. Earlier in Asia, Nikkei fell -2.16%. Hong Kong HSI rose 0.48%. China Shanghai SSE rose 0.27%. Singapore Strait Times fell -0.16%. Japan 10-year JGB yield rose 0.0070 to 0.898.
US GDP expands 1.6% annualized in Q1, below expectations
US real GDP grew at an annualized rate of 1.6% in Q1, missing expectation of 2.1%, sharply lower than Q4's 3.4%.
Compared to the fourth quarter, the deceleration in real GDP in the first quarter primarily reflected decelerations in consumer spending, exports, and state and local government spending and a downturn in federal government spending. These movements were partly offset by an acceleration in residential fixed investment. Imports accelerated.
Price index for gross domestic purchases increased 3.1% in Q1, compared with an increase of 1.9% in the Q4. Personal consumption expenditures (PCE) price index increased 3.4%, compared with an increase of 1.8%. Excluding food and energy prices, PCE price index increased 3.7%, compared with an increase of 2.0%.
ECB's Schnabel identifies services inflation as primary concern
ECB Executive Board Member Isabel Schnabel acknowledged that the consensus that the path to disinflation is proving to be "quite bumpy," especially as the process is in its "last mile". The "biggest concern" is the persistent inflation within the services sector, which remains stubbornly high.
Schnabel emphasized the importance of closely monitoring unit labor costs. She noted at a conference today, "One aspect that we are looking at very vigilantly is the development of unit labor cost."
"Wage growth remains relatively strong but it seems to be gradually easing in line with what we have in our projections," she added.
However, Schnabel expressed particular concern over another crucial economic indicator: "The more concerning part is productivity growth," she remarked, as Eurozone has been experiencing negative productivity growth for several quarters.
Germany's Gfk consumer sentiment rises to -24.2, an extremely low two-year high
German Gfk Consumer Sentiment for May rose from -27.3 to -24.2, above expectation of -25.5. This marks the highest level in two years, although it remains significantly low by historical standards.
In April, economic expectations rose from -3.1 to 0.7. Income expectations rose from -1.5 to 10.7. Willingness to buy rose from -15.3 to -12.6. Willingness to save rose from 12.4 to 14.9.
Rolf Bürkl, consumer expert at NIM, attributed the stronger uplift in consumer sentiment mainly to the "noticeable increase in income expectations." He elaborated that these expectations are closely tied to actual developments in real income, buoyed by rising wages and salaries alongside recent dip in inflation rates. This combination has laid a solid foundation for increasing purchasing power among households.
GBP/USD Mid-Day Outlook
Daily Pivots: (S1) 1.2368; (P) 1.2414; (R1) 1.2495; More...
Intraday bias in GBP/USD remains neutral for the moment. Near term outlook stays bearish as long as 1.2538 support turned resistance holds. Break of 1.2421 minor support will argue that rebound from 1.2298 has completed and bring retest of this low. However, decisive break of 1.2538 will bring stronger rally to 55 D EMA (now at 1.2585) instead.
In the bigger picture, price actions from 1.3141 medium term top are seen as a corrective pattern to up trend from 1.0351 (2022 low). Fall from 1.2892 is seen as the third leg. Deeper decline would be seen to 1.2036 support and possibly below. But strong support should emerge from 61.8% retracement of 1.0351 to 1.2452 at 1.1417 to complete the correction.
Economic Indicators Update
| GMT | Ccy | Events | Actual | Forecast | Previous | Revised |
|---|---|---|---|---|---|---|
| 06:00 | EUR | Germany GfK Consumer Confidence May | -24.2 | -25.5 | -27.4 | -27.3 |
| 08:00 | EUR | ECB Economic Bulletin | ||||
| 12:30 | USD | Initial Jobless Claims (Apr 19) | 207K | 210K | 212K | |
| 12:30 | USD | GDP Annualized Q1 P | 1.60% | 2.10% | 3.40% | |
| 12:30 | USD | GDP Price Index Q1 P | 3.10% | 3.00% | 1.60% | |
| 12:30 | USD | Goods Trade Balance (USD) Mar P | -91.8B | -91.2B | -90.3B | -90.3B |
| 12:30 | USD | Wholesale Inventories Mar P | -0.40% | 0.20% | 0.50% | 0.40% |
| 14:00 | USD | Pending Home Sales M/M Mar | 0.90% | 1.60% | ||
| 14:30 | USD | Natural Gas Storage | 87B | 50B |
US GDP expands 1.6% annualized in Q1, below expectations
US real GDP grew at an annualized rate of 1.6% in Q1, missing expectation of 2.1%, sharply lower than Q4's 3.4%.
Compared to the fourth quarter, the deceleration in real GDP in the first quarter primarily reflected decelerations in consumer spending, exports, and state and local government spending and a downturn in federal government spending. These movements were partly offset by an acceleration in residential fixed investment. Imports accelerated.
Price index for gross domestic purchases increased 3.1% in Q1, compared with an increase of 1.9% in the Q4. Personal consumption expenditures (PCE) price index increased 3.4%, compared with an increase of 1.8%. Excluding food and energy prices, PCE price index increased 3.7%, compared with an increase of 2.0%.
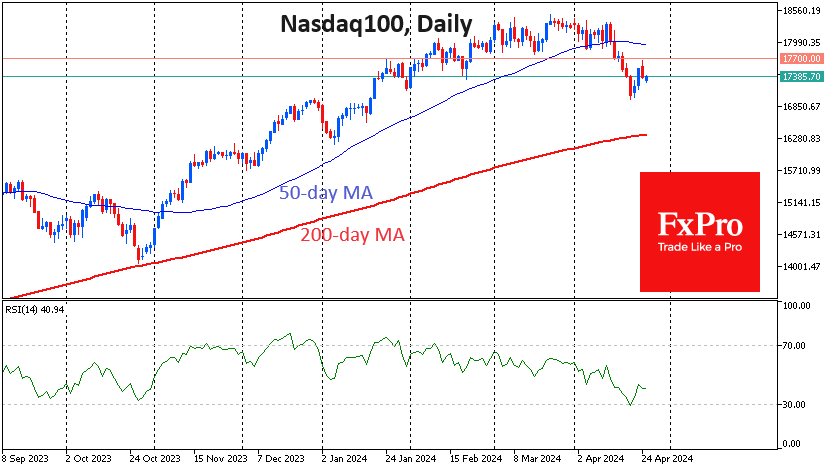
Nasdaq 100 Might Retreat to 15800
Change in the Nasdaq100. The selling on the Nasdaq100 from 12 to 19 April, which sent the index down more than 7%, has stimulated buying interest this week. They see falling prices as an opportunity to buy stocks at a reduced cost.
RSI dynamics. The rebound of the index coincided with the recovery of the RSI indicator on daily charts after it reached the oversold zone (below 30). Nevertheless, the April correction can be seen as a normalisation after a period of overbought conditions.
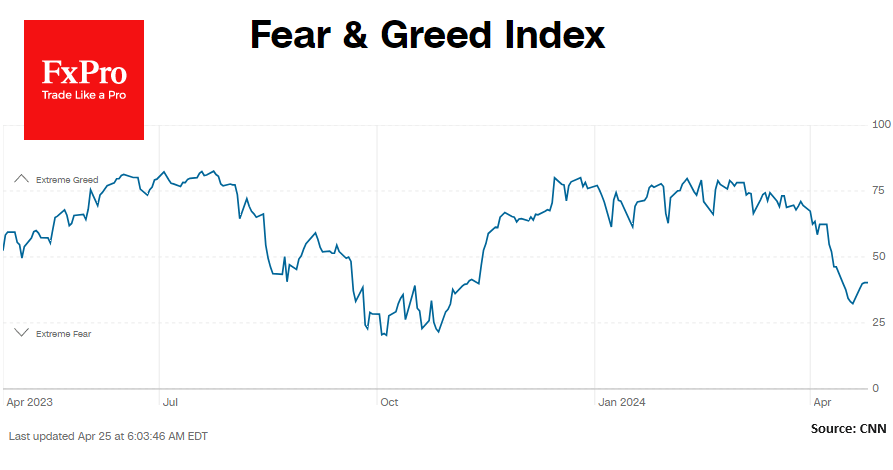
The Fear and Greed Index remains in the “fear” zone, with a low of 32 last week and a subsequent recovery to 40. A similar stock market correction lasting three months last year also included periods of improving sentiment as part of an overall downtrend.
Current Situation and Expectations. The Nasdaq100 lost about 1.2% on Wednesday, and the drop from high to low in futures was 2% in 8 hours. The 17700 level has become resistant again. Changes in Fed key rate expectations and investor inertia backed by macroeconomic reports could lead to a repeat of last year’s market pattern with a multi-month correction.
Potential downside targets. The area of the 200-day moving average, passing through 16300 and pointing upwards, could be a potential downside target. There is more chance of support in the 15800-16000 range, where the market encountered strong resistance in July 2023 and pushed back for upside in November.
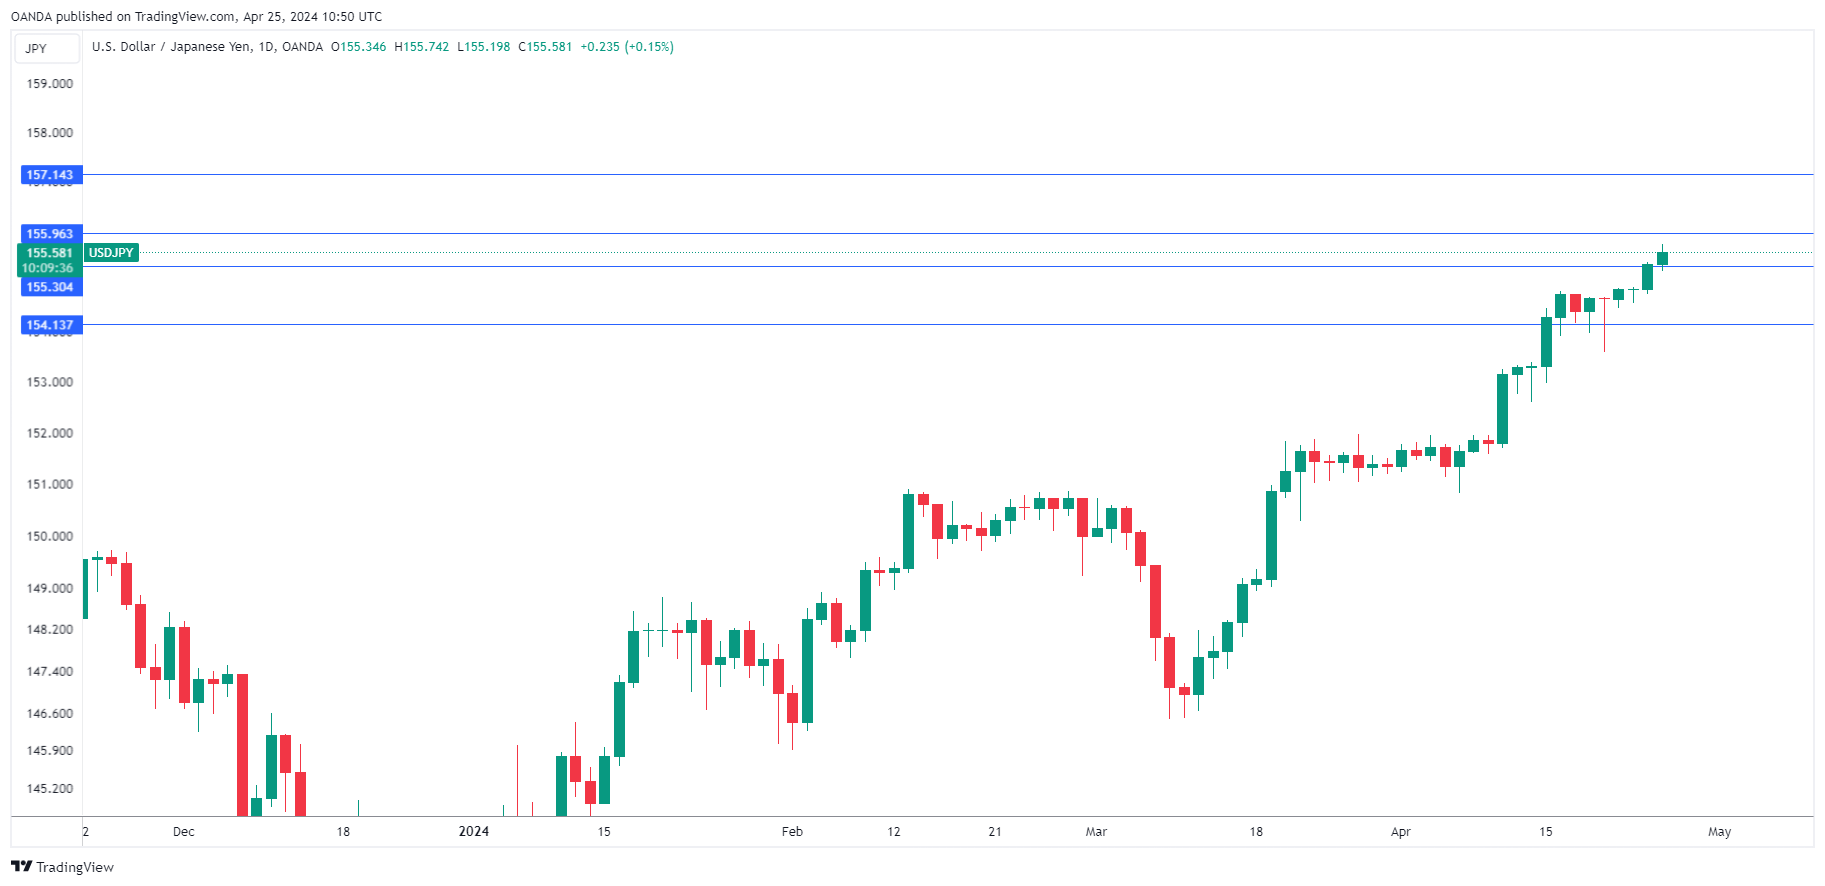
USD/JPY Ticks Higher Ahead of BoJ Meeting
The Japanese yen continues to lose ground on Thursday. In the European session USD/JPY is trading at 155.61, up 0.17%. Earlier, the yen dropped to a 34-year low of 155.74.
Friday will be a busy day out of Japan. Tokyo Core CPI, which excludes food, is a key leading indicator of nationwide inflation trends. It is expected to drop to 2.2% in April, down from 2.4% in March. The Tokyo core-core rate, which excludes food and energy, is also expected to fall, from 2.9% in March to 2.7% in April. The March reading marked the first time that the core-core rate fell below 3% since November 2022.
Inflation played a key factor in the Bank of Japan’s historic decision in March to raise interest rates out of negative territory. The BoJ wants to see service inflation and wage growth to rise in order to ensure that inflation remains sustainable at the 2% target.
BoJ expected to stand pat
The Bank of Japan meets on Friday as the Japanese yen continues to lose ground. The yen has lost about 10.4% against the US dollar in 2024 and this sharp descent in such a short period has set off alarm bells in Tokyo. The BoJ’s tightening in March hasn’t stopped the bleeding, as the BoJ has said that it will maintain an accommodative policy and the US/Japan rate differential remains hasn’t narrowed as the Fed has delayed rate cuts.
The BoJ is expected to maintain policy settings at the meeting but Governor Ueda may sound hawkish in order to provide some support for the yen. The meeting could turn out to be a non-event but the threat of intervention from the Ministry of Finance is sure to be on the minds of investors.
The US releases the initial estimate for GDP for the first quarter. The market estimate stands at 2.5% y/y, compared to 3.4% in Q4 2023. The US economy has been robust and rising inflation has not only delayed rate cuts but there is even talk that the Fed could raise rates in order to put the brakes on inflation.
USD/JPY Technical
- USD/JPY tested support at 155.30 earlier. Below, there is support at 154.13
- There is resistance at 155.96 and 157.13
Yen in Search of New Lows, Commodity Currencies at a Low Start
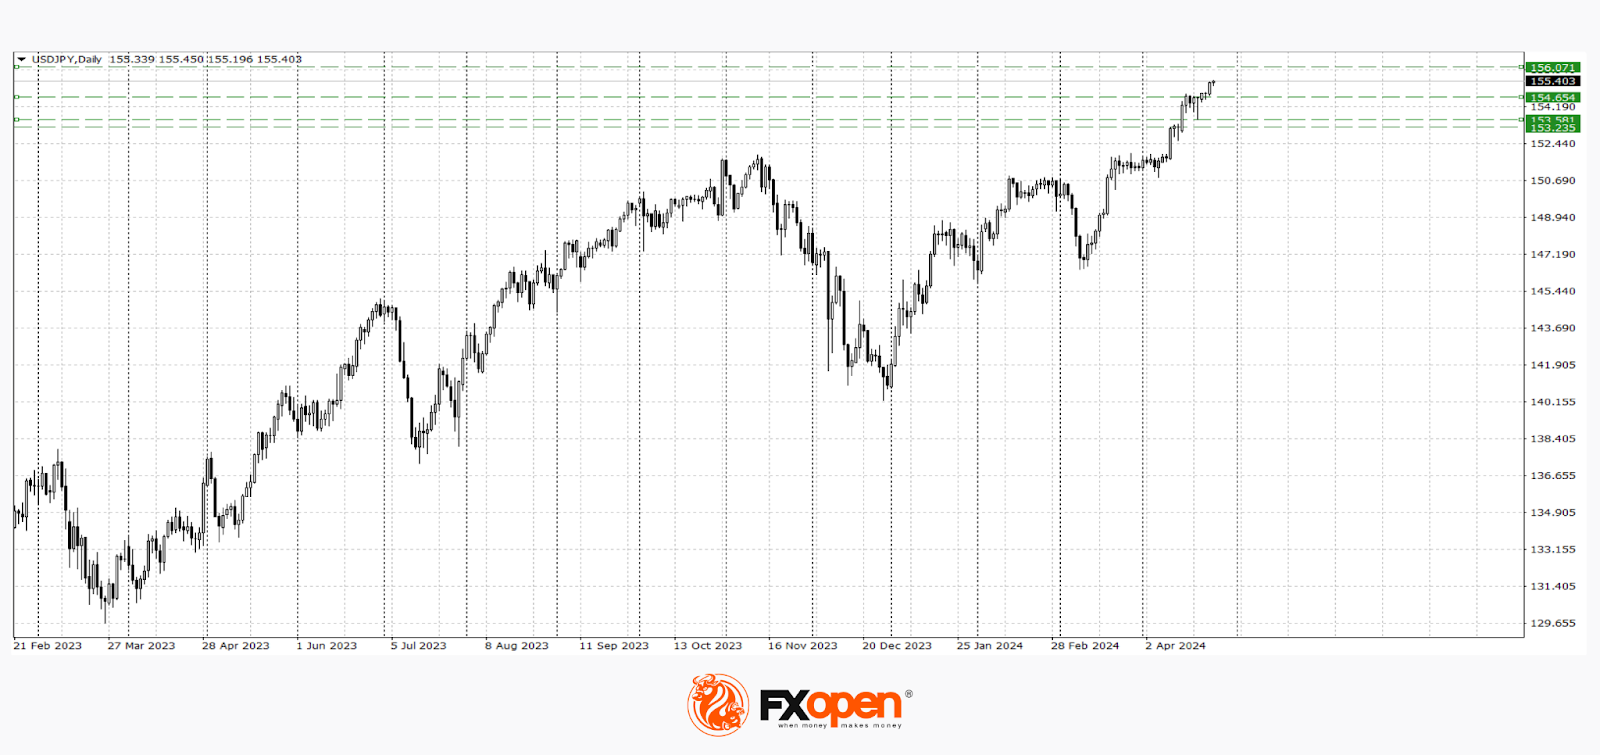
In recent trading sessions, the dollar has been trading quite differently to leading currencies. Thus, the yen is reaching historical lows, European currencies have managed to correct, and the Australian and Canadian dollars are testing strategic supports.
USD/JPY
The absence of currency interventions from the Bank of Japan and strong macroeconomic data from the United States are pushing the USD/JPY pair to new levels, above which the price has not risen since 1990. However, in the coming trading sessions the situation may change dramatically:
- Today at 15.30 (GMT +3:00) US GDP data for the first quarter will be published
- Tomorrow at 5.30 (GMT +3:00) a meeting of the Bank of Japan will take place, at which a decision on the base interest rate will be announced.
This week, Japanese Finance Minister Shunichi Suzuki issued what is now the strongest possible warning about the possibility of intervention. "I will not deny that these events have laid the groundwork for Japan to take appropriate action (in the foreign exchange market), although I will not say what those actions might be," the official said.
According to technical analysis of USD/JPY, the pair is in a phase of exponential growth, which can be interrupted at any significant resistance. If a downward pullback begins, the price may drop to 154.70-1.53.60.
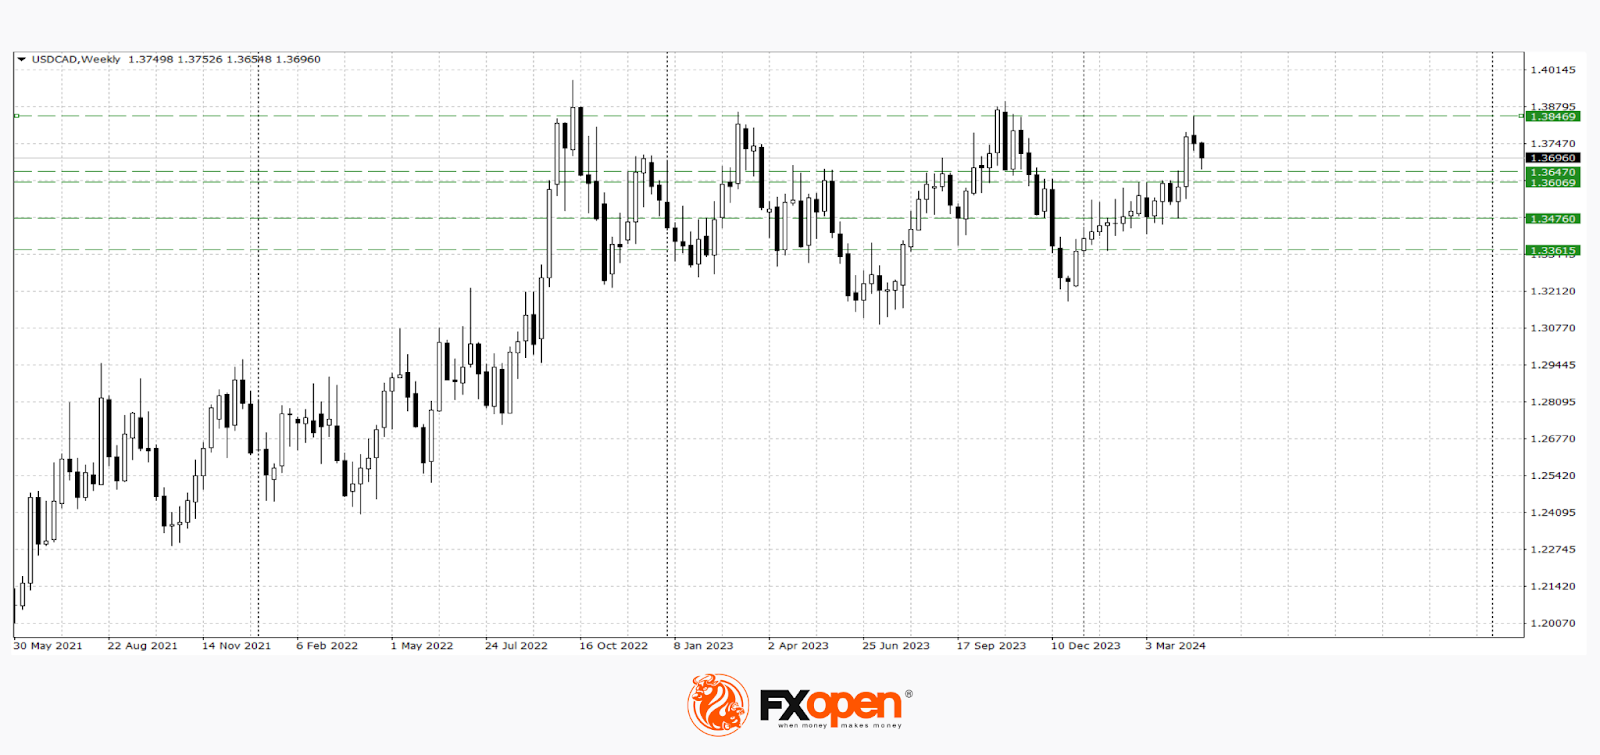
USD/CAD
The rise in commodity prices contributed to the start of a corrective pullback in the USD/CAD pair. On the daily timeframe, one can observe the development of the dark clouds combination, which was mentioned in a recent review. From the technical analysis of the USD/CAD pair it follows that the price found support at 1.3640; a repeated rebound from this level could lead to the pair returning above 1.3700. If the price consolidates below 1.3640-1.3620, a larger downward correction in the direction of 1.3480-1.3360 may begin.
News that may affect the pair's pricing:
- today: 15.30 (GMT +3:00) weekly data on the number of initial applications for unemployment benefits in the US
- tomorrow: 15.30 (GMT +3:00) publication of the basic price index of personal consumption expenditures in the USA for April
Trade over 50 forex markets 24 hours a day with FXOpen. Take advantage of low commissions, deep liquidity, and spreads from 0.0 pips. Open your FXOpen account now or learn more about trading forex with FXOpen.
This article represents the opinion of the Companies operating under the FXOpen brand only. It is not to be construed as an offer, solicitation, or recommendation with respect to products and services provided by the Companies operating under the FXOpen brand, nor is it to be considered financial advice.
Crypto: Bears Plotting New Attack
Market picture
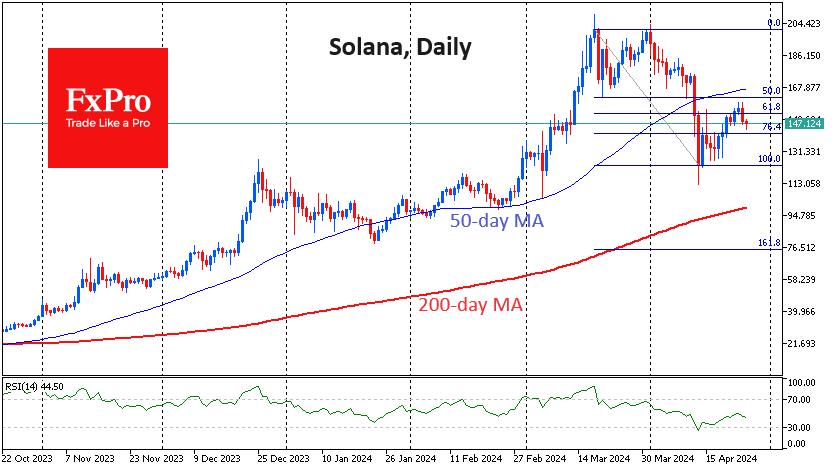
Over the past 24 hours, the cryptocurrency market has lost more than 3.5%, falling to a capitalisation of $2.37 trillion. Bitcoin shows a decline with a similar amplitude; Ethereum lost less than 3%, while BNB added 0.1%, and Solana fell by 6.5%.
On Wednesday, Bitcoin retreated significantly from its 50-day moving average, which we see as an important manifestation of bearish strength. Most crypto traders clearly took this signal.
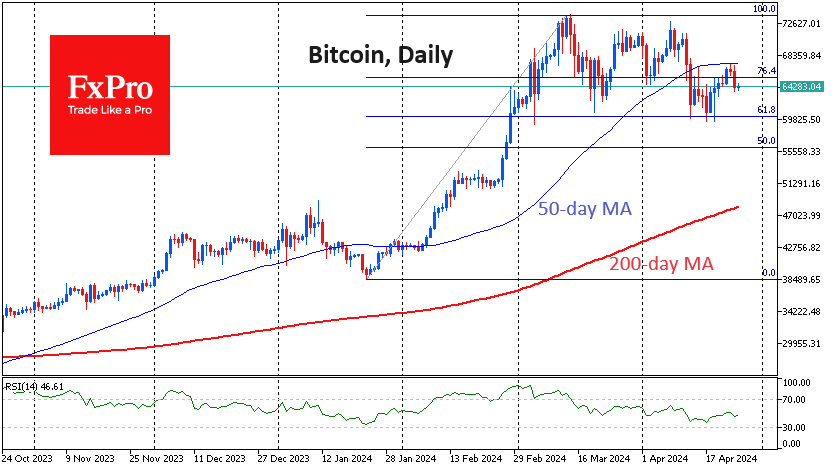
For example, on the daily charts of Solana and Cardano, the rebound over the past ten days now looks like a tactical retreat by the bears, who decided to sell the market again on Wednesday. It is worth keeping a close eye on whether selling can bring the price below the previous local lows, around $125 for Solana and $0.4 for Cardano.
News background
The possibility of creditors of bankrupt platform Mt.Gox selling 142,000 BTC (over $9bn) in the coming weeks could “spook the market” and put pressure on bitcoin, according to K33 Research. Mt.Gox is expected to distribute its assets of 142,000 BTC, 143,000 BCH and 69 billion yen to customers by 31 October 2024. Lenders will start receiving bitcoins as early as next month.
After the halving, demand for Bitcoin will be five times the supply due to the reduction in daily issuance volume, Bitfinex expects.
After the fourth halving, Bitcoin has finally displaced gold as the most deficit asset in the context of rising supply, Glassnode noted. Capital continues to flow into BTC despite “volatility, negative headlines and cyclical drawdowns”.
Standard Chartered, an investment bank, retreated its positive outlook on the spot Ethereum-ETF and now doubts the SEC will approve the instrument in May. The bank reiterated its previous forecast of $150K for Bitcoin at the end of 2024 and $8K for ETH. Cryptocurrencies may resume growth after the market’s congestion of longs is lifted.
Coinbase is launching a $15 million television advertising campaign to promote the benefits of crypto payments. The exchange will air three spots on four TV channels during the NBA playoffs broadcasts.
According to Bloomberg, trading of a spot bitcoin-ETF from Bosera Capital and HashKey Capital on the Hong Kong Stock Exchange will start on 30 April. The spot bitcoin-ETF was approved by the Hong Kong Securities and Futures Commission on 15 April.