Sample Category Title
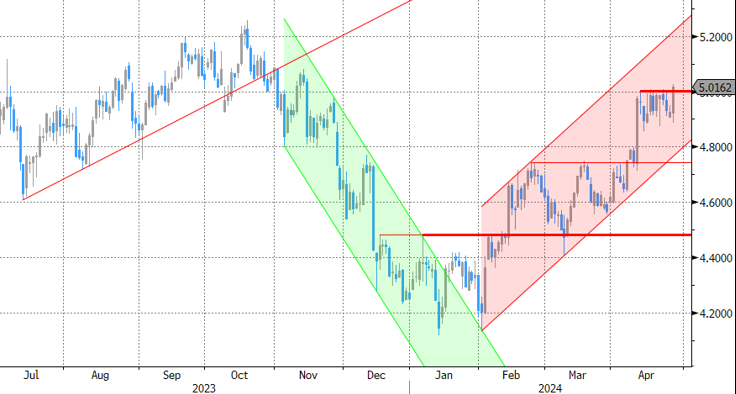
Japan’s Tokyo CPI falls sharply to 1.6% yoy in Apr, vs exp 2.2% yoy
Japan's Tokyo CPI showed significant slowdown in April. CPI core (excluding food) dropped from 2.4% yoy to 1.6%, substantially below the expected 2.2% yoy.
CPI core-core, which excludes both food and energy, also slowed from 2.9% yoy to 1.8% yoy, marking the slowest pace since September 2022.
Services inflation, a significant component of the CPI, decreased from 2.7% yoy to 1.6% yoy. This notable drop is largely attributed to policy interventions by the Tokyo metropolitan government to make some educational tuition free.
Overall headline CPI, which includes all items, also fell from 2.6% yoy to 1.8% yoy.
Worst of Both Worlds: Are the Risks of Stagflation Elevated? Part II
Part II: A Brief Review of Past Episodes of Stagflation
Summary
- In the first installment of this series, we presented a simple framework to characterize stagflation and identified 13 instances in the United States since 1950.
- Episodes vary in severity, but each posed unique challenges to monetary policymakers. In this second report, we briefly review historical instances of stagflation and their accompanying monetary policy decisions.
- Six of the 13 episodes of stagflation occurred in the 1970s as oil price shocks, imbalanced fiscal and monetary policy and robust labor cost growth placed upward pressure on prices and weighed on output growth.
- The episodes outside the 1970s have ranged from mild to moderate, with the exception of the post-COVID pandemic occurrence, a topic that we will turn to in the final installment of this three-report series.
- Over time, historical instances of stagflation have often been met with accommodative monetary policy to support employment, despite elevated price growth.
- The degree to which the accommodative policy stance exacerbated stagflation depends on the drivers of the inflationary bouts themselves and whether the economy's structure would help entrench or dilute price momentum.
- External factors, such as oil price shocks, were associated with severe episodes of stagflation, but expansionary fiscal policy enacted amid a tight labor market also played a role. Those dynamics mirror the current environment, as the unemployment rate is at a decades' low and the fiscal deficit is swelling. Will the economy suffer from stagflation in the near term?
All Stagflation Is Not Created Equal
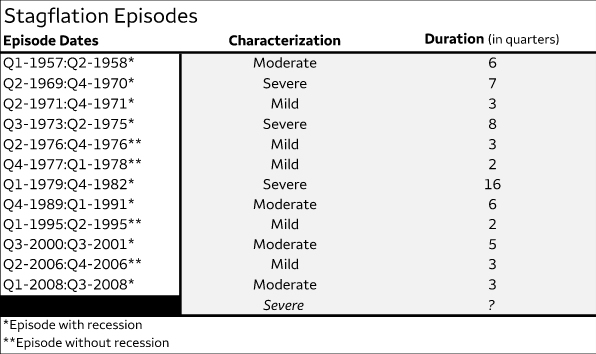
We presented a simple framework to characterize stagflation in the first installment of this series. Using that framework, we identified 13 instances of stagflation in the United States since 1950 (Figure 1). Episodes vary in severity, but each posed unique challenges to monetary policymakers. In this second installment, we briefly review historical instances of stagflation and their accompanying monetary policy decisions. The distinctive experiences point to an economy whose structural drivers of growth have shifted over time, which underscores the idea that a policy enacted back in the 1970s may not have the same effect today as it did then.
Figure 1
Mild Cases
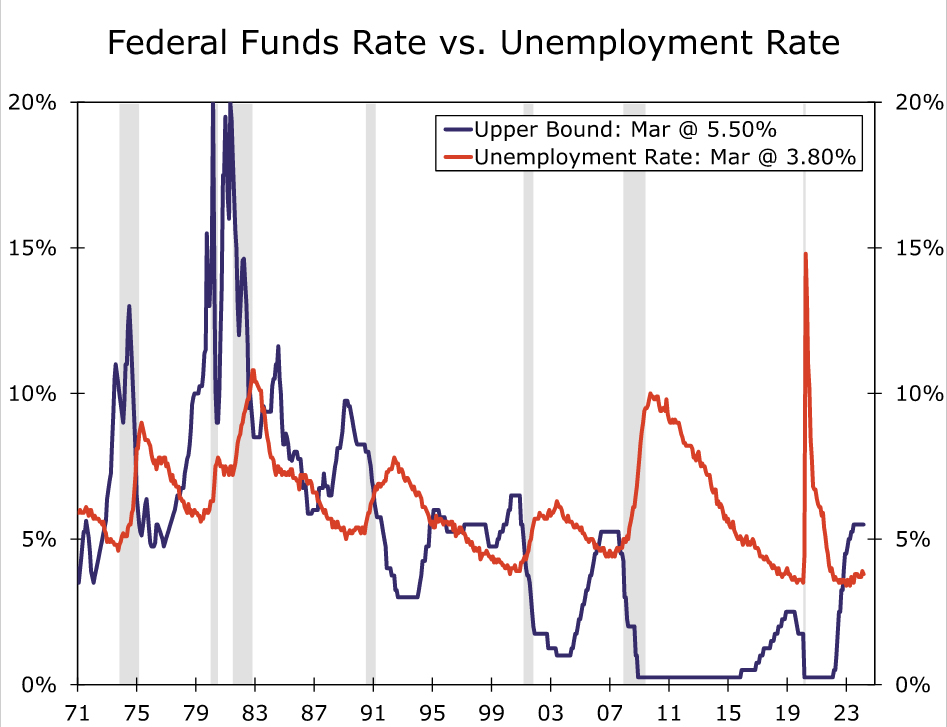
The first mild episode of stagflation occurred in 1971. The U.S. economy had just emerged from a recession that ended in the final quarter of 1970. Real GDP growth was sluggish, unemployment was elevated at around 6% and inflation was persistent. The Chair of the Federal Reserve at the time, Arthur Burns, was keen on supporting the labor market and moved forward with expansionary policy in late 1971 by lowering the target range of the fed funds rate by 200 bps (Figure 2). Around the same time, President Nixon ordered that the gold standard be abandoned, un-anchoring the U.S. dollar, and authorized a 90-day freeze on wages and prices to dampen inflation. The bold fiscal approach squashed inflation shortly after its implementation, and output growth quickly picked back up in 1972, which together effectively ended this mild case of stagflation. The reprieve was short-lived, however, as the following instance of stagflation in 1973-1975 saw the year-over-year change in the CPI rise to its highest since 1947.
The next two mild episodes occurred in 1976 and 1977-1978, both in the absence of a recession. In the lead up to these episodes, a 1973 oil embargo placed on the United States by a coalition of Middle Eastern countries sent domestic oil prices skyrocketing, as the U.S. was heavily reliant on petroleum imports at that time. While the embargo was lifted in 1974, a series of global oil production cutbacks led to a dramatic rise in energy prices throughout the 1970s, which passed through to higher wages via price indexation clauses in many union workers’ wage contracts.1 The bid up in oil and labor costs squeezed business profit margins and led to a trend rise in the unemployment rate throughout the decade, while the CPI also ripped higher on a year-over-year basis. Yet the paths of CPI inflation and the unemployment rate, while on upward trajectories, were incredibly variable, which obscured the view for monetary policymakers. The target range of the fed funds rate was mostly steady in 1976-1977 before drifting higher in 1978. Elevated and volatile inflation led to choppy real GDP growth, and that dynamic resulted in the break up of these two mild cases of stagflation.
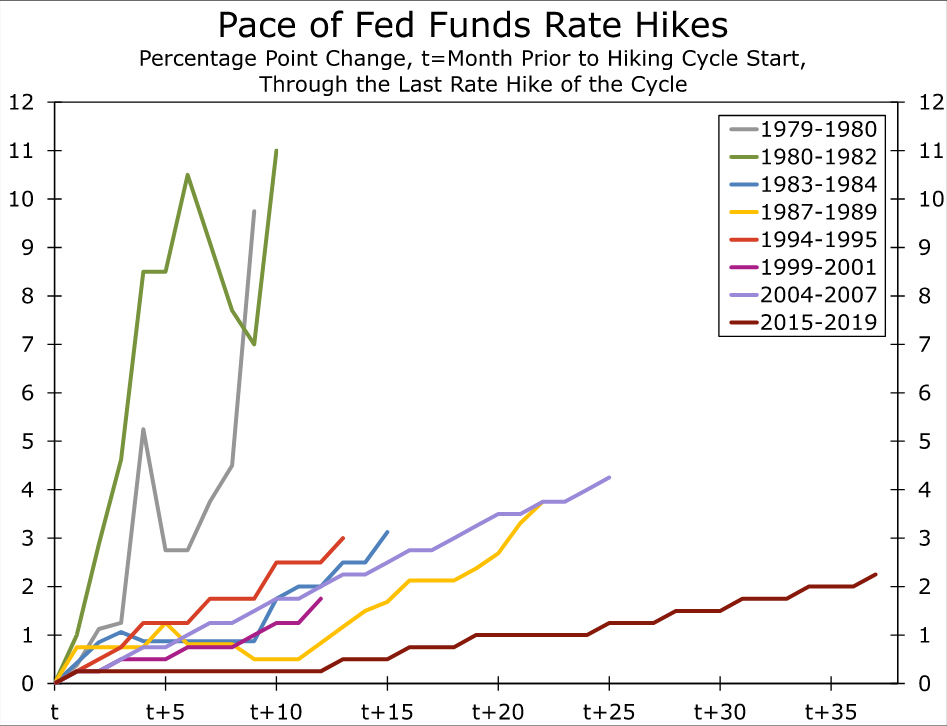
The final two mild episodes took place in 1995 and 2006 when inflation was relatively tame. In the first half of 1995, CPI inflation was above the 2% benchmark, and real GDP growth was roughly three percentage points below its prior cycle’s average of 4.4%. An aggressive monetary policy tightening cycle the year prior likely contributed to the slowdown in output growth—the FOMC had just wrapped up its 1994 tightening cycle, where it lifted the upper bound target by 300 bps in just 12 months (Figure 3). While price growth was strong, accelerating labor productivity amid the broad adoption of computers in the business sector eventually put downward pressure on inflation and supported economic output in the back half of the 1990s. In view of the pickup in the economy's potential output, the FOMC lowered the target range by just 75 bps in late 1995 and early 1996 to stimulate near-term activity before holding policy mostly steady at an upper bound of 5.25-5.50% through Q2-1998.
In 2006, real GDP growth slowed to a crawl for two straight quarters and the CPI edged up to 3-4%. Residential construction and consumer spending were losing momentum, while the dollar was depreciating. Similar to the 1995 episode, the FOMC had been gradually tightening policy at a 25-bps pace from 1.00% in mid-2004 to 5.25% by mid-2006. The updraft in borrowing costs weighed on output growth, while the weaker dollar and rising commodity prices placed upward pressure on inflation. Yet contained inflation expectations and tamped-down aggregate demand helped CPI inflation ease below the 2% target by Q3-2006, which ended this mild case of stagflation while the FOMC remained on hold at an upper bound of 5.00%.
Moderate Cases
In the first instance of moderate stagflation, CPI inflation picked up to above 3% in 1957 after averaging just 0.6% the prior two years. William McChesney Martin, the Chair of the Federal Reserve, responded with tight policy that led to a sharp recession that year. (The Fed primarily conducted monetary policy via changing bank reserve ratio requirements at the time). The credit crunch, as well as a marked decline in U.S. exports amid a global recession that coincided with the 1957 influenza pandemic, led to a sharp 4% contraction in real GDP from Q3-1957 to Q1-1958. The activity slowdown helped to significantly cool inflation, however, and the CPI returned to its prior cycle’s average of 0.9% by Q1-1959.
The second moderate stagflation episode occurred from 1989 to 1991. Inflation was gaining momentum as the new decade rolled around, and the FOMC was incrementally increasing the fed funds rate from 1988 through early 1989. However, economic activity started to wobble in 1989, causing the FOMC to pivot to an accommodative stance by mid-1989. Then, an energy shock during the Gulf War led to higher food and gas prices in late 1990, causing the CPI to peak at 6.2% year-over-year in Q4-1990. The mixture of the energy price shock and accommodative monetary policy led to a gradual pace of disinflation that kept the CPI above the 2% target through 1991 and real GDP growth that averaged roughly four percentage points below the prior cycle’s average.
The final two episodes of moderate stagflation took place in 2000-2001 and 2008. In the early 2000s, tight natural gas supplies and elevated medical care costs were notable drivers of elevated inflation. The FOMC was on hold at an upper bound target of 6.50% through most of 2000, but it cut rates as the calendar turned to 2001 amid a rise in the unemployment rate and the collapse of several technology companies. Real GDP growth was only mildly negative over the episode but remained below its prior cycle’s average of 3.8%. In 2008, skyrocketing gasoline and other commodity prices drove the pickup in the CPI. The FOMC started to cut rates in the second half of 2008 in response to mounting signs of significant financial market stress, a rising unemployment rate and declining consumer spending. Real GDP growth was choppy during this episode as the economic shocks of the financial crisis developed gradually. In short, the recessions during the 2001 and 2008 episodes of stagflation, while vastly different in depth, helped dampen inflation quickly. The CPI fell below 2% year-over-year before each recession ended.
Severe Cases
The first severe episode of stagflation took place 1969-1970, coinciding with a recession. In the run-up to this episode, President Lyndon B. Johnson’s Great Society programs had injected significant amounts of fiscal stimulus in the economy, while military investment was also ramping up amid the Vietnam War (Figure 4). The ballooning in fiscal spending coincided with a tight labor market; the unemployment rate was running below 4% in the late 1960s. At this time, the Federal Reserve was also following an “even-keel” policy where it would hold interest rates steady between the announcement of a Treasury issuance and the eventual bond sale.2
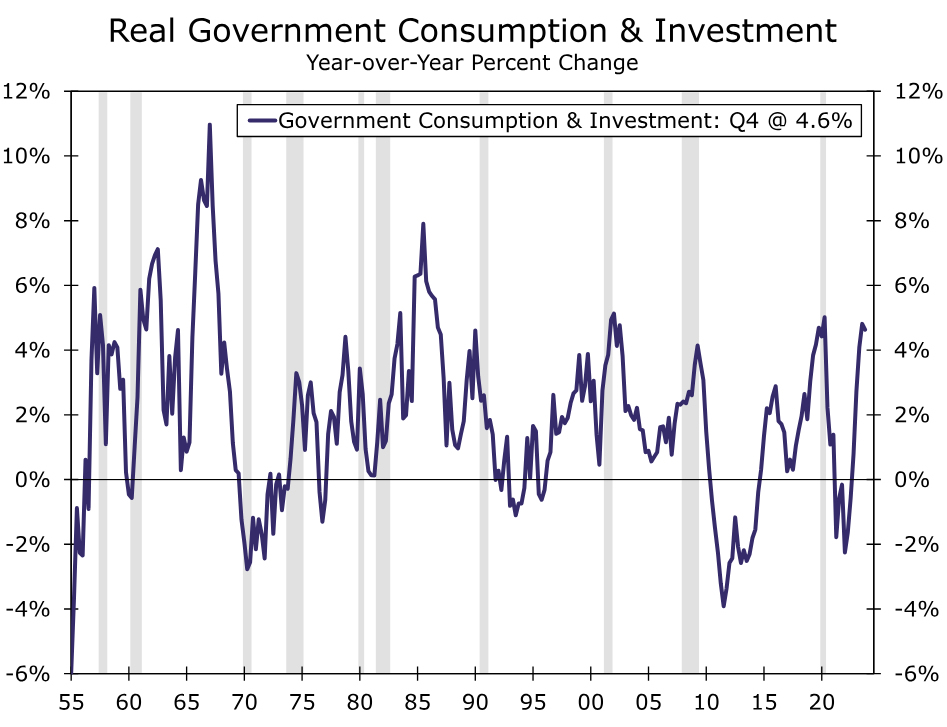
As government spending ramped up, Treasury issuances occurred frequently and curtailed the Fed’s ability to conduct monetary policy effectively. Ultimately, expansionary fiscal policy, combined with an economy near full employment, appeared to be the primary culprits of the 1969-1970 episode's high inflation. On a year-ago basis, the CPI was more than three standard deviations above the prior cycle’s average of 1.4% for seven consecutive quarters, while real GDP growth trended well below the prior cycle’s average of 6.7%.
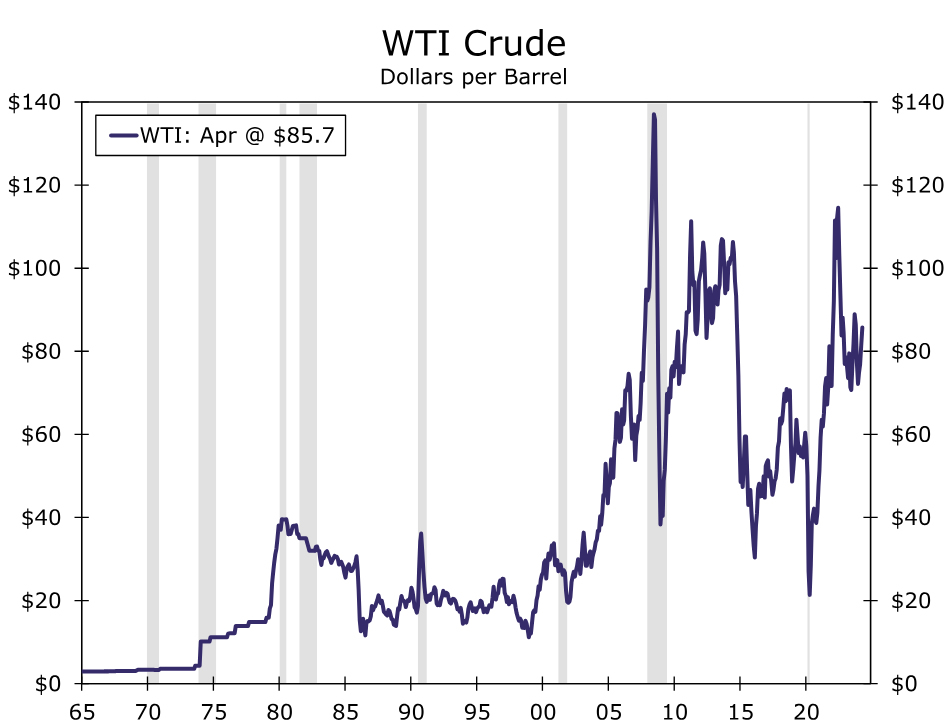
The next two episodes of severe stagflation occurred in 1973-1975 (7 quarters) and 1979-1982 (16 quarters). Two major oil price surges (Figure 5)—the first associated with the aforementioned oil embargo on the United States in 1973 and the second associated with the Iranian Revolution in 1978-1979—sent shock waves through the economy, leading to elevated CPI inflation of the cost-push variety. At the time, the consensus among economists was that monetary policy tools were not effective at remedying inflationary shocks caused by exogenous events, but that they were still instrumental to maximizing employment. Thus the FOMC primarily enacted accommodative policy during these episodes to support the employment side of the economy, which was struggling underneath the weight of sluggish output growth amid quickly rising and variable business input costs.
With the Federal Reserve generally on an accommodative stance, the federal government instituted policies aimed at halting robust price growth. As mentioned in the Mild Cases section, President Nixon ended the dollar's convertibility to gold, which contributed to the eventual end of the Bretton Woods System, and enacted price and wage controls to slow inflation in 1971.3 The Ford Administration introduced the Whip Inflation Now (WIN) program in 1974, which encouraged consumers to voluntarily cut back on spending.4 Both programs were largely unsuccessful at stamping out inflation’s underlying strength, especially as the Federal Reserve was maintaining a counteracting accommodative stance at the same time. Momentum in input prices pushed the CPI higher through the back half of the 1970s and the year-over-year rate peaked at around 14.5% in 1980. The 1973-1975 and 1979-1982 stagflation episodes are broken up into two separate instances because inflation slowed in the middle of the decade closer to 5%-6% while real GDP growth treaded water at around a 2% average.
The final episode of stagflation occurred in the wake of the COVID pandemic, which is a topic that we will turn to in the final installment of this series. For now, we can see that historical instances of stagflation have often been met with accommodative monetary policy to support employment, despite elevated price growth. The degree to which the Federal Reserve's accommodative stance exacerbated stagflation depends on the drivers of the inflationary bouts themselves and whether the economy's structure would entrench (e.g., the 1970s) or dilute (e.g., 2000-2001) price momentum. External factors, such as oil prices shocks, were associated with severe episodes of stagflation, but expansionary fiscal policy enacted amid a tight labor market also played a role. Those dynamics mirror the current environment, as the unemployment rate is at a decades' low and the fiscal deficit is swelling. Will the economy suffer from stagflation in the near term?5
Endnotes
1 - Around 60% of workers under collective bargaining agreements had cost of living clauses in their contracts in the 1970s. Consequently, the oil price’s shock to inflation led to an automatic acceleration in wages, which pushed input costs up further.
2 - See a 1967 memo to the Federal Open Market Committee on the Committee's interpretation of the "Even Keel" Policy.
3 - See a short explainer from the International Monetary Fund on the end of the Bretton Woods System.
4 - See a short article from the Federal Reserve Bank of New York's research library for more information on the Whip Inflation Now campaign.
5 – This series is based on a 2024 American Economic Association Annual Meeting paper by Azhar Iqbal and Nicole Cervi titled "Characterizing Stagflation into Mild, Moderate and Severe Episodes: A New Approach". Please contact the authors if interested in the full paper.
Euro Turns to GDP and Inflation Data for a Lifeline
- Euro loses ground as European Central Bank signals rate cuts
- But only against US dollar - holds strong against pound and yen
- Eurozone GDP and inflation stats on Tuesday will decide what’s next
Imminent rate cuts bruise euro
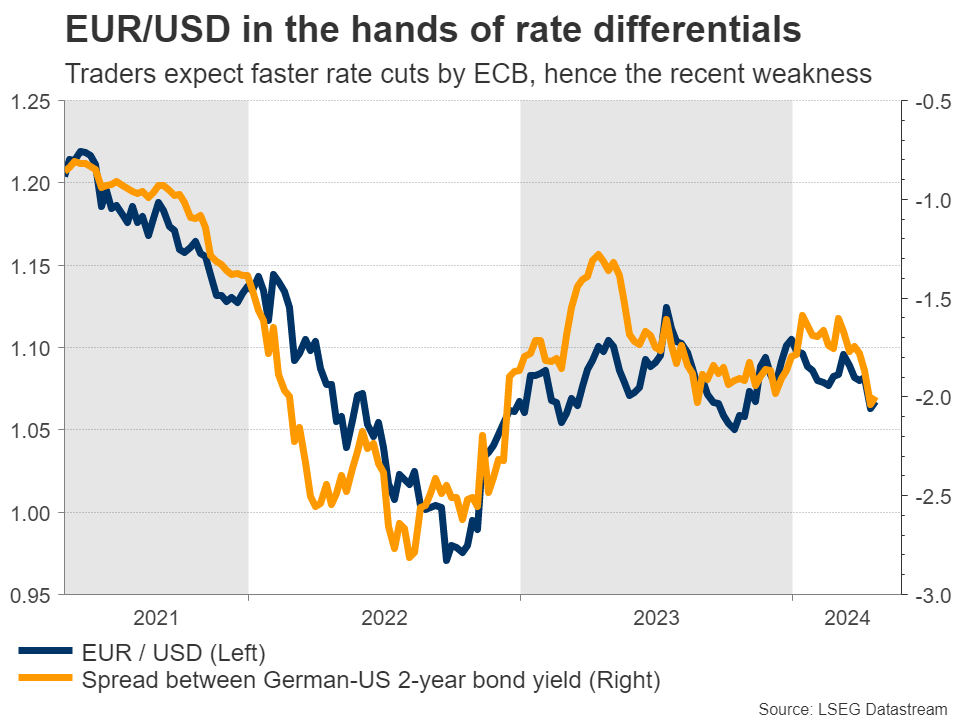
It’s been a difficult year for the euro, which has already declined 3% against the dollar as the economic divergence between the Eurozone and the United States has convinced investors the ECB is set to cut interest rates faster and deeper than the Fed.
Economic growth in the euro area has been stagnant for about a year now and inflation has cooled rapidly, falling to just 2.4% in March. As such, ECB officials have made it abundantly clear they intend to slash rates in June, so that looks almost like a done deal. The real question is how they will proceed afterwards.
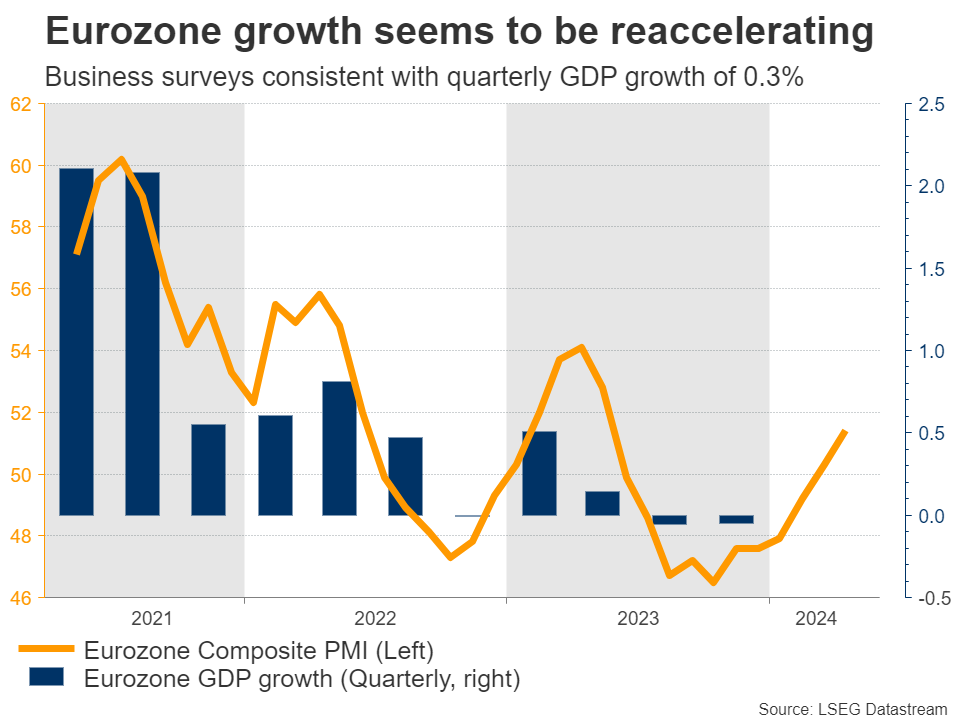
In this sense, some leading indicators have flashed encouraging signals lately, with business surveys pointing to a reacceleration in growth and inflationary pressures. If that is reflected in official data soon, the ECB might decide to ‘play it slow’ with any subsequent rate cuts beyond June.
GDP and inflation data on the radar
Next week, the spotlight will fall on the first estimate of Eurozone GDP growth for Q1 and inflation stats for April, both due on Tuesday. The unemployment rate for March will follow on Friday.
Business surveys were consistent with GDP expanding by 0.3% in the first quarter compared to the preceding quarter, when growth was flat. The same surveys warned that inflation fired up again in April as companies raised their selling prices at a faster clip, reflecting rising wage and energy costs.
A reacceleration in both growth and inflation could throw the euro a much-needed lifeline, bolstering the single currency through the interest rate channel as traders unwind some bets of rapid ECB rate cuts.
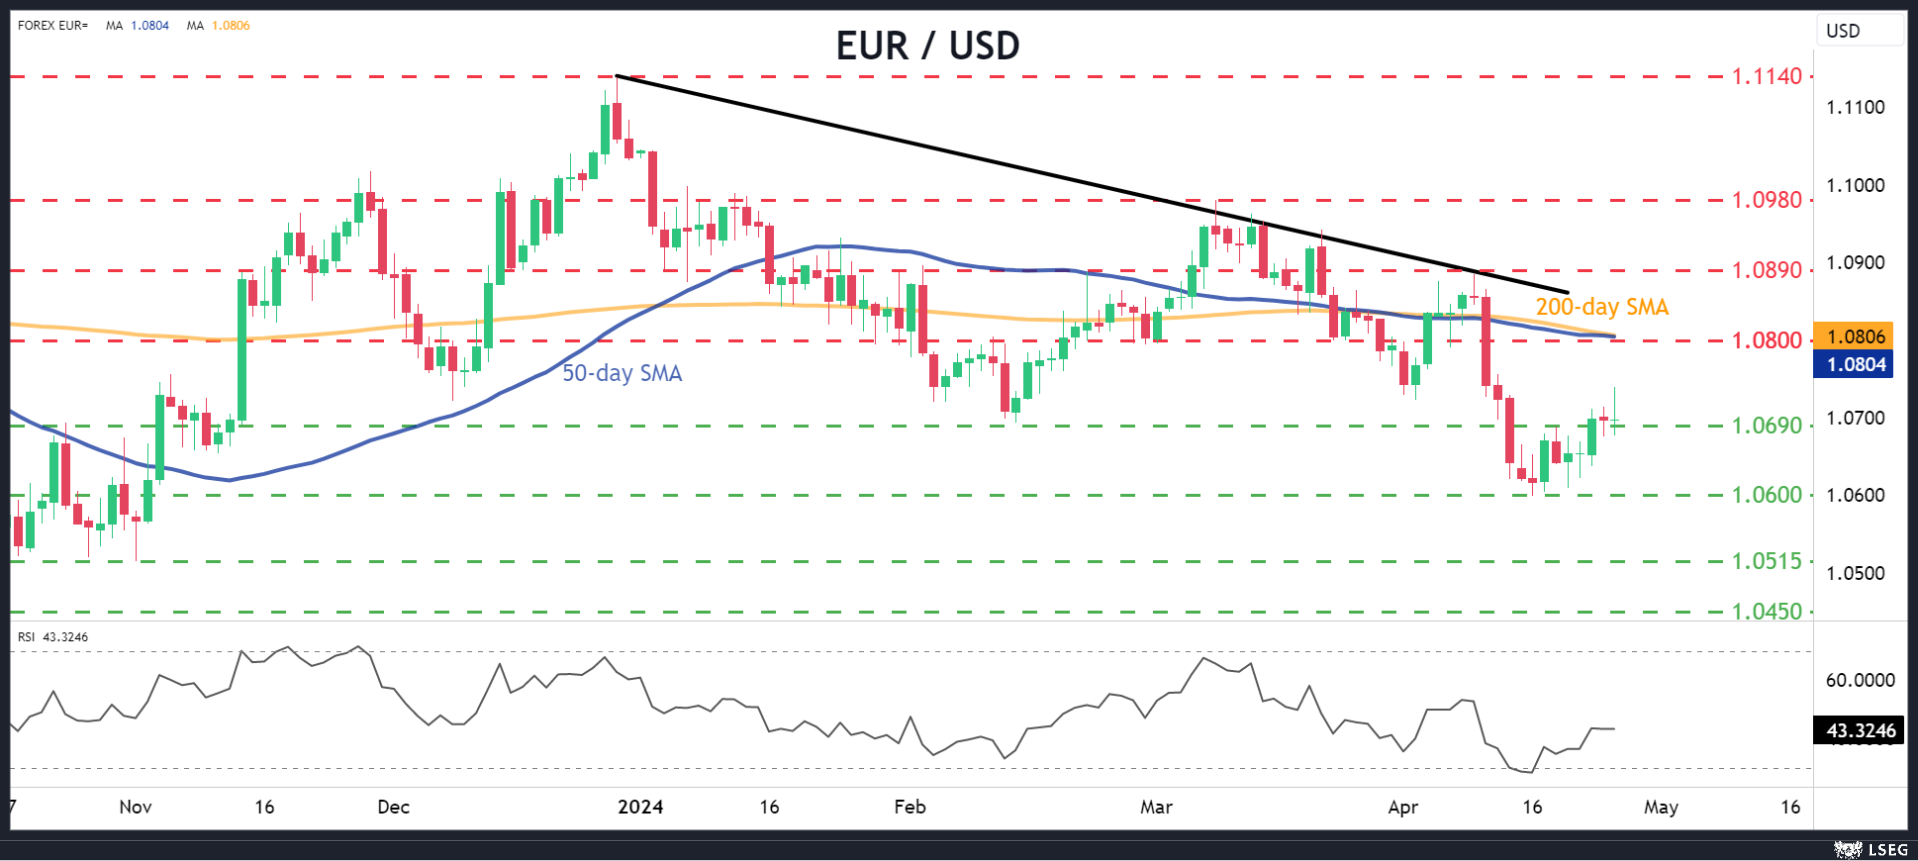
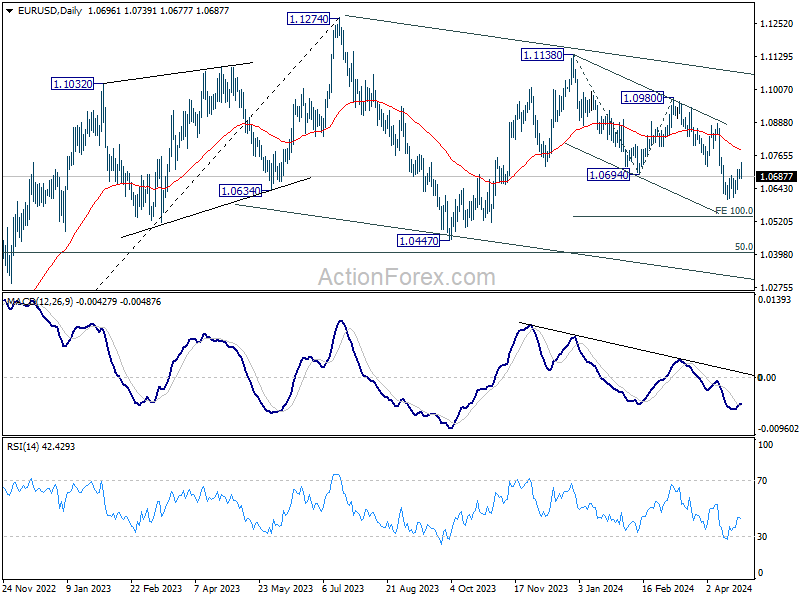
Looking at the euro/dollar chart, the pair has been trading below a downtrend line this year with a clear structure of lower highs and lower lows, which keeps the prevailing trend negative.
That said, a strong batch of data could allow the latest recovery to continue, perhaps towards 1.0800, a region reinforced by the 50- and 200-day simple moving averages (SMAs).
On the downside, a disappointment in the upcoming data can bring the pair under renewed selling interest. A potential drop back below the 1.0690 zone would shift the focus towards the April lows near 1.0600.
Euro outlook
In the bigger picture, the euro’s losses this year have been concentrated mostly against the mighty US dollar. Against the British pound, the single currency has only lost 1%, while it has risen almost 7% against the sinking Japanese yen.
Judging by economic performance, these patterns can persist. The US economy is the strongest in terms of growth, so the dollar may continue to outperform in the foreseeable future, especially if stock markets remain shaky. The Eurozone and UK economies are in similar shape, which suggests those two currencies could continue to trade almost in lockstep.
Hence, the euro’s best chance at further gains may be against the yield-starved Japanese yen. In this sense, the main risk is the prospect of FX intervention by Tokyo. That said, the yen might need to fall even further before authorities step in.
US Economy: Slower Growth With Stronger Inflation
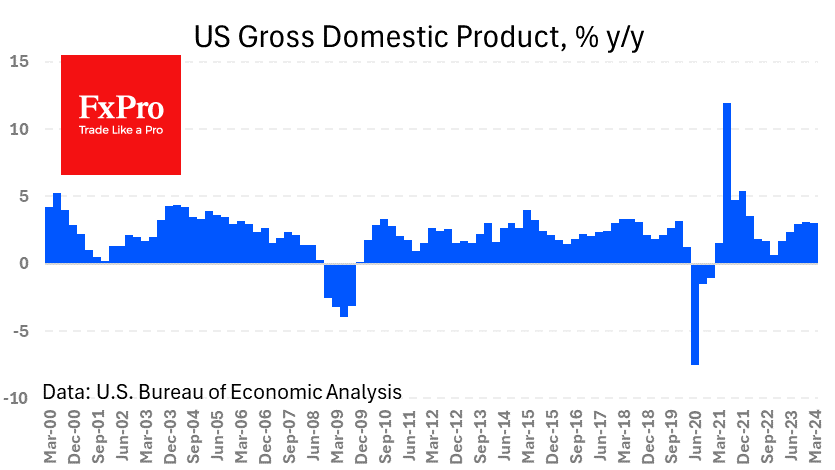
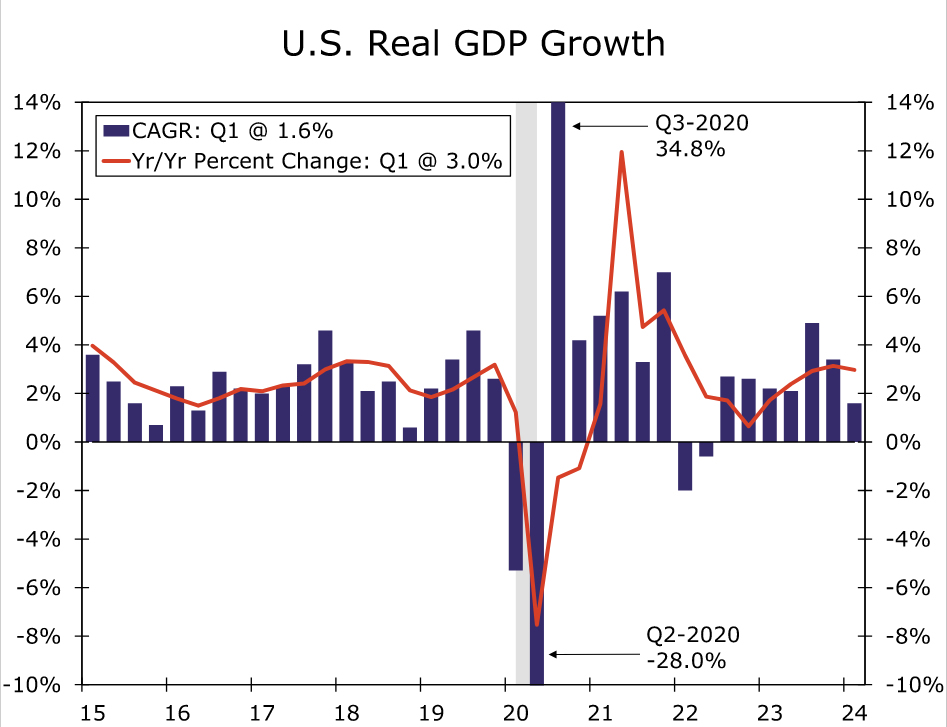
The dollar strengthened, and stocks fell after statistical data from the US. The focus was on the preliminary estimate of GDP for the first quarter. Annualised quarterly growth came in at just 1.6%, down from the 2.5% and 3.4% previously forecast. Disappointment increased given that exceeding forecasts has become the norm. GDP growth for the same quarter a year earlier fell to 3.0% from 3.1%.
In contrast, the price index showed a 3.1% increase from 1.6% previously. Thus, the U.S. economy simultaneously faced increased inflationary pressures and slowing growth. This has caused even more concerns among those who fear stagflation.
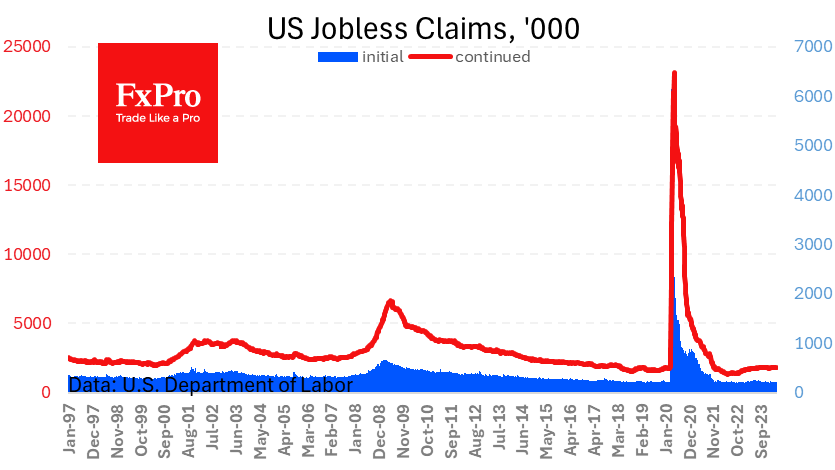
At the same time, a new batch of very positive weekly unemployment data was released. Initial jobless claims fell to 207K, the lowest since February. The number of repeat claims fell to 1781K – the lowest in three months. It is worth noting that these are very low figures by historical standards. The tense situation in the labour market will create domestic inflationary pressures even if commodity prices start to decline.
Pound Edges Higher After Soft US GDP
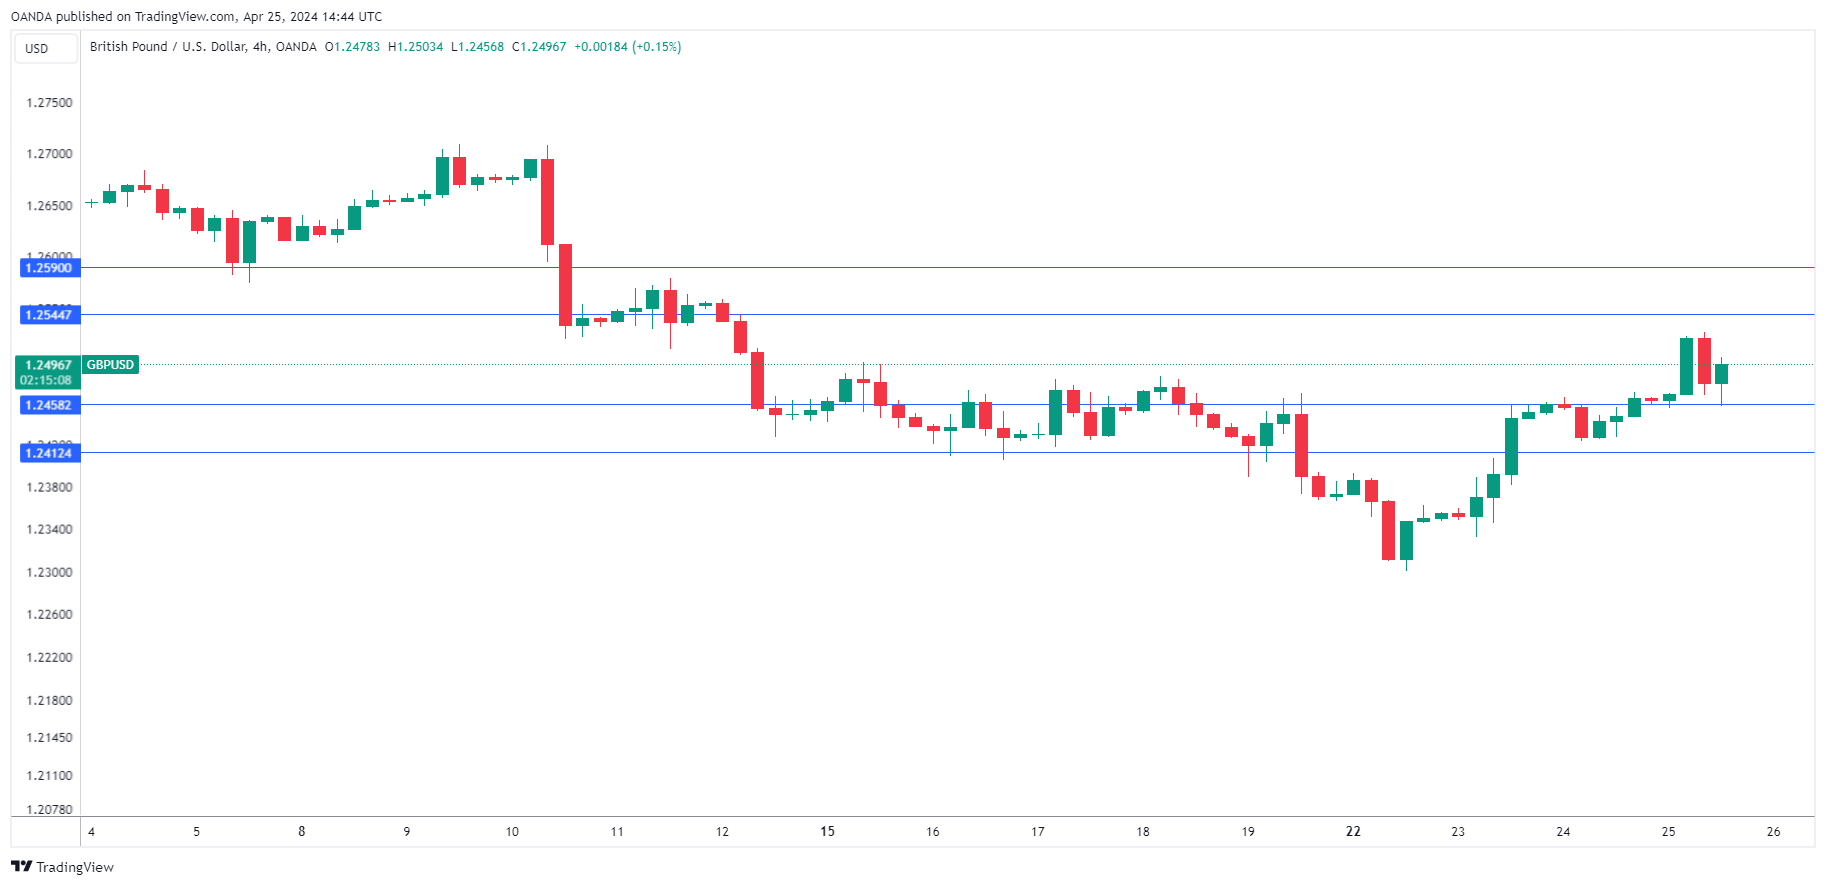
The British is in positive territory on Thursday. In the North American session, GBP/USD is trading at 1.2492, up 0.23%.
US GDP slows to 1.6%
Is the US economy finally slowing down? Recent key indicators, from nonfarm payrolls to consumer inflation have been stronger than expected, but the markets could hear the “thud” of today’s initial GDP for the first quarter, which at 1.6% y/y missed the market estimate of 2.5% and was sharply lower the Q4 2023 reading of 3.4%. Consumer spending slipped to 2.5%, down from 3.4% in Q 2023.
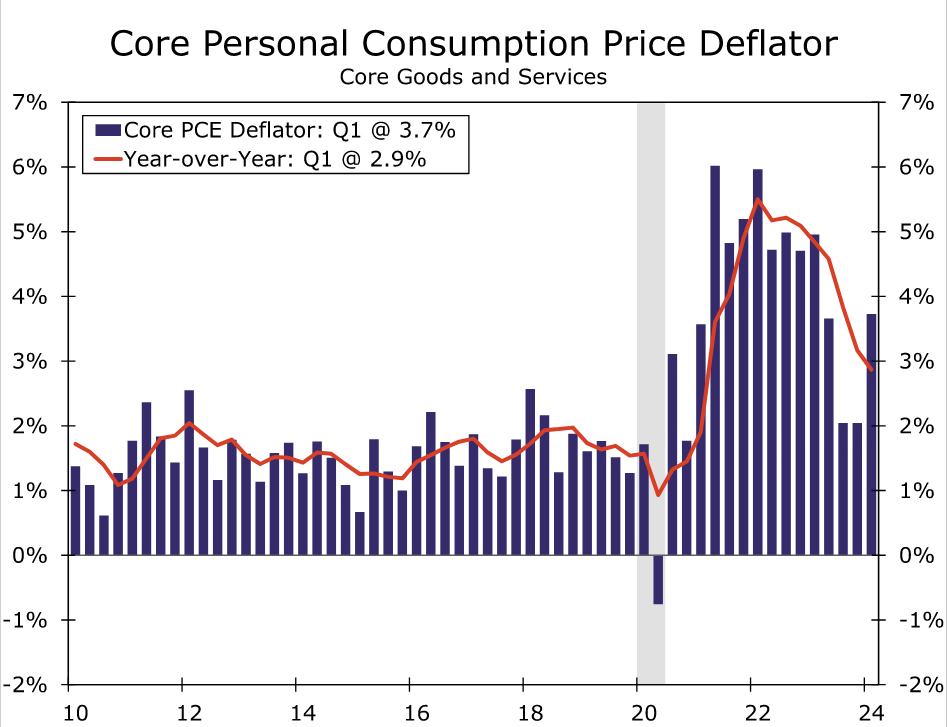
Meanwhile, there was bad news on the inflation front, as the personal expenditures price index (PCE), which is considered the Fed’s preferred inflation gauge, jumped 3.4% y/y in the first quarter, up sharply from 1.8% in the fourth quarter and its largest gain in a year. Core PCE, which excludes food and energy, rose 3.7%, above the market estimate of 3% and crushing the fourth quarter gain of 2%.
Today’s report is a discouraging sign for the Fed, as growth was lower than anticipated and inflation was higher than expected. The rise in inflation shouldn’t come as a major surprise though, as consumer inflation has risen in the past two releases.
The markets reacted negatively to the news, with investors now pricing in just one rate cut in 2024, according to the CME FedWatch tool. Market expectations for a rate cut have fizzled since January, when the markets were exuberantly pricing in up five or six rate cuts during the year. A rate hike, which would have been unthinkable at the start of the year, is a real possibility if the economy remains in good shape and inflation continues to rise – the options markets have priced in a 20% probability of a rate hike within the next 12 months.
GBP/USD Technical
- GBP/USD tested support at 1.2458 lower. Below, there is support at 1.2412
- There is resistance at 1.2544 and 1.2590
Sunset Market Commentary
Markets
Asian markets mostly started the day in risk-off modus after a disappointing outlook from tech bellwether Meta at its earnings report yesterday after the close of US markets. This also spilled over to European equities this morning. The risk-off again didn’t trigger any real safe haven bid for core bond markets. Declines in EMU yields were negligeable given recent rise. In line with recent other data evidence, German consumer confidence (GFK) also improved in April, (-24.2 from -27.3) supporting the idea of a services-driven recovery. US yields drifted cautiously higher going into the release of the first estimate of Q1 US GDP growth. The outcome was a bit confusing. US Q1 growth slowed 1.6% Q/Qa from 3.4% in Q4 2023 and 2.5% expected. However, domestic spending remained solid with personal consumption still growing 2.5% on solid demand for services (consumption growth on goods was slightly negative). Gross private investment (3.2%) and government consumption (1.2%) also added to growth. The downward surprise was mainly due to a negative contribution from inventories (-0.37% subtraction) and net exports (-0.86% subtraction). At least as important for markets as growth, price indicators again surprised to the upside. The global price index rose 3.1% from 1.6%. The core PCE deflator jumped from 2.0% to 3.7%! Yields briefly declined upon the release, but second reading soon made market realize that solid domestic demand and stubbornly high price indices won’t provide the Fed any comfort to start easing policy anytime soon. US yields currently add between 8 bps (2-y) and 6.0 bps (30-y). A low jobless claims figure (207k) only pointed in the same direction. The 2-y yield is topping the 5.0% mark. Markets are further scaling back expectations for two Fed rate cuts by the end of the year. A first 25 bps step is pushed back to November and a <50% chance is seen for an additional step in December. German yields follow the rise in the US at a distance, adding 3-5 bps across the curve and setting new YtD top levels. Higher (real) yields continue to put pressure on equity markets. The decline in EuroStoxx50 accelerated after the GDP release (-1.50%) US equities opened with losses of up to 2.0% (Nasdaq). The dollar gains, but rather modestly given the rise in US yields and the risk-off sentiment. DXY reversed an earlier intraday declined to again trade just below 106. EUR/USD slipped back below the 1.07 big figure (1.0680). USD/JPY is setting another multi-year top at 155.5 going into tomorrow’s BoJ policy decision. Sterling again slightly outperforms the euro despite CBI data showing a poor April retail sales performance. EUR/GBP is drifting further below the 0.86 (previous) support area (0.8575).
News & Views
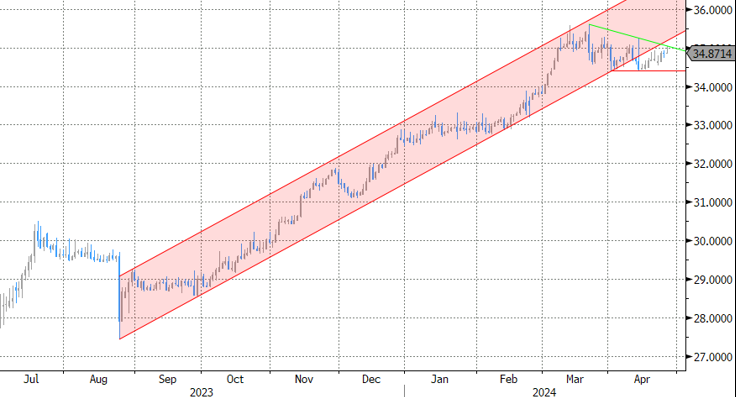
The Turkish central bank (CBRT) kept its policy rate unchanged at 50% today after an unexpected 500 bps rate hike in March. The policy statement remains hawkish with a readiness to tighten further in case of a significant and persistent deterioration in inflation (expectations). For the time being though, the onus is watching how previous tightening with a lagged effect impacts credit conditions and domestic demand. The underlying trend in Turkish inflation was higher than expected in March with resilient domestic demand, the high level of and stickiness in services inflation, inflation expectations, pricing behavior, geopolitical risks and food prices all posing inflationary threats. The CBRT eventually hopes to bring inflation back to the 5% target over the medium term via monetary and financial conditions that bring around a moderation in domestic demand, a real appreciation of the Turkish lira and an improvement in inflation expectations. They hope to see green shoots in the disinflation process in the second half of this year. TRY isn’t impressed yet and holds near all-time lows at EUR/TRY 34.87.
French President Macron in a speech at the Sorbonne University in Paris called for an overhaul of EMU monetary policy. He suggested that inflation cannot be the sole target of the ECB and that there is need for a growth or decarbonization target as well. Macron blamed China and the US for over-subsidizing their companies and wants to double the EU’s budgetary capacity to ramp up public investment but also for defense. Macron argues that the EU can no longer rely on the US for its security. In order to achieve this, the French president wants to build a capital markets union in 12 months!
Graphs
US 2-y yield returns north of 5% as markets see ever lower probability of Fed rate cuts this year.
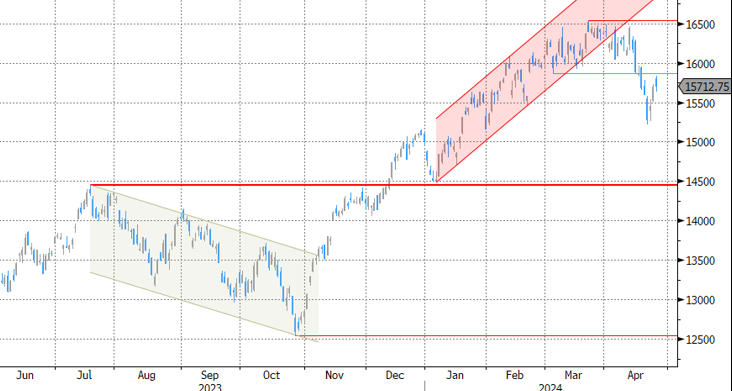
Nasdaq: Equities feeling headwinds from higher (real) yields
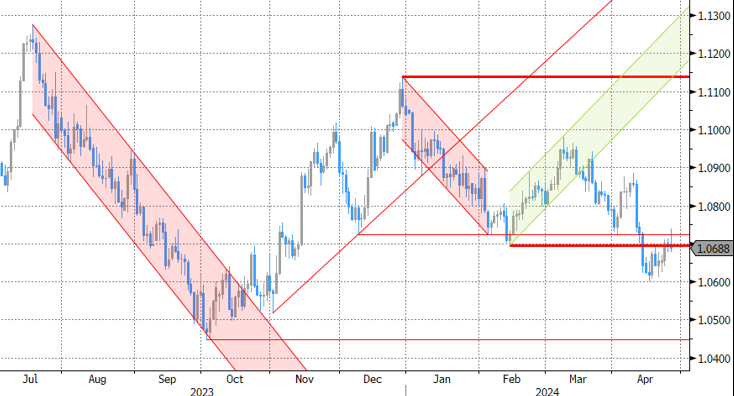
EUR/USD. Dollar rebounds (cautiously) as US economy shows solid domestic demand and sticky prices.
EUR/TRY: CBRT ‘tightening bias’ not enough to support the lira as EM currencies are under pressure globally.
Wolf in Sheep’s Clothing: Soft GDP Hides Surging Spending
Summary
Real GDP grew at only a 1.6% annualized pace in Q1, held back by trade and inventories. Consumer spending in the service sector is not slowing, in fact, it is ramping up at a rate seldom seen in the past 20 years. That is problematic as core PCE prices are picking up again in defiance of higher rates.
Not the Droids You're Looking For
It is tempting to see today's miss in GDP as a welcome indication that curiously strong growth is at last giving way to the inevitable gravity of higher rates and thus the first bit of data needed to warrant eventual rate cuts by the Federal Reserve. Despite the fact that headline growth came in almost a full percentage point below expectations, we see little in today's report that will warrant much legitimate justification for a softer monetary policy stance.
After an unsettling headline miss, the picture that emerges from the details in today's GDP report is actually more of the same in terms of the factors that are standing in the way of a lower rate environment.
Consumers are still spending, they are just prioritizing activities in the service sector. Spending on non-durable goods stalled in the quarter while outlays on big-ticket durable goods items contracted at a 1.2% annualized rate. That was not nearly enough to offset the much larger services category, where consumers spared no expense in the first quarter. Like a relief pitcher in the late innings, services spending came in throwing heat in the first quarter with a blistering 4.0% annualized growth rate—the fastest surge in consumer services spending since the stimulus-fueled binge in 2021. Excluding 2020 & 2021, services has only come in above 4.0% three times in the last two decades (once in 2014 and twice in 2004). Higher rates are intended to cool consumer demand; the trouble for the Fed is: it's not working.
The core PCE deflator rose at a 3.7% annualized rate in Q1, a notable acceleration after a sharp slowing the prior two quarters (chart). This data implies a strong 0.4% increase in March core PCE, set to be released tomorrow. Services excluding energy and housing rose at a 5.1% annualized rate in Q1, the fastest in a year.
While higher rates may be restraining spending on goods that may be exposed to higher borrowing costs, households keep pulling out all the stops to keep spending. Real disposable income rose at a slower rate in the first quarter, but remained positive and households are saving less of that income on a monthly basis. The personal saving rate slipped to 3.6% during the quarter, which marks the lowest rate at which households have saved since the end of 2022.
So why the long face? Why was the headline number so weak? Partly because there was a significant drag from trade. Net exports exerted a drag of 0.86 percentage points on the headline number. Without that drag, the headline number would have come in precisely in line with consensus estimates. While goods spending is weak, businesses are playing it smart by not importing too much in the way of goods. Goods imports subtracted about three quarters of a percent from growth in the first quarter which swamped only tepid growth in exports during the same period.
Businesses also look to be managing inventory levels fairly well. Real private inventories rose by $35.4 billion in Q1, but since they rose at a slower pace than in the fourth quarter of last year, they again resulted in a drag on headline growth, subtracting 0.35 percentage points from GDP last quarter.
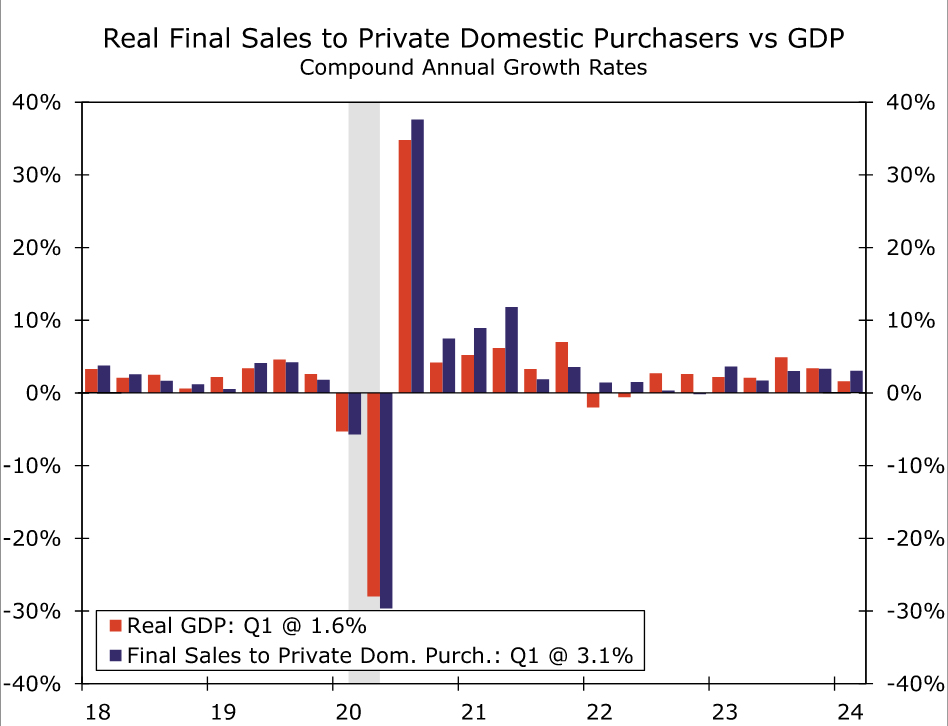
In looking through some of these volatile factors, underlying growth remained quite solid in the first quarter. Real final sales to domestic private purchasers, which strips away net exports, inventories and government investment and gets at the underlying trend in domestic demand, rose at a 3.1% annualized rate during the quarter. The last three quarterly prints for this measure have all come in at 3.0% or higher, signaling healthy and stable growth. Don't underestimate this economy.
BTCUSD Retreats After Unsuccessful Test of 50-SMA
- BTCUSD regains ground in the halving aftermath
- But the price gets rejected at the 50-day SMA
- Momentum indicators are tilted to the downside
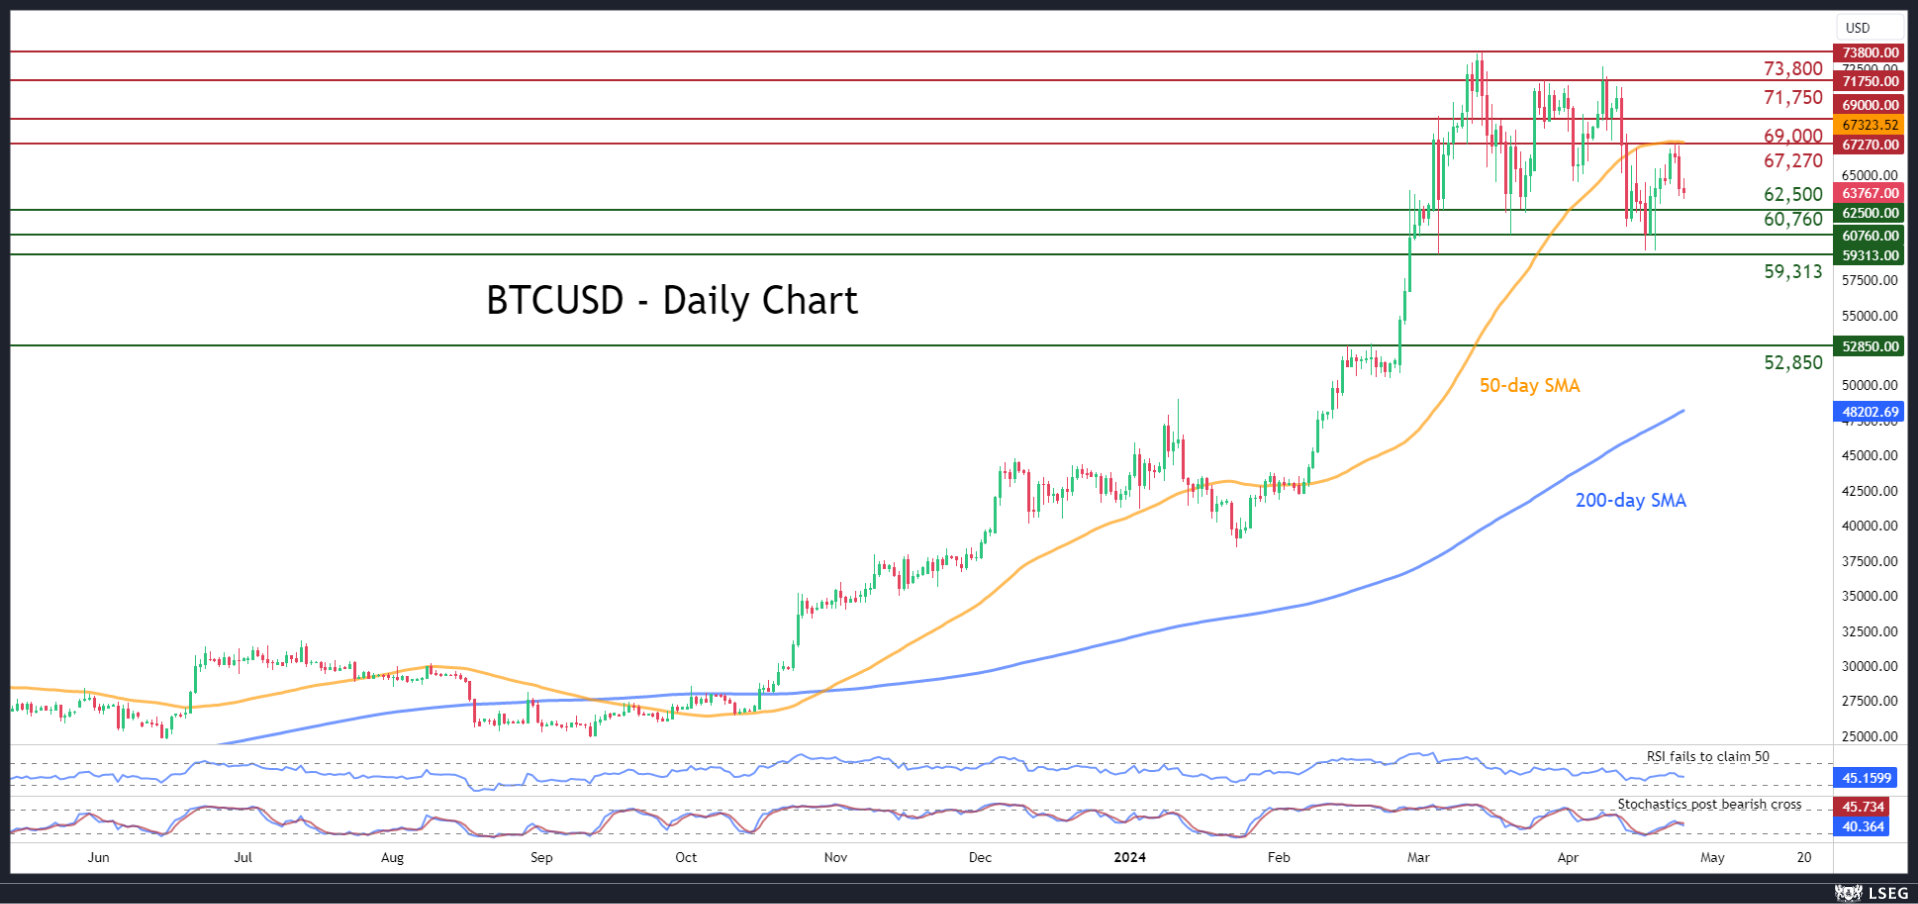
BTCUSD (Bitcoin) had been in a slow but steady recovery after the completion of the halving event on April 19, erasing a significant part of its recent slump. However, the rebound appears to be on pause for now following the price’s inability to conquer the 50-day simple moving average (SMA).Should Bitcoin reverse lower, the March support of 62,500 might curb initial downside attempts. Sliding beneath that floor, the price could challenge 60,760 ahead of 59,313, both of which have provided support during March. A violation of the latter may set the stage for the February resistance zone of 52,850.
On the flipside, if buying pressures re-emerge, the price might revisit its recent resistance of 67,270, which overlaps with the 50-day SMA. Conquering that zone, the bulls might attack 69,000, a level that acted both as support and resistance in recent months. A break above that region could pave the way for the March resistance of 71,750.
In brief, BTCUSD has been on the retreat after its recent rejection at the 50-day SMA. Can the bulls strike back?
EUR/USD Mid-Day Outlook
.Daily Pivots: (S1) 1.0680; (P) 1.0697; (R1) 1.0716; More...
EUR/USD retreated after brief breach of 1.0723 support turned resistance and intraday bias remains neutral. Break of 1.0677 support will indicate rejection by 1.0723, and turn bias back to the downside. EUR/USD should then resume larger down trend through 1.0601 low. Nevertheless, firm break of 1.0723 will bring stronger rebound to 55 D EMA (now at 1.0786) instead.
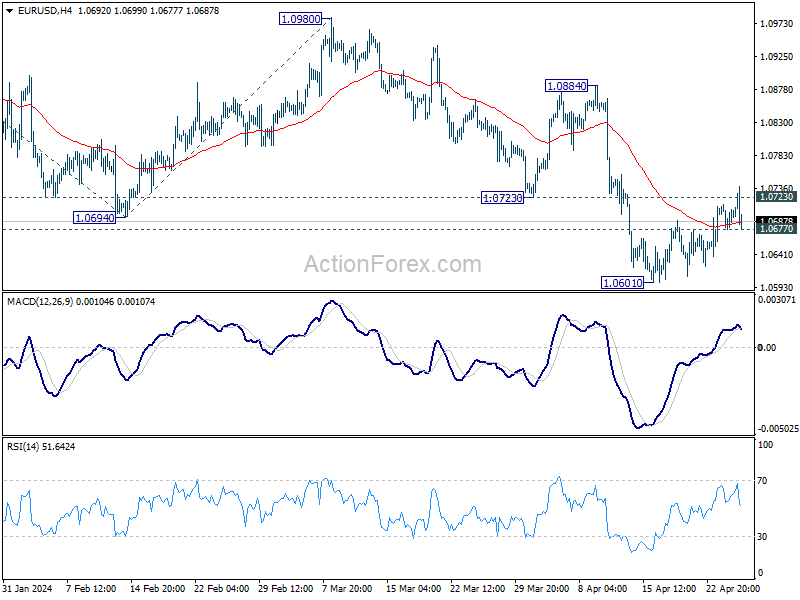
In the bigger picture, price actions from 1.1274 are viewed as a corrective pattern to rise from 0.9534 (2022 low). Current fall from 1.1138 is seen as the third leg. While deeper decline is would be seen to 1.0447 and possibly below, Strong support should emerge from 61.8% retracement of 0.9534 to 1.1274 at 1.0199 to complete the correction.