Sample Category Title
AUD/USD: Extended Recovery Attacks Key Resistance Zone Again
Strong rally extends into fourth consecutive day and retests pivotal barriers at 0.6526/29 (converged 200/55DMA’s) which capped attack previous day.
Fresh strength offsets for now bearish signal on formation of daily inverted hammer candlestick on Wednesday, left after upside rejection and subsequent pullback.
Aussie dollar was boosted by hotter than expected Australia’s inflation and keeps bullish sentiment, however, reaction at key barriers at 0.6526/36 zone (converged 200/55DMA’sc / Fibo 61.8% of 0.6644/0.6362 bear-leg) is likely to define near-term direction.
Daily studies show overbought stochastic and 14-d momentum still in the negative territory, which may negatively impact near-term action, with repeated failure to clear pivotal barriers, to add to warnings about possible recovery stall.
On the other hand, daily cloud is above the price and twists next week that might be magnetic.
Markets await release of key US economic data today (GDP) and on Friday (PCE) expecting more details about the condition of the US economy and inflation and fresh signals about Fed’s next steps on monetary policy.
Res: 0.6536; 0.6552; 0.6571; 0.6585.
Sup: 0.6500; 0.6469; 0.6453; 0.6428.
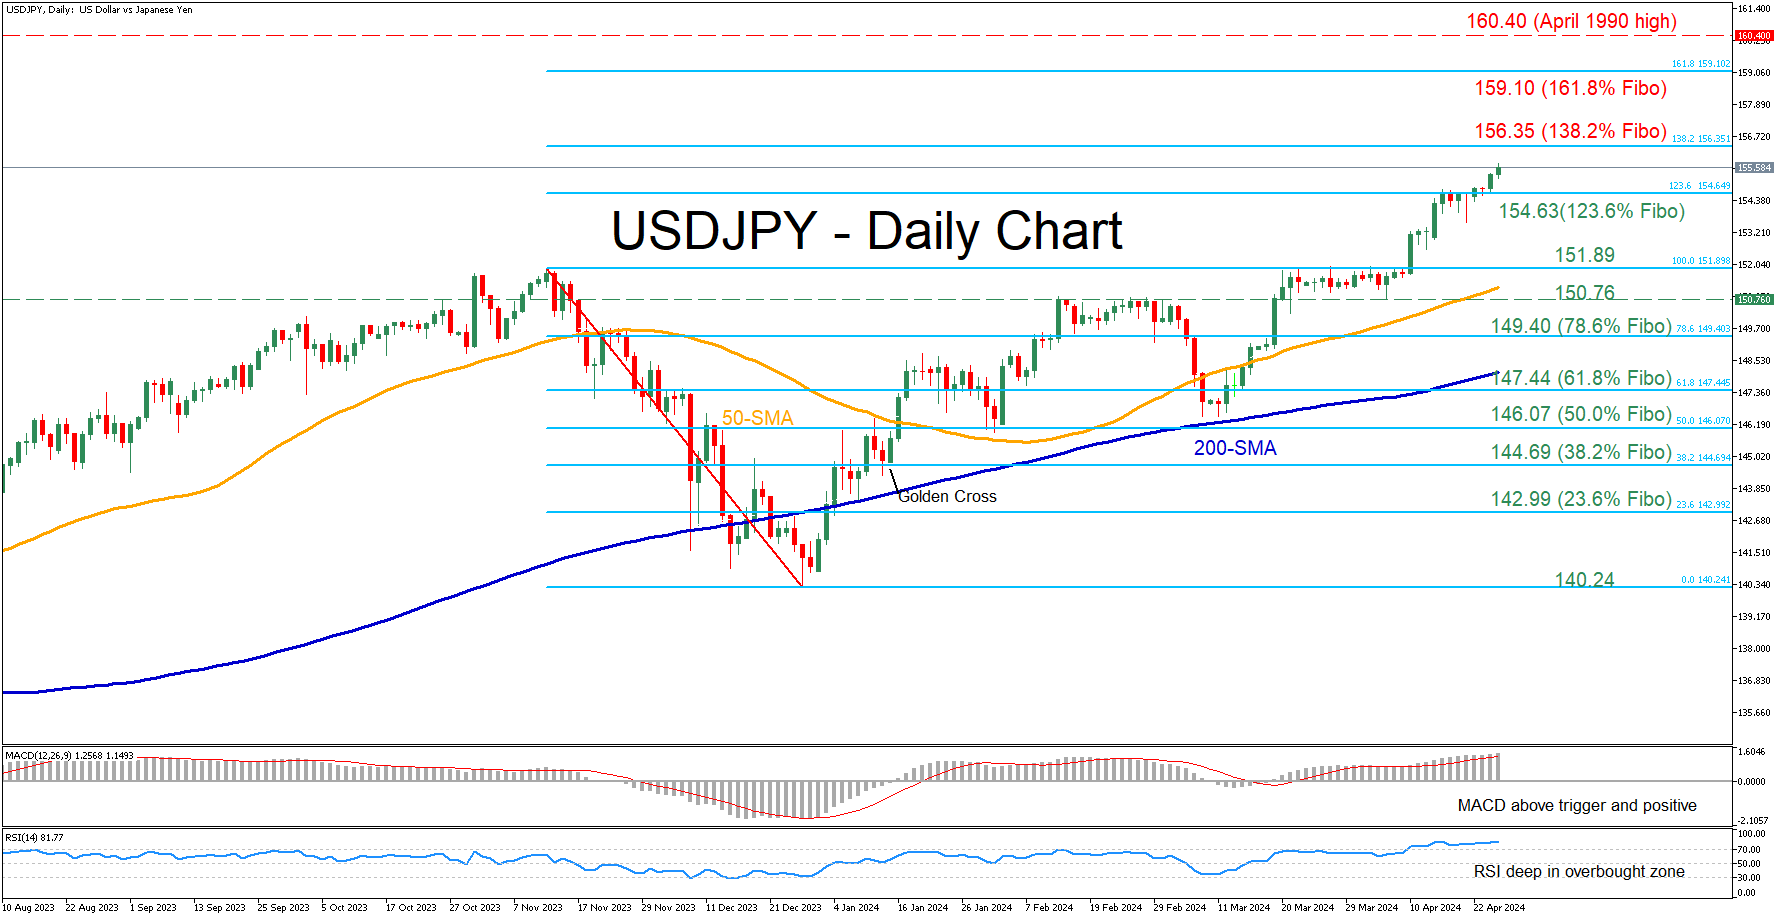
USDJPY Advances to Fresh 34-year High
- USDJPY trades at its highest level since April 1990
- Momentum indicators flag extremely overbought conditions
- For now, Japanese authorities seem reluctant to intervene
USDJPY has been in a steady uptrend after finding its feet near the 200-day simple moving average (SMA) in early March. On Thursday, the pair posted a fresh 34-year peak, extending its rally within a territory that the Japanese authorities were expected to defend.
Should bullish pressures persist, the price could storm to fresh multi-year highs before it challenges 154.64, which is the 123.6% Fibonacci extension of the 151.90-140.24 downleg. Further upside attempts could then come to a halt at the 161.8% Fibo of 159.10. Conquering this barricade, the bulls may attack the April 1990 high of 160.40.
On the flipside, if the pair experiences a pullback, initial support might be found at the 123.6% Fibo of 154.63. Lower, the November 2023 high of 151.89 could prove to be the next barrier for the bears to overcome. Failing to halt there, the price could descend towards the April support of 150.76.
In brief, USDJPY has been posting a series of consecutive multi-year highs, but the advance is starting to look overdone from a technical perspective.
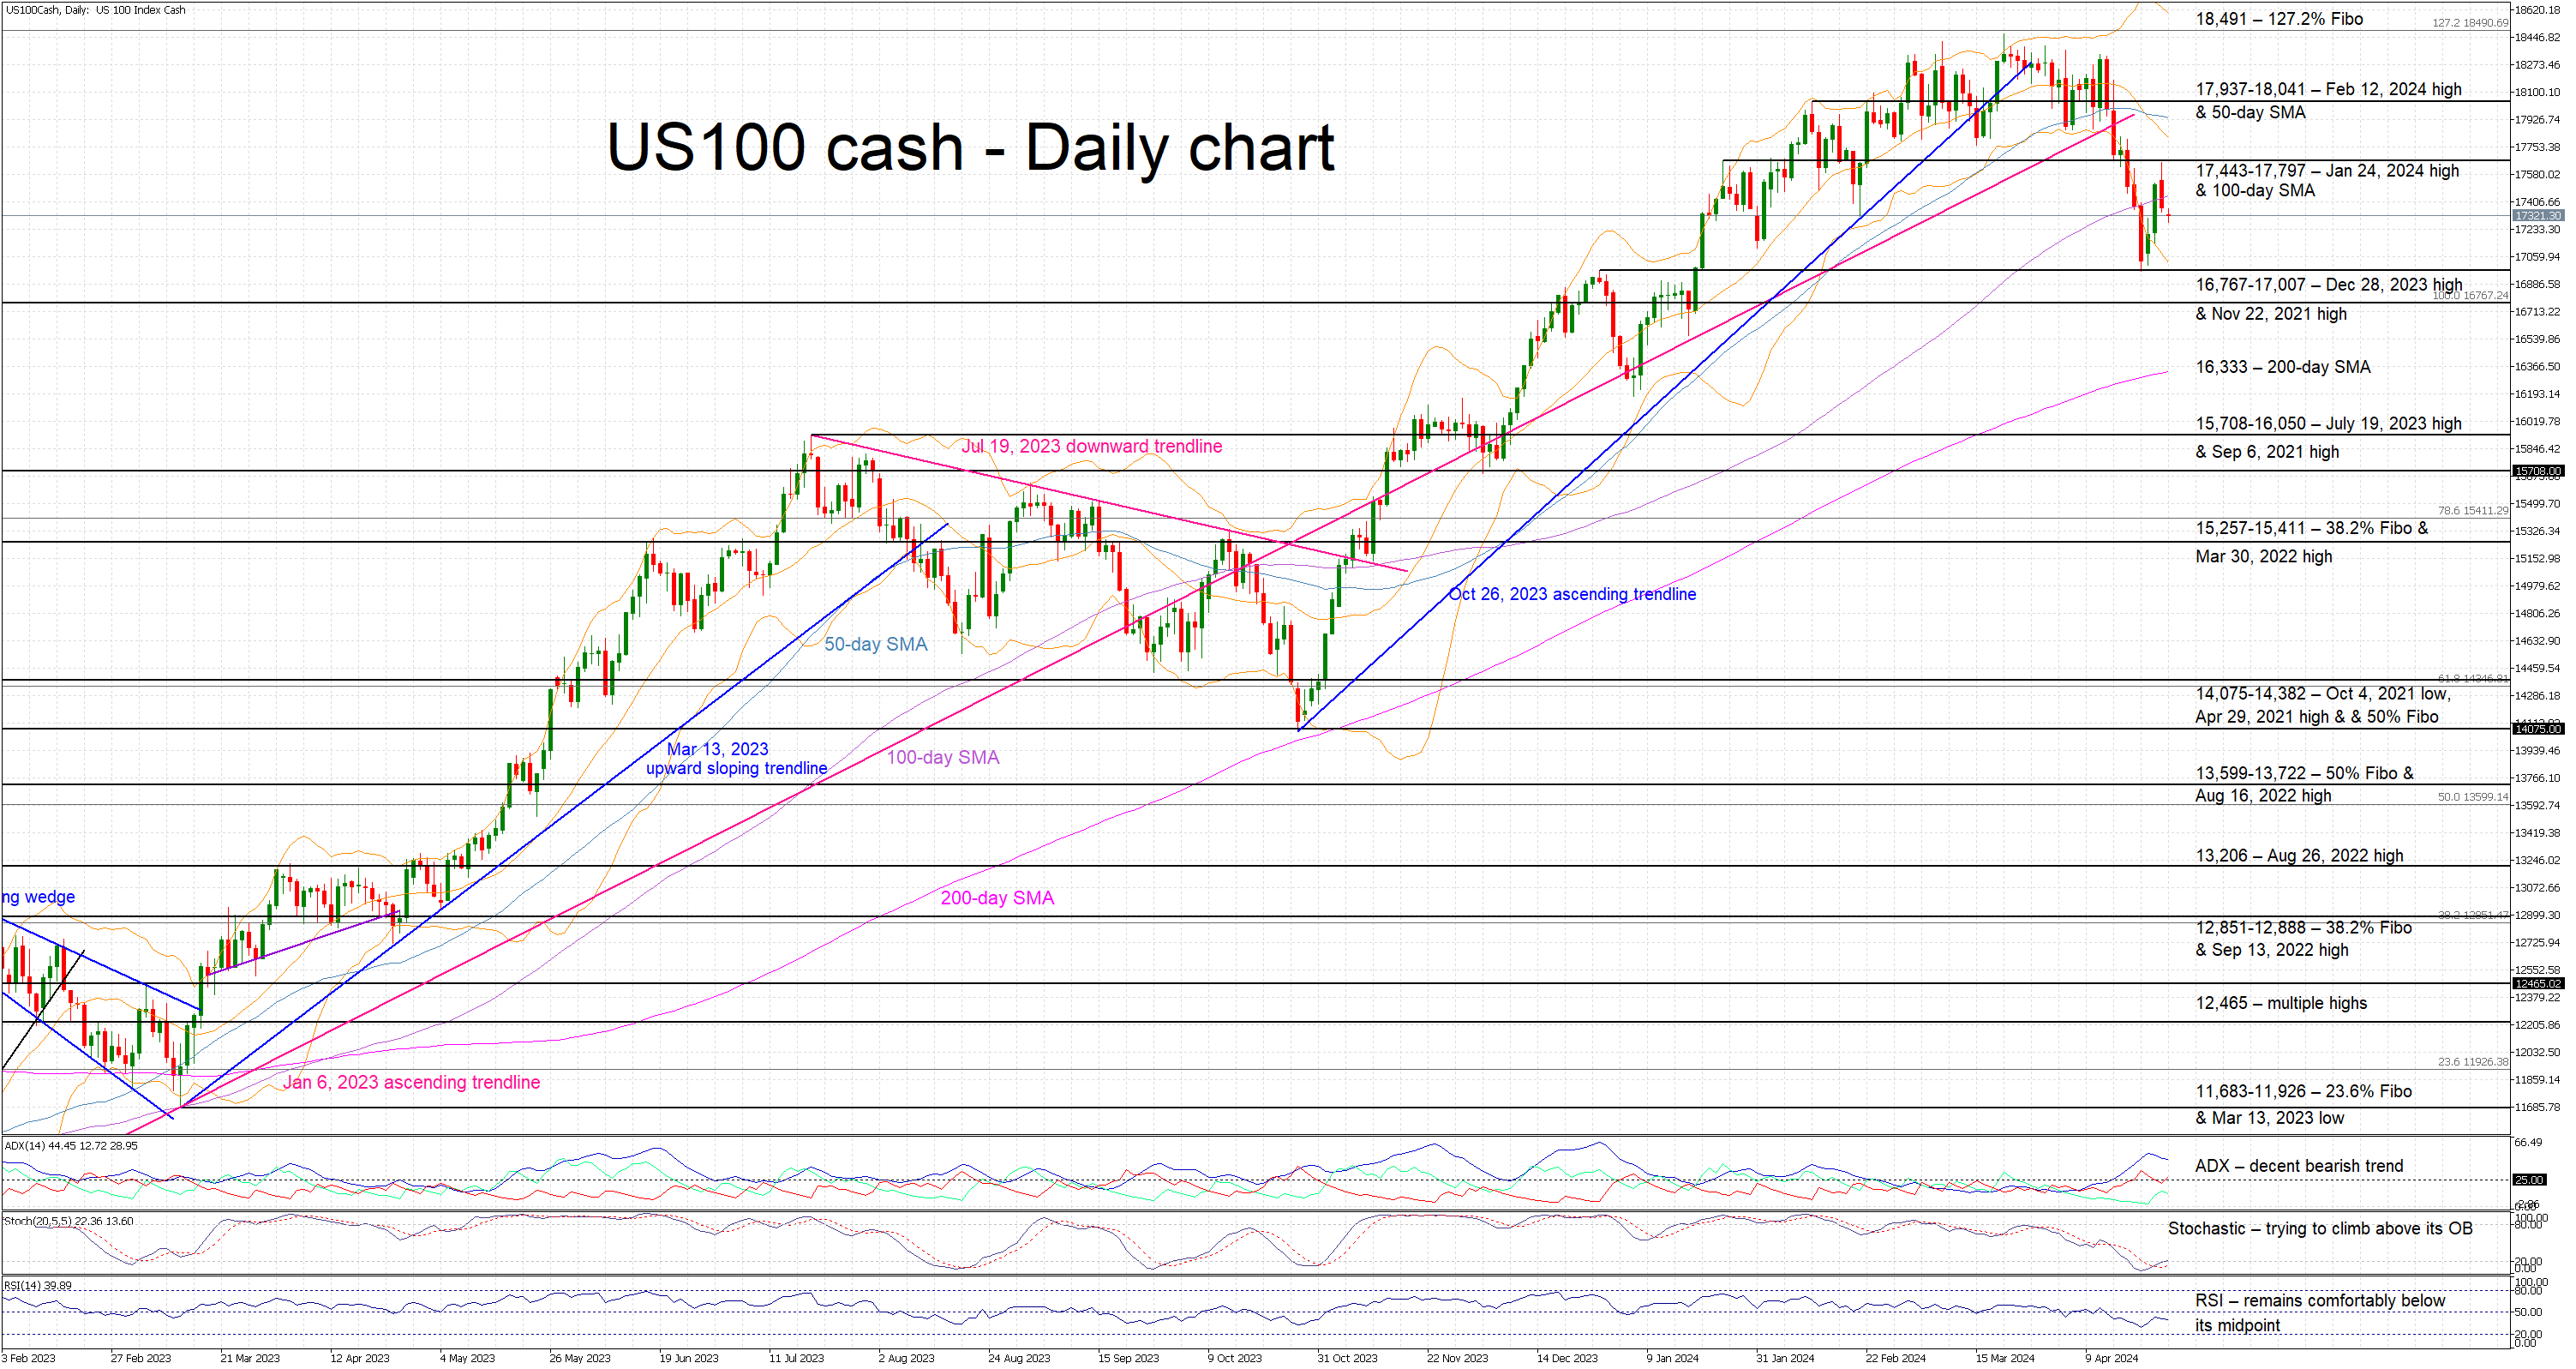
US 100 Index Weakness Lingers
- US 100 cash index is in the red, a tad below the 100-day SMA
- Market sentiment remains bearish ahead of key US data
- Momentum indicators mostly bearish; all eyes on the stochastic
The US 100 cash index is in the red again today, trading a tad below the 100-day simple moving average (SMA) and around 6% lower from its recent all-time high. Despite the moderately positive earnings round, the market momentum remains negative ahead of some key US data prints that could gravely affect the overall rhetoric at the May 1 Fed meeting.
This negative sentiment is depicted in most momentum indicators. More specifically, the Average Directional Movement Index (ADX) is pointing to a decent bearish trend in place, and the RSI continues to hover comfortably below its midpoint. Interestingly, the stochastic oscillator is trying to break above both its moving average and oversold territory (OS). Should this move pick up pace, it could be seen as a strong bearish signal and thus open the door to a lower low in the US 100 index.
Should the bears remain confident, they could try to push the US 100 index below the 16,767-17,007 range that is populated by the December 28, 2023 and November 22, 2021 highs. Lower, the busy 15,708-16,050 area could be tested provided of course that the bears manage to overcome the key 200-day SMA at 16,333.
On the flip side, the bulls are trying to retake the market reins and lead the US 100 index above the crucial 17,443-17,797 area that is defined by the January 24, 2024 high and the 100-day SMA. They could then gradually test the resistance set by the 17,937-18,041 area, and if successful, open the door for a move towards the recent all-time high.
To sum up, US 100 index bears are preparing for a new downleg, especially if the incoming US data remains strong, aiming for a lower low and to gradually lay the foundations for a more protracted correction.
Japanese Yen Hits All-Time Low as BoJ Meeting Commences
The USD/JPY pair reached an all-time high on Thursday, touching the 155.50 level. This development comes as the Bank of Japan (BoJ) starts its two-day monetary policy meeting with widespread expectations that the interest rate will remain unchanged at zero. Investors are keenly watching for any aggressive signals from the BoJ, as further declines in the yen could prompt Tokyo to intervene in the currency market. However, any such intervention is expected to provide only a short-term respite for the yen.
The primary driver behind the yen's weakness remains the significant disparity in monetary policies between the Bank of Japan and the US Federal Reserve, particularly regarding interest rates. The current situation will likely persist if there is no shift in these policies.
Last week, BoJ Governor Kazuo Ueda indicated at the G-20 summit that the regulator might consider raising rates if the yen's weakness leads to a sustained increase in import prices. The BoJ is closely monitoring inflation trends, and should the consumer price index approach the 2% target, the bank may adopt a more decisive stance.
The yen has been on a consistent downward trajectory since 13 March this year, showing few signs of interruption.
USD/JPY technical analysis
On the H4 chart, USD/JPY found support at 153.65, and the fifth wave of growth is unfolding. The pair is expected to reach 155.85 soon. Following this, a corrective move to at least 154.60 (testing from above) is anticipated, potentially followed by further growth towards 156.56. This target represents the primary objective of the growth wave. This bullish scenario is technically supported by the MACD oscillator, whose signal line is above zero and trending upwards.
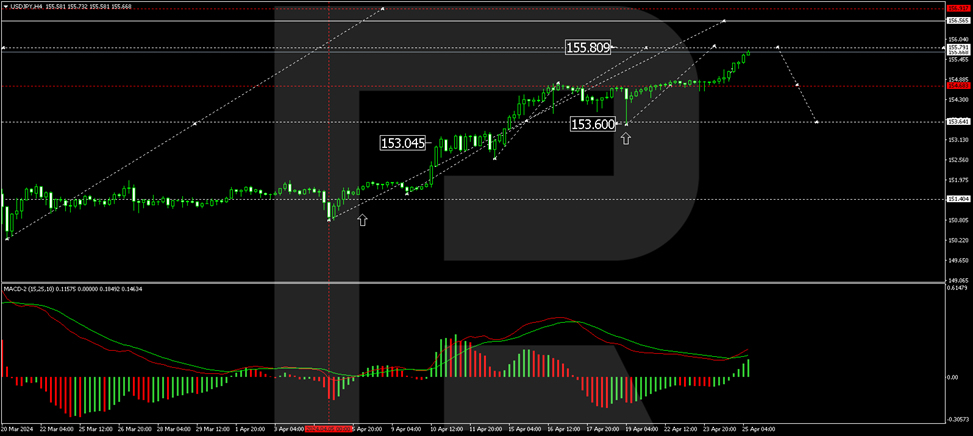
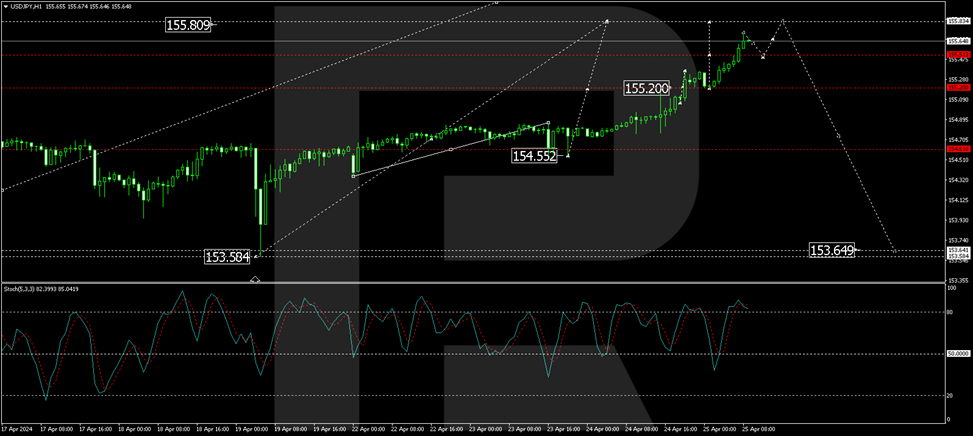
On the H1 chart, USD/JPY has established support at 154.55, with the upward structure aiming for 155.85. Currently, the growth to 155.73 has been executed. A slight retracement to 155.20 (testing from above) may occur next. After reaching this level, the likelihood of an ascent to 155.85 will be reassessed. This technical outlook is confirmed by the Stochastic oscillator, whose signal line is currently above 80, poised for a drop to around 50.
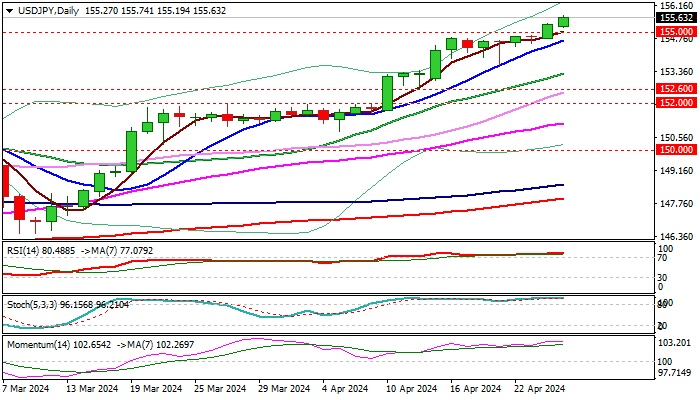
USD/JPY: Eventual Break of 155.00 Barrier Unmasks 160.00 Target
USDJPY hits new multi-decade highs, following eventual break of key 155.00 zone, where the action was capped in anticipation of intervention from Japanese authorities at these levels.
Fading intervention fears unleashed bulls which now focus targets at 156.36 and 157.73 (Fibo projections) with stronger bullish acceleration to open way for attack at psychological 160 barrier (last time traded in June 1990).
Confirmation of strong bullish signals generated on break of pivotal Fibo barrier at 152.60 (38.2% of larger 277.65/75.55 downtrend) and 155.00, which requires monthly close above these levels, would add to strong bullish stance.
Technical studies are bullish on all larger timeframes (day/week /month) and contribute to overall positive outlook, boosted by dollar-favorable fundamentals.
However, some corrective actions should be anticipated in the near term, as studies are overbought.
Limited pullback should offer better opportunities to re-enter bullish market, with initial support at 154.65 (10DMA) followed by 153.28 (20DMA) and key 152.60 (broken Fibo barrier) which should contain extended dips to keep larger bulls intact.
Res: 156.36; 157.73; 159.11; 160.00.
Sup: 155.00; 154.65; 153.28; 152.60.
ECB’s Schnabel identifies services inflation as primary concern
ECB Executive Board Member Isabel Schnabel acknowledged that the consensus that the path to disinflation is proving to be "quite bumpy," especially as the process is in its "last mile". The "biggest concern" is the persistent inflation within the services sector, which remains stubbornly high.
Schnabel emphasized the importance of closely monitoring unit labor costs. She noted at a conference today, "One aspect that we are looking at very vigilantly is the development of unit labor cost."
"Wage growth remains relatively strong but it seems to be gradually easing in line with what we have in our projections," she added.
However, Schnabel expressed particular concern over another crucial economic indicator: "The more concerning part is productivity growth," she remarked, as Eurozone has been experiencing negative productivity growth for several quarters.
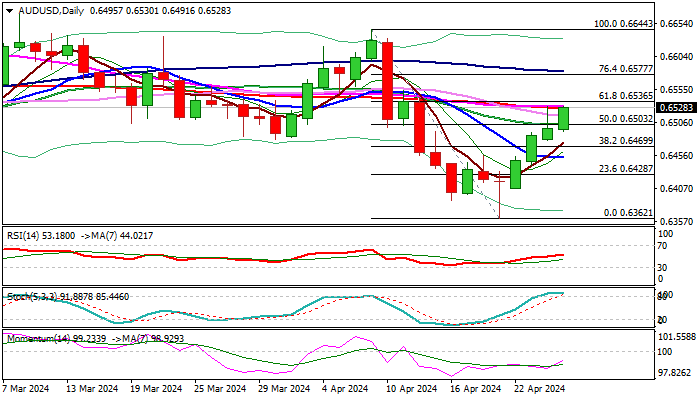
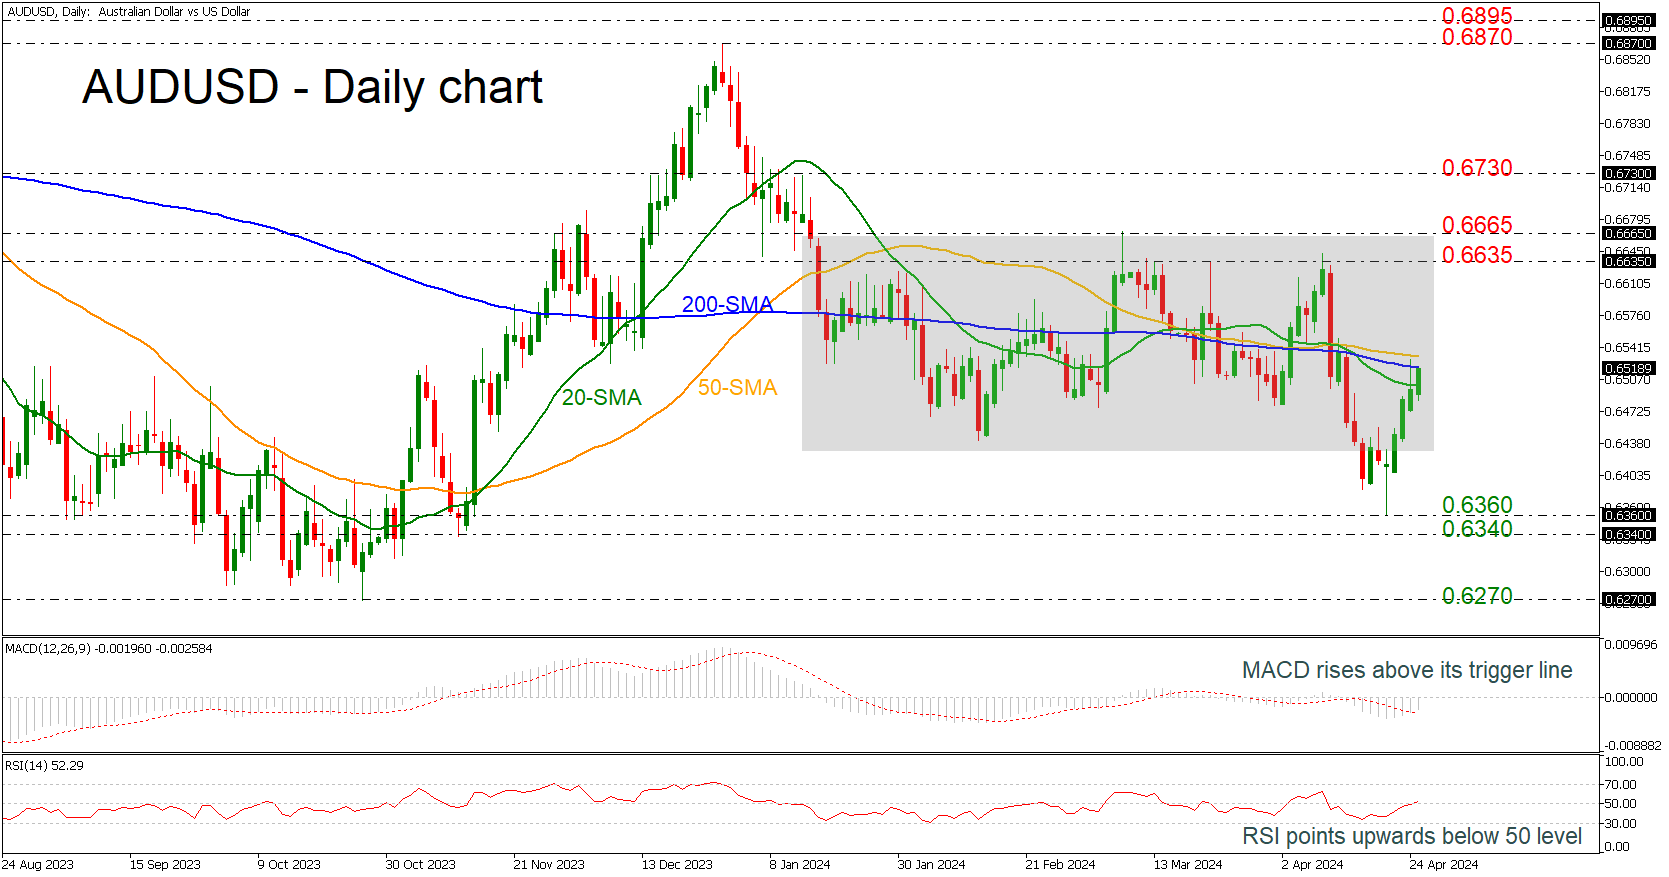
AUDUSD Rises Near Short-Term SMAs
- AUDUSD rebounds off 0.6360
- Bullish doji indicate upside correction
- MACD and RSI tick higher
AUDUSD is heading upwards after the bullish doji candle that has been posted last Friday, adding almost 3%. The market is challenging the short-term simple moving averages (SMAs), switching the outlook to a neutral one.
The technical oscillators are suggesting more upside pressure though. The MACD is crossing above its trigger line in the negative territory, while the RSI is trying to jump above the neutral threshold of 50 with strong momentum.
Any movements beyond the SMAs could take traders until the next resistance area of 0.6635-0.6665, which is acting as an upper boundary of a sideways channel. Moving higher, the 0.6730 barricade could be a strong obstacle for the bulls before hitting the 0.6870 level, taken from the peak on December 28.
Alternatively, a downside retracement could open the way for more losses until the previous bottom of 0.6360 and the 0.6340 support level. Steeper decreases may retest the 0.6270 low, registered back on October 26.
To sum up, AUDUSD is returning within the consolidation area, failing to express a clear directional movement in the short-term.
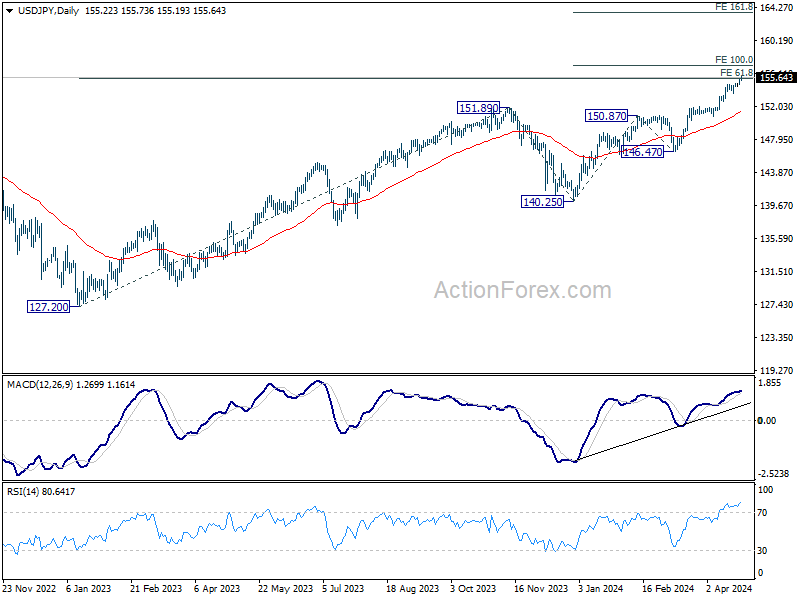
USD/JPY Daily Outlook
Daily Pivots: (S1) 154.91; (P) 155.15; (R1) 155.58; More...
USD/JPY's rally accelerates today and breaks through 155.20 fibonacci level. There is no sign of topping yet. Intraday bias stays on the upside at this point. Sustained trading above 155.20 will pave the way 100% projection of 140.25 to 150.87 from 146.47 at 157.09. For now, break of 154.77 resistance turned support is needed to indicate short term toping. Otherwise, outlook will stay bullish in case of retreat.
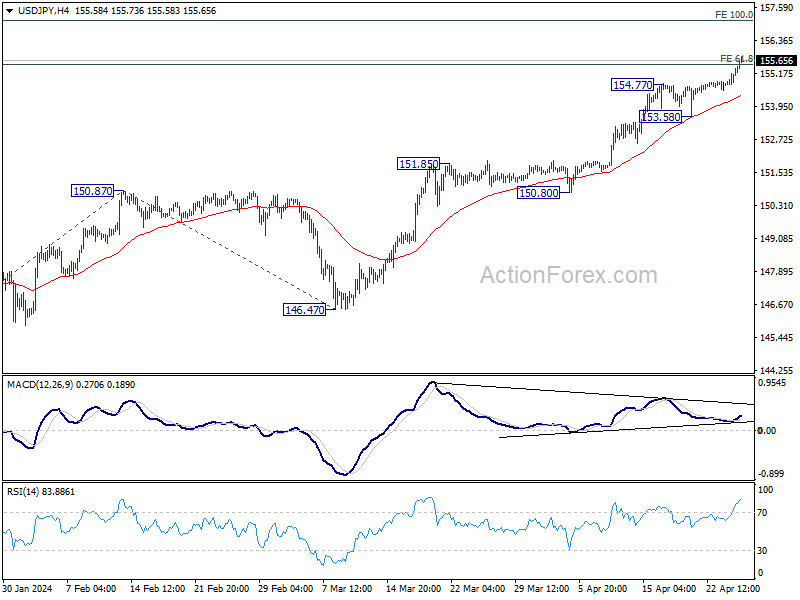
In the bigger picture, current rise from 140.25 is seen as the third leg of the up trend from 127.20 (2023 low). Next target is 61.8% projection of 127.20 to 151.89 from 140.25 at 155.20. Firm there will target 100% projection of 140.25 to 150.87 from 146.47 at 157.09., Outlook will remain bullish as long as 150.87 resistance turned support holds, even in case of deep pullback.
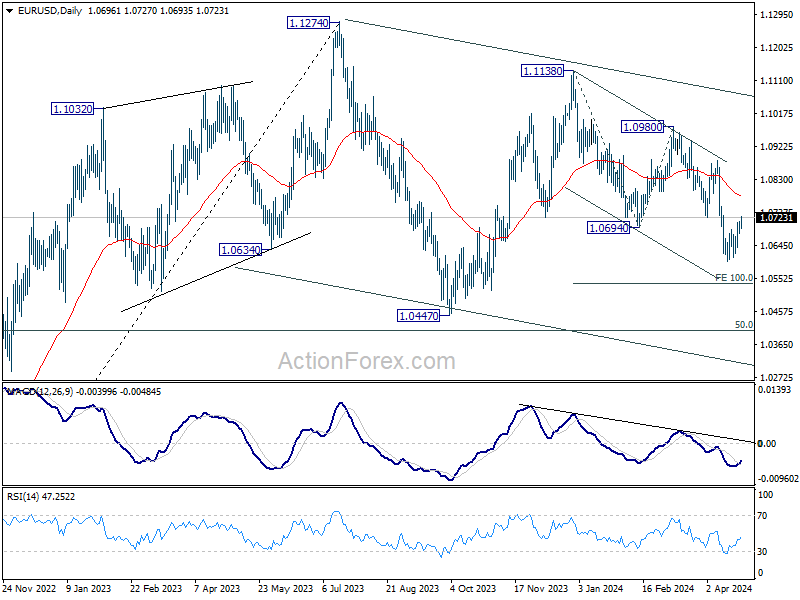
EUR/USD Daily Outlook
.Daily Pivots: (S1) 1.0680; (P) 1.0697; (R1) 1.0716; More...
Immediate focus is now on 1.0723 support turned resistance. Rejection from there, followed by break of 1.0677 minor support, will retain near term bearishness. Retest of 1.0601 low would be seen next. Nevertheless, firm break of 1.0723 will bring stronger rebound to 55 D EMA (now at 1.0786) instead.
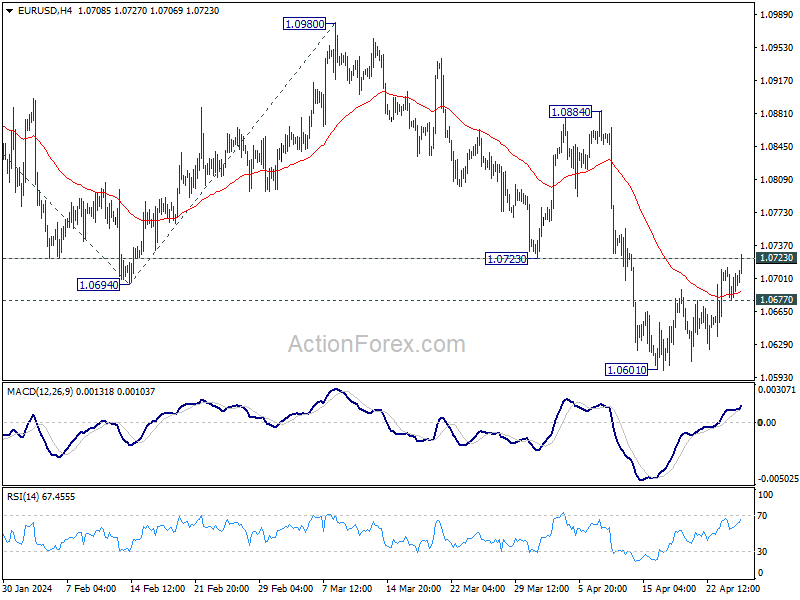
In the bigger picture, price actions from 1.1274 are viewed as a corrective pattern to rise from 0.9534 (2022 low). Current fall from 1.1138 is seen as the third leg. While deeper decline is would be seen to 1.0447 and possibly below, Strong support should emerge from 61.8% retracement of 0.9534 to 1.1274 at 1.0199 to complete the correction.
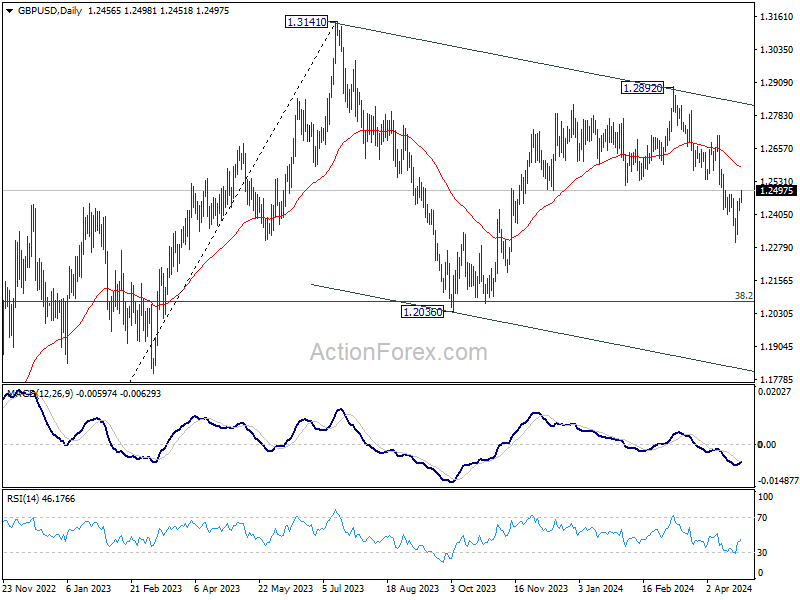
GBP/USD Daily Outlook
Daily Pivots: (S1) 1.2368; (P) 1.2414; (R1) 1.2495; More...
Near term outlook in GBP/USD remains bearish as long as 1.2538 support turned resistance. holds. Break of 1.2421 minor support will argue that rebound from 1.2298 has completed and bring retest of this low. However, decisive break of 1.2538 will bring stronger rally to 55 D EMA (now at 1.2585) instead.
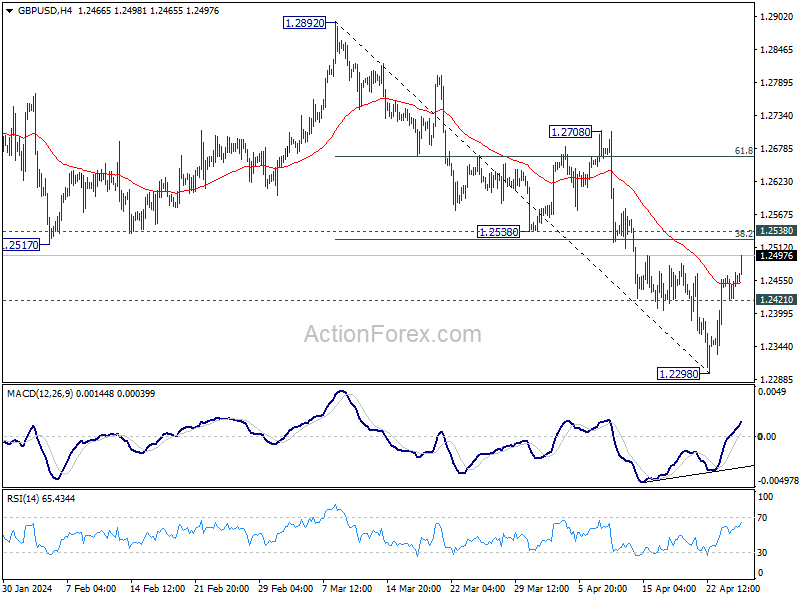
In the bigger picture, price actions from 1.3141 medium term top are seen as a corrective pattern to up trend from 1.0351 (2022 low). Fall from 1.2892 is seen as the third leg. Deeper decline would be seen to 1.2036 support and possibly below. But strong support should emerge from 61.8% retracement of 1.0351 to 1.2452 at 1.1417 to complete the correction.