Sample Category Title
UK 100 Index Hits New All-Time Highs But Rally May Be Cooling
- UK 100 index reaches 8,000 milestone
- But further gains may have to wait as uptrend starts to lose steam
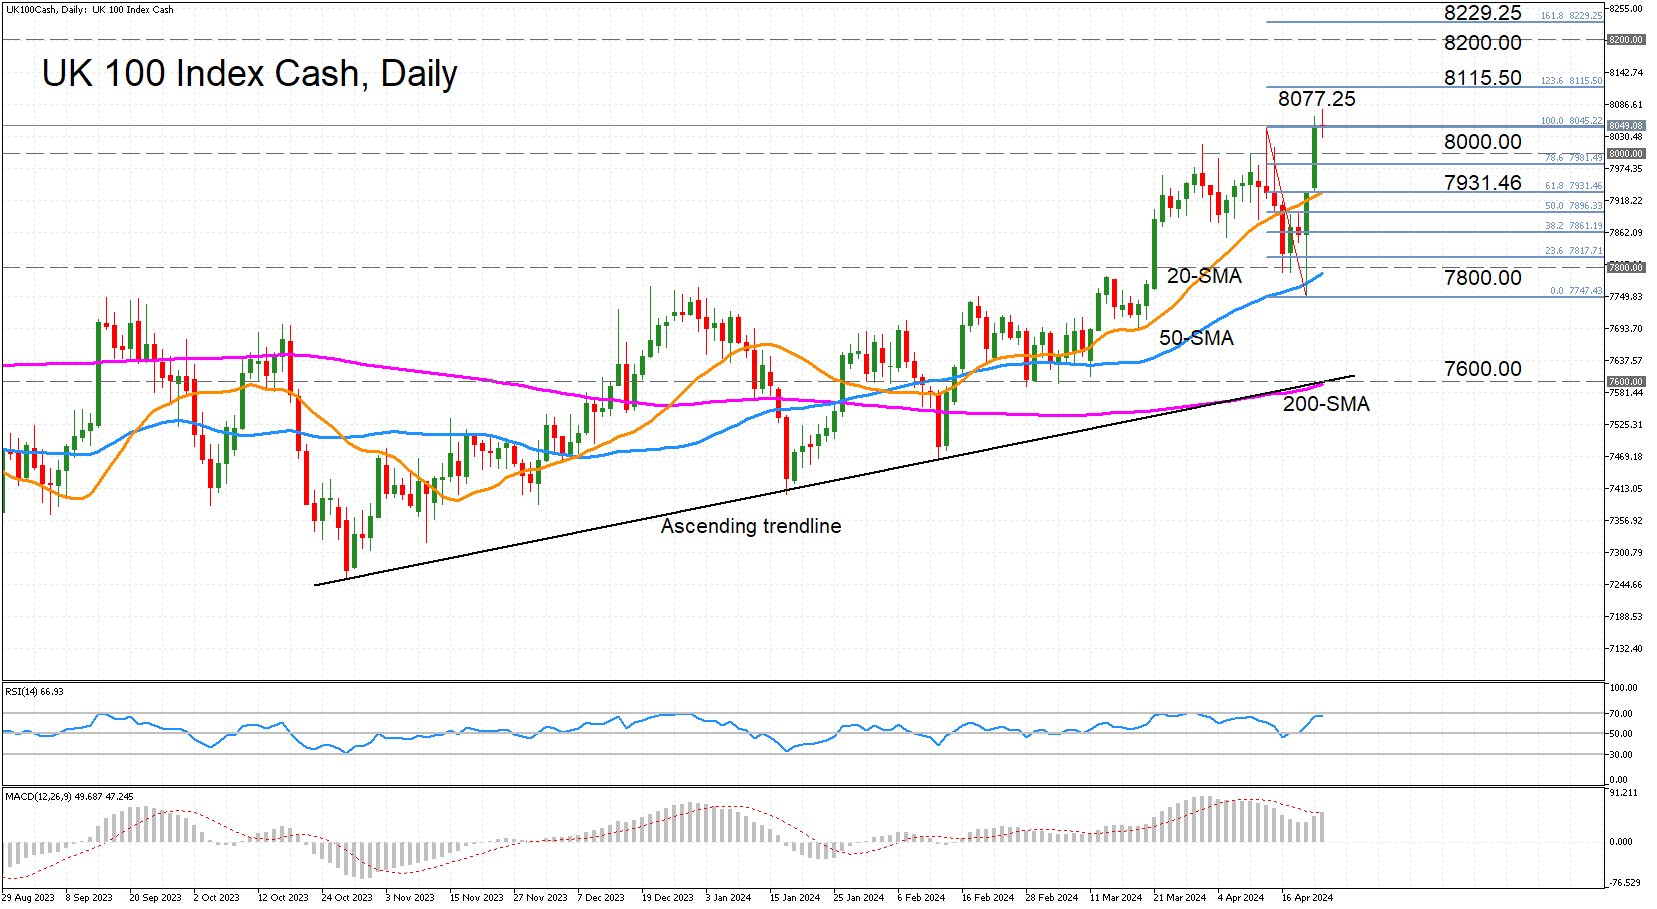
The UK 100 stock index (cash) closed at a new all-time high of 8,046.44 on Monday and climbed to an intra-day record of 8,077.25 earlier today. But whilst another record close is possible in the near term, positive momentum appears to be waning.
The RSI is currently edging sideways slightly below the 70 overbought mark, while the MACD seems to be struggling to cross above its red signal line. Yet, the bullish bias remains fairly strong so how today’s session ends could prove critical to the short-term direction.
If the index manages to regain some upside momentum, the next stop could be 8,115.50, which is the 123.6% Fibonacci extension of the April downleg. Higher up, the 8,200.00 level could attract attention before the 161.8% Fibonacci of 8,229.25 is targeted by the bulls.
To the downside, there could be immediate support at 8,000.00, but the 20-day simple moving average (SMA) is another important support to watch as it is intersecting the 61.8% Fibonacci retracement of 7,931.46. A drop below this point would shift the focus to the busy 7,800.00 region, which is being approached by the 50-day SMA. Breaching this would add to the bearish risks and open the door to the 200-day SMA that has converged with the medium-term ascending trendline in the 7,600.00 area.
In brief, a further rise into uncharted territory is possible in the next few sessions, but there is also a risk that the rally pauses for breath before resuming the uptrend.
FTSE100 Hits New Record High
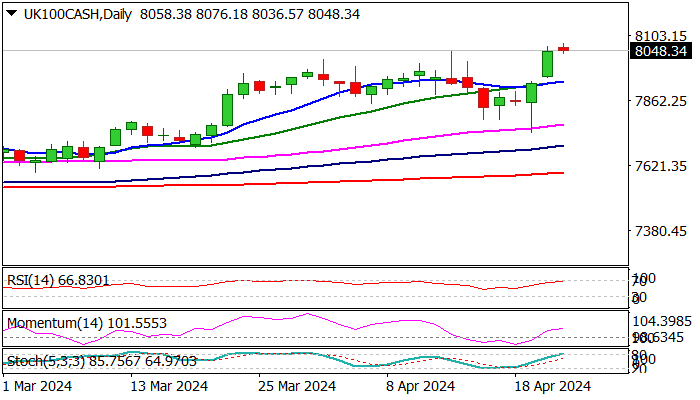
FTSE 100 index hit new marginally higher record high on Tuesday, as strong bullish acceleration extends into third straight day.
Strong gains in UK defense stocks, food producers and retailers, along with weaker pound and rising commodity prices contributed to strong advance of blue-chip stock index.
Bullish daily studies support the action, but overbought conditions warn of a partial profit-taking, after the index advanced 2.8% in past three days.
Dips should find solid ground at 7950/30 zone (Fibo 38.2% of 7746/8076 upleg / converged 10/20DMA’s) to position for fresh push higher and attack at Fibo projections at 8117 and 8161 (123.6% and 138.2% respectively).
Caution on break here and loss of 7900 zone, which would shift near-term focus lower.
Res: 8076; 8117; 8161;8200
Sup: 8000; 7950; 7930; 7900
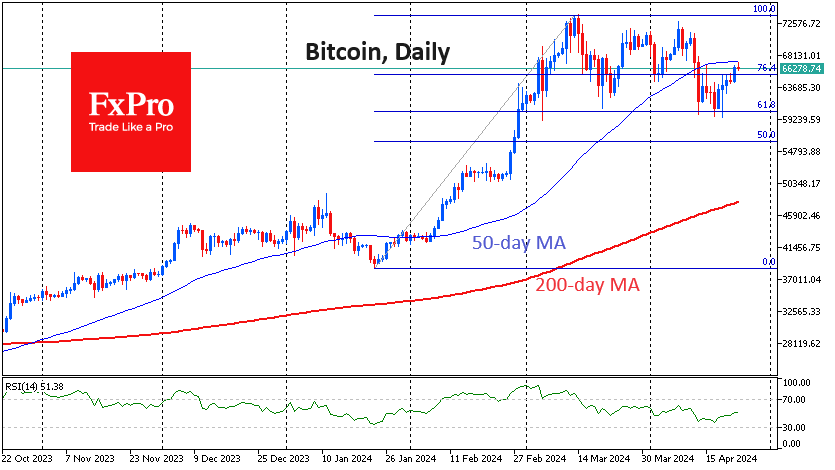
BTC/USD – Slight Bullish Bias Above Daily Cloud, But Stronger Direction Signals Still Needed
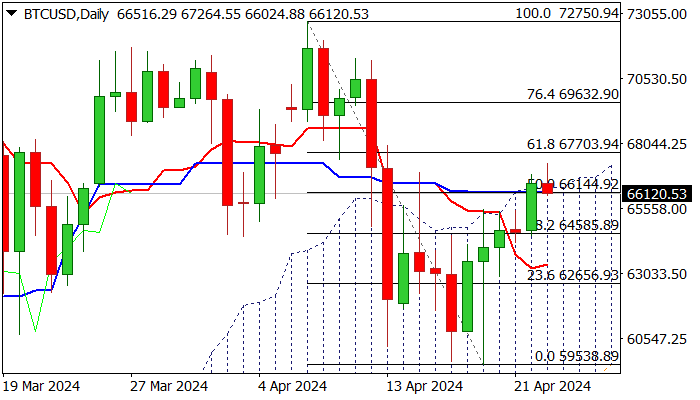
Bitcoin is consolidating in early Tuesday, after advancing 2.8% on Monday and remains constructive as the latest jump has generated positive signal on a marginal close above important barriers at $66144 (50% retracement of $72750/$59538) and $66330 (top of ascending daily Ichimoku cloud).
Geopolitics and broader financial market sentiment remain bitcoin’s main driver, with conflicting studies on daily chart (14-d momentum remains in negative territory / MA’s are in mixed setup, but daily cloud underpins, and near-term bias is expected to remain with bulls while the price stays above the cloud.
However, stronger signals can be expected on sustained break above Fibo 61.8% barrier at $67700 (bullish) or fall below 10DMA at $64039 (bearish).
Res: 67700; 68000; 68325; 69632
Sup: 66144; 64585; 64039; 62656
Bitcoin Awaits Signal from Equity Indices
Market picture
The capitalisation of the crypto market over the past 24 hours has added only 0.15% to $2.44 trillion. Crypto sentiment indices remain in the ‘greed’ territory, scoring 71 points, compared to 73 points the day before.
Bitcoin added about a quarter of a percent during the day, reaching $66.5K. Early on Tuesday morning, the price briefly exceeded $67.1K, touching the 50-day MA, but then retreated. It seems that this time, the crypto market is waiting for a signal from stock indices rather than giving such a signal about risk appetite. The calm may be illusory and quickly come to an end. We reiterate that consolidation above $67.1K could open the way to the $72-74K area. A reversal to the downside could end with a quick rollback to the $60K area.
According to CoinShares, investments in crypto funds over the past week have decreased by $206 million after an outflow of $126 million the previous week. Investments in Bitcoin decreased by $192 million, in Ethereum – by $34 million, in Solana – by $0.3 million.
News background
There was a further outflow of capital from the Grayscale fund totalling $450 million, which could not be compensated by the inflow into the two largest ETFs totalling $259 million. Investors’ appetite for ETFs is declining, probably due to overall pressure on stock markets due to changing expectations for Fed policy and a strengthening dollar.
The average transaction fee in the Bitcoin network has dropped to $34.86 after reaching a record $128.45 on the day of the halving on April 20. The growth of transaction fees began on the eve of the halving. Experts linked the trend with user activity in anticipation of the launch of the Runes protocol, which was timed to coincide with the event.
The Bitcoin Initiative group of Bitcoin supporters has initiated a referendum to amend the Swiss constitution. The group intends to oblige the Swiss National Bank (SNB) to include BTC along with gold in its reserves.
FTX management will get rid of a new batch of the bankrupt exchange Solana (SOL) in the form of an auction after criticism from creditors, said Figure Markets CEO Mike Cagney.
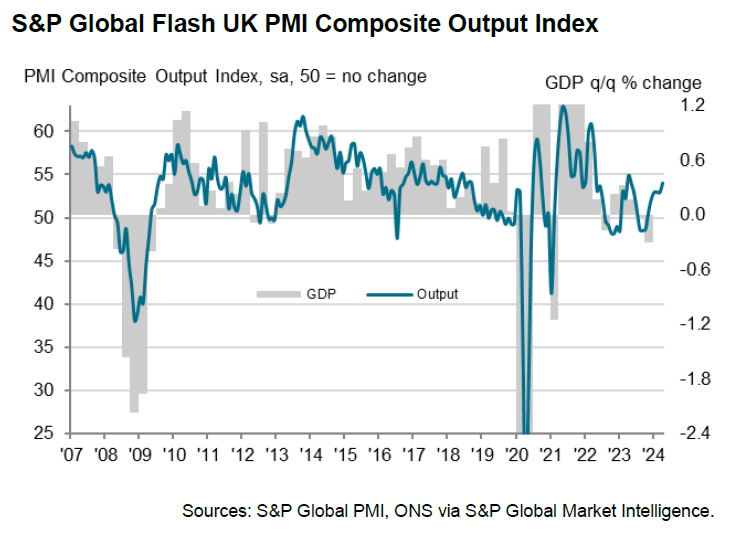
UK PMI composite rises to 54, sustainable path to target inflation not achieved yet
UK PMI Manufacturing fell from 50.3 to 48.7 in April, below expectation of 50.2. PMI Services rose from 53.1 to 54.9, above expectation of 50.2, and an 11-month high. PMI Composite rose from 52.8 to 54.0, also an 11-month high.
Chris Williamson, Chief Business Economist at S&P Global Market Intelligence, stated that UK economy's rebound from last year's recession "continued to gain momentum". He noted that GDP is now growing at an increased quarterly rate of 0.4%, up from 0.3% in the first quarter.
This economic upturn has led to increased hiring, driven further by the rise in the National Living Wage in April. However, these factors have also escalated cost pressures significantly. Although the inflation of selling prices has moderated slightly, the combination of rising costs and solid demand could lead businesses to hike prices in the near future.
"While the improving economic recovery picture is welcome news, the upward pressure on inflation will add to concerns that a sustainable path to below target inflation has not yet been achieved," he added.
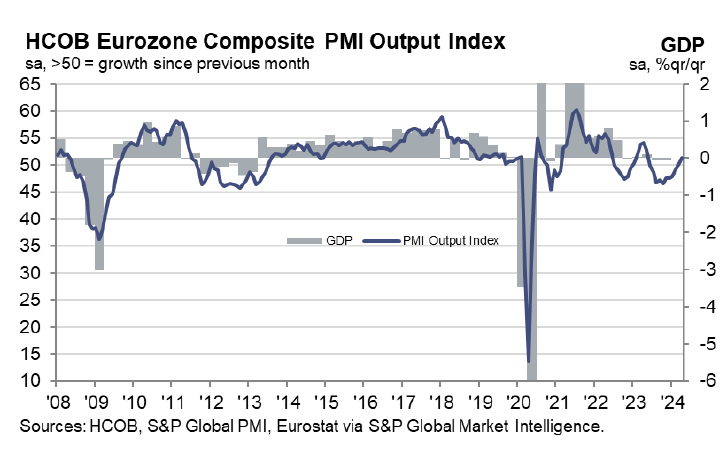
Eurozone PMI composite rises to 51.4, recovery to sustain
Eurozone's PMI Manufacturing fell from 46.1 to 45.6 in April, below expectation of 46.5. PMI Services rose from 51.5 to 52.9, above expectation of 51.8, an 11-month high. PMI Composite rose from 50.3 to 51.4, also an 11-month high.
Cyrus de la Rubia, Chief Economist at Hamburg Commercial Bank, noted that Eurozone had a "good start" to Q2, with GDP projected to expand by 0.3%, mirroring the growth rate of the first quarter.
De la Rubia outlined three factors contributing to the sustainability of the recovery. Positive momentum in new business over the past two months has spurred more aggressive hiring policies. Service providers have shown confidence in their pricing power. The recovery in Germany and France, Eurozone's largest economies, have particularly underscored the broader regional trend.
However, the latest figures pose a critical test for ECB on its readiness to cut interest rates in June. The "accelerated increases in input costs", driven by higher oil prices and wages, necessitates close scrutiny. Moreover, the quicker pace at which service sector companies are raising prices suggests that "services inflation will persist".
Despite these inflationary pressures, HCOB still expects an ECB rate cut in June, although de la Rubia expects ECB to proceed with more caution rather than adopting the "pragmatic speed" earlier suggested by Governing Council member François Villeroy de Galhau.
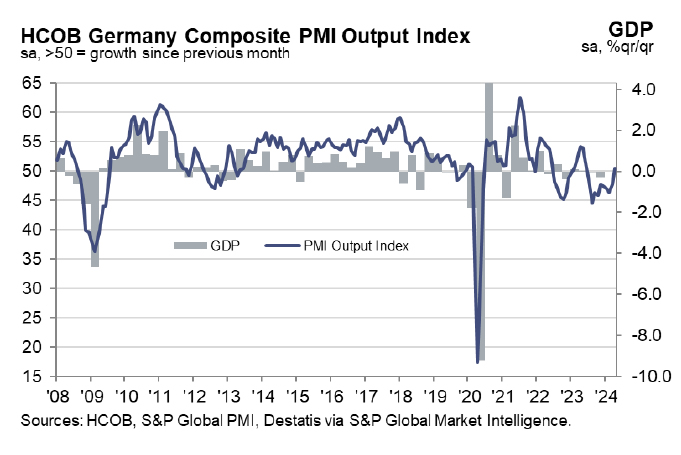
Germany PMI composite soars to 53.3, indicative of 0.2% GDP expansion in Q2
Germany's PMI Manufacturing ticked up from 41.9 to 42.2 in April, below expectation of 42.9. PMI Services jumped from 50.1 to 53.3, well above expectation of 50.5, a 10-month high. PMI Composite rose from 47.7 to 50.5, also a 10-month high.
Cyrus de la Rubia, Chief Economist at Hamburg Commercial Bank, said: Factoring in the PMI numbers into our GDP Nowcast, we estimate that GDP may expand by 0.2% in the second quarter, following an estimated 0.1% growth in the first quarter.
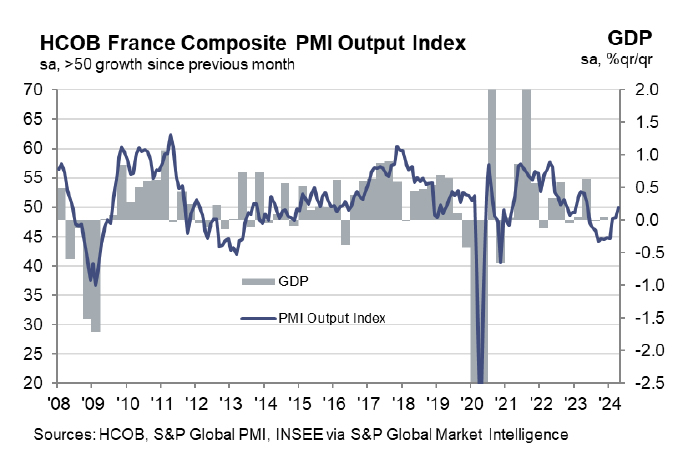
France PMI composite rises to 49.9, back on track driven by services
France PMI Manufacturing fell from 46.2 to 44.9 in April, below expectation of 46.9. But PMI Services rose from 48.3 to 50.5, above expectation of 49.0, an 11-month high. PMI Composite rose from 48.3 to 49.9, also an 11-month high.
Norman Liebke, an economist at Hamburg Commercial Bank, has confidently stated that the French economy is "back on track," highlighting the significant role of the services sector in driving this recovery.
Meanwhile, inflation levels remain a concern, with elevated prices driven by higher wages along with rising energy and oil prices. Both output price inflation and input prices saw reacceleration, maintaining levels clearly above 50.
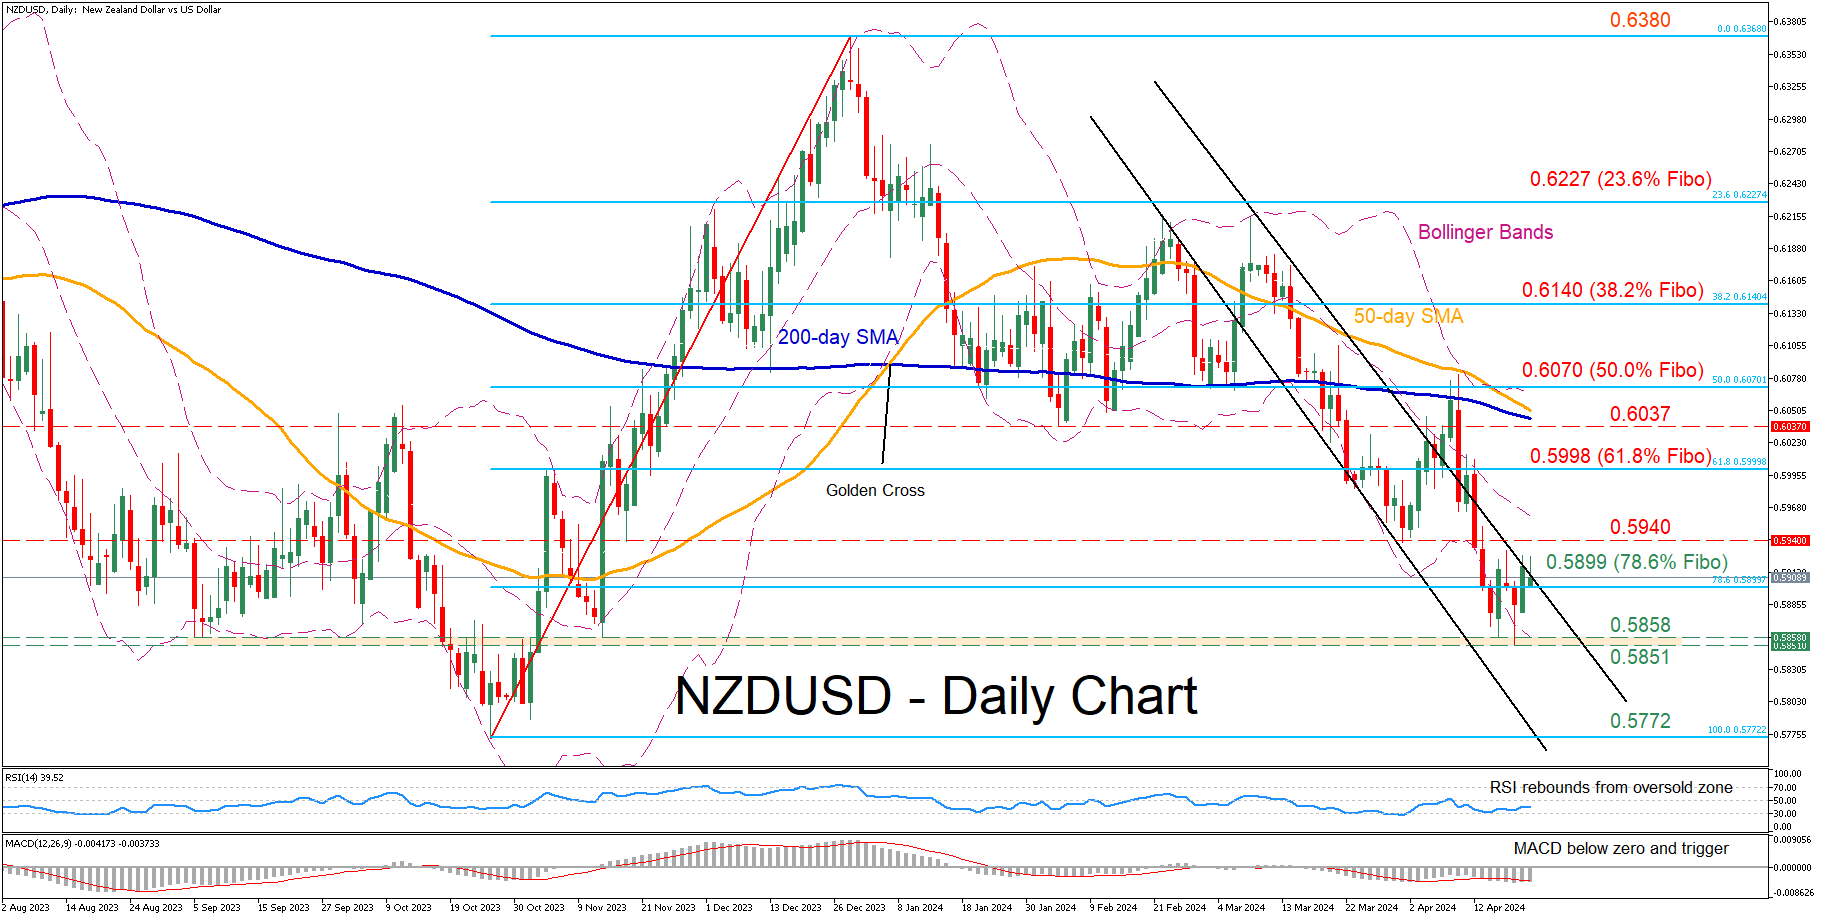
NZDUSD Bounces Off 5-Month Low
- NZDUSD declines sharply within descending channel
- Drops to its lowest since November before paring some losses
- Oscillators are deep in their negative territories
NZDUSD has been in an aggressive downtrend since its double rejection at the 0.6217 region in early March. Although the pair posted a fresh five-month bottom of 0.5851 last week, it seems that the retreat has paused for now.
Given that both the RSI and MACD remain tilted to the downside, the price might revisit 0.5899, which is the 78.6% Fibonacci retracement of the 0.5772-0.6380 upleg. A violation of that region could pave the way for the 0.5858-0.5851 range, defined by the recent five-month bottom and the September-November support. Failing to halt there, the pair could challenge the 2023 low of 0.5772.
On the flipside, should the pair rotate back higher, immediate resistance could be found at the previous support of 0.5940. Further advances could then cease around the 61.8% Fibo of 0.5998. Conquering this barricade, the bulls may attack the February support zone of 0.6037, which could serve as resistance in the future.
Overall, NZDUSD plummeted to a fresh five-month low but managed to recoup some losses as the decline reached oversold conditions. However, the pair is clearly not out of the woods just yet as near-term risks remain heavily tilted to the downside.
Is Gold Ready for Bearish Correction?
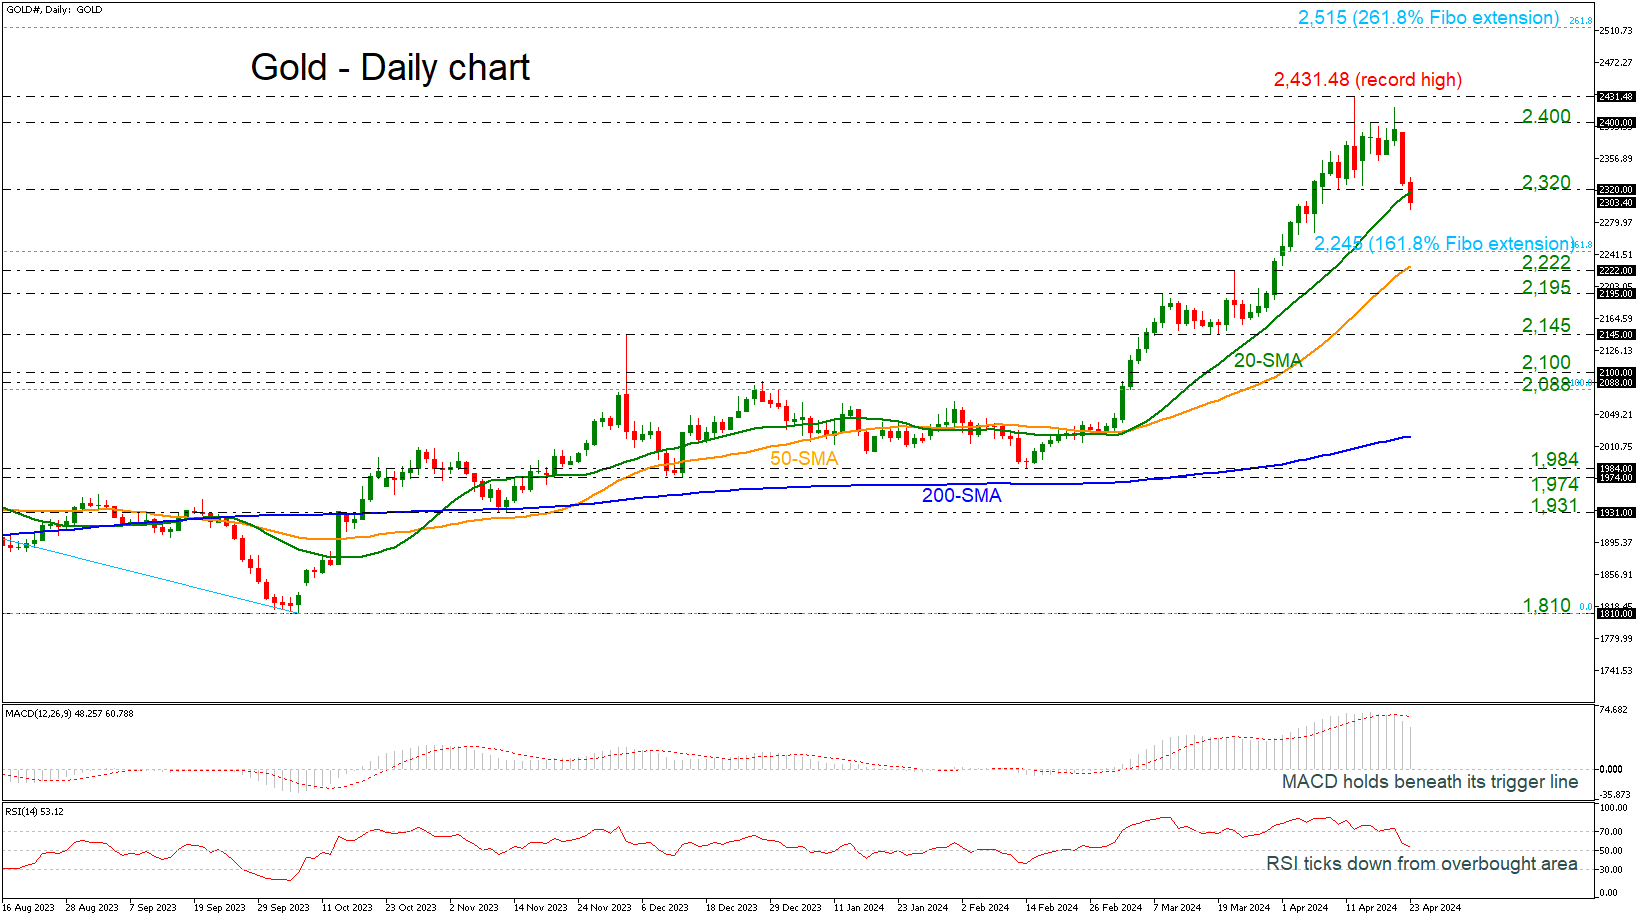
- Gold dives towards 2,300
- MACD and RSI decline from overbought regions
Gold prices have been underperforming in the past two days, breaking back below the 2,320 and the 20-day simple moving average (SMA).
Momentum indicators are pointing to a negative bias in the short term with the RSI ticking strongly to the downside. The MACD is easing beneath its trigger line losing its positive momentum. Both are confirming that a downside correction may be on the cards.
Further losses could see the 161.8% Fibonacci extension level of the down leg from 2,079 to 1,1810 at 2,245 come into play. A drop below the 50-day SMA, which stands near 2,222 would reinforce the bearish structure in the short term and open the way towards the next key levels of 2,195 and 2,145.
In the event of an upside reversal, the 2,400 round number could act as a barrier before being able to re-challenge the record peak of 2,431.48. A rally above this level could shift the outlook back to positive, hitting the 261.8% Fibonacci extension level of 2,515.
All in all, gold prices are in the process of a potential downside retracement before switching the near-term outlook back to bullish.