Sample Category Title
USD/CHF Mid-Day Outlook
Daily Pivots: (S1) 0.9004; (P) 0.9024; (R1) 0.9060; More....
USD/CHF's rally continues today and met 100% projection projection of 0.8550 to 0.8884 from 0.8728 at 0.9062 already. Intraday bias remains on the upside at this point. Sustained trading above 0.9062 will target 0.9243 key medium term resistance next. On the downside, below 0.8964 minor support will turn intraday bias neutral and bring consolidations first. But outlook will stay bullish as long as 0.8884 resistance turned support holds.
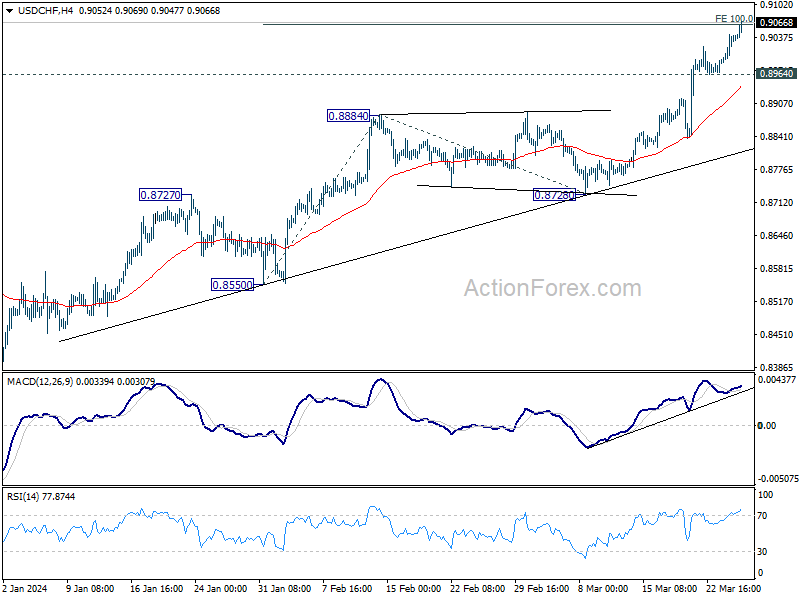
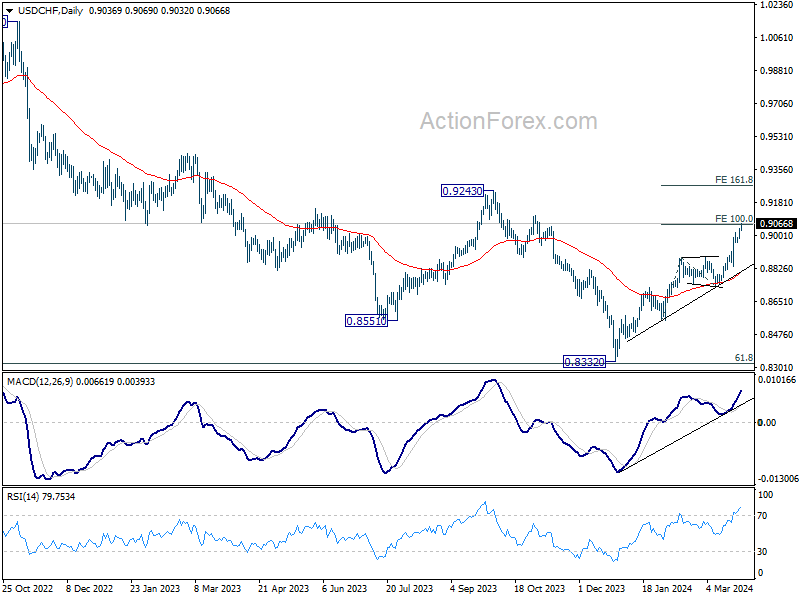
In the bigger picture, price actions from 0.8332 medium term bottom as tentatively seen as developing into a corrective pattern to the down trend from 1.0146 (2022 high). Further rise would be seen as long as 0.8728 support holds. But upside should be limited by 0.9243 resistance, at least on first attempt.
USD/JPY Mid-Day Outlook
Daily Pivots: (S1) 151.13; (P) 151.35; (R1) 151.64; More...
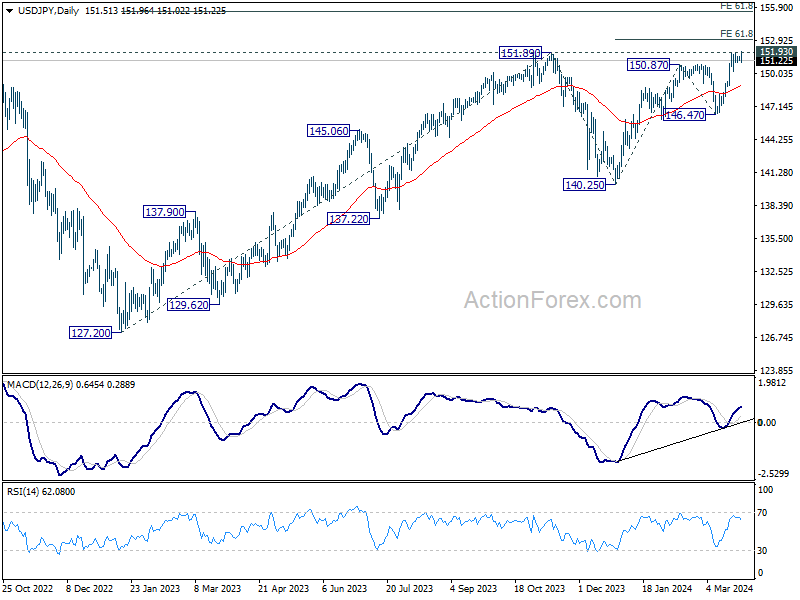
Intraday bias in USD/JPY is turned neutral gain as it retreated after edging higher to 151.96. On the downside, break of 150.25 support should confirm short term topping, and turn bias back to the downside for 55 D EMA (now at 148.93). Nevertheless, sustained break of 151.93 key resistance will confirm long term up trend resumption. Next near term target will be 61.8% projection of 140.25 to 150.87 from 146.47 at 153.03.
In the bigger picture, correction from 151.87 (2023) high could have completed at 140.25 already. Rise from 127.20 (2023 low), as part of the long term up trend, is probably ready to resume. Decisive break of 151.93 resistance (2022 high) will confirm this bullish case. Next medium term target will be 61.8% projection of 127.20 to 151.89 from 140.25 at 155.20. This will remain the favored case as long as 146.47 support holds, in case of another pullback.
Japan’s Financial Leaders Unite in Defense of the Yen, Sparking Rebound
Japanese Yen staged in a notable rebound in European session, triggered by heightened market vigilance towards market interventions. This reaction comes in the wake of a significant meeting between Japan's Ministry of Finance, Financial Services Agency, and Bank of Japan, marking the first such tripartite gathering since last May. The meeting was called into action as Yen plunged to a 34-year low against Dollar briefly, prompting concern over the currency's rapid depreciation.
Key figures, including Japan's top currency diplomat Masato Kanda, FSA Commissioner Teruhisa Kurita, and BoJ's head of policy, Seiichi Shimizu, were in attendance. The focal point of discussions was Yen's alarming descent, which officials see as straying from Japan's economic fundamentals.
Kanda talked to reporters after the meeting, emphasizing the misalignment between Yen's weakening and Japan's economic health, pointing to speculative trading as a primary driver behind the currency's fall. He asserted that "We will take appropriate action against excessive moves without ruling out any options", delivering what is arguably the most direct and serious warning to financial markets since Yen's decline following BoJ's departure from negative interest rates earlier in the month.
Overall in the currency markets, Yen is the strongest for the day at this point, followed by Dollar. Swiss Franc is trading as the weakest, as selloff continues. While Euro and Sterling is gaining against the Franc, they're indeed among the worst performers together with Aussie.
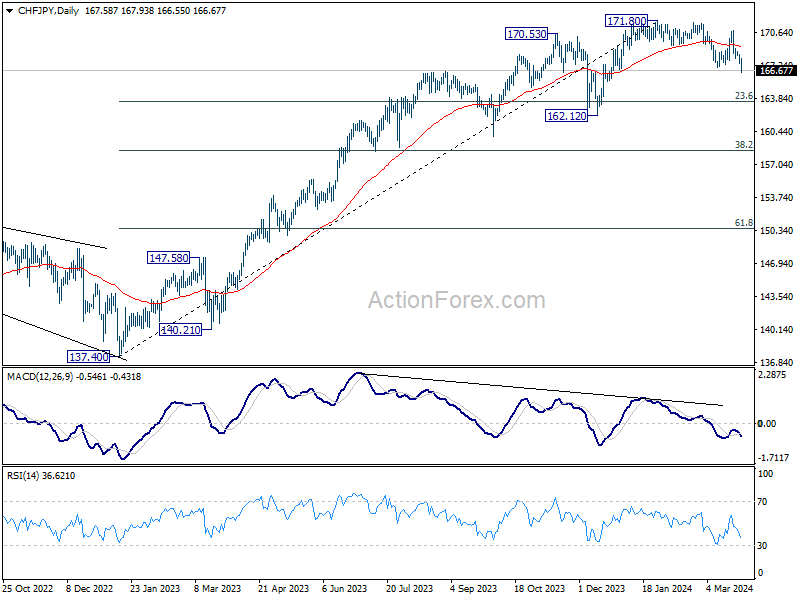
Technically, CHF/JPY's fall from 171.80 resumes today by breaking through 167.05 support. This decline is seen as a correction to whole five-wave rally from 137.40. Risk will now stay on the downside as long as 55 D EMA (now at 169.21 holds. Next target is 23.6% retracement of 137.40 to 171.80 at 163.68.
In Europe, at the time of writing, FTSE is down -0.24%. DAX is up 0.57%. CAC is up 0.31%. UK 10-year yield is down -0.0341 at 3.939. Germany 10-year yield is down -0.048 at 2.305. Earlier in Asia, Nikkei rose 0.90%. Hong Kong HSI fell -1.36%. China Shanghai SSE fell -1.26%. Singapore Strait Times rose 0.57%. Japan 10-year JGB yield fell -0.0143 to 0.724.
Eurozone economic sentiment rises to 96.3 in Mar, above exp 96.1
Eurozone Economic Sentiment Indicator rose from 95.5 to 96.3 in March, above expectation of 96.1. Employment Expectations Indicator rose from 102.5 to 102.6. Economic Uncertainty Indicator fell from 20.3 to 19.2.
Eurozone industry confidence rose from -9.4 to -8.8. Services confidence rose from 6.0 to 6.3. Consumer confidence rose from -15.5 to -14.9. Retail trade confidence rose from -6.6 to -6.7. Construction confidence fell from -5.5 to -5.6.
EU Economic Sentiment Indicator rose from 95.5 to 96.2. Employment Expectations Indicator rose from 102.2 to 102.3. Economic Uncertainty Indicator fell from 19.8 to 18.7.
Amongst the largest EU economies, the ESI improved markedly in France (+2.6), and to a lesser extent in Italy (+1.5) and Germany (+0.9). It deteriorated in the Netherlands (-0.7) and Spain (-0.4) and remained broadly stable in Poland (+0.3).
NZ government drastically cuts 2024 growth forecast to 0.1%, lowers inflation outlook
New Zealand government has made significant revisions to its economic forecasts, projecting a notably subdued GDP growth of just 0.1% for this fiscal year, as revealed in its latest budget statement. Additionally, inflation outlook for both 2024 and 2025 was revised downwards.
The government said a "wide range of data" collected since December highlighted "further deterioration in the economic outlook." The expected slowdown in economic activity materialized "sooner than expected," while inflationary pressures have "eased more than expected."
Specifically, GDP growth projections for 2024 have been significantly lowered from prior forecast of 1.5% to 0.1%. However, there is a silver lining with GDP growth forecast for 2025 being adjusted upwards from 1.5% to 2.1%.
On the inflation front, CPI forecast for 2024 was lowered from 4.1% to 3.3%, and for 2025, forecast was revised down from 2.5% to 2.2%.
Australia's monthly CPI holds steady at 3.4% in Feb
Australia monthly CPI was unchanged at 3.4% yoy in February. When stripping out volatile items and holiday travel, the CPI saw a slight deceleration, moving from 4.1% yoy to 3.8% yoy. However, a closer look at the core inflation measure, the annual trimmed mean CPI, reveals a slight uptick from 3.8% yoy to 3.9% yoy, suggesting underlying inflationary pressures remain persistent.
The detailed breakdown of inflation contributors highlights showed that housing costs had the most substantial rise at 4.6% yoy. Food and non-alcoholic beverages also experienced a notable increase at 3.6% yoy. Additionally, alcohol and tobacco products saw a sharp price escalation at 6.1% yoy, and insurance and financial services costs surged by 8.4% yoy, the latter being the highest among the recorded sectors.
BoJ's Tamura stresses gradual withdrawal of stimulus for steady policy normalization
BoJ board member Naoki Tamura said that Japan's moderate economy recovery path is expected to continue, positive cycle of wage increases leading to higher inflation rates.
"The risk of our medium- and long-term forecasts being derailed is likely small," he remarked in a speech today.
He underscored the importance of a deliberate and gradual approach to policy normalization, ensuring that the transition away from aggressive monetary support is managed with precision and foresight.
"How to manage monetary policy ahead is very important to ensure we deftly roll back our massive stimulus program, and move slowly but steadily toward policy normalization," he articulated.
Central to Tamura's vision is the restoration of interest rate flexibility, positioning BoJ to effectively modulate demand and influence price dynamics through rate adjustments.
"In my view, the central bank's ultimate goal is to bring interest rates back to levels where they can be pushed up or down to adjust demand, and influence price moves," he stated.
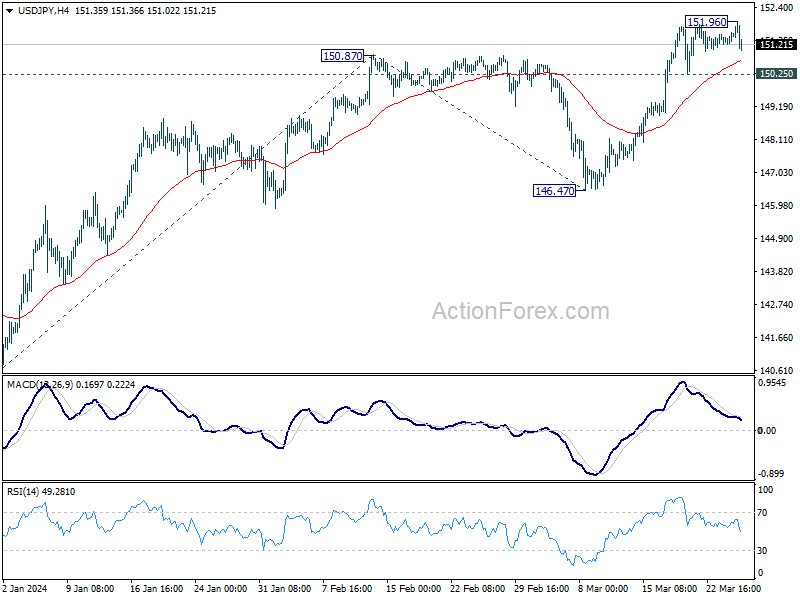
USD/JPY Mid-Day Outlook
Daily Pivots: (S1) 151.13; (P) 151.35; (R1) 151.64; More...
Intraday bias in USD/JPY is turned neutral gain as it retreated after edging higher to 151.96. On the downside, break of 150.25 support should confirm short term topping, and turn bias back to the downside for 55 D EMA (now at 148.93). Nevertheless, sustained break of 151.93 key resistance will confirm long term up trend resumption. Next near term target will be 61.8% projection of 140.25 to 150.87 from 146.47 at 153.03.

In the bigger picture, correction from 151.87 (2023) high could have completed at 140.25 already. Rise from 127.20 (2023 low), as part of the long term up trend, is probably ready to resume. Decisive break of 151.93 resistance (2022 high) will confirm this bullish case. Next medium term target will be 61.8% projection of 127.20 to 151.89 from 140.25 at 155.20. This will remain the favored case as long as 146.47 support holds, in case of another pullback.

Economic Indicators Update
| GMT | Ccy | Events | Actual | Forecast | Previous | Revised |
|---|---|---|---|---|---|---|
| 00:00 | AUD | Westpac Leading Index M/M Feb | 0.10% | -0.10% | ||
| 00:30 | AUD | Monthly CPI Y/Y Feb | 3.40% | 3.50% | 3.40% | |
| 09:00 | CHF | Credit Suisse Economic Expectations Mar | 11.5 | 10.2 | ||
| 10:00 | EUR | Eurozone Economic Sentiment Indicator Mar | 96.3 | 96.1 | 95.4 | 95.5 |
| 10:00 | EUR | Eurozone Industrial Confidence Mar | -8.8 | -9 | -9.5 | -9.4 |
| 10:00 | EUR | Eurozone Services Confidence Mar | 6.3 | 7.8 | 6 | |
| 10:00 | EUR | Eurozone Consumer Confidence Mar F | -14.9 | -14.9 | -14.9 | |
| 14:30 | USD | Crude Oil Inventories | -0.7M | -2.0M |
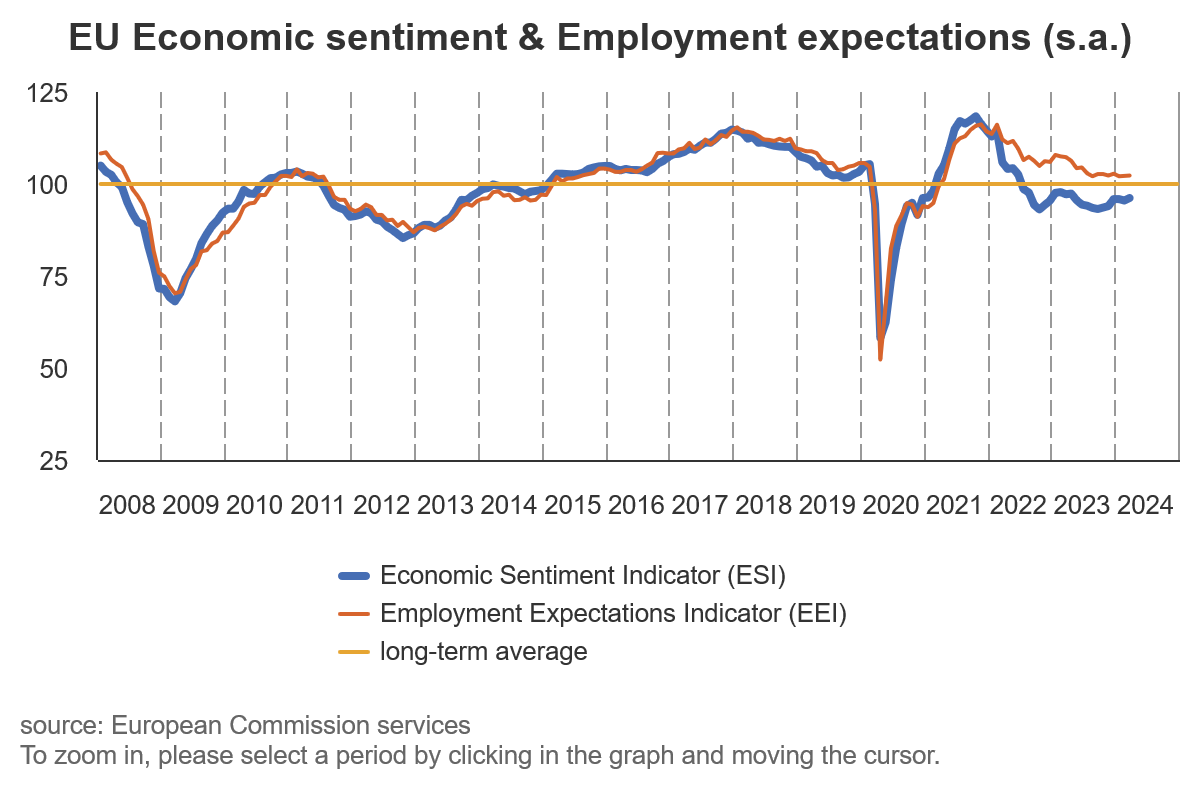
Eurozone economic sentiment rises to 96.3 in Mar, above exp 96.1
Eurozone Economic Sentiment Indicator rose from 95.5 to 96.3 in March, above expectation of 96.1. Employment Expectations Indicator rose from 102.5 to 102.6. Economic Uncertainty Indicator fell from 20.3 to 19.2.
Eurozone industry confidence rose from -9.4 to -8.8. Services confidence rose from 6.0 to 6.3. Consumer confidence rose from -15.5 to -14.9. Retail trade confidence rose from -6.6 to -6.7. Construction confidence fell from -5.5 to -5.6.
EU Economic Sentiment Indicator rose from 95.5 to 96.2. Employment Expectations Indicator rose from 102.2 to 102.3. Economic Uncertainty Indicator fell from 19.8 to 18.7.
Amongst the largest EU economies, the ESI improved markedly in France (+2.6), and to a lesser extent in Italy (+1.5) and Germany (+0.9). It deteriorated in the Netherlands (-0.7) and Spain (-0.4) and remained broadly stable in Poland (+0.3).
Gold: Suspicious Storm of $2200
Gold breached the $2200 mark for the second time in history on Tuesday before retreating to $2182 in early US trading. Cryptocurrencies are trading in the same direction as gold today, but silver, platinum and copper are failing to make similar gains, causing some unease.
Gold’s break above $2195 tested the rally high from late February to 8th March. A fix above this level would be the first step towards a new rally, making the scenario of growth to $2300 viable.
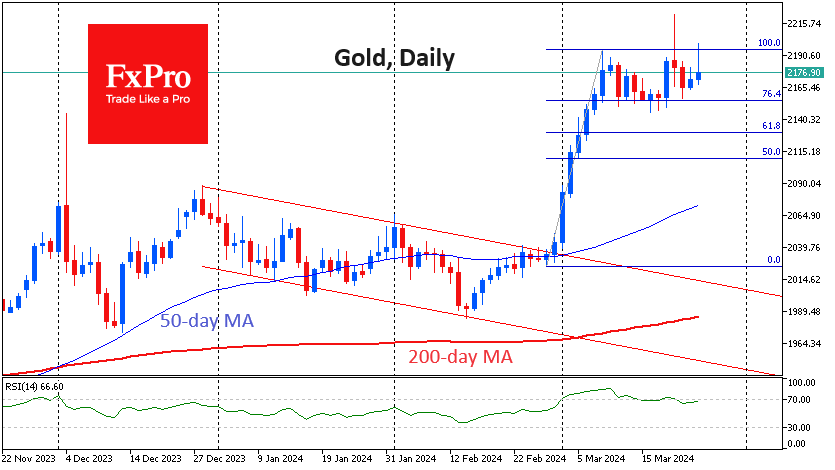
Strictly speaking, there is a higher price on the charts, but it is the result of slippage in low liquidity trading, so it is not considered a full-fledged breakout.
Silver is losing ground daily for the fourth consecutive session, falling to $24.4. Platinum is trading near $900 – near local lows after a 5% pullback from its 15th March high. Copper has been trending lower since early last week.
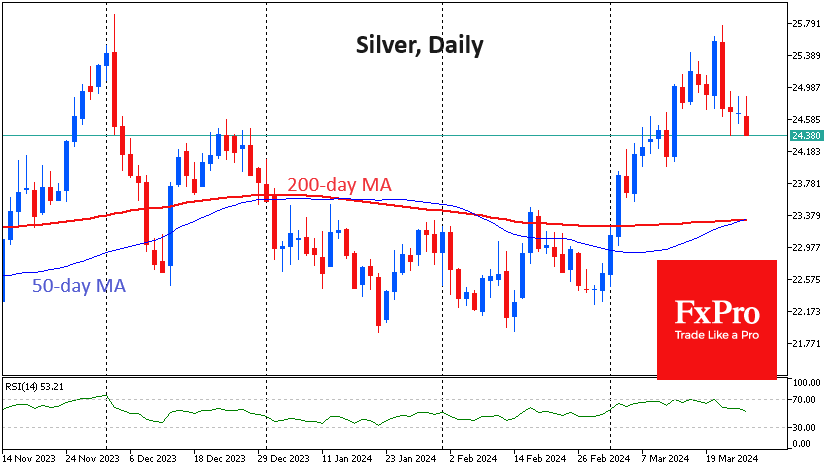
Gold is the most liquid metal in the exchange, but its divergence from other metals is setting it up for a false breakout on Tuesday.
This is evidenced by the persistent sideways movement in gold miners over the past three weeks despite gold’s impressive rally.
Technically, gold needs to consolidate above $2200 to start a new bullish momentum. In the event of further declines, we should keep an eye on the dynamics around $2150: a failure of this support could trigger a deeper correction with the first target at $2130.
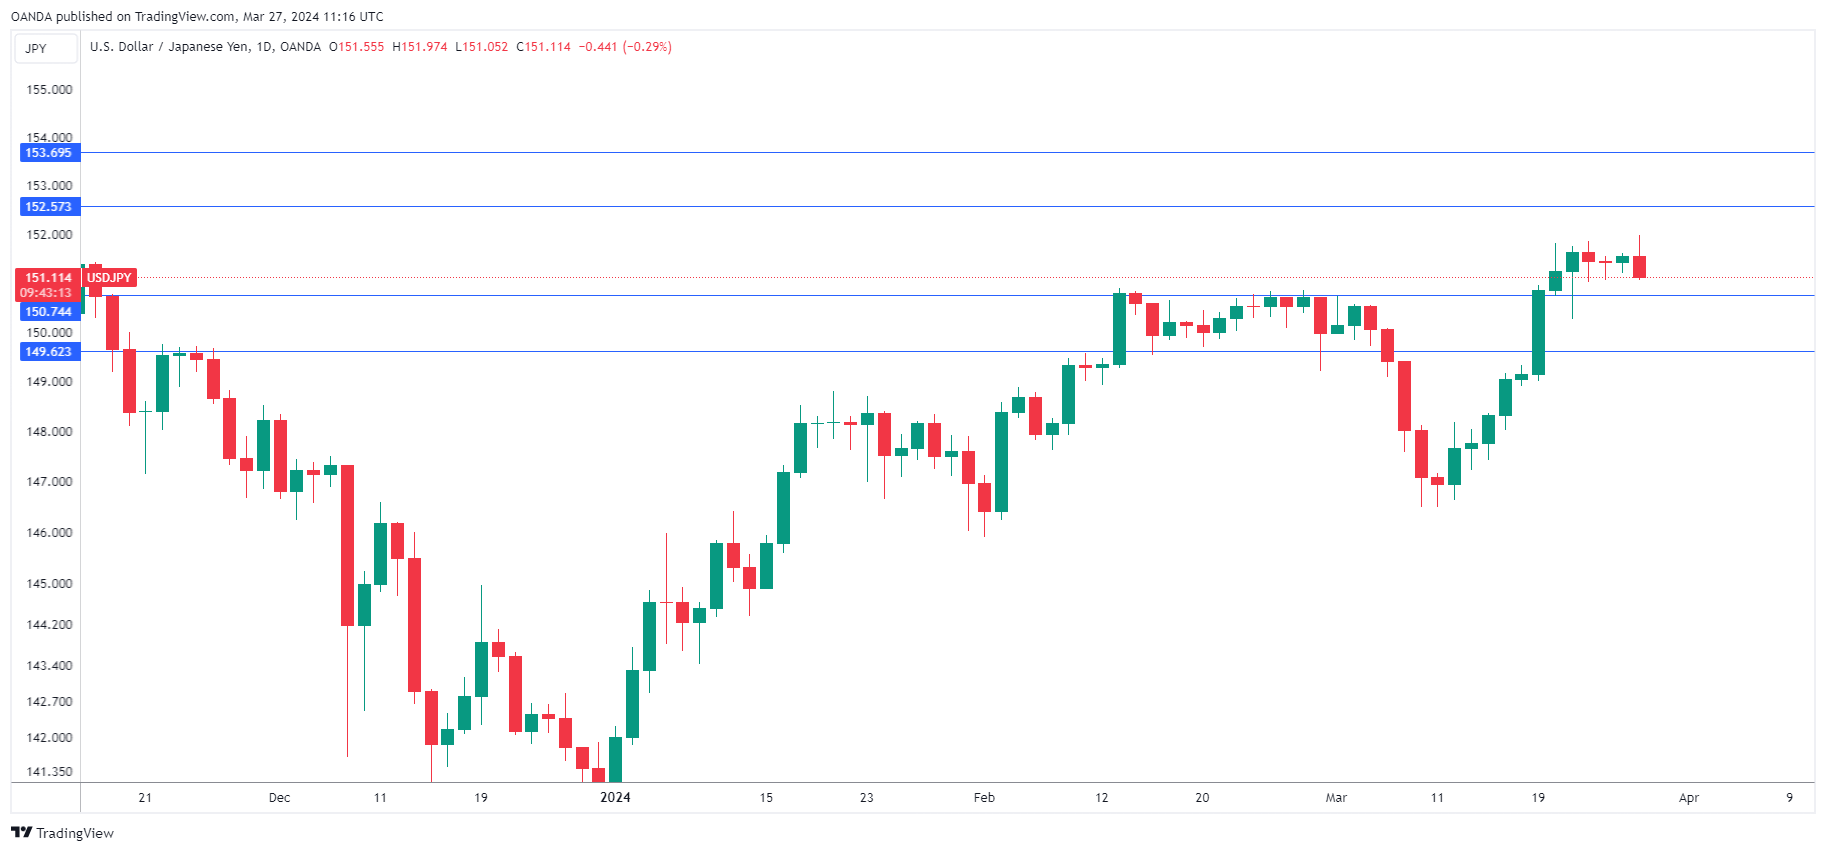
USD/JPY Slides to Lowest Level Since 1990
The Japanese yen has edged higher on Wednesday. In the European session, USD/JPY is trading at 151.17, down 0.26%.
Yen falls to 34-year low, will Tokyo intervene?
The Bank of Japan raised interest rates last week for the first time since 2007. The move marked a sea-change in monetary policy. However, the tightening has not translated into gains for the Japanese yen, which remains under pressure. Earlier today, the yen fell as low as 151.97, its lowest level since 1990.
Will the yen’s slide trigger a currency intervention from Japan’s Ministry of Finance? The MOF intervened last October when the yen dropped to 151.94, which means we are clearly within “intervention territory”. The MOF’s response to the current decline, however, has been limited to verbal intervention.
On Monday, as the top currency diplomat, Masato Kanda, sent a warning to speculators that he was concerned by the yen’s slide, saying it did not reflect fundamentals. Earlier today, Japan’s finance minister, Shunichi Suzuki, warned that excessive movement by the yen would be answered with “decisive steps”.
Japanese officials have limited their response to the yen’s woes with jawboning but the risk of intervention is very real and will increase if the yen continues to lose ground. Still, it should be noted that last year’s interventions didn’t really get the job done, as yen gains were short-lived.
The lack of certainty as to whether Tokyo will intervene to prop up the yen could result in volatility for USD/JPY and investors will be listening carefully to every comment coming out of the BoJ or the MOF.
USD/JPY Technical
- USD/JPY remains range-bound on the weekly chart:
- 152.58 and 153.70 are the next resistance lines
- There is support at 150.74 and 149.62
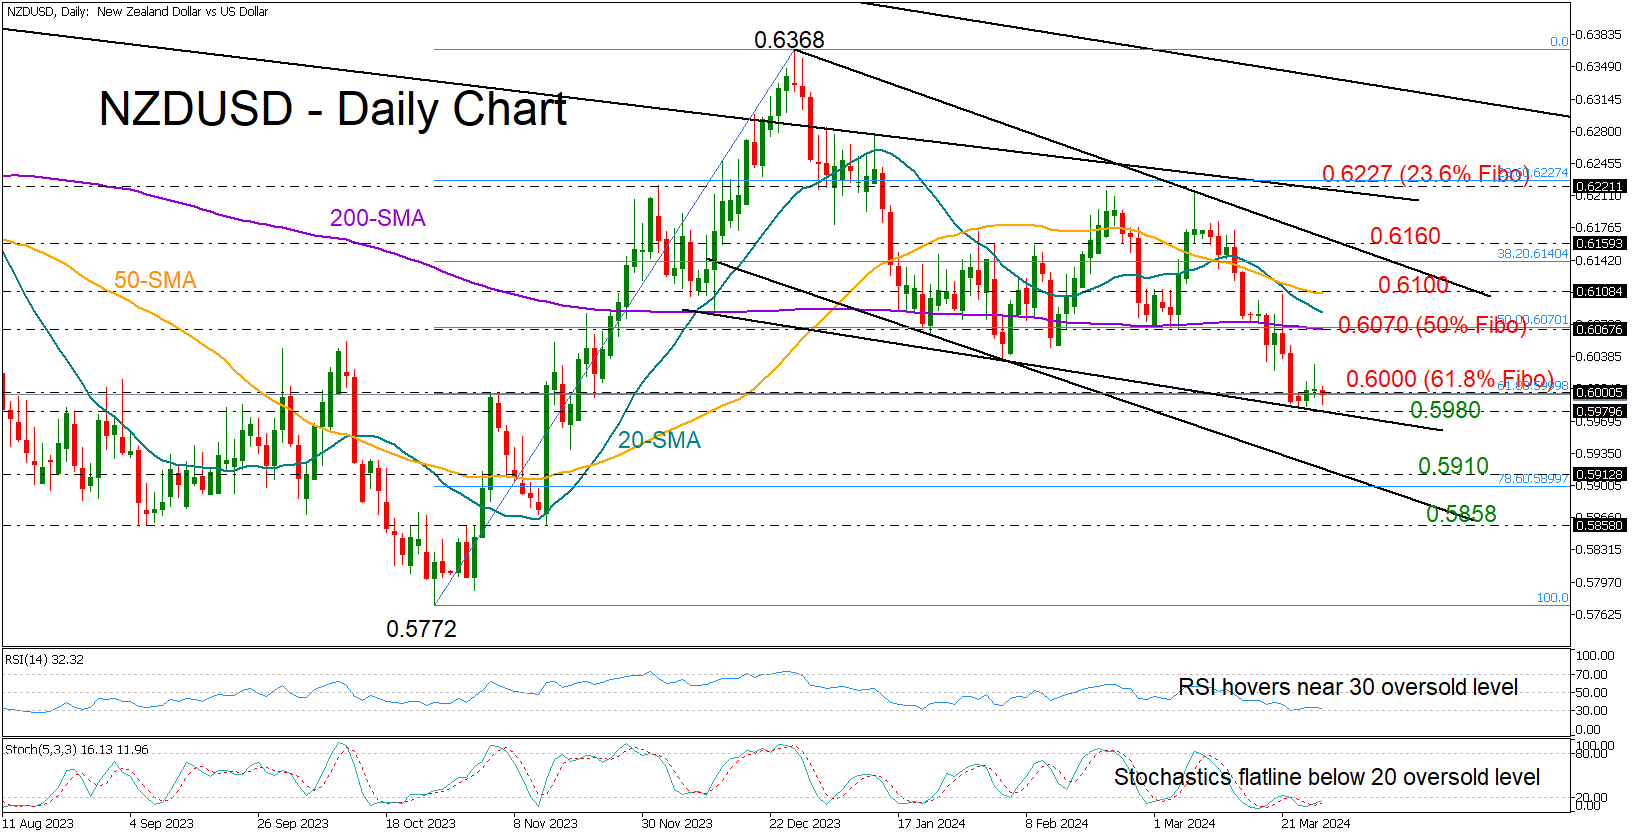
NZDUSD Returns to Bearish Trend
- NZDUSD extends bearish trend to a four-month low
- Resistance near 0.6000; support seen at 0.5980
Following two weeks of losses, NZDUSD is now aiming to find a firm footing around 0.6000, having dropped to a four-month low of 0.5984.
The latest bearish wave has re-activated the downtrend from December’s peak of 0.6368. Overcoming the 61.8% Fibonacci retracement of the October-December upleg at 0.6000 may prove difficult, leading to a decline below the support trendline at 0.5980 and a subsequent search for support around the 0.5900 constraining zone. Even lower, the decline could take a breather near the 0.5858 barrier.
From a technical point of view, a rebound is still possible in the coming sessions, as both the RSI and stochastic oscillators indicate oversold conditions.
Should buying interest resurface, traders could push for a close above the SMAs, currently within the 0.6070-0.6100, region before they target the tentative resistance trendline at 0.6160. A break higher could shift the spotlight to the descending constraining trendline from January at 0.6220.
In brief, NZDUSD has resumed its short-term downtrend, with sellers waiting for a move below 0.5980 to gain fresh momentum.
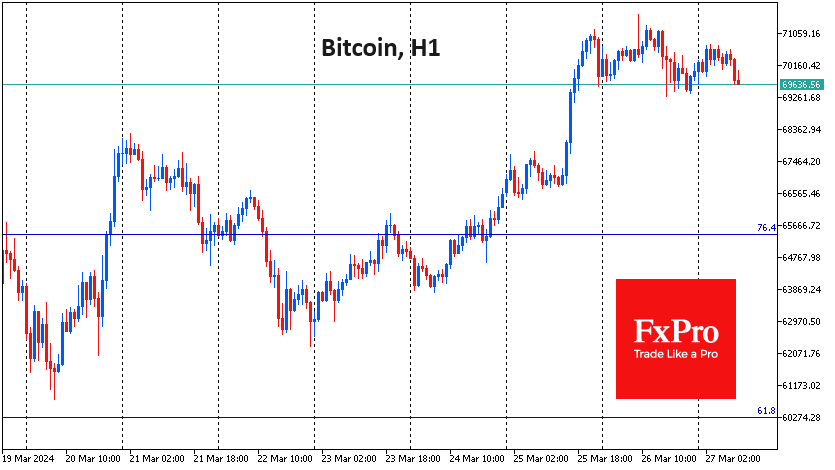
Crypto Market: A Breather After the Climb
Market picture
The capitalisation has stabilised around the $2.63 trillion level, losing 1.7% in 24 hours, but very close to where it was at the end of the day on Monday. Bitcoin is down 1.2%, Ethereum lost 2.3%, BNB sank 3%, and Solana is minus 4%. On the surface, the trend is for a deeper pullback in the coins that have rallied the most in recent days.
Bitcoin has fallen back below $70K, which can be attributed to the bulls’ need to let off steam and the general decline in risk appetite in global markets. The short-term focus for traders will be to see if Bitcoin can retest Tuesday’s intra-day lows near $69.5K. A break below this level could signal a more protracted correction.
New background
The US Department of Justice has filed charges against one of the world’s largest crypto exchanges, KuCoin, and two of its founders. The exchange is accused of ignoring US anti-money laundering laws and failing to monitor suspicious transactions as US law requires.
Bitcoin is more like a precious metal than a risky asset, according to BlackRock. However, it is unsuitable for high concentration in portfolios because of volatility, which becomes a huge risk factor.
The recent correction in BTC has almost completely repeated the pattern seen before the 2020 halving. Bitcoin has pulled back 18% in this cycle, while the asset is down just over 19% in 2020, the Rekt Capital analyst noted.
Spot Ethereum ETFs will be approved in May despite claims of the SEC’s “lack of engagement” with applicants, Grayscale believes. Many of the details had already been worked out before the spot bitcoin ETFs were approved. Bloomberg puts the chances of the ETH ETF being approved at “a very pessimistic 25%”.
The US SEC has asked a New York court to order Ripple to pay a $2 billion fine for violating securities laws. The case regarding the company’s institutional sales of XRP is ongoing.
According to Arkham Intelligence, the anonymous whale, who had been sleeping since 2019 with a balance of 94,500 bitcoins (the fifth largest accumulated coin), became active on the eve of the halving. He split his assets between three newly created cryptocurrency wallets. Santiment believes that such transactions could be a sign of preparation for a sale.
NIKKEI-225 Analysis Indicates Possibility of Correction from Historically High Levels
On March 21, the value of the Japanese stock index reached a historical maximum, exceeding the level of 41,100 points. This was facilitated by:
→ Weak yen supporting exporters. It increases the value of profits earned abroad for a large number of companies that sell their products abroad and then convert the profits into yen.
→ Demand for shares of Japanese companies paying dividends. For example, shares of air conditioner manufacturer Daikin Industries rose by 2.82%.
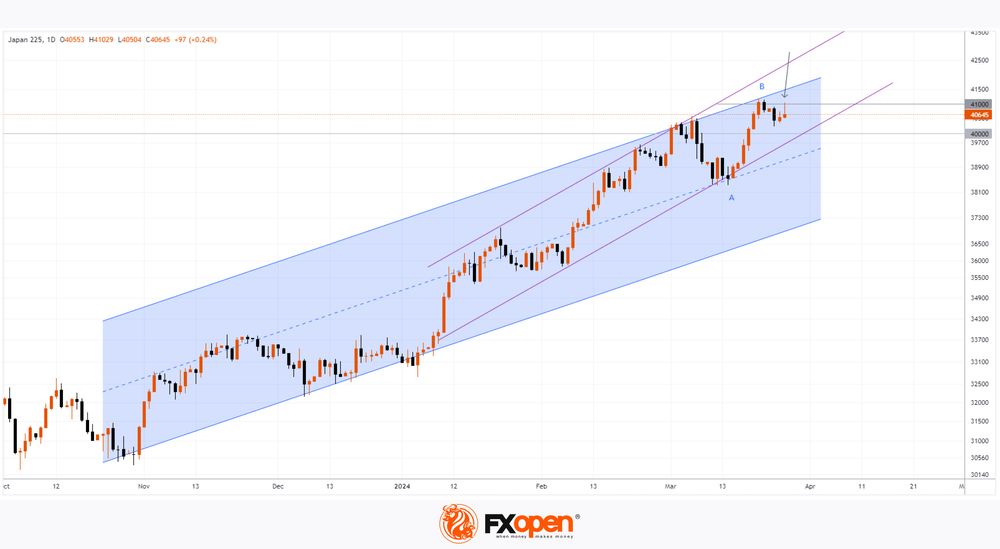
At the same time, the NIKKEI-225 chart signals indicate the likelihood of a correction, since:
→ The price is near the upper border of the ascending channel, from which resistance can be expected.
→ Based on the results of trading in the Asian session, a long upper shadow is forming on today’s candle – a sign of selling pressure (as shown by the arrow). It seems that the price of NIKKEI-225 is difficult to stay above the level of 41,000.
If the Japanese stock market follows a correction scenario, the price of NIKKEI-225 may be supported by:
→ the lower boundary of a steeper ascending channel (shown in purple), which runs in the area of the Fibonacci level = 50% of the A→B impulse;
→ psychological level of 40,000.
Bearish sentiment for NIKKEI-225 could be triggered by decisions from the Bank of Japan and the Ministry of Finance, which are concerned about the weakness of the yen — the USD/JPY rate is today near a 34-year low.
Trade global index CFDs with zero commission and tight spreads. Open your FXOpen account now or learn more about trading index CFDs with FXOpen.
This article represents the opinion of the Companies operating under the FXOpen brand only. It is not to be construed as an offer, solicitation, or recommendation with respect to products and services provided by the Companies operating under the FXOpen brand, nor is it to be considered financial advice.
Australian Dollar Slides to Three-Week Low
The AUD/USD pair is declining, reaching 0.6539 on Wednesday.
The Australian dollar is heading back to a three-week low following the release of softer-than-expected consumer price index (CPI) data from Australia.
For February 2024, inflation in Australia stood at 3.4%, unchanged from the previous report, in contrast to the anticipated slight increase to 3.5%. This marks the lowest inflation level since November 2021.
Last week, the Reserve Bank of Australia (RBA) held its meeting and decided to keep the interest rate unchanged at 4.35% annually. The rate remains at a 12-year peak, unchanged for the third consecutive meeting. The RBA’s stance has slightly shifted; the regulator no longer indicates further rate hikes, confident that inflation will ease pressure. This opens the possibility of rate reductions later in the year.
The US dollar is strengthening today amid growing expectations that the Federal Reserve will maintain interest rates high for an extended period. This contrasts with forecasts of monetary policy easing by other central banks, some of which could occur before the Fed’s actions.
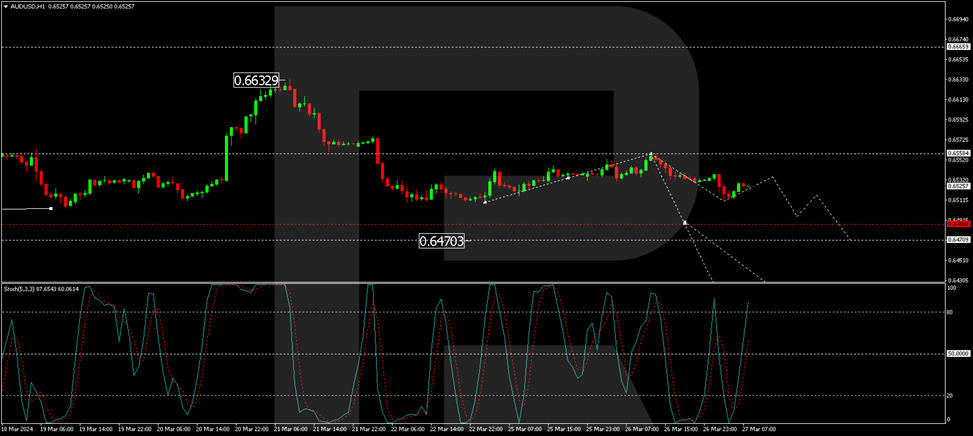
Technical Analysis of AUD/USD
On the H4 chart of AUD/USD, a correction to 0.6558 has been completed. The market is continuing to develop a declining wave to 0.6486. After reaching this level, a consolidation range is expected. With a downward exit from this range, there is a potential for further decline to 0.6417. This target is local. The MACD indicator supports this scenario, with its signal line below zero and strictly directed downwards.
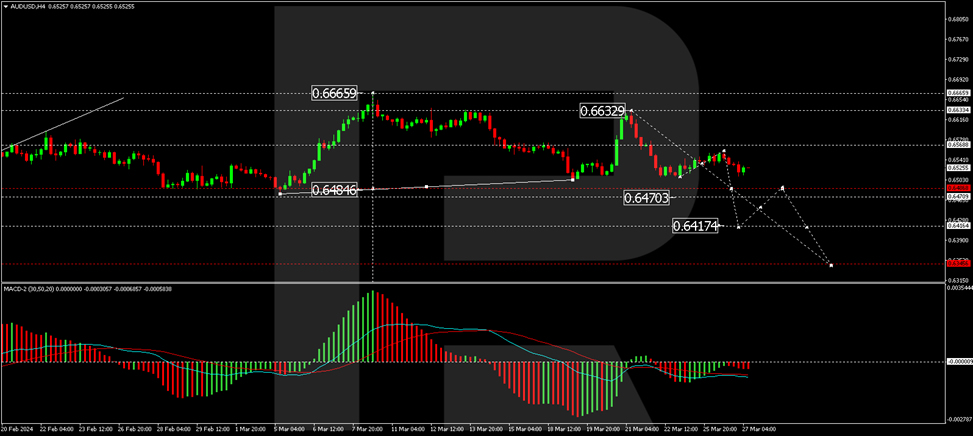
On the H1 chart, AUD/USD is forming a declining wave structure towards 0.6486. After reaching this level, a corrective phase to 0.6533 may occur, followed by a decline to 0.6470, with the potential to continue the trend towards 0.6417. The Stochastic oscillator confirms this scenario, with its signal line above 80 and preparing for a decline to 20.