
Sample Category Title
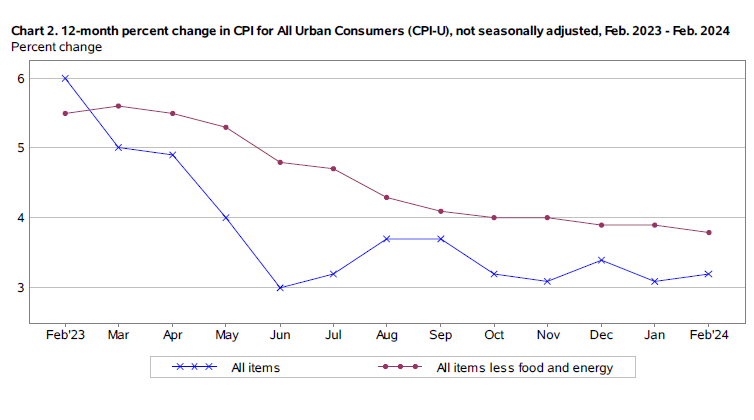
US CPI rises to 3.2% yoy in Feb, CPI core down to 3.7% yoy, both above expectations
US CPI rose 0.4% mom in February, matched expectations. CPI core (ex-food and energy) rose 0.4% mom, above expectation of 0.3% mom. Food index was unchanged whole energy index rose 2.3% mom.
Over the 12-month period, headline CPI accelerated from 3.1% yoy to 3.2% yoy, above expectation of 3.1% yoy. CPI core slowed from 3.9% yoy to 3.8% yoy, above expectation of 3.7% yoy. Energy index was down -1.9% yoy while good index was up 2.2% yoy.
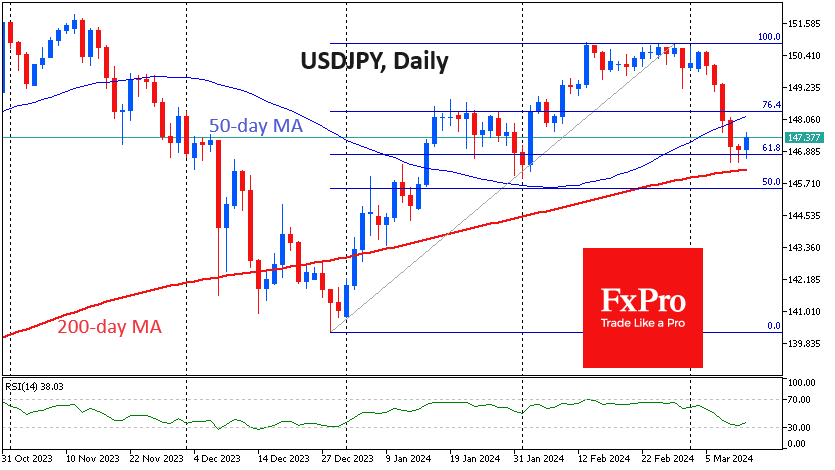
USDJPY: Samurai Weighing the Next Move
USDJPY is bouncing back after five trading sessions where it fell by a cumulative 2.5%. On daily timeframes, the pair’s subsequent move after the pause allows us to determine further medium-term trends.
The weakening of the dollar accompanied the pair’s decline since the end of last month, but it can also be seen as a correction from the late December lows at 140.3 to last month’s peaks at 150.8. Buying in the pair came at the 61.8% level, emphasising the classic Fibonacci pattern.
USDJPY also approached the 200-day moving average, which has acted as a support level since mid-2023.
The yen is likely to go into consolidation for a week, freezing up until the Bank of Japan’s decision next Tuesday. This is also a sufficient interval for market forces to build up enough liquidity to make a decisive move in one direction or another.
Potentially, a failure of USDJPY below 146 would signal a victory for the Bears, making us expect the next consolidation no earlier than 140-141.
On the contrary, the ability to get back above 148, where the 50-day moving average is located, would be an early signal of the pair’s resumption of growth with the first potential target at 150.8.
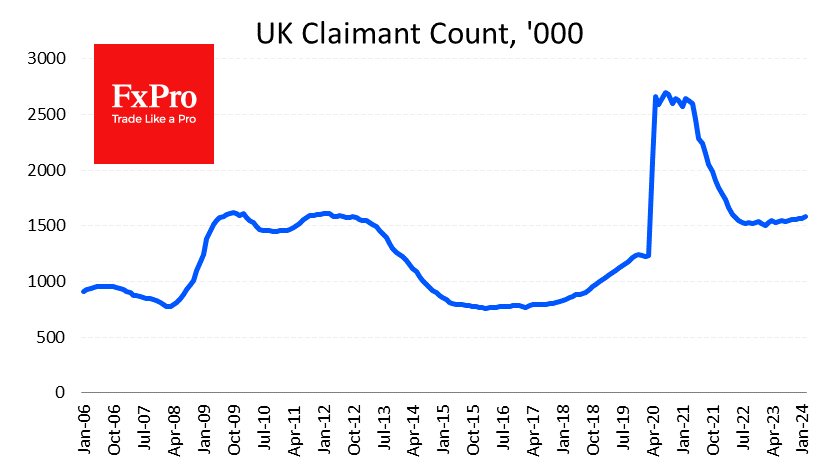
UK’s Slowing Wage Growth Drop Crumbs to BoE’s Doves
The British Pound is losing ground against the US Dollar for the second day in a row as pressure mounts on fresh UK employment data.
Data for February showed a rise in Claimant Count by 16.8K – the biggest since April last year. Overall, a moderate growth trend has now been in charge for a year, after almost a year of stagnation.
The pace of wage growth has continued to slow. Earnings growth, including bonuses, slowed to 5.6% in the three months to January from 5.8% previously. This is the lowest rate in a year and a half and below the forecast of 5.7% but well above the historical average of 3.3%.
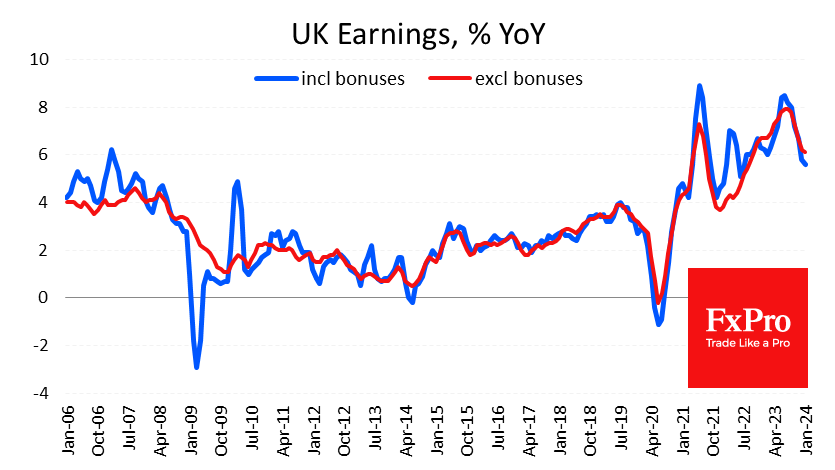 At 3.9%, unemployment remains close to lows not seen since the mid-1970s.
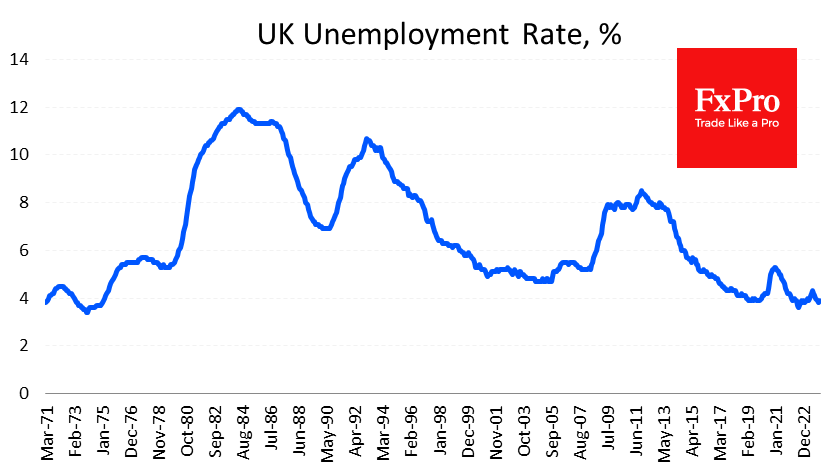
On balance, the labour market indicators allow the Bank of England to ease monetary policy at a much earlier date while not fuelling speculation of an imminent or imminent economic contraction. Despite high interest rates, full employment is supporting domestic final demand, which accounts for over 80% of the UK GDP.
EUR/JPY Price Forecast – Technical Analysis Outlook
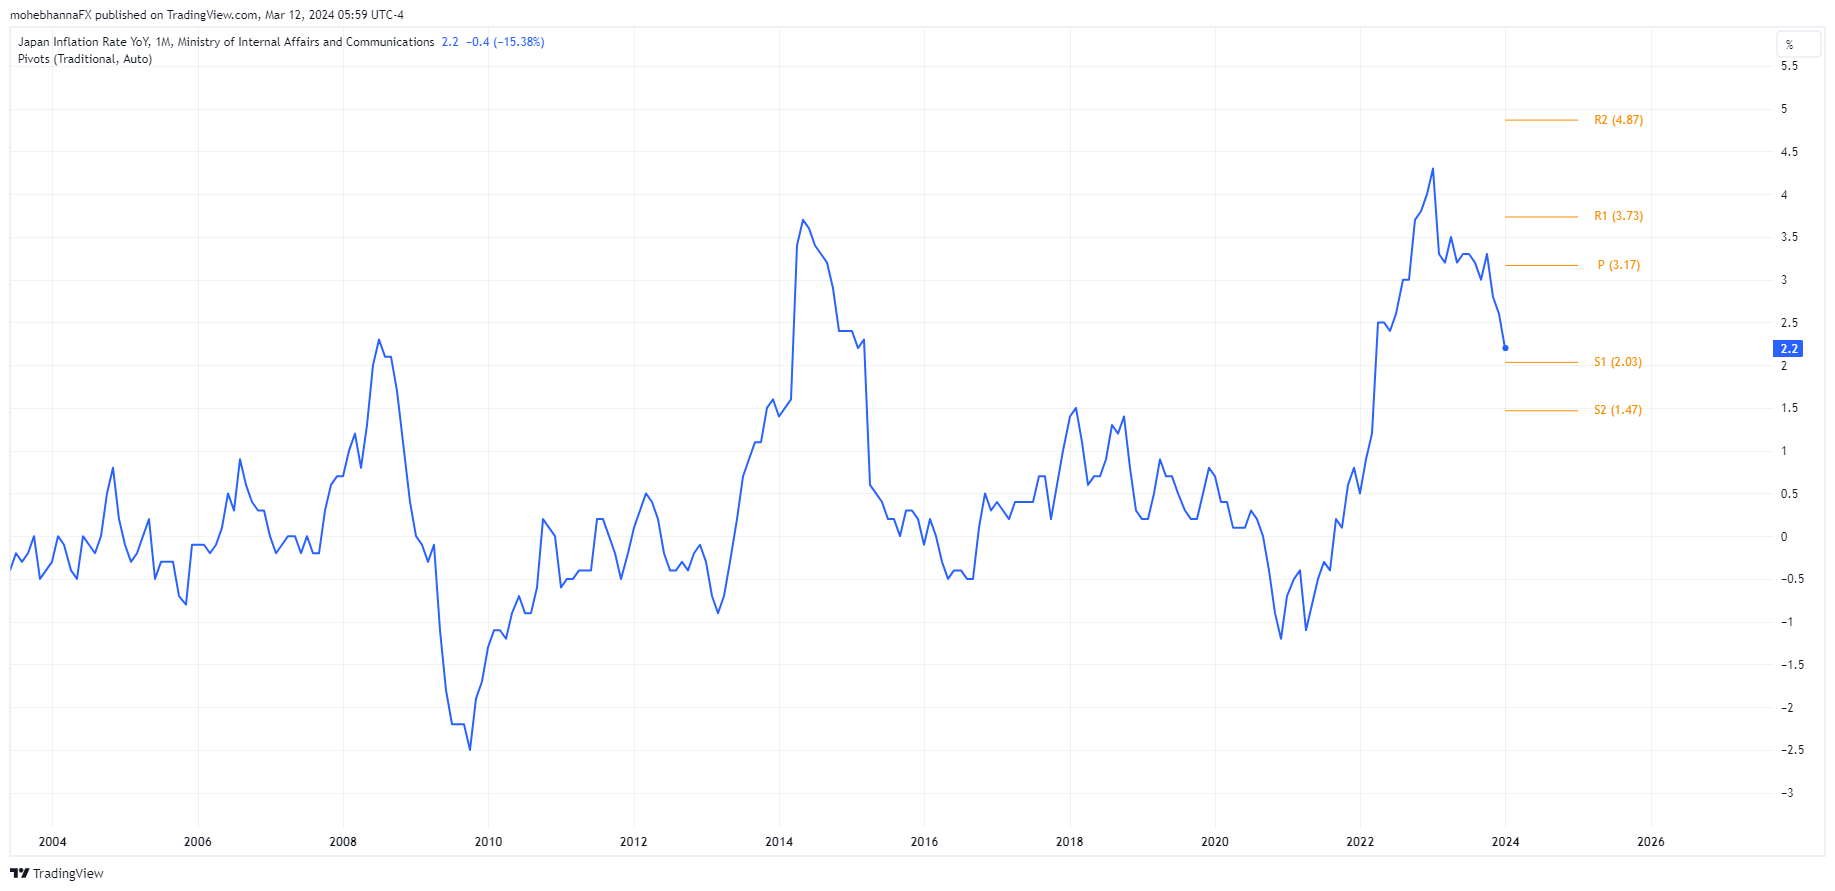
Next week, markets await the Bank of Japan’s policy rate, monetary policy statement, and press conference, market participants are speculating whether the BOJ will raise interest rates for the first time since 2007. Last week, the Yen appreciated by 1.85% against the Euro, as EURJPY dropped from a high of 163.56 to a low of 160.57 as rate speculation began. BOJ decisions can be unpredictable; some government officials and a few BOJ members favor rate hikes as wages improve, while others suggest waiting for more clarity. Either way, a BOJ move can potentially be either in March or April meeting. Other than a few spikes, Inflation in Japan has been steadily rising since 2009; Japan’s m/m inflation Rate currently stands at 2.2%.
Weekly chart
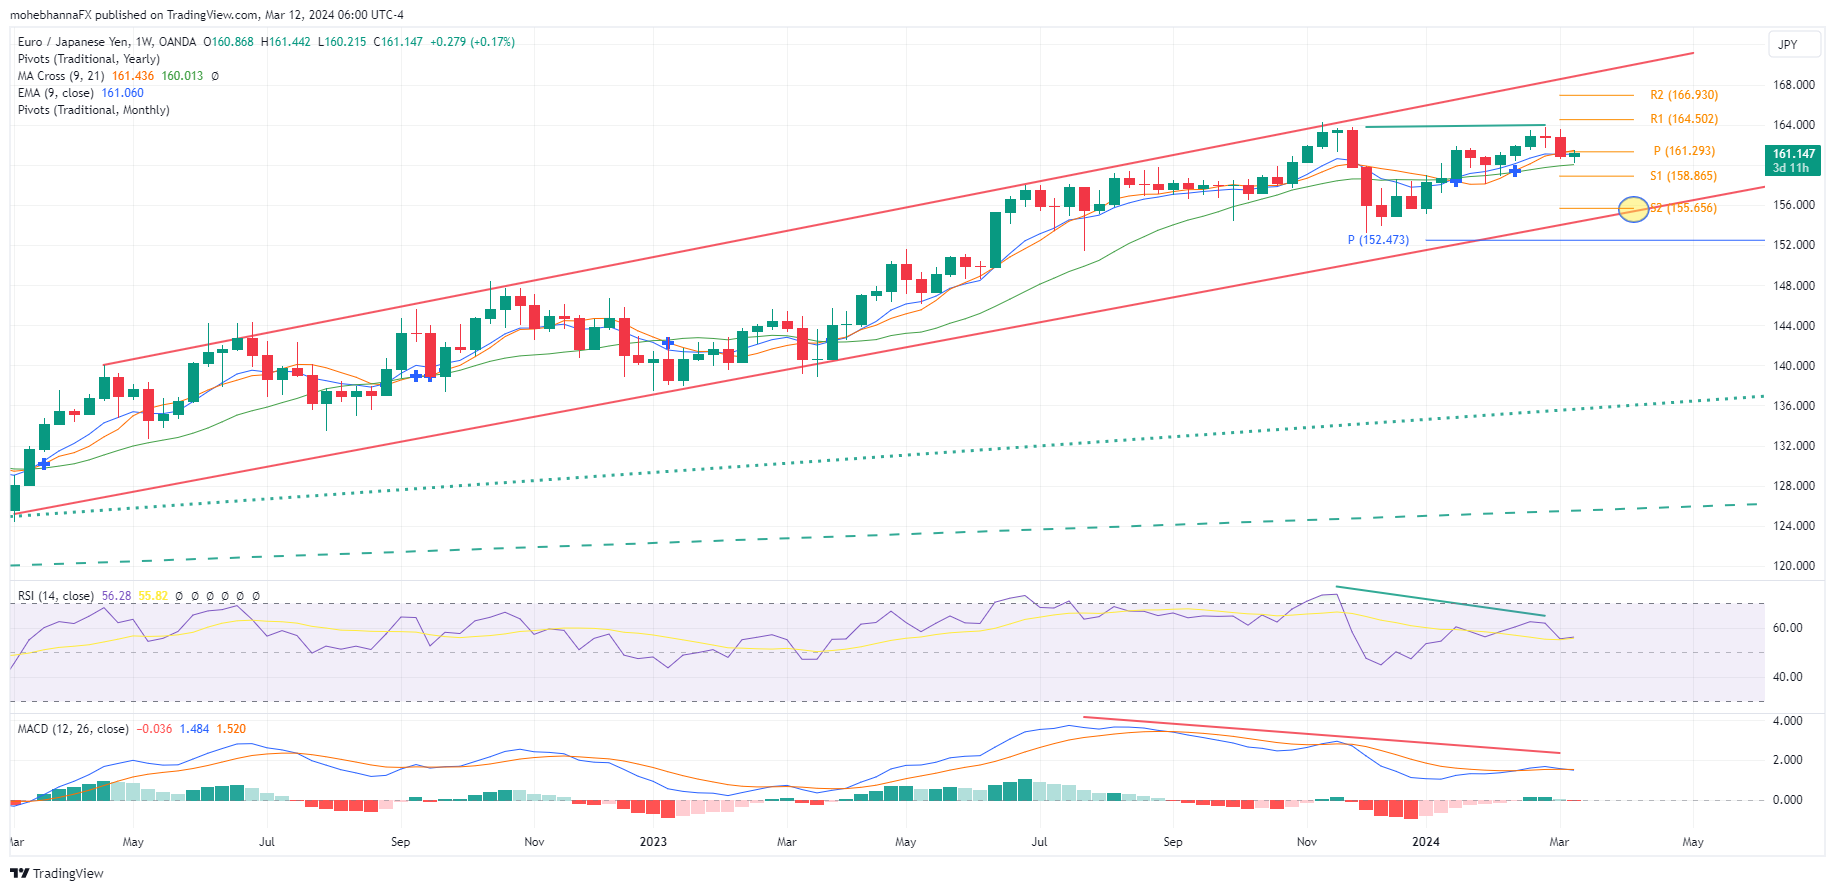
Price trading within an ascending channel (Red lines) began early in March 2022, shortly before the FOMC and ECB started raising interest rates on their respective currencies. Price is currently trading near the channel’s mid-range ahead of US CPI.
Last week, a bearish engulfing candle formation closed below the monthly pivot point of 161.29. Price action also closed below its EMA9 and MA9. This week’s candle is trading mid-range, reflecting indecision; however, we are still early in the week and have four more trading days.
RSI and MACD reflect negative divergences as price action makes higher highs while both indicators make lower highs.
The COT report for the week ending March 8th, 2024 (including data up to the end of the day on Tuesday, March 5th, 2024) shows that Commercial positioning level for the Japanese Yen is almost at its all-time highs, reflecting a potential change in sentiment.
8–Hour chart
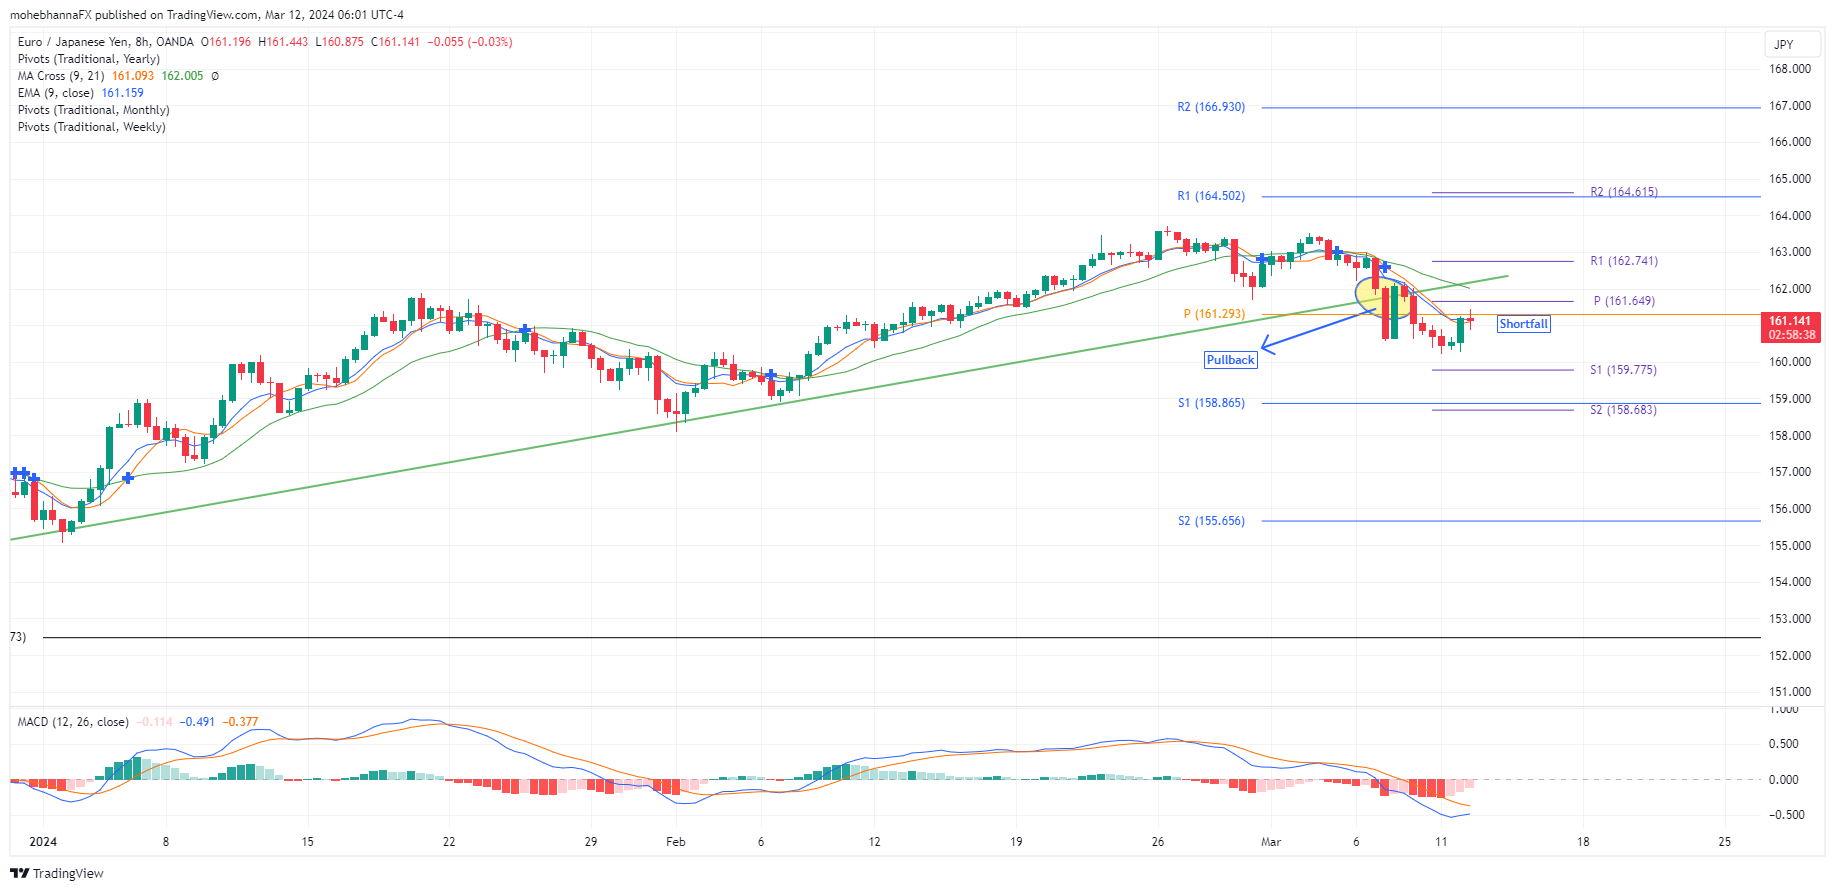
A closer look at shorter time frames shows Price action breaking (Yellow circle) below an intermediate trendline (Green line). The break was followed by two pullback attempts, where price action failed to break back above the line. A third pullback was attempted, but it resulted in a shortfall.
Price action has failed to break above the weekly and monthly pivots within the range of 161.29 – 161.64. The level is currently acting as resistance. A break and a close above the range and the broken trend line are required to validate any upside price action.
Japanese Yen Weakens After Five Sessions of Gains
The USD/JPY pair has begun to rise, reaching 147.33. This shift follows five consecutive sessions of yen appreciation without interruption.
Firstly, the US dollar has halted its rapid decline and shows signs of strengthening. This shift has led to a "pause" in the rally on the currency market. Secondly, investors have already priced in the full range of news and comments regarding the Bank of Japan's interest rate.
A report from Capital Economics suggests that the yen could transition to steady strengthening this year, supported by several factors.
On one hand, the unions' ongoing demands for higher wages indicate a stable trend towards price increases while the economy remains relatively stable. On the other hand, the interest rate differential is expected to shift in favour of the yen shortly.
This is probable as the interest rates of G-10 countries are projected to decrease in the second quarter. Japan will likely end its "ultra-loose" monetary policy in April, laying the groundwork for the yen's long-term strengthening.
Recent statistics reveal that Japan's GDP in Q4 2023 grew by 0.1% quarter-over-quarter and 0.4% year-over-year, significantly exceeding forecasts and surpassing Q3 2023 figures. Notably, the capital expenditure component for Q4 saw a 2.0% quarter-over-quarter increase, contrary to the expected 0.1% decrease.
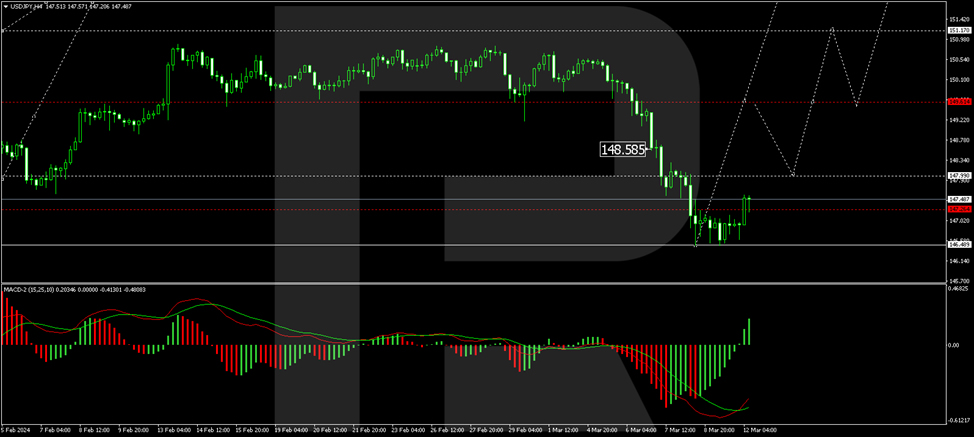
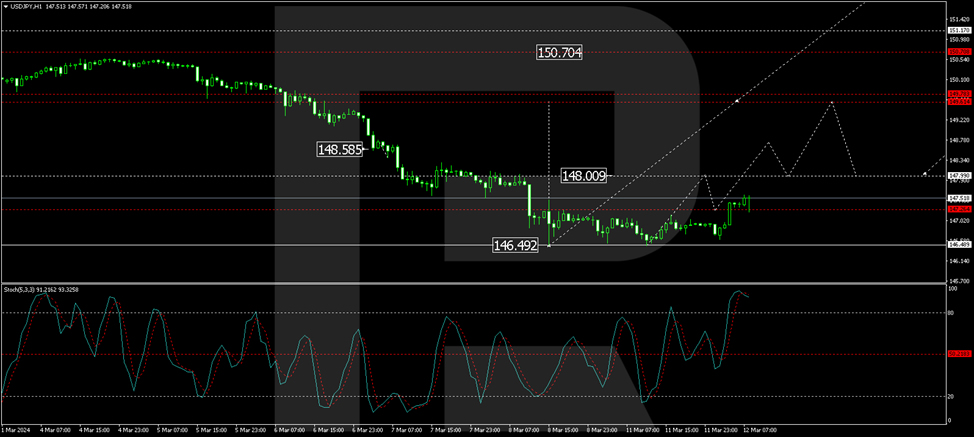
Technical analysis of USD/JPY
On the H4 chart, USD/JPY has formed a consolidation range above the 146.49 level. The market has broken upward from this range, suggesting a growth wave towards 149.60 as the first target. After reaching this target, a correction to 148.00 is possible. The MACD oscillator supports this scenario with its signal line trending upwards.
On the H1 chart, USD/JPY has breached the 147.26 level, opening the potential for a growth wave to 148.00 as the first target. A correction wave to 147.27 (testing from above) may follow before rising to 148.78 as a local target. The Stochastic oscillator confirms this scenario with its signal line currently above 80 and preparing to drop to 50.
GBP/USD Loses Ground on Soft Employment Report
The British pound has extended its losses on Tuesday. In the European session, GBP/USD is trading at 1.2799, down 0.26%.
UK job market slows down
The UK labor market has remained resilient despite elevated interest rates but is showing signs of cracks, based on today’s employment release.
The unemployment rate rose to 3.9% in the three months to January, up from 3.8% in the three months to December and above the market estimate of 3.8%. Wage growth excluding bonuses dropped to 6.1% in the same period, down from 6.2%. Employment growth declined by 21,000, compared to a 72,000 gain in the three months to December and missing the market estimate of a gain of 10,000.
The data shows that the Bank of England’s rate policy, which has slowed economic activity, has dampened the labor market. This is significant as strong employment numbers, in particular wage growth, have driven inflation. If the labor market continues to weaken, there will be more pressure on the BoE to reduce interest rates later in the year.
The markets are widely expecting the BoE to hold rates at next week’s meeting and have fully priced a cut in August. If economic data is weak and inflation continues to drop closer to the 2% target, the BoE could start to lower rates even earlier.
The UK releases GDP on Wednesday. The market estimate for January stands at 0.2% y/y after a 0.1% decline in December. The economy slipped into a recession in the fourth quarter 2023, as GDP contracted by 0.3%, which marked a second straight quarter of negative growth.
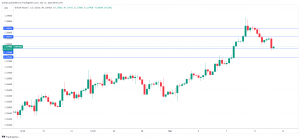
GBP/USD Technical
- There is resistance at 1.2825 and 1.2855
- GBP/USD is testing support at 1.2784. Below, there is support at 1.2754
Nikkei 225 Technical: At Risk of Shaping a Multi-Week Corrective Decline
- Recent rapid gains seen in the Nikkei 225 are likely to be attributed to the highly anticipated positive outcome of Japan’s annual wage negotiations results.
- The expected increase in wage growth for FY 2024/2025 may have already been fully priced in by the Japanese stock market.
- Recent bearish elements sighted in the US S&P 500 may led to a negative feedback loop into the Nikkei 225.
- Watch the key short-term resistance at 39,640 on the Nikkei 225.
The price actions of Nikkei 225 have continued to soar upwards to print fresh all-time highs and hit the lower limit of the 40,500/41,000 medium-term resistance zone (printed an intraday high of 40,472 last Thursday, 7 March).
It seems that last week’s bullish momentum has been driven by the highly anticipated positive results of the closely watched Japanese wage negotiations between labour unions and employers for FY 2024/2025.
Positive outcome of Japan’s annual wage negotiations may have been fully priced in
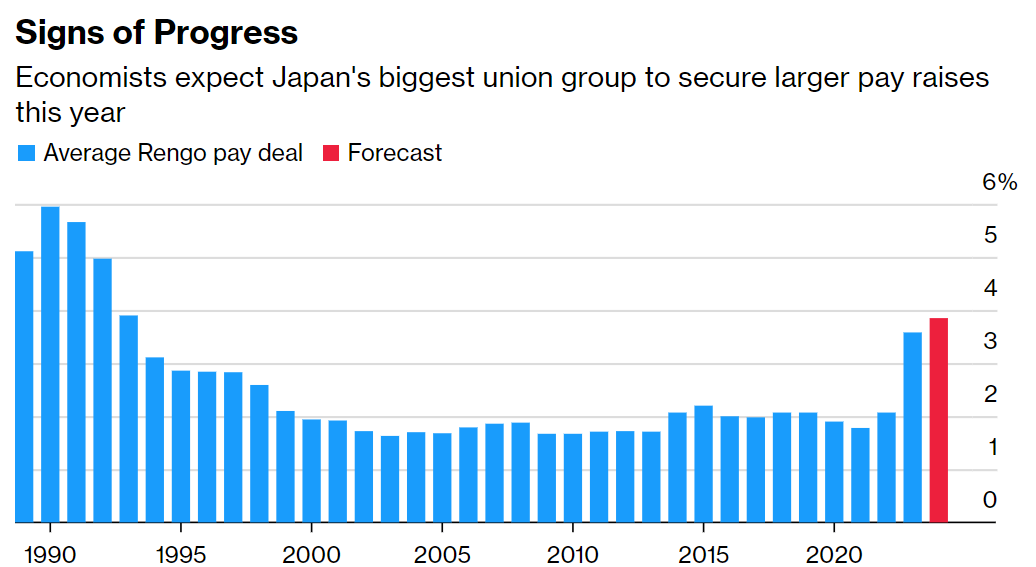
Fig 1: Japanese Trade Union Confederation average annualized pay deal (Source: Bloomberg News as of 10 March 2014, click to enlarge chart)
This coming Friday, 15 March, Japan’s main union group, Rengo will release the preliminary results of its negotiated wage increase for Japanese employees where the consensus is pegged at an expected average annualized increase of 3.85% for FY 2024/2025, above last year’s average increase of 3.58%, and if it turns out as expected, it will be the biggest jump in wage growth in Japan since 1993.
Such a rosy outcome is likely to increase consumer demand and allow the Bank of Japan (BoJ) to push forward to end its short-term negative interest rates policy in place since 2016 either in March or April this year, a signal that BoJ is confident that a decade-plus of deflationary spiral has ended in Japan. Going forward, these fundamental factors and spillovers are likely to a have positive net impact on the Japanese stock market and support a potential long-term bullish trend for the Nikkei 225.
In the short term, highly liquid financial markets tend to be forward-looking, and the potential positive outcome from the annual wage rise negotiations in Japan may have already been discounted as seen by the recent past week of positive movements in the Nikkei 225.
US S&P 500 has a significant direct influence on the Nikkei 225
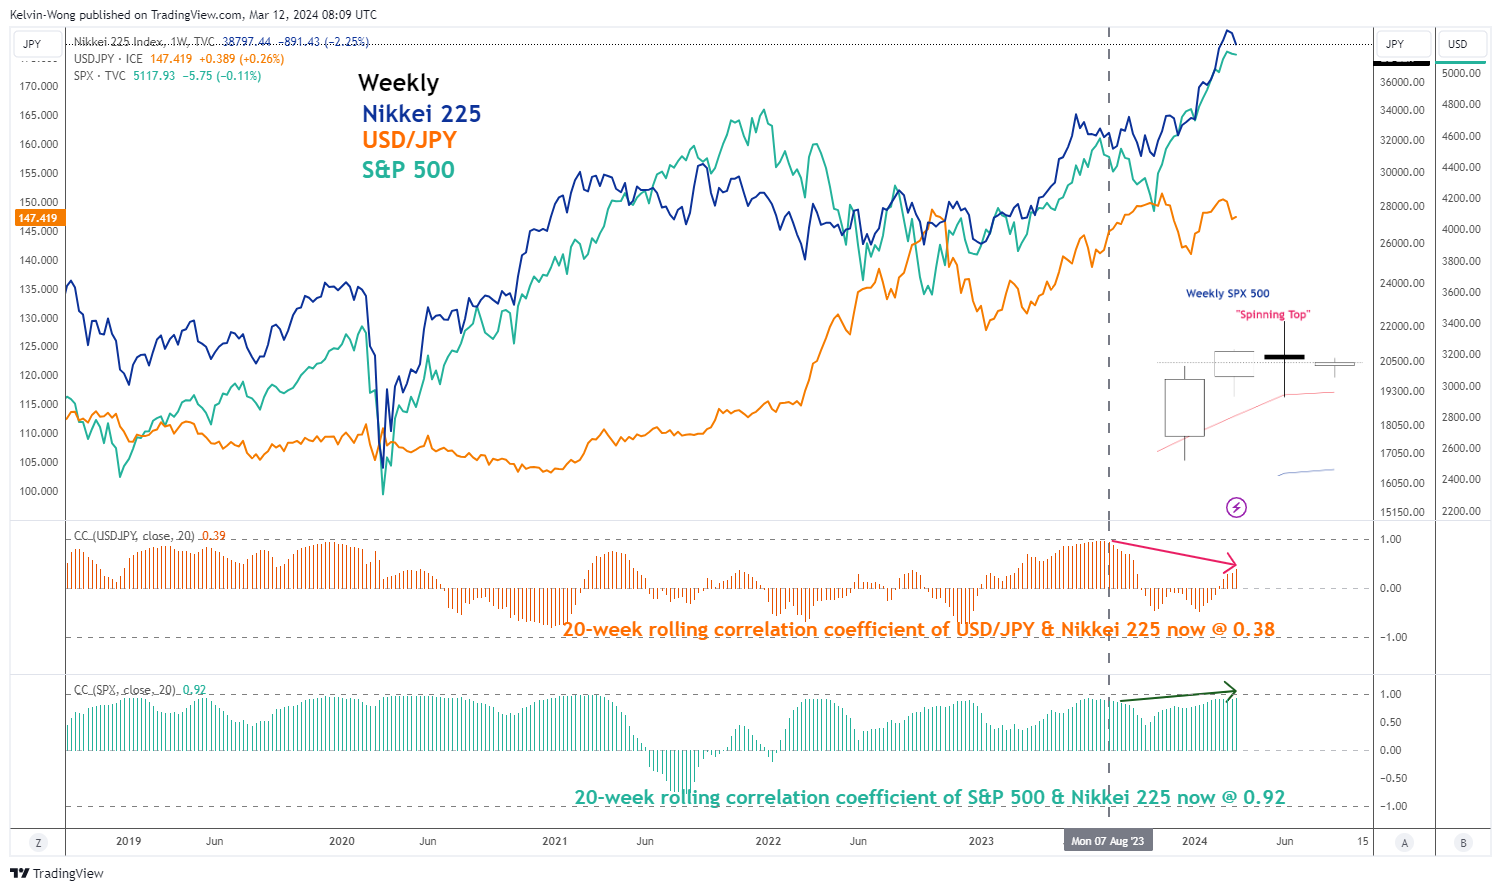
Fig 2: Nikkei 225’s correlation coefficient with US S&P 500 and USD/JPY as of 11 Mar 2024 (Source: TradingView, click to enlarge chart)
Since August 2023, the movement of the Nikkei 225 has started to move in direct lockstep with the US stock market, using the benchmark S&P 500 as the proxy; their direct correlation coefficient stands at 0.9 versus a low correlation coefficient t of 0.4 against the USD/JPY over the same period as of 11 March (see Fig 1).
The price actions of the S&P 500 have recently formed a weekly bearish “Spinning Top” candlestick pattern for the week of 4 March and coupled with other possible bullish trend exhaustion elements highlighted in our previous report, the sum of odds have skewed towards a potential impending multi-week corrective decline sequence for the Nikkei 225.
Medium-term momentum has turned bearish for Nikkei 225
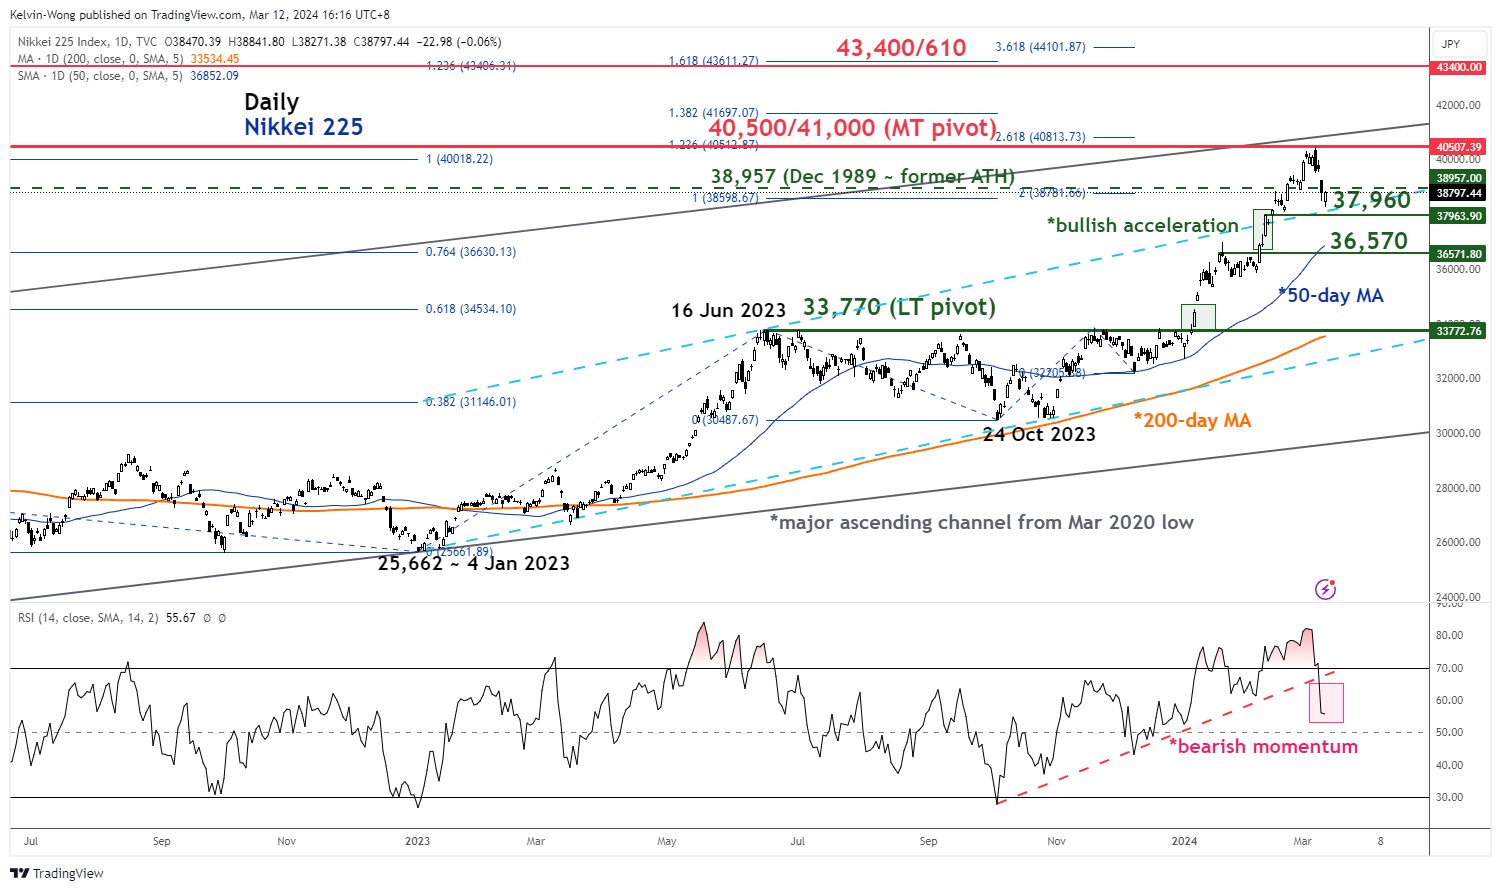
Fig 3: Nikkei 225 major & medium-term trends as of 12 Mar 2024 (Source: TradingView, click to enlarge chart)
The bullish acceleration movement of the Nikkei 225 that kickstarted on 8 February has led its price actions to almost hit a key medium-term resistance zone of 40,500/41,000 on last Thursday, 7 March (also the upper boundary of its major ascending channel in place since 6 March 2020 low).
In addition, the daily RSI momentum indicator has just staged a bearish breakdown below its parallel ascending support of the last prior rally that exited from its oversold region on 4 October 2023.
These observations suggest limited upside potential going forward and the odds favour a partial retracement of its ongoing major uptrend phase from 4 January 2023 low.
Watch the 39,640 key short-term resistance
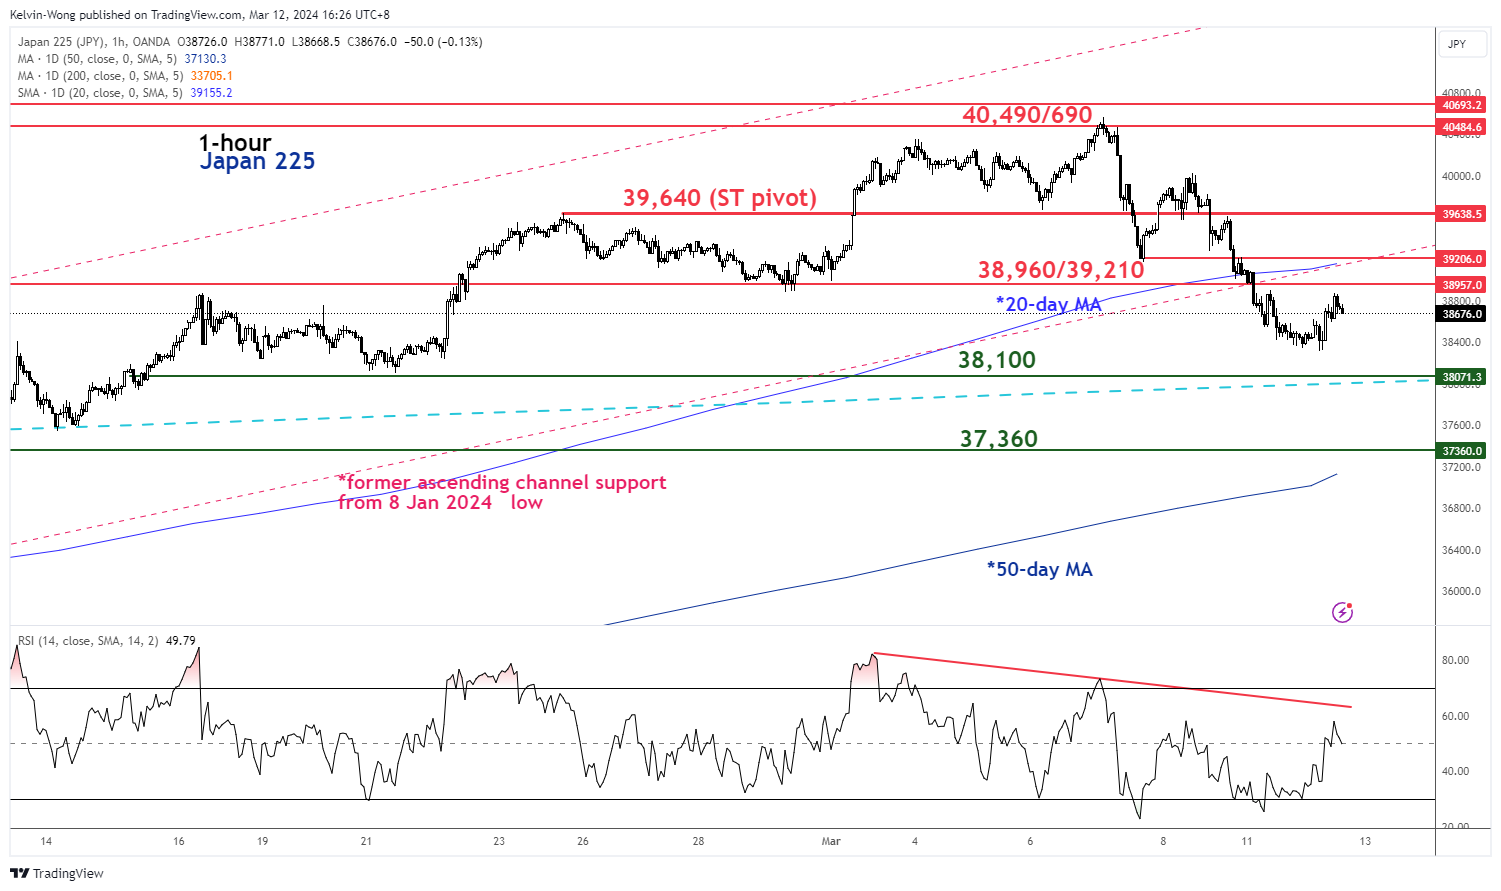
Fig 4: Japan 225 short-term trend as of 12 Mar 2024 (Source: TradingView, click to enlarge chart)
Short-term price actions of the Japan 225 Index (a proxy of the Nikkei 225 futures) have continued to remain lacklustre as it continues to trade below its 20-day moving average, and the former minor ascending channel support now both acting as a near-term resistance zone of 38,960/39,210.
If the 39,640 key short-term pivotal resistance is not surpassed to the upside, the Index may shape another potential downleg to expose the next intermediate supports at 38,100, and 37,360 in the first step.
On the flip side, a clearance above 39,640 invalidates the bearish tone for a continuation of the bullish trend to see the next intermediate resistance coming in at 40,490/690.
EURUSD in the Middle of 2020-2022 Downtrend
- EURUSD trades neutral as US CPI inflation data loom
- Short-term upleg intact but risks remain below 1.0968
EURUSD has been capped below the 50% Fibonacci retracement of the 2020-2022 downtrend at 1.0945 since Friday's flash spike halted near the 1.0980 level and around the resistance trendline from May 2021 on Friday.
The US CPI inflation data could generate fresh volatility today at 12:30 GMT, and the protective 50% Fibonacci retracement of the latest downleg is currently feeding optimism that the next move in the price will be on the upside. That statement, however, should be taken with a pinch of salt as both the RSI and the Stochastics have shifted southwards, reflecting a weakening bullish bias. Perhaps a completed bullish cross between the 20- and 50-day simple moving averages (SMAs) could put some confidence back to the almost one-month positive trend.
If the pair goes beyond the 23.6% Fibonacci level at 1.0968 and closes above the psychological level of 1.1000, the recovery phase could continue to the range of 1.1045-1.1070. Then, the pair might push towards the 1.1100 level or higher with the scope to reach the 1.1150 area.
As an alternative outcome, a downside correction below 1.0916 could result in a move towards the 38.2% Fibonacci level at 1.0865 and the short-term support trendline. Even lower, the 200-day SMA might provide some footing along with the 2020 constraining ascending line ahead of the 23.6% Fibonacci of 1.0800. Another failure there might motivate fresh selling towards the 1.0740-1.0760 territory.
All in all, EURUSD seems to be trading within a neutral territory. Traders could stay patient until they see a close above 1.0945-1.1000 or below 1.0916 to drive the market accordingly.
EURJPY Drops Below Ascending Channel
- EURJPY descends below ascending channel
- But 50-day SMA prevents further retreats
- Momentum indicators are tilted to the downside
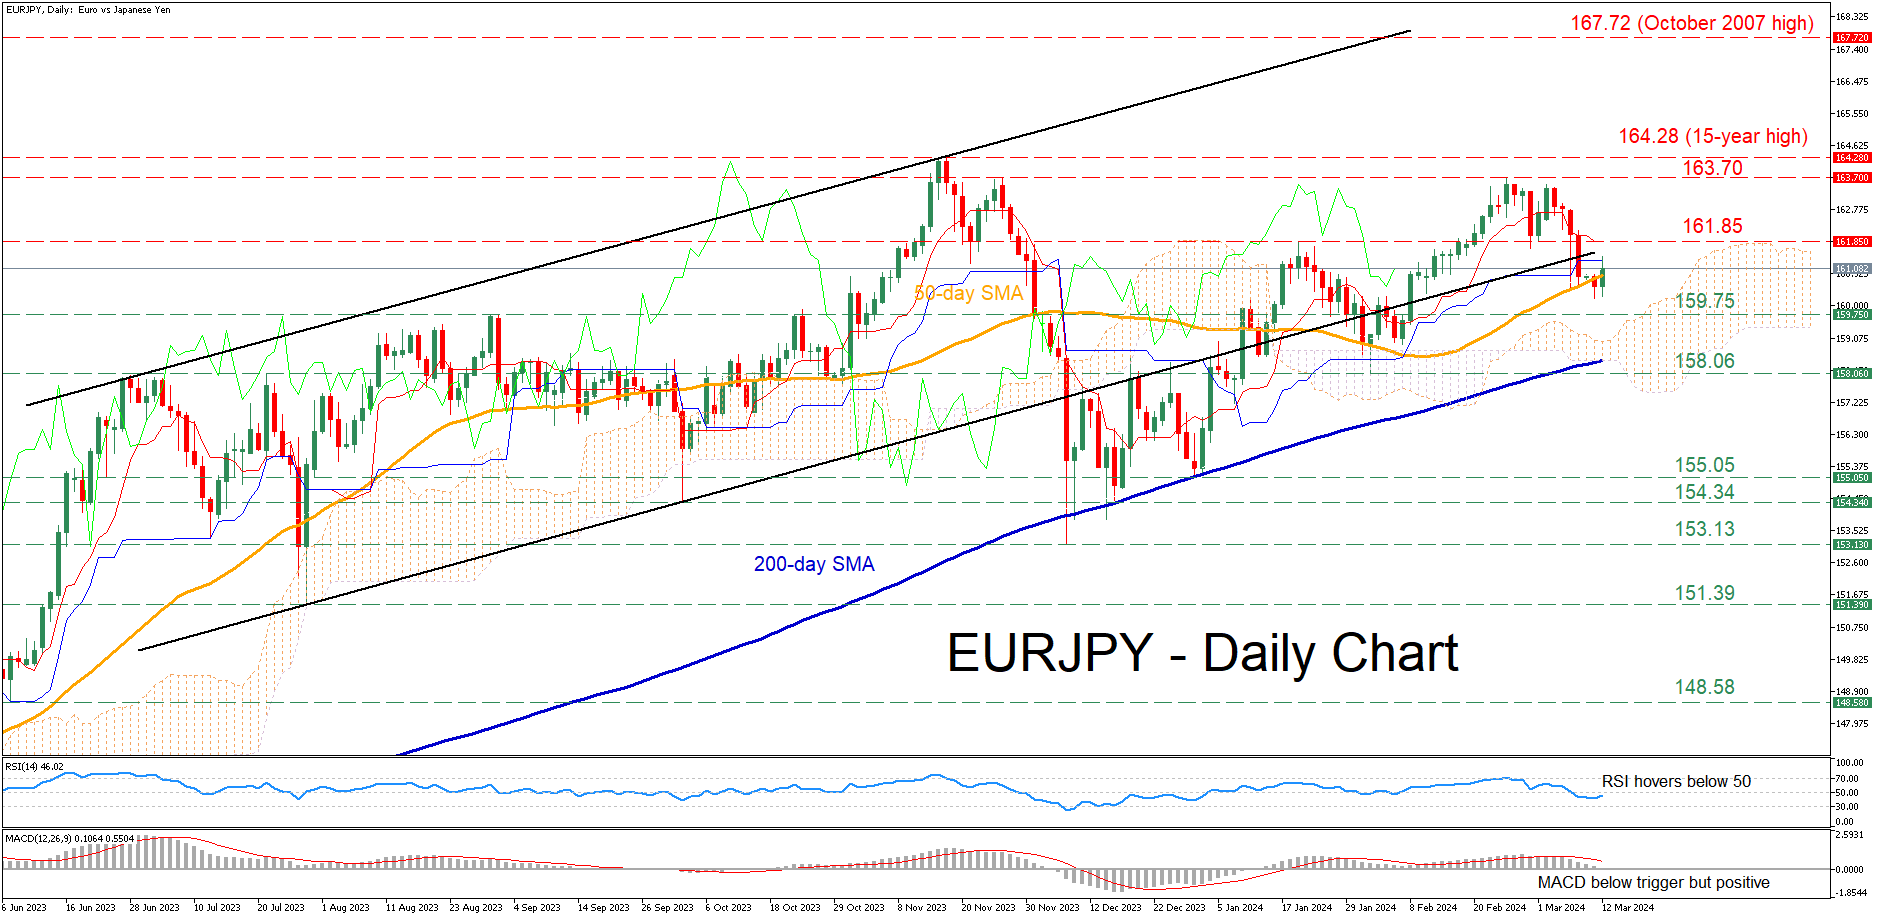
EURJPY has been in a steady advance since December 2023, peaking at the 2024 high of 163.70 on February 27. Since then, the pair has been undergoing a minor correction breaking below the lower end of its upward sloping channel before finding strong support at the 50-day simple moving average (SMA).
Should the 50-day SMA fail to hold its ground, the pair could decline towards the August-October resistance region of 159.75, which might serve as support in the future. Lower, the February support of 158.06 could act as the next line of defence. Dipping beneath that hurdle, the pair could challenge the January low of 155.05.
On the flipside, if the price bounces back and re-enters its bullish structure, immediate resistance could be met at the January high of 161.85. Conquering that zone, the bulls may aim at the 2024 high of 163.70. Further advances could then stall at the 15-year peak of 164.28.
In brief, EURJPY has been on the retreat in the past few sessions, breaking below its long-term bullish structure before meeting support at the 50-day SMA. Hence, a dive below that barricade could accelerate the downfall.
A Weak Dollar Is the Driver of Price Records for NASDAQ-100, BTC/USD, XAU/USD
Financial market participants expect an easing of the Fed's monetary policy. The prospect of lower rates puts pressure on the value of the dollar, which in turn pushes up dollar-denominated assets. This contributed to the setting of record highs:
→ The price of BTC/USD exceeded 70k dollars per bitcoin
→ The price of XAU/USD exceeded USD 2,200 per ounce of gold
→ The NASDAQ-100 index reached 18,400 points.
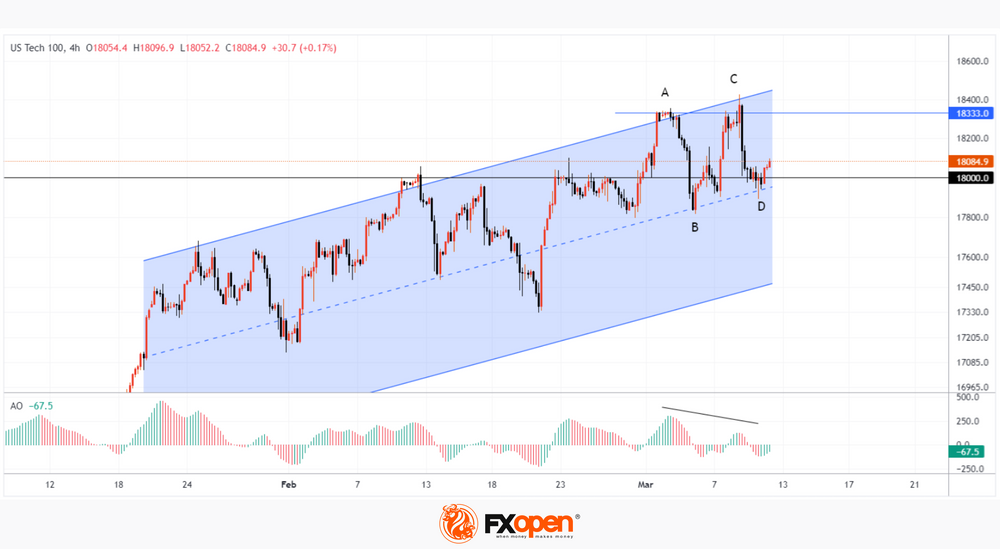
But are markets too optimistic? Let's see what the technical analysis of the NASDAQ-100 chart shows today:
→ The price is in an uptrend (shown in blue), which has been in effect since the beginning of the year. The price is in the upper half, which may indicate the strength of demand.
→ Top C only slightly exceeded the level of the previous top A. It is not surprising that a bearish divergence has formed on the oscillators — Awesome Osc among them. Buyers who entered long positions at the breakout of top A found themselves in a trap. Sellers who held stops above A lost their positions.
Pay attention to the nature of the NASDAQ-100 price movement from tops to local lows A→B and C→D. Each time, the bears were able to quickly lower the price as soon as it exceeded the 18.333 level. This indicates that sellers are active — perhaps they are taking profits after the rally since the beginning of the year.
One way or another, the level of 18.333 looks like an important resistance. So far, the price of NASDAQ-100 is at support from the median line of the channel, but it is possible, given the signs of exhaustion of demand and the activity of sellers, that the price may fall to its lower border, forming a correction. This may happen under the influence of news — today, be prepared, at 15:30 GMT+3 data on inflation in the United States will be published.
Trade global index CFDs with zero commission and tight spreads. Open your FXOpen account now or learn more about trading index CFDs with FXOpen.
This article represents the opinion of the Companies operating under the FXOpen brand only. It is not to be construed as an offer, solicitation, or recommendation with respect to products and services provided by the Companies operating under the FXOpen brand, nor is it to be considered financial advice.