
Sample Category Title
Technical Outlook and Review
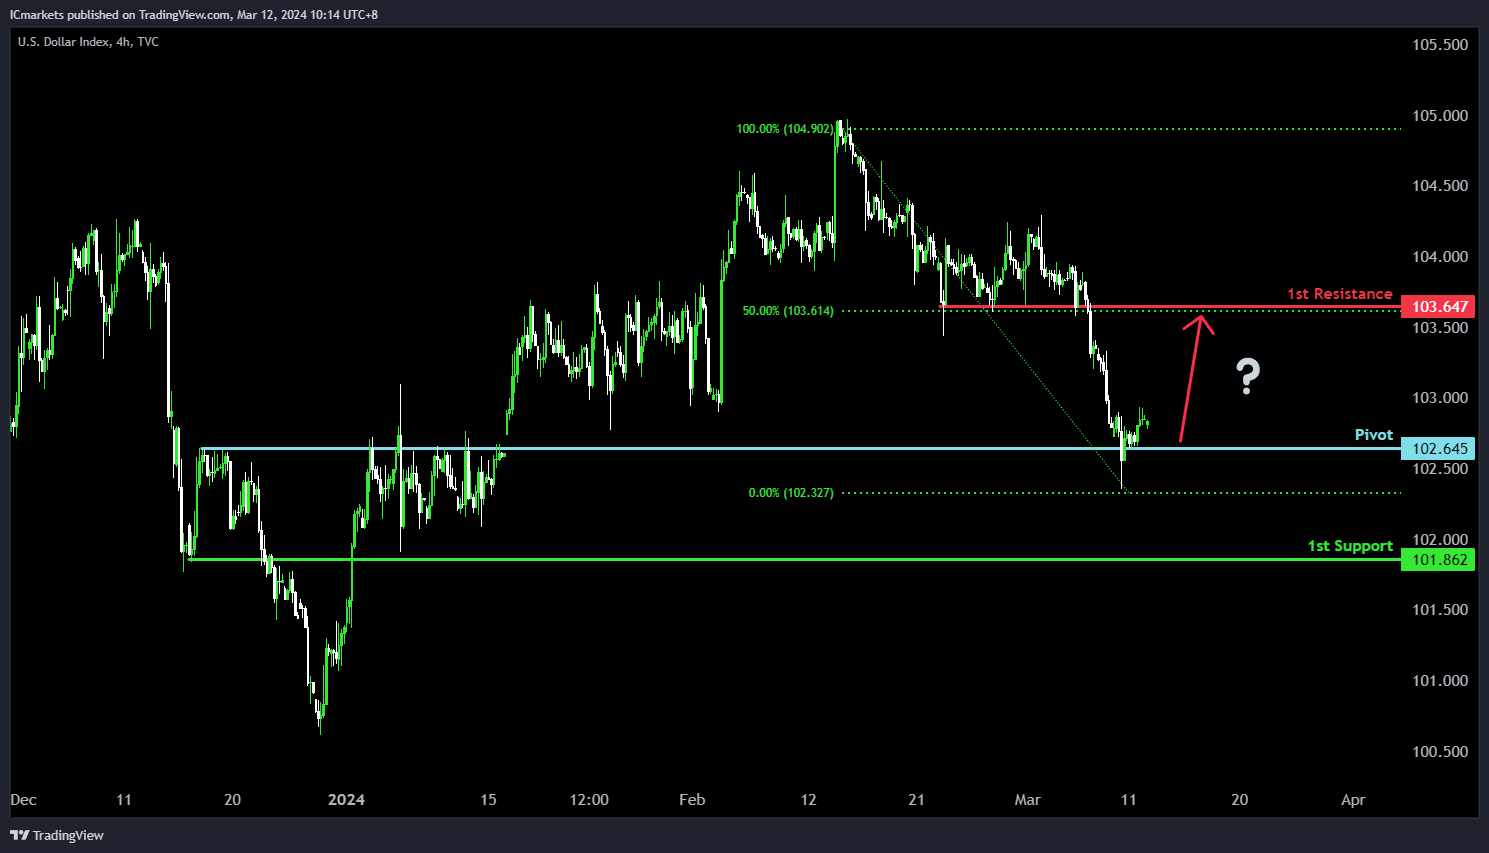
DXY:
The DXY (Dollar Index) chart exhibits bullish momentum, hinting at a potential bullish rebound around the pivot level and subsequent movement towards the 1st resistance. The pivot at 102.86 serves as significant overlap support, indicating potential buyer intervention for a bullish bounce, with the 1st support at 101.86 reinforcing this pattern.
On the resistance side, the 1st resistance at 103.64, accompanied by the 50% Fibonacci Retracement, could obstruct upward movement due to heightened selling pressure. Further resistance is observed at 102.98, supported by the 23.60% Fibonacci Retracement, potentially amplifying selling pressure in that particular zone.
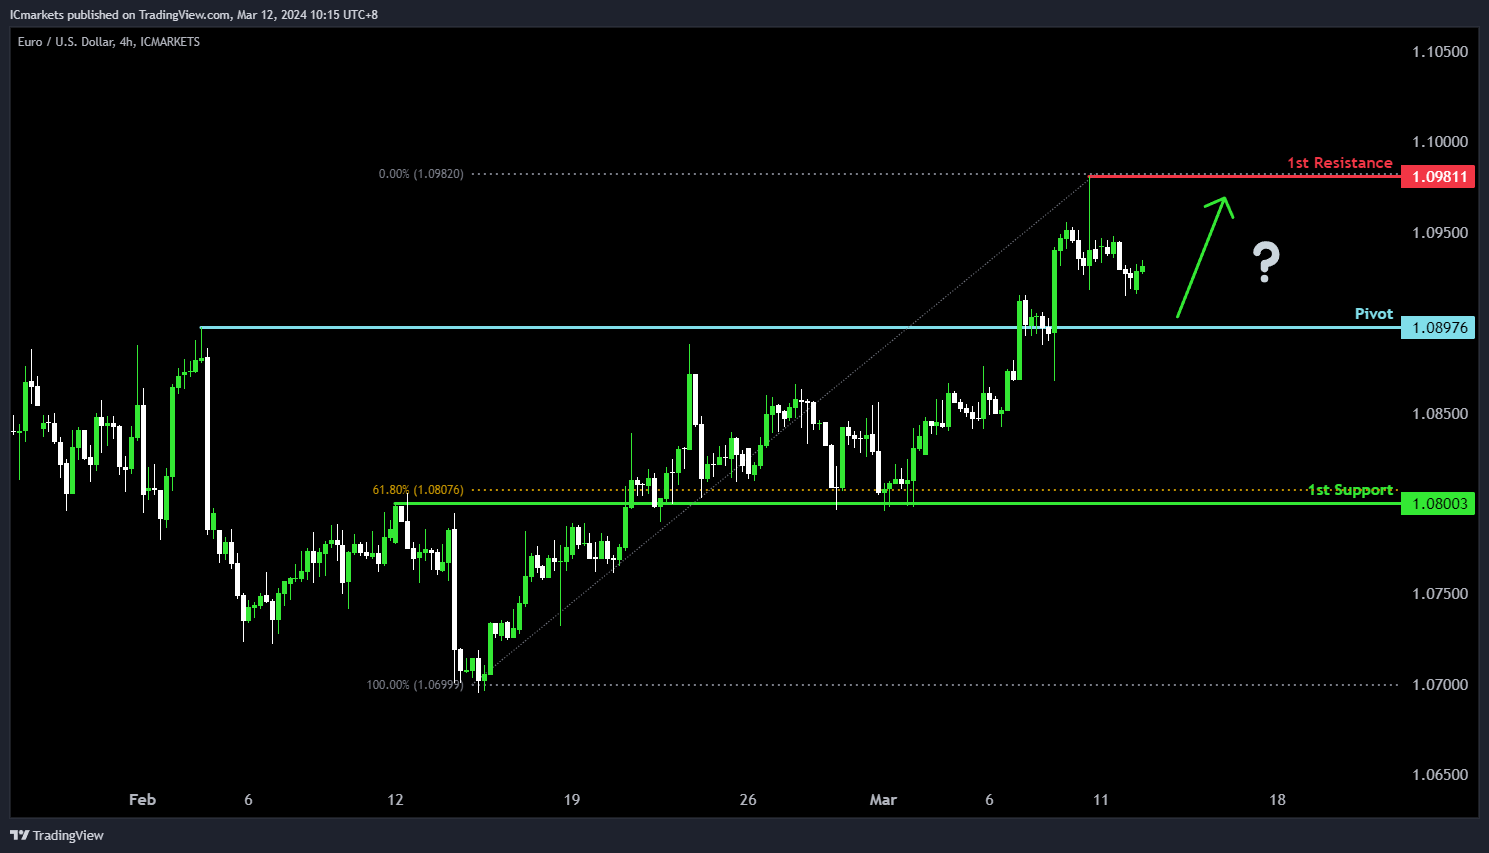
EUR/USD:
The EUR/USD chart suggests a bullish outlook, with potential for a bullish rebound at the pivot level, leading towards the 1st resistance. The pivot at 1.0897 serves as significant pullback support, indicating a possible area where buyers might intervene for a bullish bounce. Additionally, the 1st support at 1.0800, accompanied by the 61.80% Fibonacci Retracement, further reinforces this support level.
On the upside, the 1st resistance at 1.0981 signifies a notable swing high resistance, potentially acting as a barrier to further upward movement. This resistance level suggests a historical area where selling pressure may intensify, potentially limiting bullish momentum.
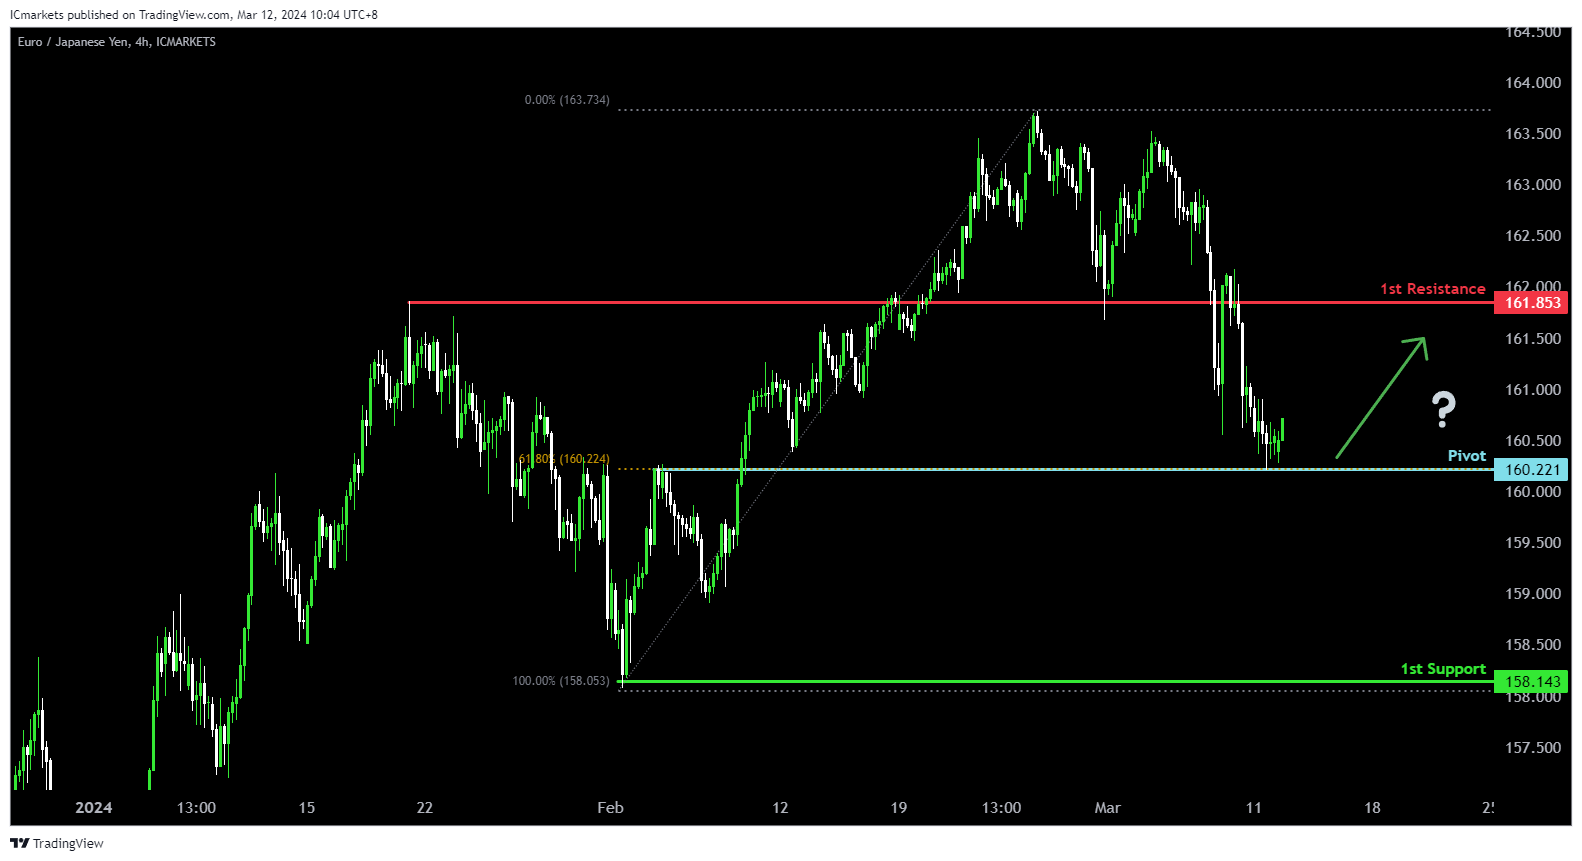
EUR/JPY:
The EUR/JPY chart currently demonstrates bullish momentum, suggesting a potential continuation of the upward trend. Several key levels support the possibility of a bullish movement towards the 1st resistance.
The pivot level at 160.221 serves as a pullback support and aligns with the 61.80% Fibonacci Retracement, indicating a significant historical level where buying interest could emerge. Additionally, the 1st support at 158.143 corresponds to a swing low support, reinforcing its significance as a potential area of demand where buyers might step in.
On the resistance side, the 1st resistance level at 161.853 is identified as a pullback resistance, suggesting a historical barrier to further upward movement.
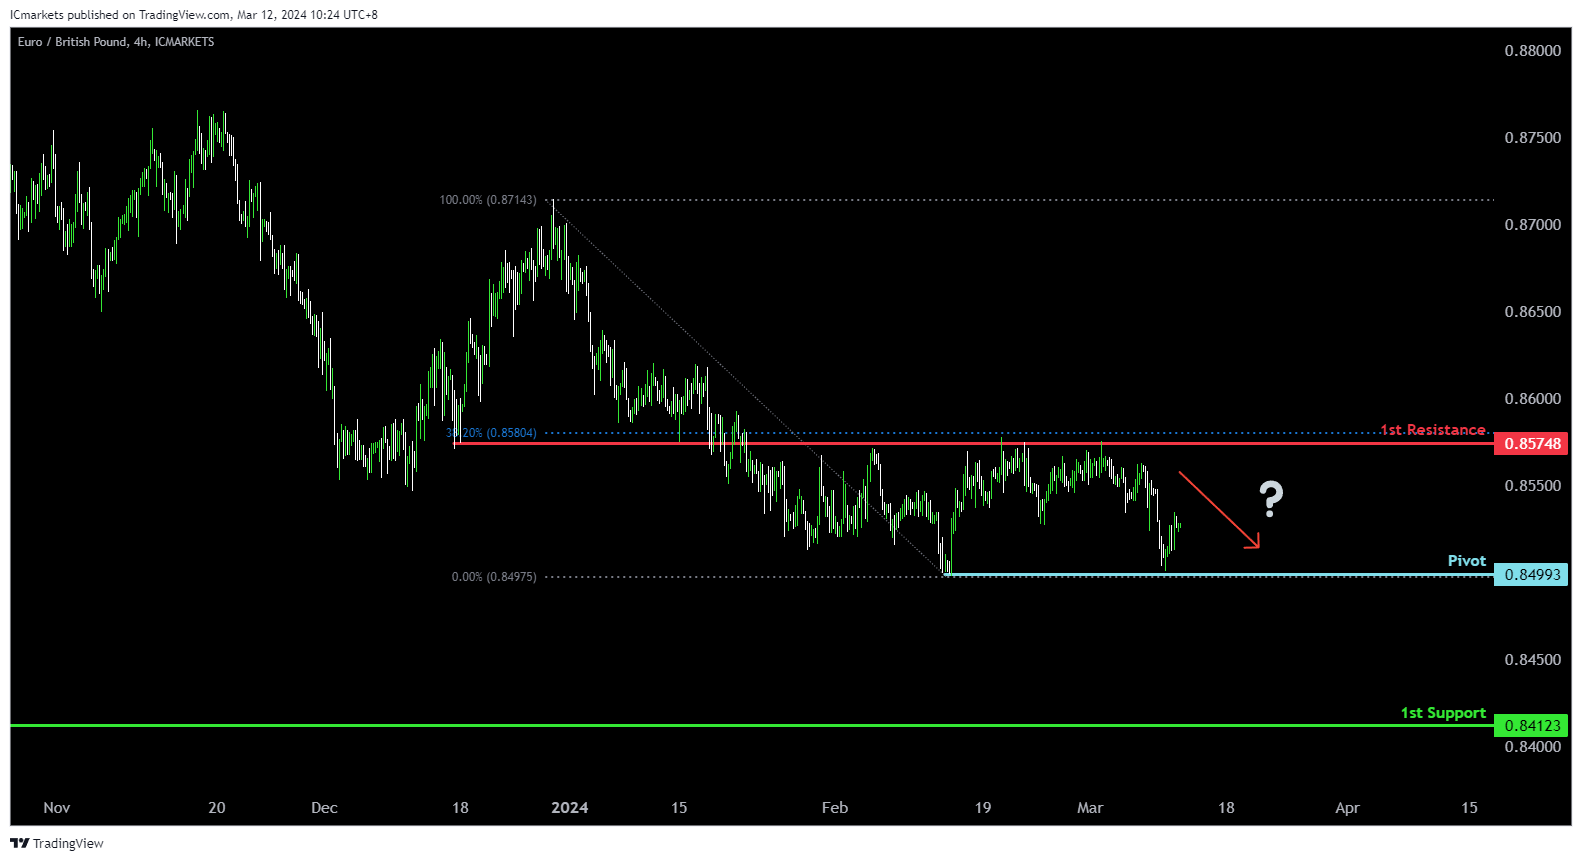
EUR/GBP:
The EUR/GBP chart currently indicates a potential shift in direction from bearish to bullish momentum, suggesting a possible bullish continuation towards the 1st resistance level. Despite the overall bearish momentum, several factors contribute to the possibility of a bullish movement.
The pivot level at 0.85038 acts as a swing low support, indicating a significant historical level where buying interest has been observed in the past. Furthermore, the 1st support at 0.84034 also aligns with a swing low support, reinforcing its importance as a level where buyers may step in to drive prices higher.
On the resistance side, the 1st resistance level at 0.85684 corresponds to the 38.20% Fibonacci Retracement level, suggesting a potential barrier to upward movement. This level may attract selling interest, but if breached, it could signal further bullish momentum.
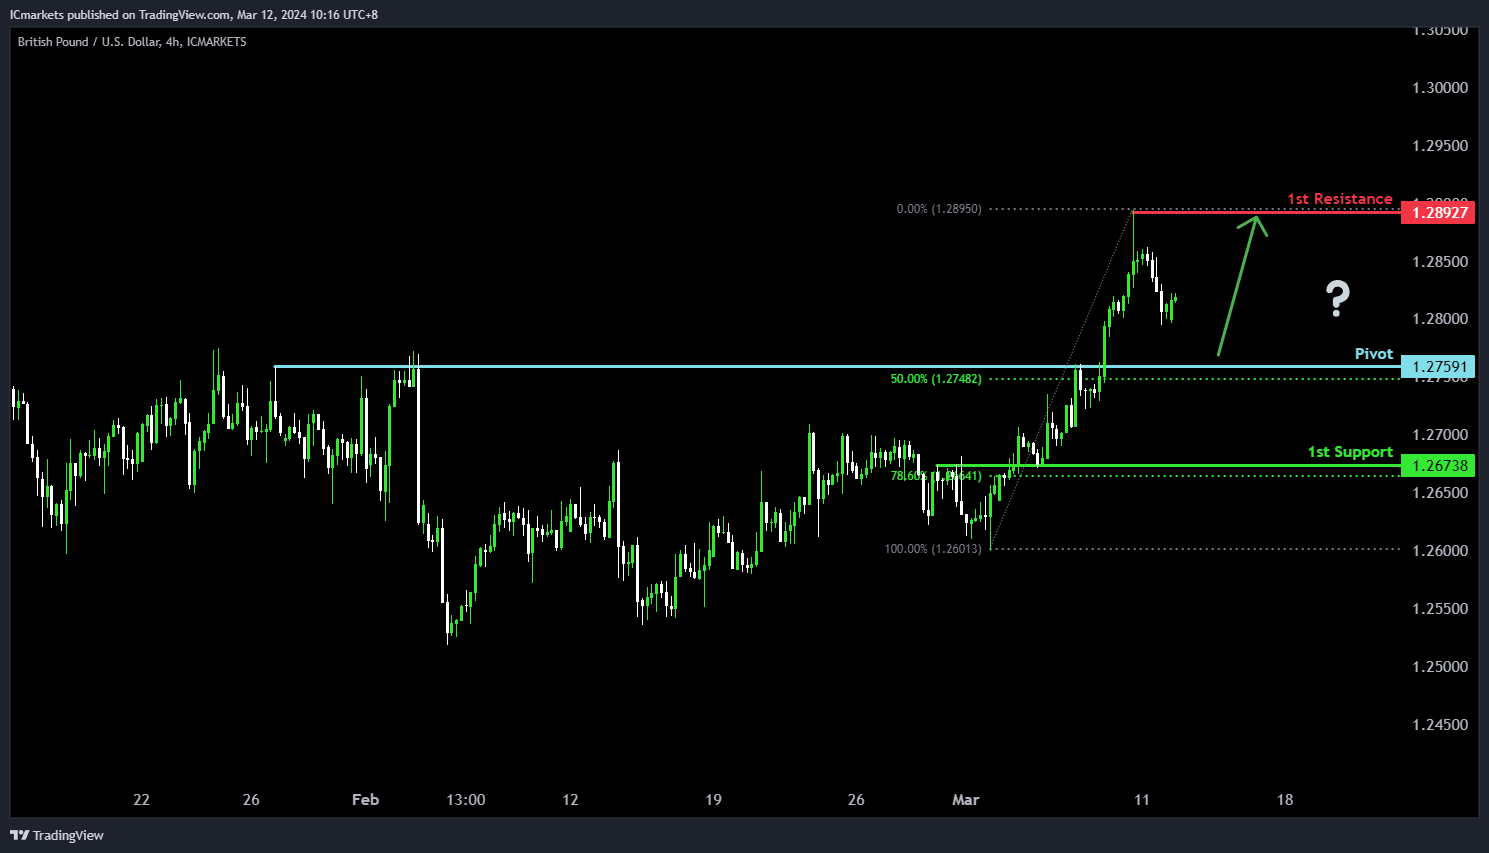
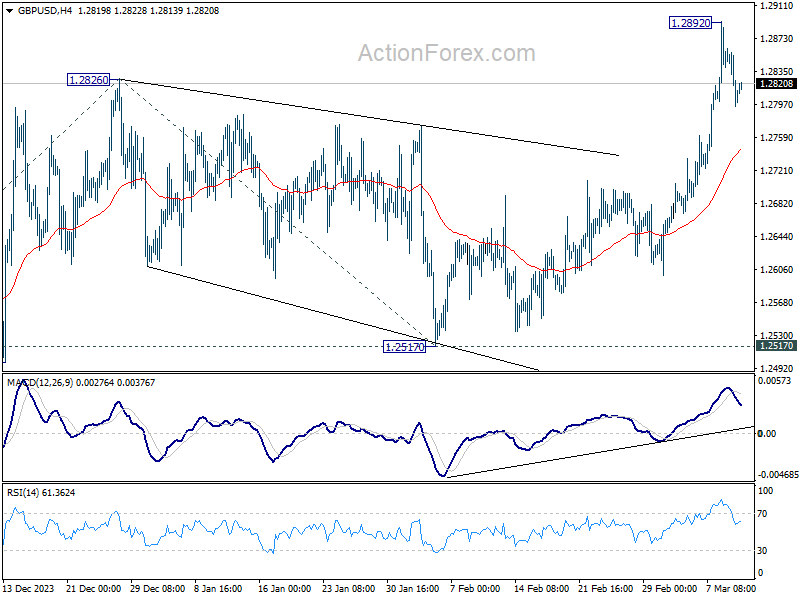
GBP/USD:
The GBP/USD chart indicates a bullish sentiment, suggesting a potential bullish rebound at the pivot level, leading towards the 1st resistance. The pivot at 1.2759 serves as significant pullback support, notably coinciding with the 50% Fibonacci Retracement level, indicating a potential area where buyers could intervene for a bullish bounce. Additionally, the 1st support at 1.2673, supported by the 78.60% Fibonacci Retracement, reinforces this support level.
On the upside, the 1st resistance at 1.2893 signifies a notable swing high resistance, potentially acting as a barrier to further upward movement. This resistance level suggests a historical area where selling pressure may intensify, potentially limiting bullish momentum.
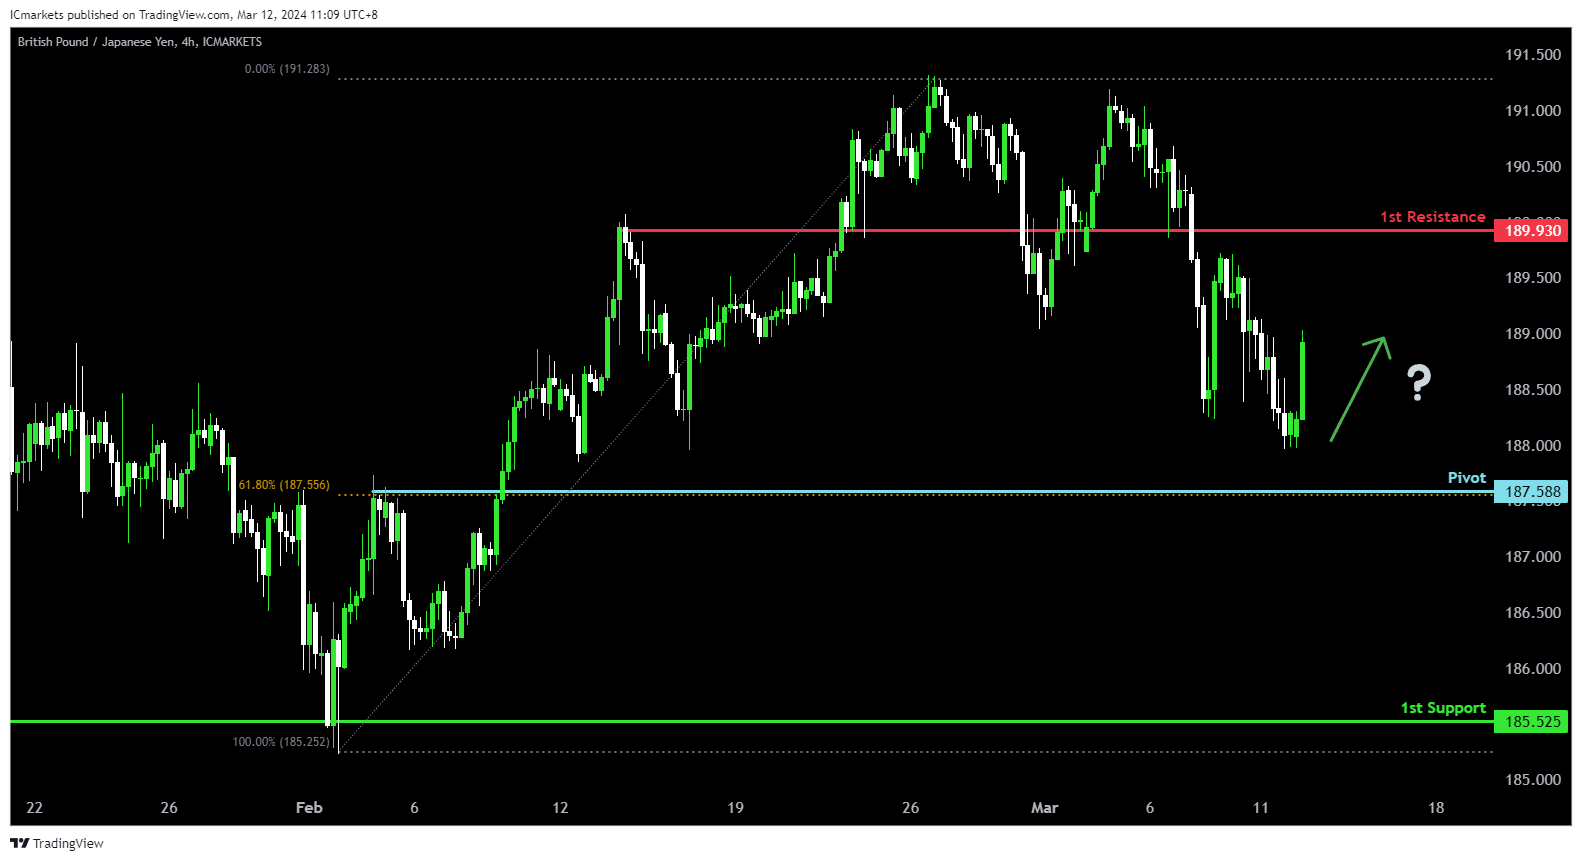
GBP/JPY:
The GBP/JPY chart indicates a bullish momentum, indicating a potential continuation of the upward trend. Several factors contribute to this bullish sentiment and support the possibility of further upward movement towards the 1st resistance level.
The pivot level at 187.588 serves as a significant point of pullback support, coinciding with the 61.80% Fibonacci Retracement level. This suggests that historical buying interest has been observed at this level, potentially indicating strong support for further bullish momentum.
Additionally, the 1st support at 185.525 aligns with a swing low support, further reinforcing its significance as a potential area where buyers may enter the market.
On the resistance side, the 1st resistance level at 189.930 is identified as a point of pullback resistance. This suggests that historical selling pressure has been encountered at this level, potentially acting as a barrier to further upward movement.
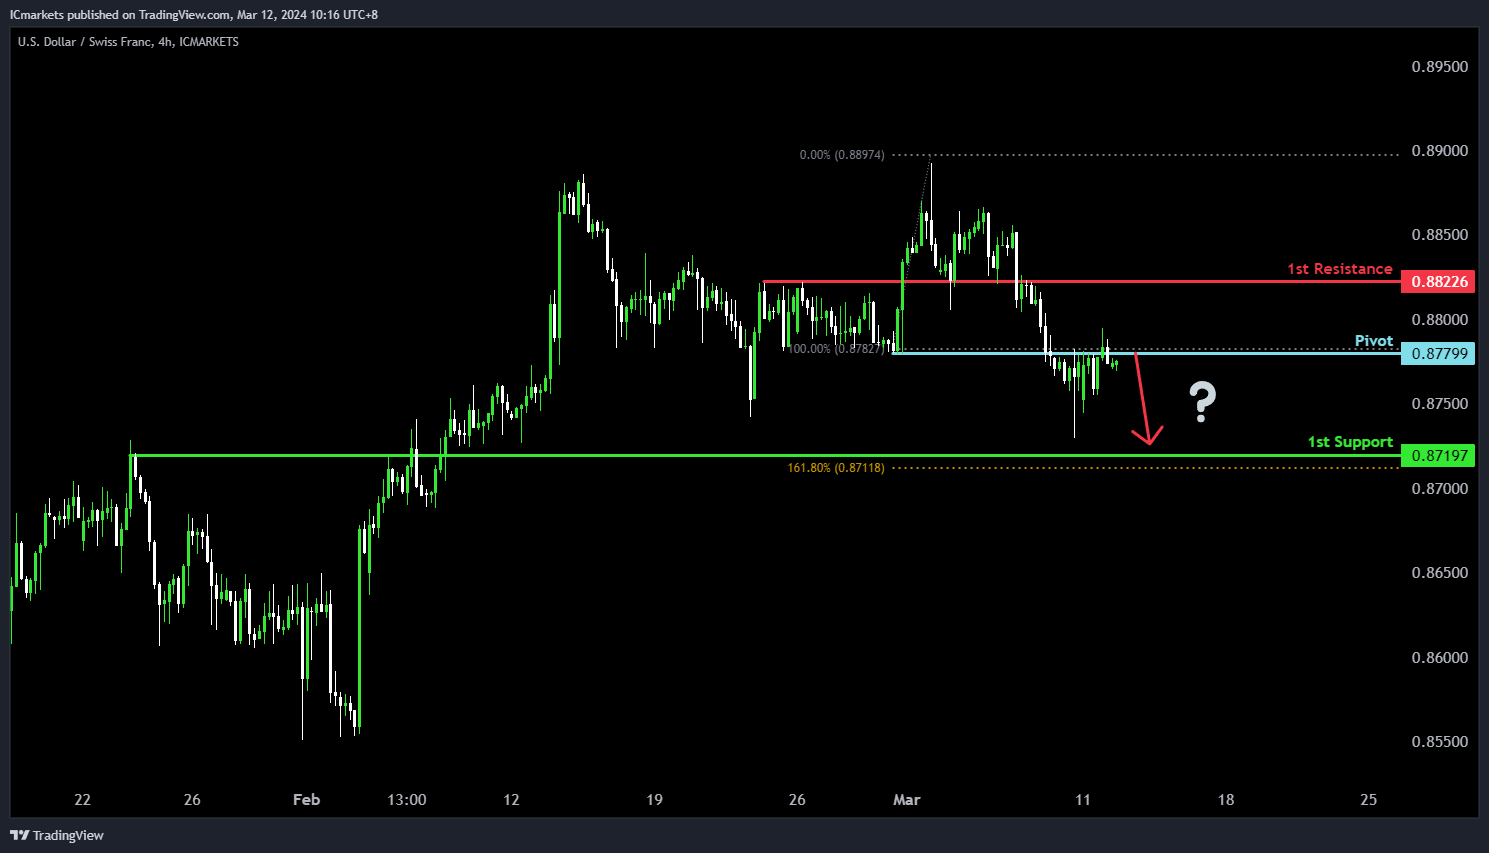
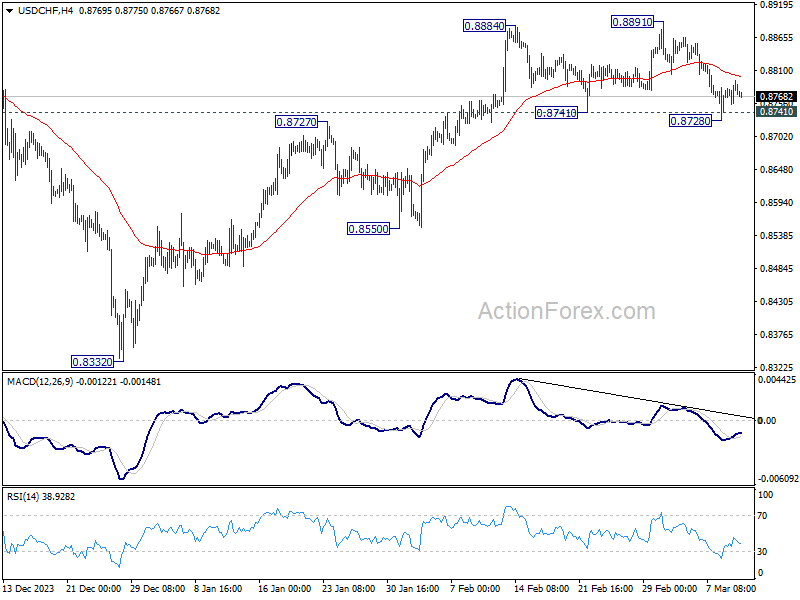
USD/CHF:
The USD/CHF chart suggests a bearish outlook, indicating a potential bearish reaction at the pivot level with a move towards the 1st support. The pivot at 0.8779 presents significant overlap resistance, potentially triggering selling pressure and prompting a bearish reaction.
Conversely, the 1st support at 0.8719 serves as an important level of overlap support, potentially attracting buying interest and acting as a barrier against further downward movement.
On the upside, the 1st resistance at 0.8822 represents another significant level of overlap resistance, potentially limiting bullish momentum and reinforcing the bearish sentiment.
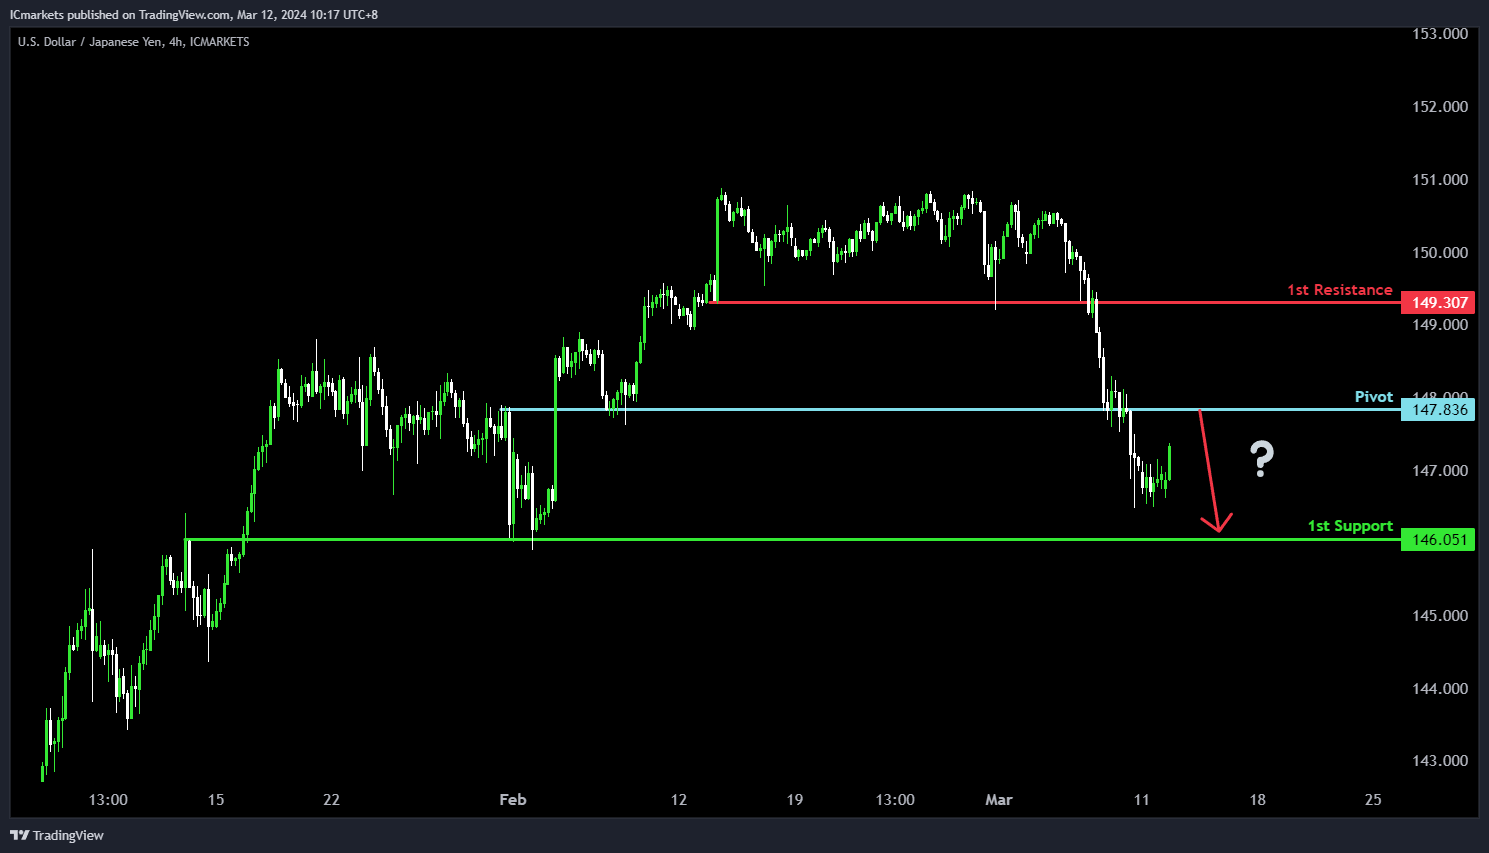
USD/JPY:
The USD/JPY chart indicates a bearish sentiment, with a potential bearish reaction at the pivot level and a move towards the 1st support. The pivot at 147.83 serves as significant pullback resistance, potentially triggering selling pressure and leading to a bearish response.
Conversely, the 1st support at 146.05 represents an important level of overlap support, potentially attracting buying interest and acting as a barrier against further downward movement.
On the upside, the 1st resistance at 149.30 presents another significant level of pullback resistance, potentially limiting bullish momentum and reinforcing the bearish outlook.
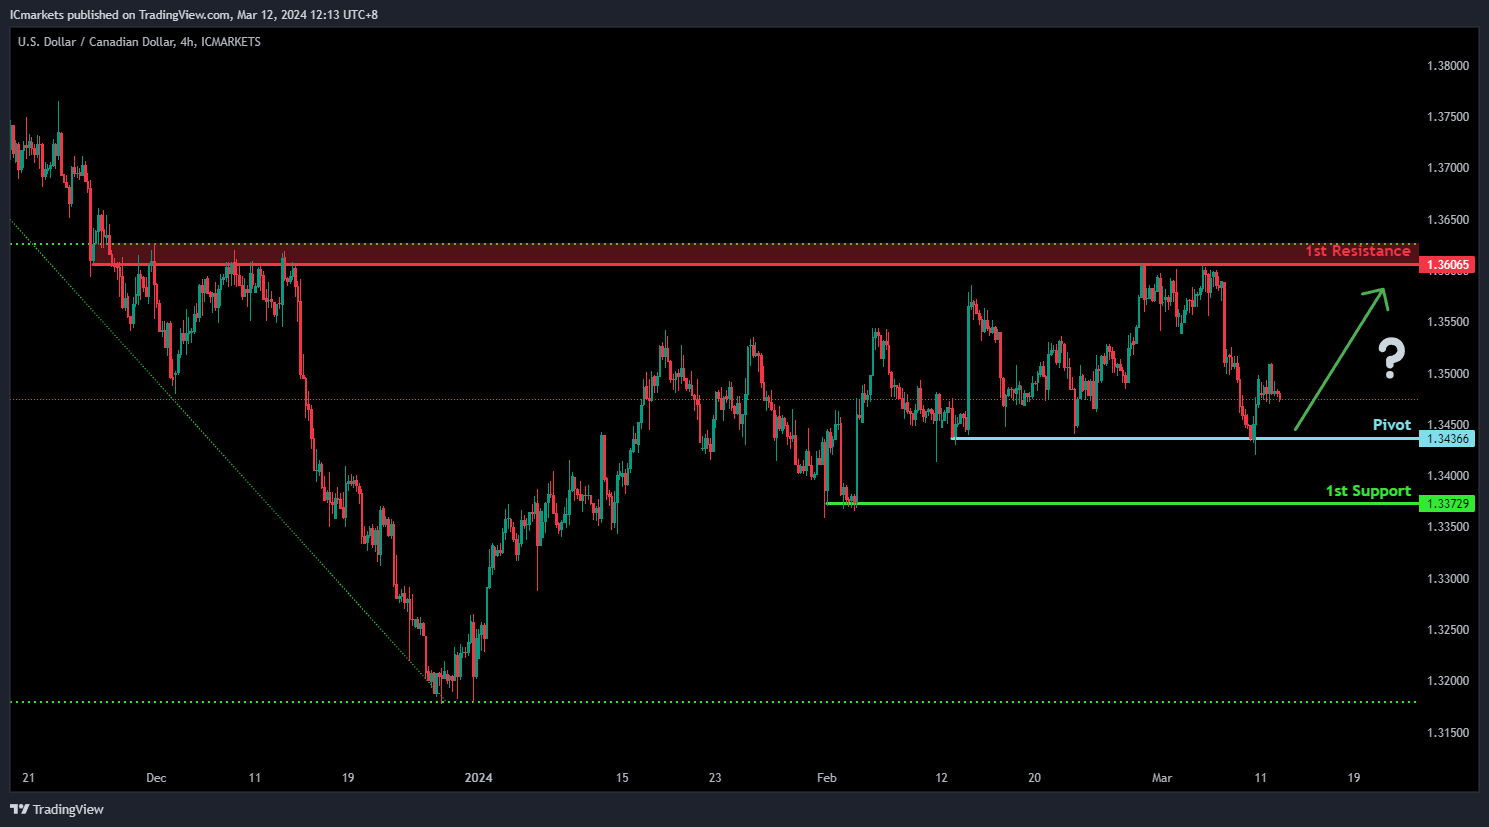
USD/CAD:
The USD/CAD chart currently exhibits a neutral bias. In this context, there is a potential scenario for price to fluctuate between the pivot and the 1st resistance.
The pivot level at 1.3436 is identified as a pullback support where price could potentially bounce off to climb higher. Higher up, the 1st resistance level at 1.3606 is identified as an overlap resistance that aligns close to the 61.80% Fibonacci Retracement level, further highlighting its importance as a potential resistance zone.
To the downside, the 1st support level at 1.3372 is marked as a pullback support, reinforcing its significance as a key support level.
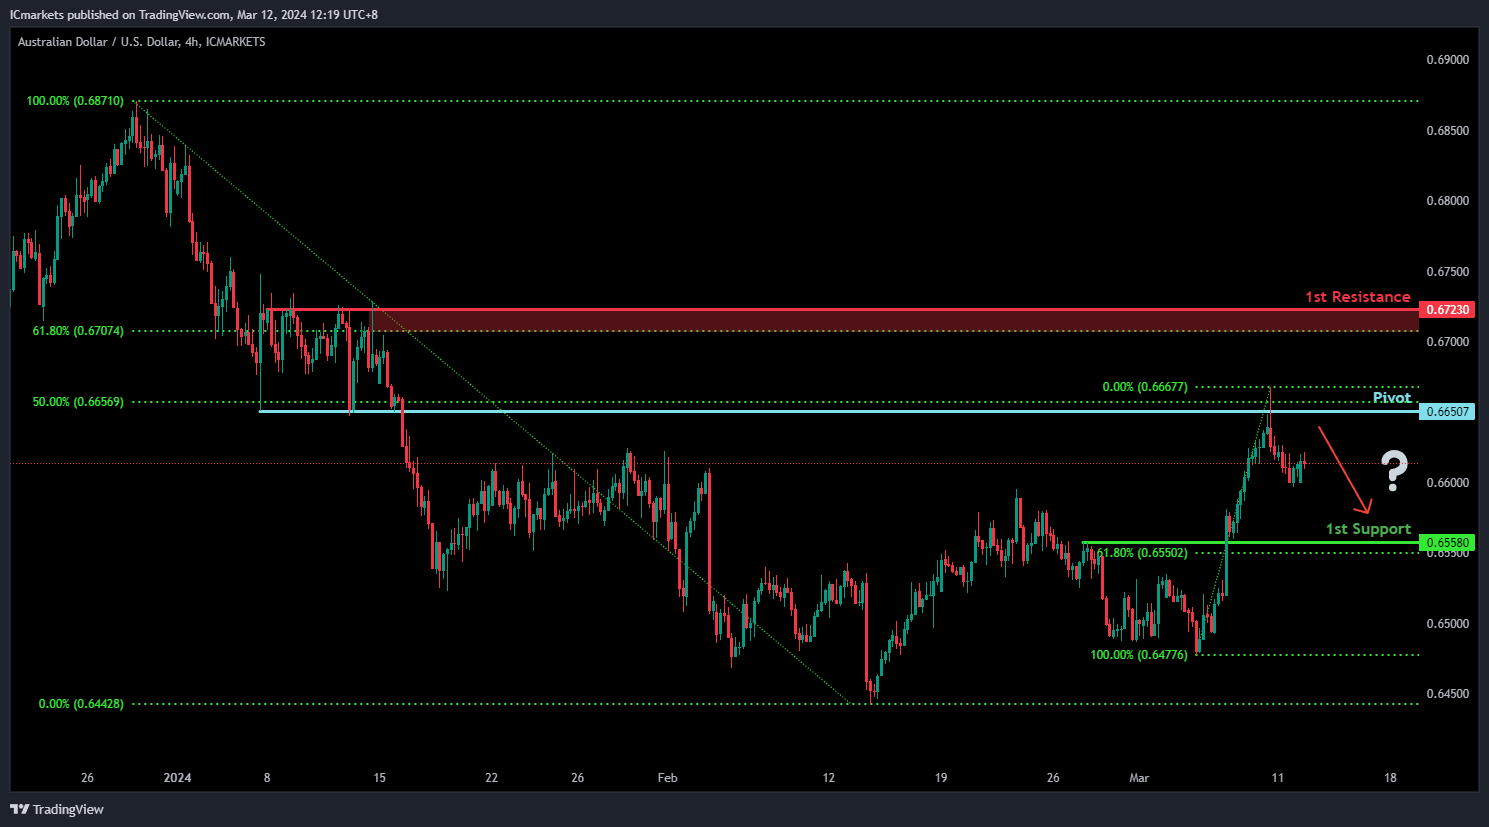
AUD/USD:
The AUD/USD chart currently exhibits an overall bullish momentum. In this context, there is a potential scenario for price to rise towards the pivot point and potentially reverse around this level to drop towards the 1st support.
The pivot level at 0.6650 is identified as an overlap resistance that aligns with the 50.00% Fibonacci Retracement level where price could potentially reverse from to drop lower. The 1st support level at 0.6558 is marked as an overlap support that aligns close to the 61.80% Fibonacci Retracement level, reinforcing its significance as a key support level.
On the resistance side, the 1st resistance level at 0.6723 is identified as a pullback resistance that aligns close to the 61.80% Fibonacci Retracement level, potentially limiting any further upward movement.
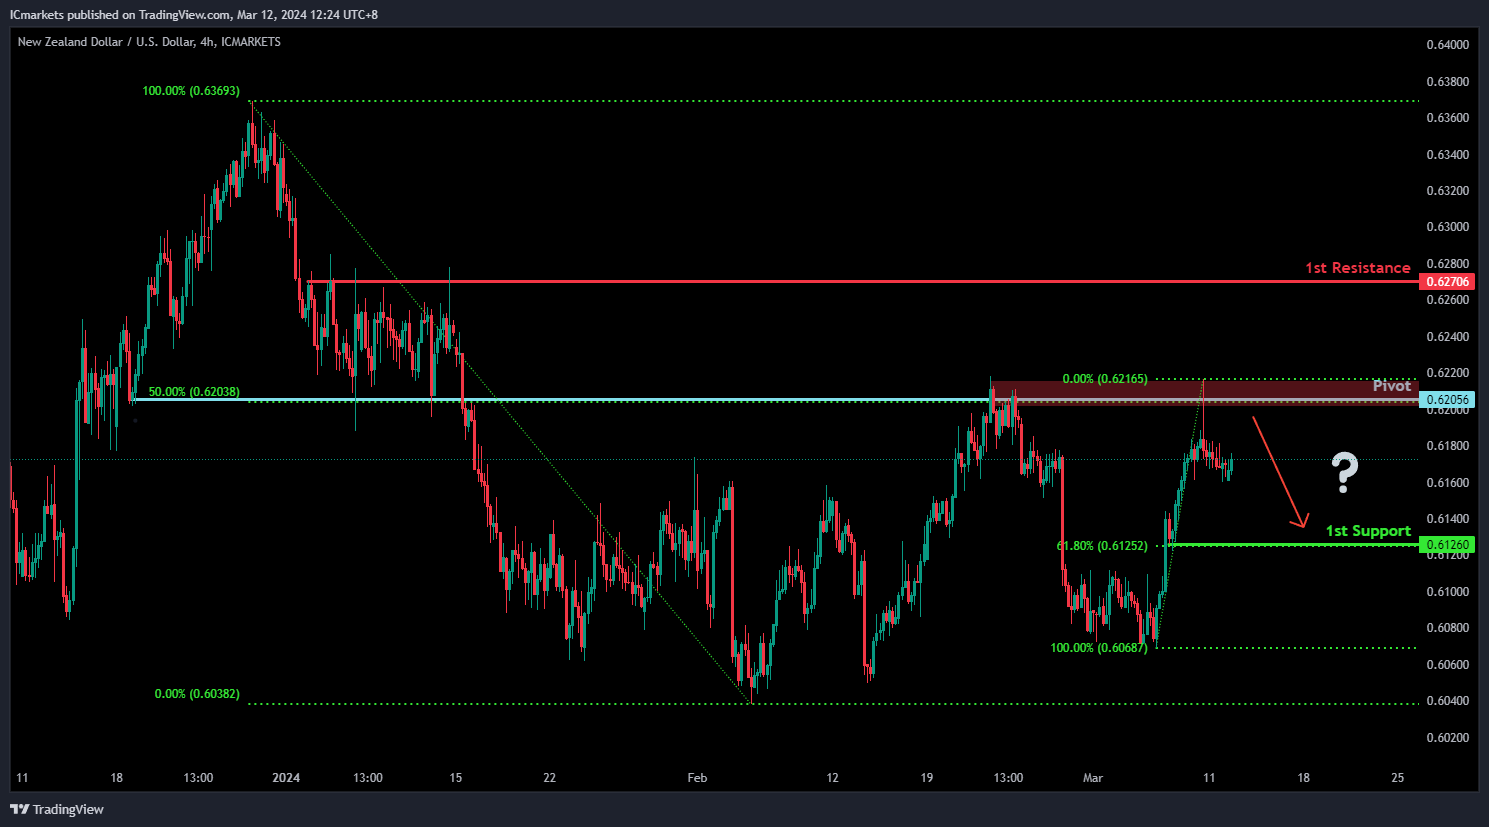
NZD/USD
The NZD/USD chart currently exhibits an overall bullish momentum. In this context, there is a potential scenario for price to rise towards the pivot point and potentially reverse around this level to drop towards the 1st support.
The pivot level at 0.6205 is identified as an overlap resistance that aligns with the 50.00% Fibonacci Retracement level where price could potentially reverse from to drop lower. The 1st support level at 0.6126 is marked as a pullback support that aligns with the 61.80% Fibonacci Retracement level, reinforcing its significance as a key support level.
On the resistance side, the 1st resistance level at 0.6270 is identified as a pullback resistance, potentially limiting any further upward movement.
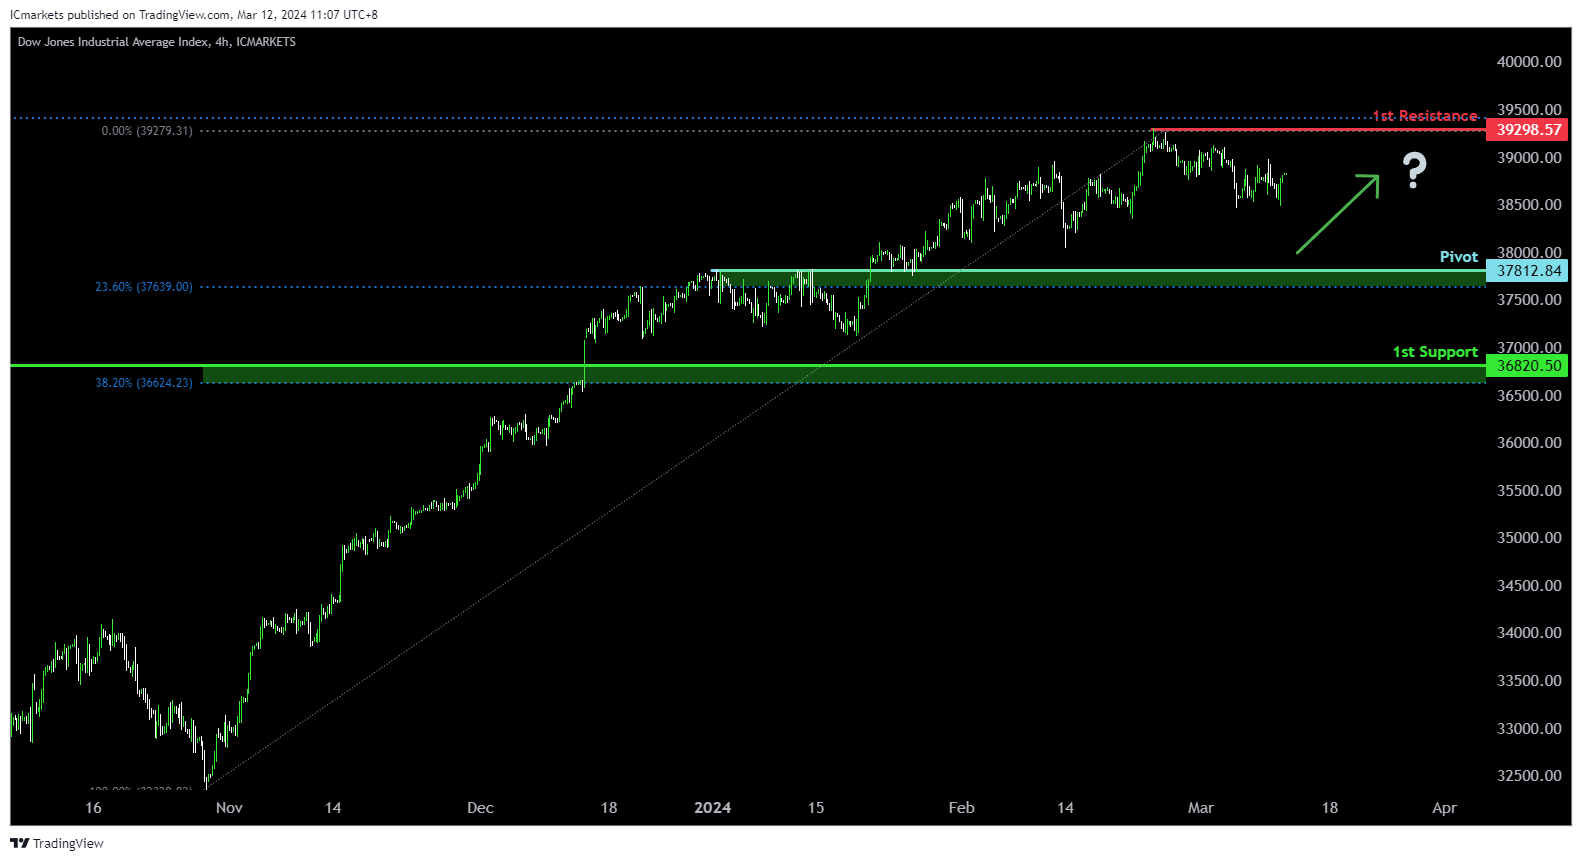
DJ30:
The DJ30 chart currently demonstrates bullish momentum, suggesting a potential continuation of the upward trend. Several factors contribute to this bullish sentiment and support the possibility of further upward movement towards the 1st resistance level.
The pivot level at 37812.84 serves as a significant point of pullback support, coinciding with the 23.60% Fibonacci Retracement level. This suggests that historical buying interest has been observed at this level, potentially indicating strong support for further bullish momentum.
Additionally, the 1st support at 36820.50 further reinforces the potential for bullish movement. This level also aligns with pullback support, indicating a historical level where buyers may enter the market.
On the resistance side, the 1st resistance level at 39298.57 is identified as a swing high resistance. This suggests that historical selling pressure has been encountered at this level, potentially acting as a barrier to further upward movement.
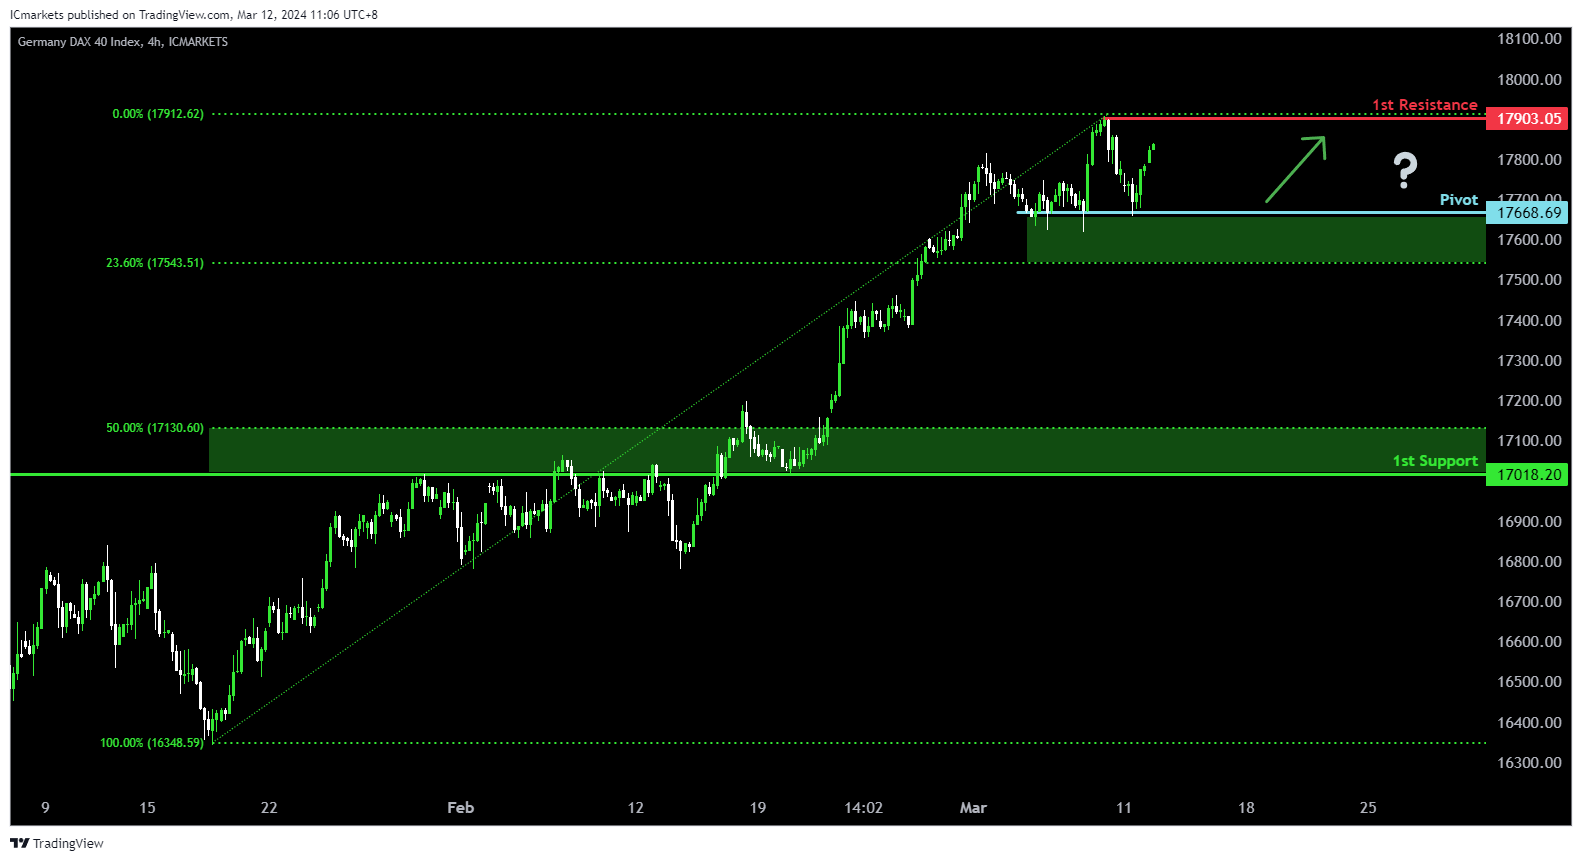
GER40:
The GER40 chart currently exhibits bullish momentum, indicating a potential continuation of the upward trend. Several factors contribute to this bullish sentiment and support the possibility of further upward movement towards the 1st resistance level.
The pivot level at 17668.69 is significant as it serves as swing low support and coincides with the 23.60% Fibonacci Retracement level. This suggests that historical buying interest has been observed at this level, potentially indicating strong support for further bullish momentum.
Additionally, the 1st support at 17018.20 further reinforces the potential for bullish movement. This level aligns with an overlap support and the 50% Fibonacci Retracement level, indicating a historical level where buyers may enter the market.
On the resistance side, the 1st resistance level at 17903.05 is identified as a swing high resistance. This suggests that historical selling pressure has been encountered at this level, potentially acting as a barrier to further upward movement.
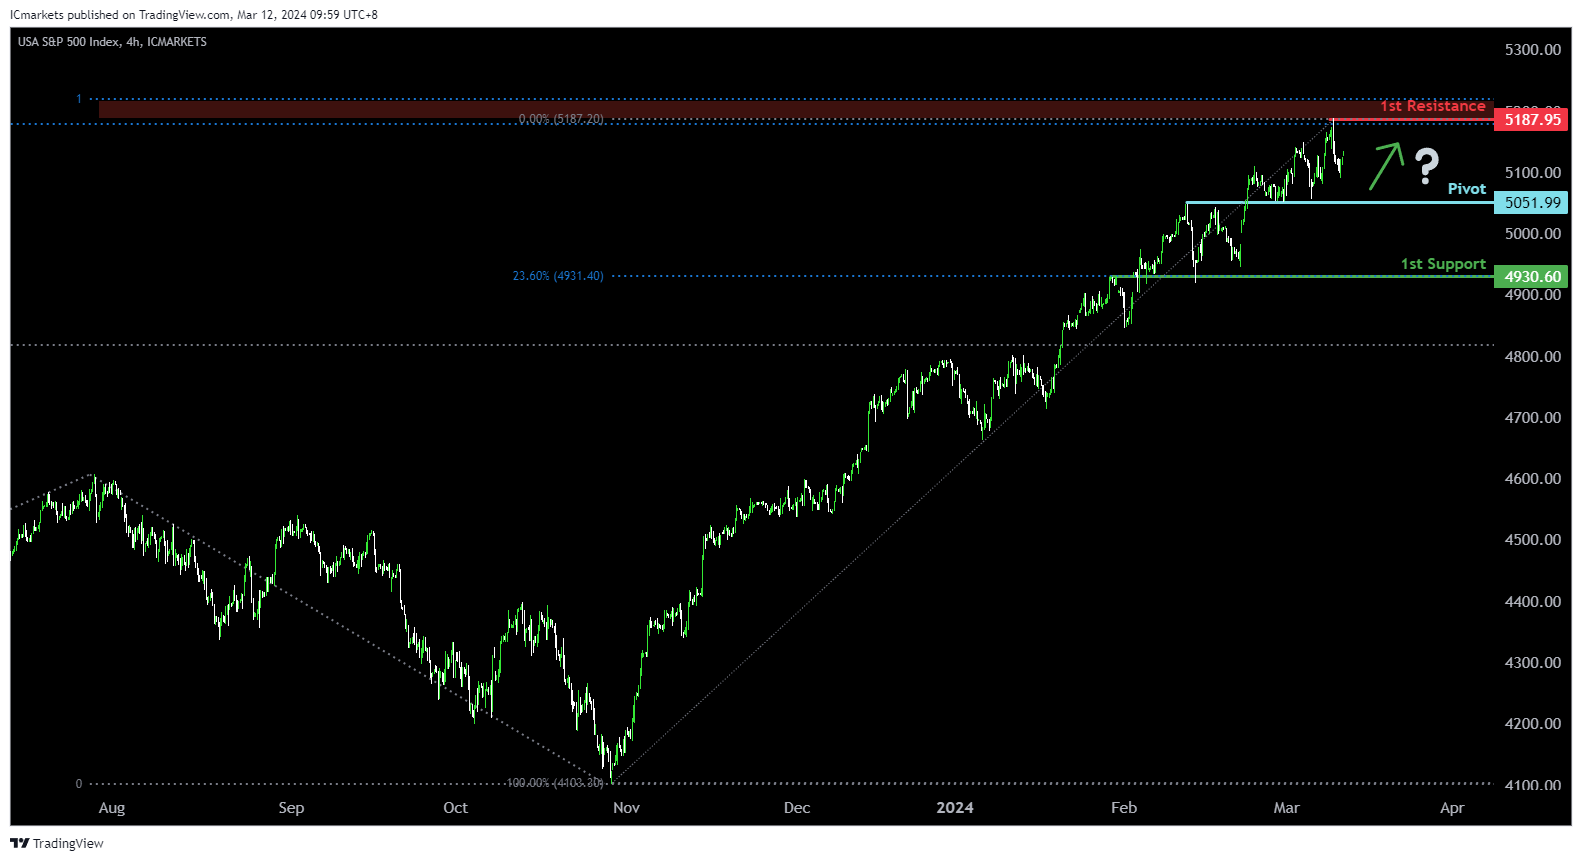
US500:
The US500 chart currently demonstrates bullish momentum, indicating a potential continuation of the upward trend. Several factors contribute to this bullish sentiment and support the possibility of further upward movement towards the 1st resistance level.
The pivot level at 5051.99 serves as an overlap support, suggesting a significant historical level where buying interest has been observed. Additionally, the 1st support at 4930.60 aligns with another overlap support and coincides with the 23.60% Fibonacci Retracement level, further reinforcing its significance as a potential area of support.
On the resistance side, the 1st resistance level at 5187.95 is identified as a swing high resistance. This level also aligns with the 127.20% Fibonacci Extension and the 100% Fibonacci Projection, indicating a historical barrier to upward movement.
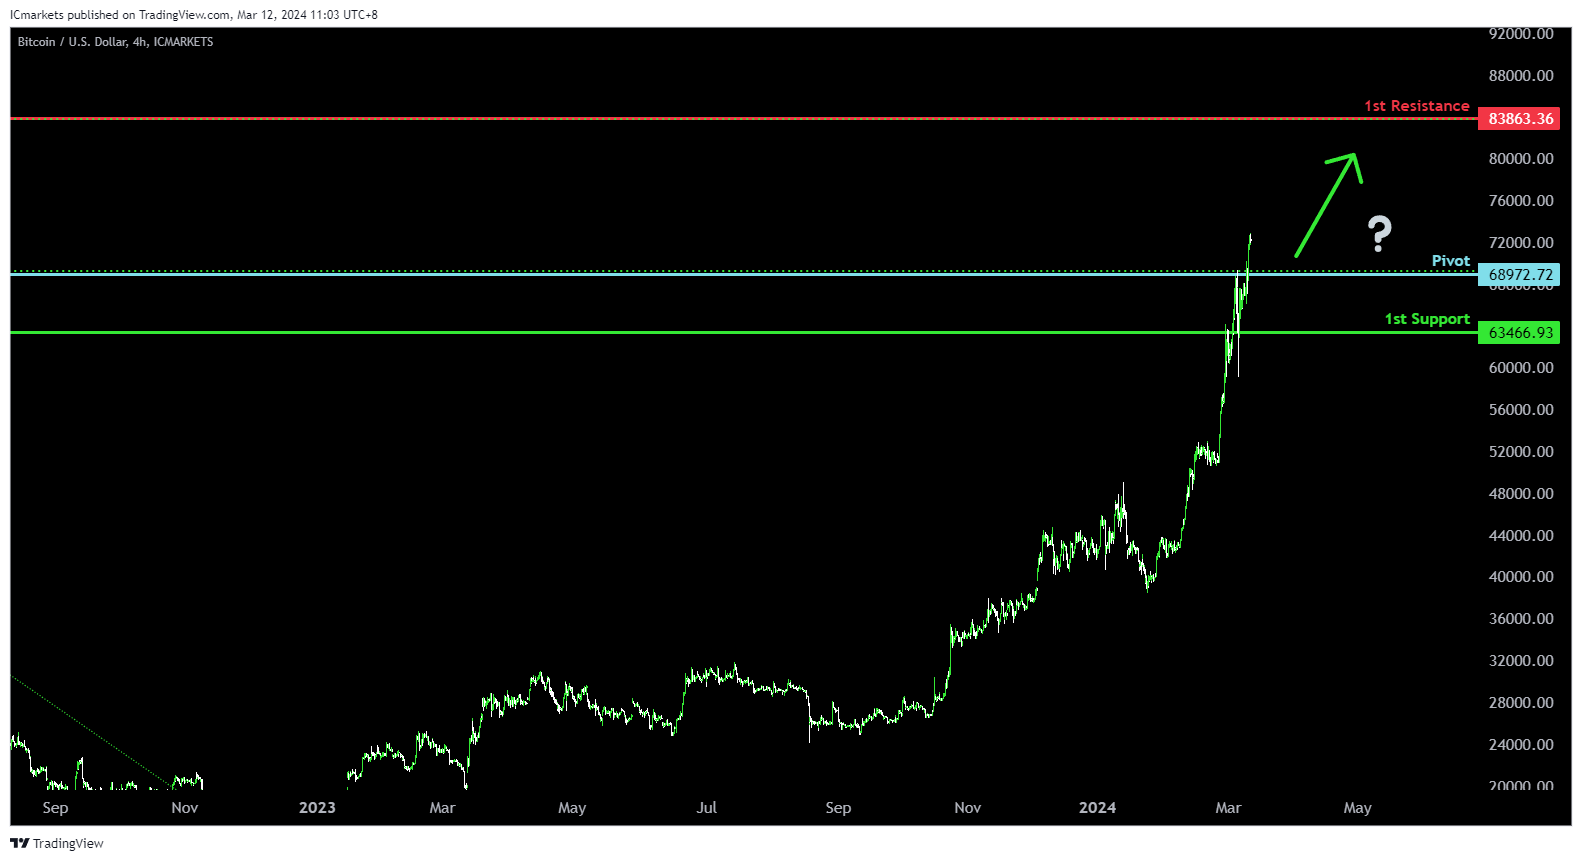
BTC/USD:
The BTC/USD chart currently exhibits bullish momentum, indicating a potential continuation of the upward trend. Several factors contribute to this bullish sentiment, supporting the possibility of further upward movement towards the 1st resistance level.
The pivot level at 68972.72 serves as a pullback support, suggesting a significant historical level where buying interest has been observed. Additionally, the 1st support at 63466.93000 aligns with another pullback support, further reinforcing its significance as a potential area of support.
On the resistance side, the 1st resistance level at 83863.36 is identified as a key barrier to further upward movement. This level also coincides with the 127.20% Fibonacci Extension, indicating a strong resistance zone.
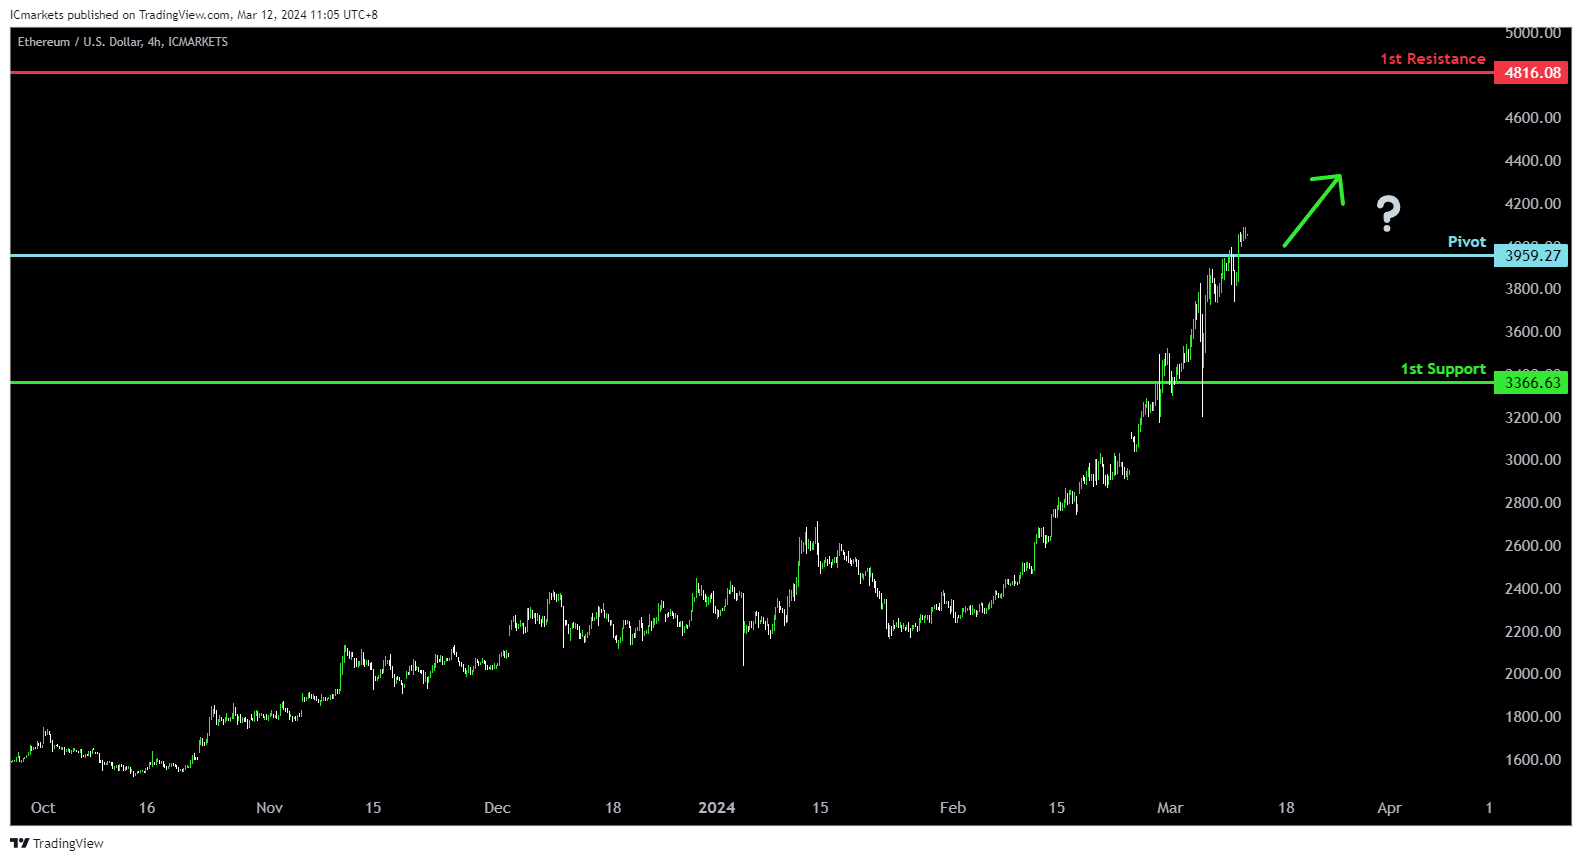
ETH/USD:
The ETH/USD chart currently demonstrates bullish momentum, indicating a potential continuation of the upward trend. Several factors contribute to this bullish sentiment, supporting the possibility of further upward movement towards the 1st resistance level.
The pivot level at 3959.27 serves as an overlap support, suggesting a significant historical level where buying interest has previously emerged. Additionally, the 1st support at 3554.76 aligns with a pullback support, further reinforcing its significance as a potential area of support.
On the resistance side, the 1st resistance level at 4816.08 is identified as a swing high resistance, suggesting a historical barrier to further upward movement.
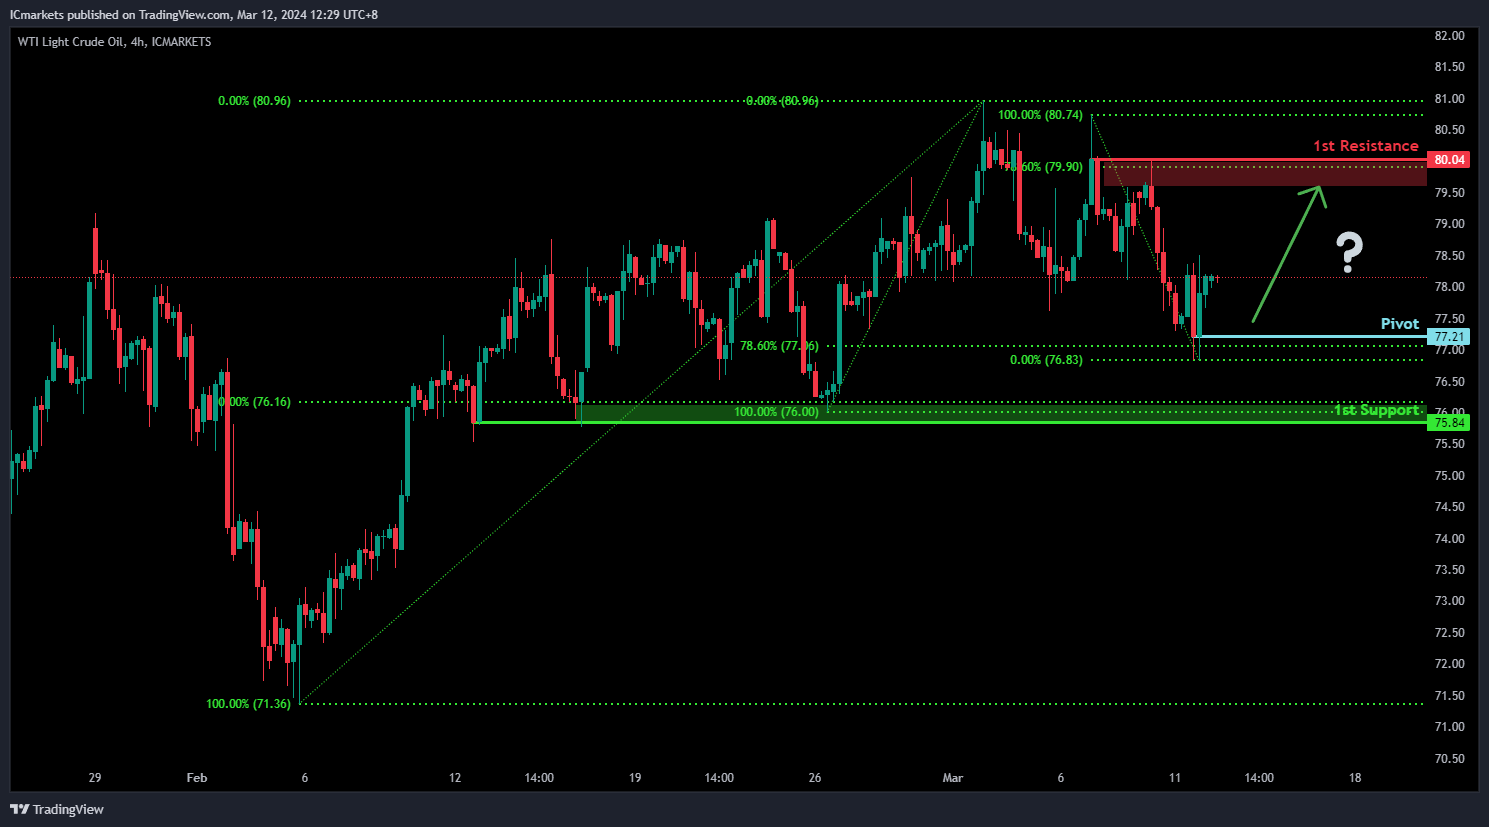
WTI/USD:
The WTI (West Texas Intermediate) chart currently demonstrates an overall bearish momentum. However, there is a potential scenario for price to bounce off the pivot level and rise towards the 1st resistance.
The pivot level at 77.21 is identified as a pullback support that aligns close to the 78.60% Fibonacci Retracement level. Higher up, the 1st resistance level at 80.04 is identified as a pullback resistance that aligns with the 78.60% Fibonacci Retracement level, further reinforcing its significance as a potential barrier to further bullish movement.
To the downside, the 1st support level at 75.84 is marked as a pullback support that aligns close to the 50.00% Fibonacci Retracement level, reinforcing its significance as a key support level.
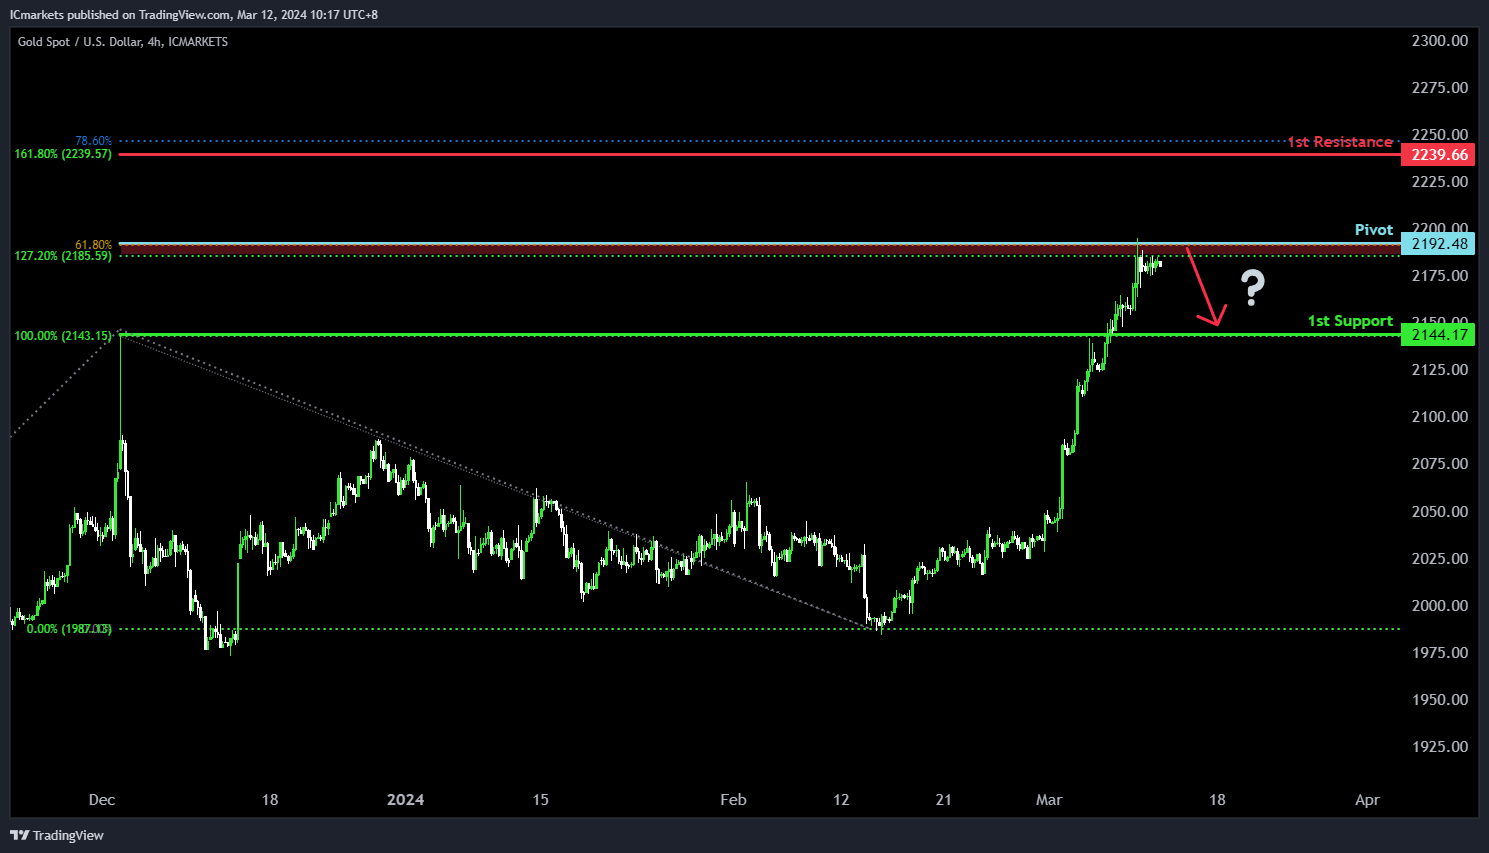
XAU/USD (GOLD):
The XAU/USD chart suggests a potential bearish move, with a likely reaction at the pivot leading to a drop towards the 1st support. The pivot at 2192.48 signifies notable pullback resistance, supported by the 61.80% Fibonacci Projection and the 127.20% Fibonacci Extension, indicating a strong resistance zone.
On the other hand, the 1st support at 2144.17 serves as significant pullback support, potentially attracting buying interest and acting as a barrier against further downward movement.
Regarding resistance, the 1st resistance at 2239.66 presents a formidable barrier, reinforced by the 78.60% Fibonacci Projection and the 161.80% Fibonacci Extension
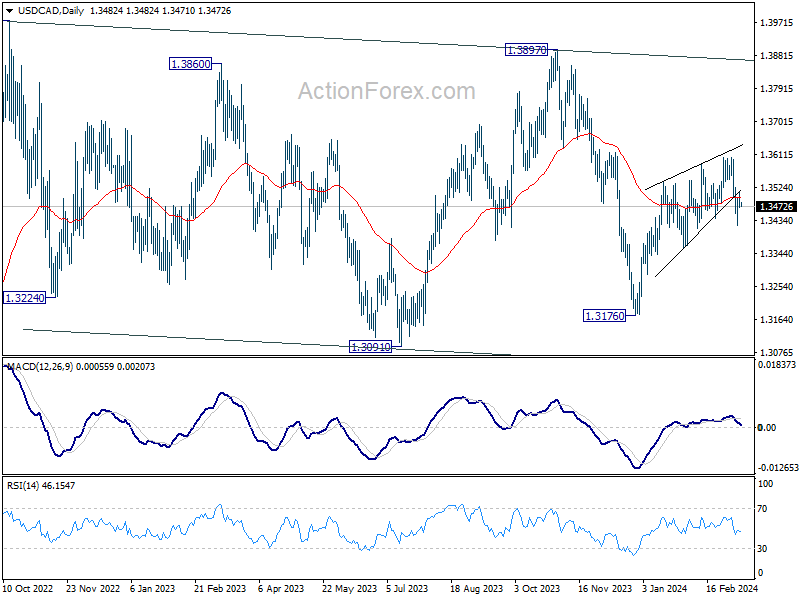
USD/CAD Daily Outlook
Daily Pivots: (S1) 1.3465; (P) 1.3488; (R1) 1.3505; More...
Intraday bias in USD/CAD stays neutral and outlook is unchanged. On the downside, break of 1.3419 and sustained trading below 1.3439 support will argue that rebound from 1.3176 has completed as a corrective move to 1.3605. Near term outlook will be turned bearish for 1.3357 support first. On the upside, though, break of 1.3524 minor resistance will revive near term bullishness, and turn bias back to the upside for retesting 1.3605 resistance instead.
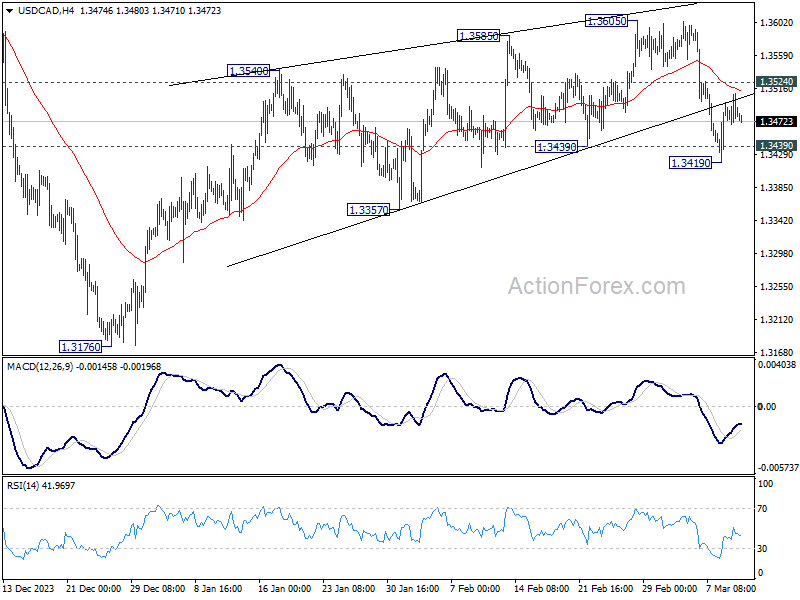
In the bigger picture, price actions from 1.3976 (2022 high) are viewed as a corrective pattern only. In case of another fall, strong support should emerge above 1.2947 resistance turned support to bring rebound. Overall, larger up trend from 1.2005 (2021 low) is still expected to resume through 1.3976 at a later stage.
AUD/USD Daily Report
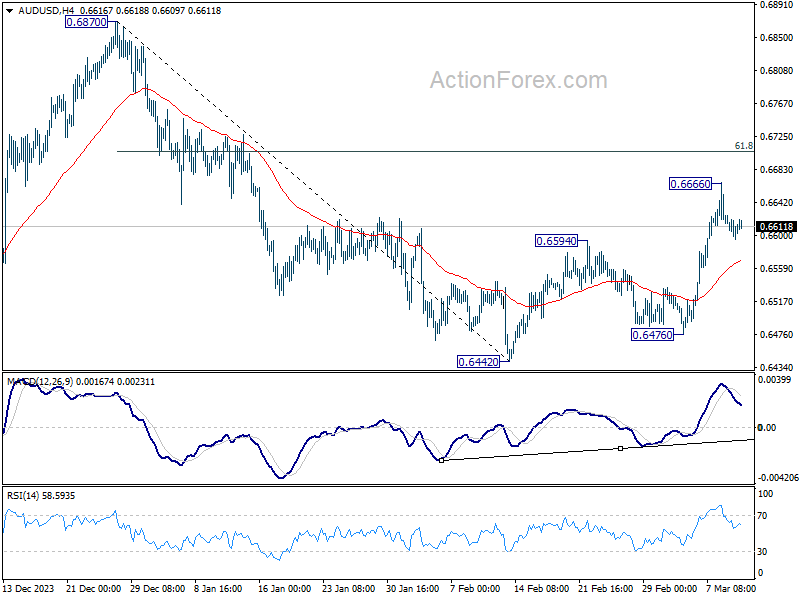
Daily Pivots: (S1) 0.6598; (P) 0.6613; (R1) 0.6629; More...
Intraday bias in AUD/USD remains neutral as consolidation continues below 0.6666 temporary top. Another rise will be mildly in favor as long as 55 4H EMA (now at 0.6569) holds. Above 0.6666 will resume the rebound from 0.6442 to 61.8% retracement of 0.6877 to 0.6442 at 0.6707 next. Sustained trading above there will argue rise from 0.6442 is probably resuming whole rally from 0.6269. Nevertheless, sustained break of 55 4H EMA will revive near term bearishness and bring retest of 0.6442 low instead.
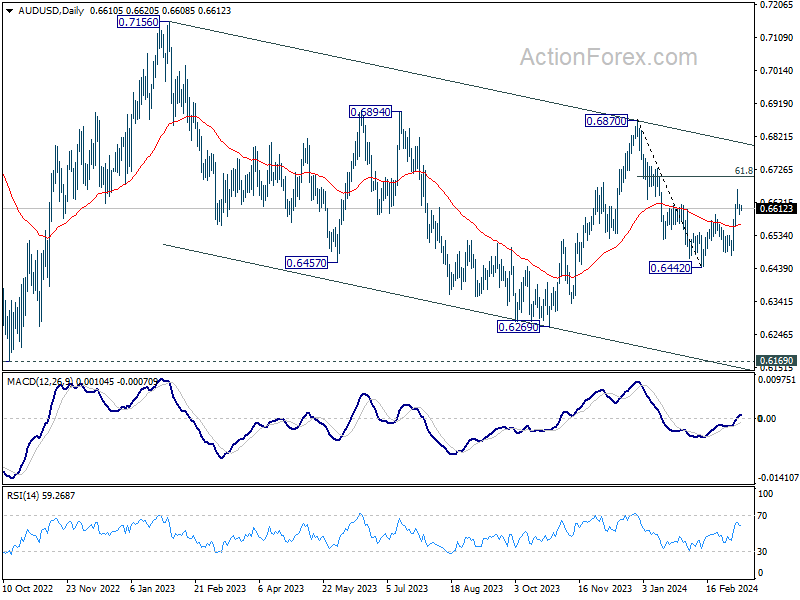
In the bigger picture, price actions from 0.6169 (2022 low) are seen as a medium term corrective pattern to the down trend from 0.8006 (2021 high). Fall from 0.7156 (2023 high) is seen as the second leg, which might still be in progress. Overall, sideway trading could continue in range of 0.6169/7156 for some more time. But as long as 0.7156 holds, an eventual downside breakout would be mildly in favor.
EUR/USD Daily Outlook
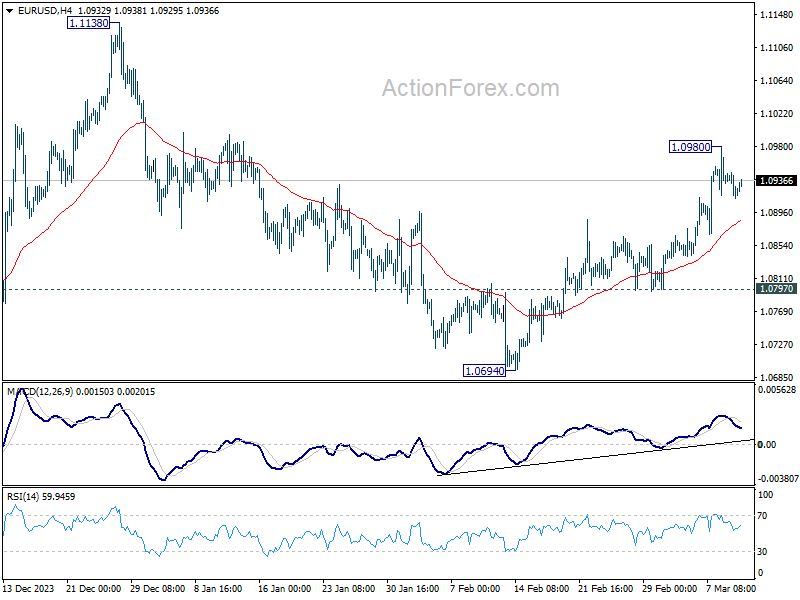
Daily Pivots: (S1) 1.0911; (P) 1.0929; (R1) 1.0944; More...
Intraday bias in EUR/USD remains neutral as consolidations continue below 1.0980 temporary top. Further rise would remain in favor as long as 1.0797 support holds. Fall from 1.1138 could have completed at 1.0694, as a correction to rise from 1.0447. Above 1.0980 will resume the rise from 1.0694 to retest 1.1138 high.
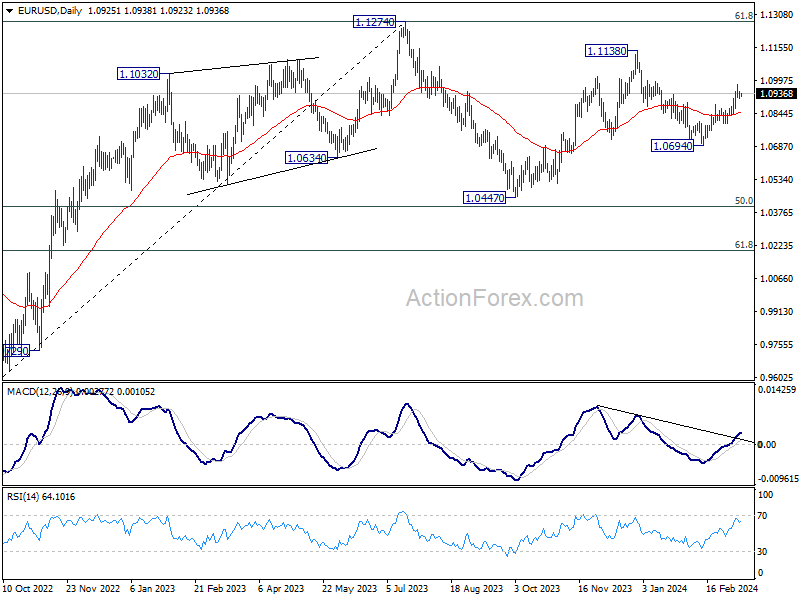
In the bigger picture, price actions from 1.1274 are viewed as a corrective pattern to rise from 0.9534 (2022 low). Rise from 1.0447 is seen as the second leg. While further rally could cannot be ruled out, upside should be limited by 1.1274 to bring the third leg of the pattern. Meanwhile, sustained break of 1.0694 support will argue that the third leg has already started for 1.0447 and possibly below.
GBP/USD Daily Outlook
Daily Pivots: (S1) 1.2784; (P) 1.2825; (R1) 1.2855; More...
Intraday bias in GBP/USD remains neutral as consolidation continues below 1.2892 temporary top. Further rally will remain in favor as long as 55 4H EMA (now at 1.2746) holds. On the upside, above 1.2892 will resume larger rise from 1.2063 and target 61.8% projection of 1.2036 to 1.2826 from 1.2517 at 1.3005.
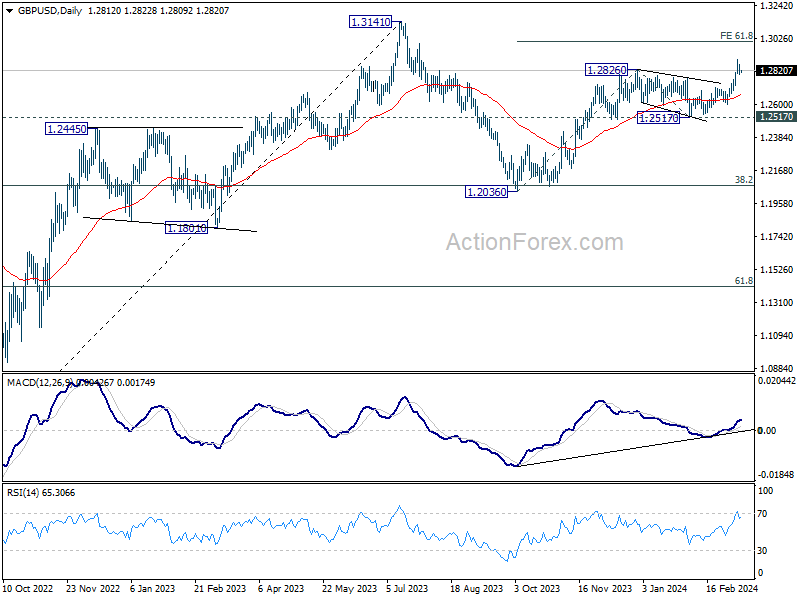
In the bigger picture, price actions from 1.3141 medium term top are seen as a corrective pattern to up trend from 1.0351 (2022 low). Rise from 1.2036 is seen as the second leg, which is still in progress. But upside should be limited by 1.3141 to bring the third leg of the pattern. Meanwhile, break of 1.2517 support will argue that the third leg has already started for 38.2% retracement of 1.0351 (2022 low) to 1.3141 at 1.2075 again.
USD/CHF Daily Outlook
Daily Pivots: (S1) 0.8754; (P) 0.8775; (R1) 0.8794; More....
No change in USD/CHF's outlook as range trading continues. Intraday bias stays neutral for the moment. On the downside, sustained break of 0.8741 will argue that the whole rebound from 0.8332 might have completed, and bring deeper fall to 0.8550 support. Nevertheless, strong bounce from current level will retain near term bullishness. Further break of 0.8891 will resume the rise from 0.8332.
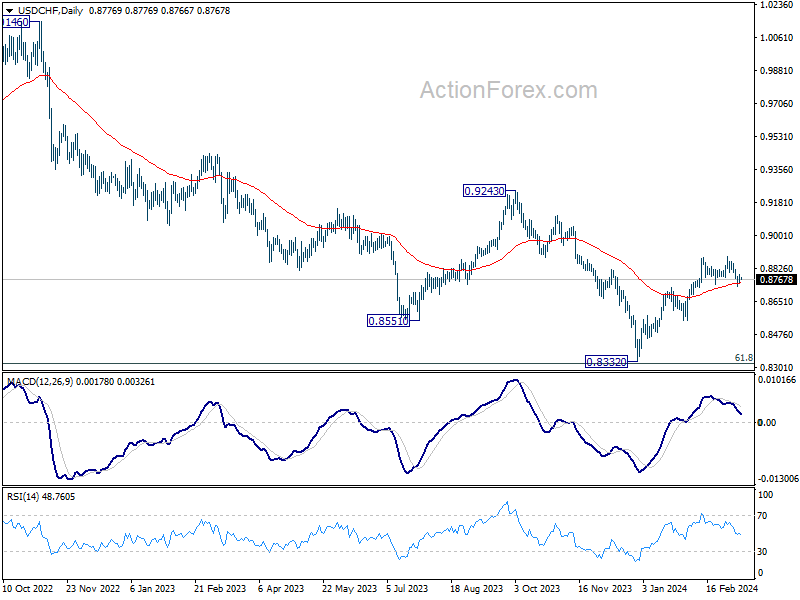
In the bigger picture, price actions from 0.8332 medium term bottom as seen as developing into a corrective pattern to the down trend from 1.0146 (2022 high). Further rise would be seen as long as 0.8555 support holds. But upside should be limited by 0.9243 resistance, at least on first attempt.
USD/JPY Daily Outlook
Daily Pivots: (S1) 146.57; (P) 146.87; (R1) 147.25; More...
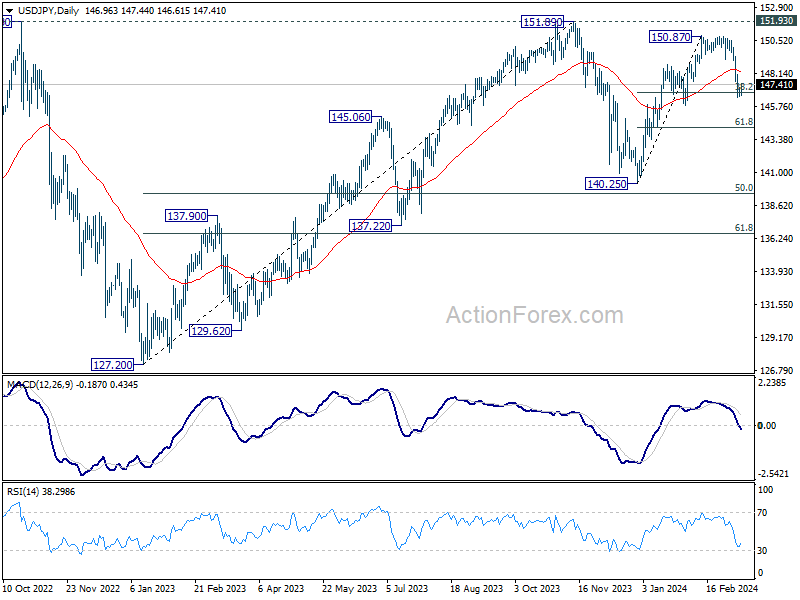
A temporary low is formed at 146.47 with today's recovery and intraday bias in USD/JPY is turned neutral first. On the downside, sustained break of 38.2% retracement of 140.25 to 150.87 at 146.81 will argue that fall from 150.87 is reversing the whole rally from 140.25. In this case, deeper decline would be seen to 61.8% retracement at 144.30 and below. Nevertheless, strong support from 146.81, followed by break of 148.29 minor resistance resistance, will argue that fall from 150.87 is merely a correction, which has completed already. Retest of 150.87 should be seen next.
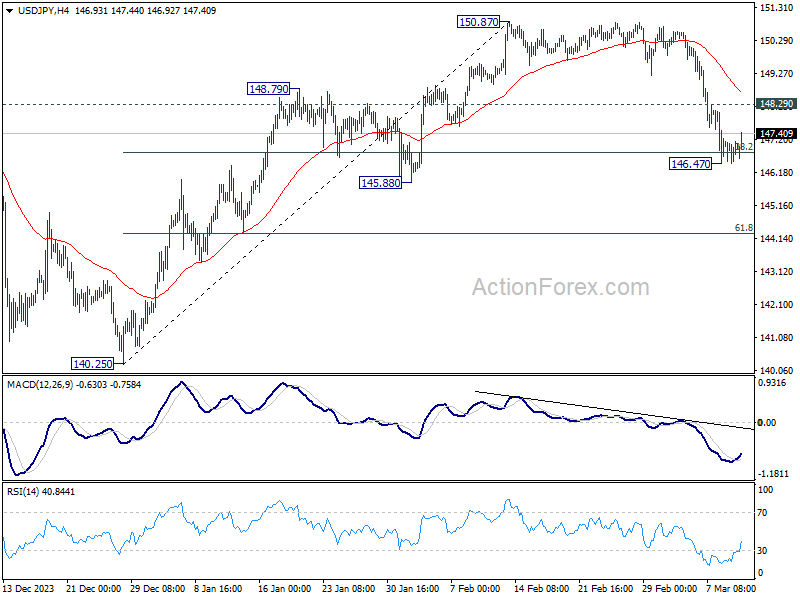
In the bigger picture, no change in the view that price action from 151.89 (2023 high) are correction to up trend from 127.20 (2023 low). The question is whether this correction has completed at 140.25, or extending with fall from 150.87 as the third leg. Sustained break of above mentioned 146.81 fibonacci level will favor the latter case. But even so, downside should be contained by 50% retracement of 127.20 to 151.89 at 139.54.
Yen Retreats as FM Tempers Inflation Optimism; Market Awaits US CPI and UK Wage Insights
Yen weakened broadly in Asian session today, reversing some of its robust since the previous week. This shift in momentum comes amid tempered expectations for an imminent BoJ rate hike at next week's meeting. Japanese Finance Minister Shunichi Suzuki's comments that the country is not yet ready to declare victory over deflation, despite positive signs such as substantial wage hikes and record-high capital spending, prompted some traders to turn cautious. Meanwhile, BoJ Governor Kazuo Ueda's comments in a parliamentary session offered no new hints towards monetary policy adjustments, focusing instead on the bank's data-driven approach to confirming a wage-price spiral.
The currency market sees mixed movements elsewhere, with Dollar also leaning towards the weaker side as the market anticipates critical economic data. Today's US CPI figures are expected to confirm a steady headline inflation rate of 3.1% for February, with core inflation slowing to 3.7%. Analysts suggest that this data might not provide Fed with sufficient confidence to alter its policy in the immediate next meetings (March 19-20, April 30-May 1). Expectations still point towards a pause until at least June. In the UK, BoE and Sterling traders are eagerly awaiting today's wage data for analyzing underlying domestic inflation pressures.
Overall, Yen is currently the day's weakest link, with Aussie and Dollar also underperforming. Conversely, Euro leads as the strongest, with Canadian Dollar and New Zealand Dollar close behind. Swiss Franc and Sterling occupy the middle ground. Yet, all major pairs and crosses are now trading inside last week's ranges, suggesting that they're staying in consolidation phase.
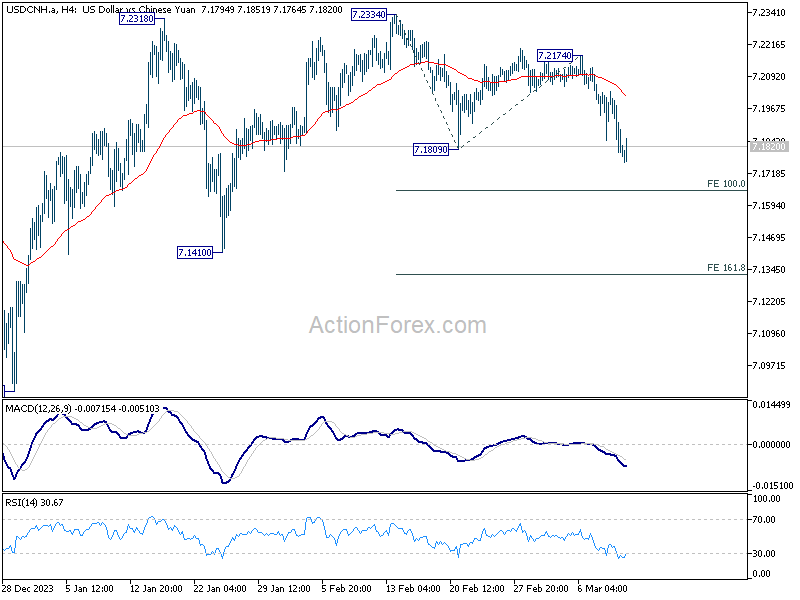
In China, Yuan's near-term recovery persists despite the backdrop of negative news from the troubled property sector. Moody's Ratings downgraded China's Vanke, marking its credit status as speculative and highlighting substantial risks, or effectively "junk".
Technically, USD/CNH's fall from 7.2334 resumed by breaking through 7.1809 support earlier this week. For now, further fall is in favor as long as 55 4H EMA (now at 7.2016) holds. Decisive break of 100% projection of 7.2334 to 7.1809 from 7.2174 at 7.1649 will strengthen the case that USD/CNH is already reversing whole rebound from 7.0870. In this case, deeper fall would be seen to 161.8% projection at 7.132 next.
In Asia, at the time of writing, Nikkei is down -0.60%. Hong Kong HSI is up 1.70%. China Shanghai SSE is down -0.47%. Singapore Strait Times is up 0.32%. Japan 10-year JGB yield is up 0.0059 at 0.773. Overnight, DOW rose 0.12%. S&P 500 fell -0.11%. NASDAQ fell -0.41%. 10-yea ryield rose 0.015 to 4.104.
BoJ's Ueda: Economy recovering gradually despite some signs of weakness
In a parliamentary address today, BoJ Governor Kazuo Ueda noted that Japan's economy is "still recovering gradually", despite acknowledging some recent "signs of weakness".
Ueda highlighted a concerning trend of weakening consumption in food and daily necessities amid rising prices. However, he also pointed out a silver lining with moderate improvements in household spending, fueled by expectations of wage increases.
The anticipation around a rate hike by BoJ has garnered significant attention recently, with Ueda reiterating the bank's focus on the emergence of a "positive wage-inflation cycle." This perspective is crucial for determining the viability of reaching BoJ's inflation targets sustainably and stably.
"Various data have come out since January and we'll likely have additional data come out this week. We will look comprehensively at such data, and make an appropriate monetary policy decision," he said.
Australia NAB business confidence falls to 0, cost pressures clearly remain elevated
Australia's NAB Business Confidence ticked down from 1 to 0 in February. Business Conditions rose from 7 to 10. Trading conditions rose form 9 to 14. Profitability conditions rose from 6 to 9. Employment conditions rose from 5 to 6.
Cost pressures remain a significant concern. Labor (2.0% in quarterly equivalent terms) and purchase cost (1.8%) growth stayed constant. Product price growth rose from 1.1% to 1.3% while retail price growth surged from 0.9% to 1.4%.
Alan Oster, NAB's Chief Economist, pointed out that cost pressures "clearly remain elevated", and there's scope for firms to pass this through to output prices."
He emphasized the role of global supply improvements in driving the progress on disinflation so far, cautioning that future advancements is "unlikely to be linear."
According to Oster, the path to returning inflation within RBA's target band by 2025 is fraught with uncertainties. He predicts a "cautious approach" from RBA, with interest rates to be "on hold for most of this year."
RBA's Hunter: Data broadly in line with expectations
RBA Assistant Governor Sarah Hunter noted that the incoming data were "broadly in line with what we were anticipating." Nevertheless, she emphasized that the central bank is "monitoring and looking" and will be updating the economic forecasts in May.
Hunter also touched on the challenges posed by interest rate hikes, particularly for households finding such adjustments difficult. However, she emphasized that "inflation is the single biggest drag", highlighting RBA's primary focus on managing inflation to ensure economic stability and growth.
BoE's Mann: A long way to go on both services and goods inflation
BoE MPC member Catherine Mann delivered a stark message overnight, emphasizing that the UK has "a long way to go" in controlling both services and goods inflation.
"We're nowhere near the historical relationship between services and goods that is consistent with headline at 2(%)," she added.
Highlighting the "deterioration in the supply side" as a crucial factor, Mann pointed to the tight labour market as a potential source of sustained inflationary pressures.
Mann, recognized for her hawkish stance on monetary policy, was one of two MPC members who advocated for an interest rate hike in the previous month.
Looking ahead
UK employment data is the main focus in European session. Germany will also release CPI final. Later in the day, UK CPI will take center stage.
USD/JPY Daily Outlook
Daily Pivots: (S1) 146.57; (P) 146.87; (R1) 147.25; More...
A temporary low is formed at 146.47 with today's recovery and intraday bias in USD/JPY is turned neutral first. On the downside, sustained break of 38.2% retracement of 140.25 to 150.87 at 146.81 will argue that fall from 150.87 is reversing the whole rally from 140.25. In this case, deeper decline would be seen to 61.8% retracement at 144.30 and below. Nevertheless, strong support from 146.81, followed by break of 148.29 minor resistance resistance, will argue that fall from 150.87 is merely a correction, which has completed already. Retest of 150.87 should be seen next.
In the bigger picture, no change in the view that price action from 151.89 (2023 high) are correction to up trend from 127.20 (2023 low). The question is whether this correction has completed at 140.25, or extending with fall from 150.87 as the third leg. Sustained break of above mentioned 146.81 fibonacci level will favor the latter case. But even so, downside should be contained by 50% retracement of 127.20 to 151.89 at 139.54.
Economic Indicators Update
| GMT | Ccy | Events | Actual | Forecast | Previous | Revised |
|---|---|---|---|---|---|---|
| 23:50 | JPY | PPI Y/Y Feb | 0.60% | 0.50% | 0.20% | |
| 23:50 | JPY | BSI Large Manufacturing Index Q1 | -6.7 | 6.2 | 5.7 | |
| 00:30 | AUD | NAB Business Confidence Feb | 0 | 1 | ||
| 00:30 | AUD | NAB Business Conditions Feb | 10 | 6 | ||
| 07:00 | EUR | Germany CPI M/M Feb F | 0.40% | 0.40% | ||
| 07:00 | EUR | Germany CPI Y/Y Feb F | 2.50% | 2.50% | ||
| 07:00 | GBP | Claimant Count Change Feb | 20.3K | 14.1K | ||
| 07:00 | GBP | ILO Unemployment Rate (3M) Jan | 3.80% | 3.80% | ||
| 07:00 | GBP | Average Earnings Including Bonus 3M/Y Jan | 5.70% | 5.80% | ||
| 07:00 | GBP | Average Earnings Excluding Bonus 3M/Y Jan | 6.20% | 6.20% | ||
| 10:00 | USD | NFIB Business Optimism Index Feb | 90.7 | 89.9 | ||
| 12:30 | USD | CPI M/M Feb | 0.40% | 0.30% | ||
| 12:30 | USD | CPI Y/Y Feb | 3.10% | 3.10% | ||
| 12:30 | USD | CPI Core M/M Feb | 0.30% | 0.40% | ||
| 12:30 | USD | CPI Core Y/Y Feb | 3.70% | 3.90% |
BoJ’s Ueda: Economy recovering gradually despite some signs of weakness
In a parliamentary address today, BoJ Governor Kazuo Ueda noted that Japan's economy is "still recovering gradually", despite acknowledging some recent "signs of weakness".
Ueda highlighted a concerning trend of weakening consumption in food and daily necessities amid rising prices. However, he also pointed out a silver lining with moderate improvements in household spending, fueled by expectations of wage increases.
The anticipation around a rate hike by BoJ has garnered significant attention recently, with Ueda reiterating the bank's focus on the emergence of a "positive wage-inflation cycle." This perspective is crucial for determining the viability of reaching BoJ's inflation targets sustainably and stably.
"Various data have come out since January and we'll likely have additional data come out this week. We will look comprehensively at such data, and make an appropriate monetary policy decision," he said.
EUR/USD Turns Green But Can Bulls Protect This Support
Key Highlights
- EUR/USD started a decent increase above the 1.0880 resistance.
- A key bullish trend line is forming with support at 1.0910 on the 4-hour chart.
- Gold prices rallied above the $2,180 resistance zone.
- The US Consumer Price Index could be 3.1% in Feb 2024 (YoY).
EUR/USD Technical Analysis
The Euro started a fresh increase above the 1.0850 level against the US Dollar. EUR/USD broke the 1.0880 level to move into a positive zone.
Looking at the 4-hour chart, the pair settled above the 1.0880 level, the 100 simple moving average (red, 4-hour), and the 200 simple moving average (green, 4-hour). It also traded above the 1.0950 level before the bears appeared.
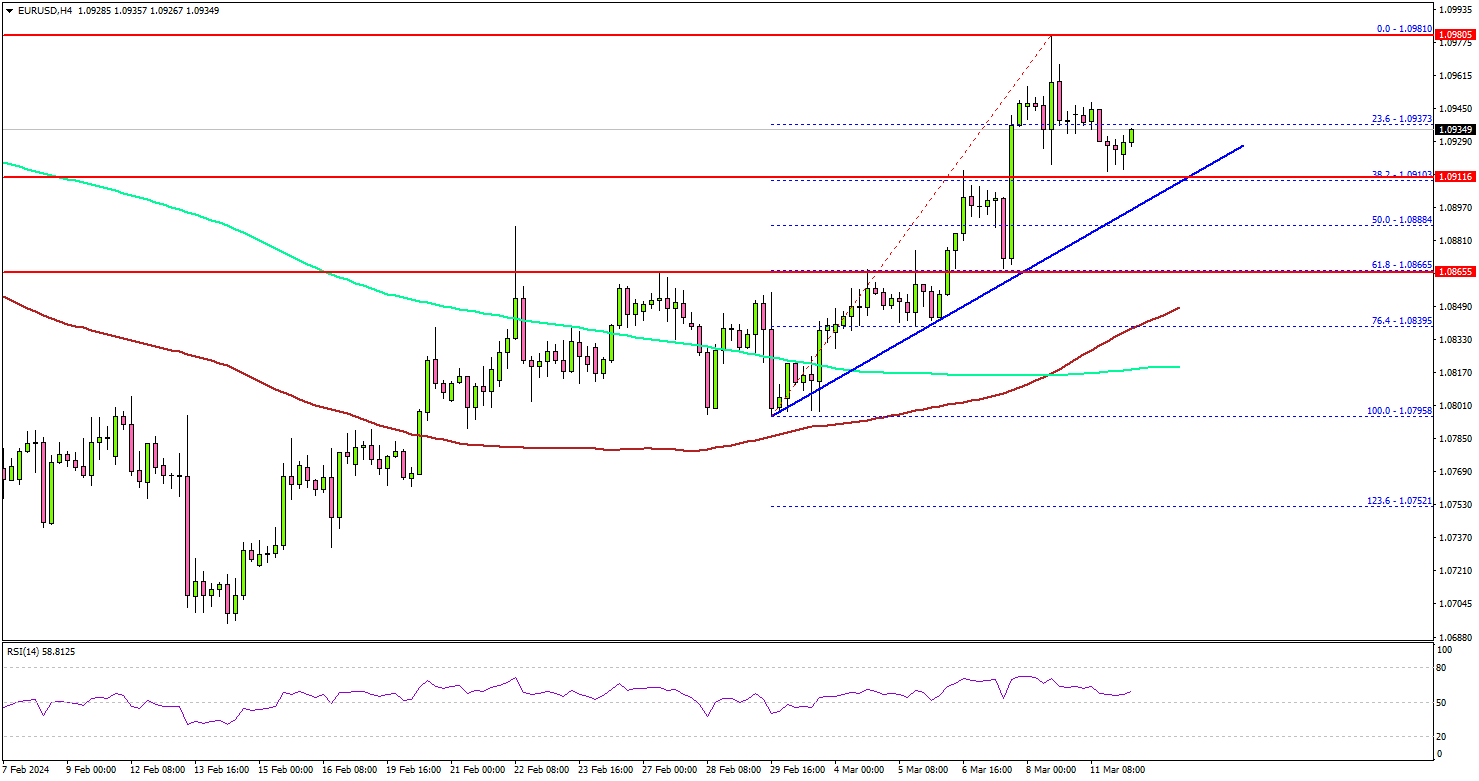
A high was formed at 1.0981 before the pair corrected lower. There was a move below the 1.0950 level. The pair dipped below the 23.6% Fib retracement level of the upward move from the 1.0795 swing low to the 1.0981 high.
Immediate support is near the 1.0910 level. There is also a key bullish trend line forming with support at 1.0910 on the same chart. The next major support is at 1.0865 or the 61.8% Fib retracement level of the upward move from the 1.0795 swing low to the 1.0981 high.
If there is a downside break below the 1.0865 support, the pair could decline toward the 1.0820 support. If there is a fresh increase, the pair could face resistance near the 1.0950 level.
The first major resistance is now forming near 1.0980. The main resistance is near 1.1000. A close above the 1.1000 zone could open the doors for more upsides. The next stop for the bulls might be 1.1080.
Looking at Gold, there was a strong increase above the $2,150 resistance and the bulls might aim for a move toward $2,250.
Economic Releases
- US Consumer Price Index for Feb 2024 (MoM) – Forecast +0.4%, versus +0.3% previous.
- US Consumer Price Index for Feb 2024 (YoY) – Forecast +3.1%, versus +3.1% previous.
- US Consumer Price Index Ex Food & Energy for Feb 2024 (YoY) – Forecast +3.7%, versus +3.9% previous.