Sample Category Title
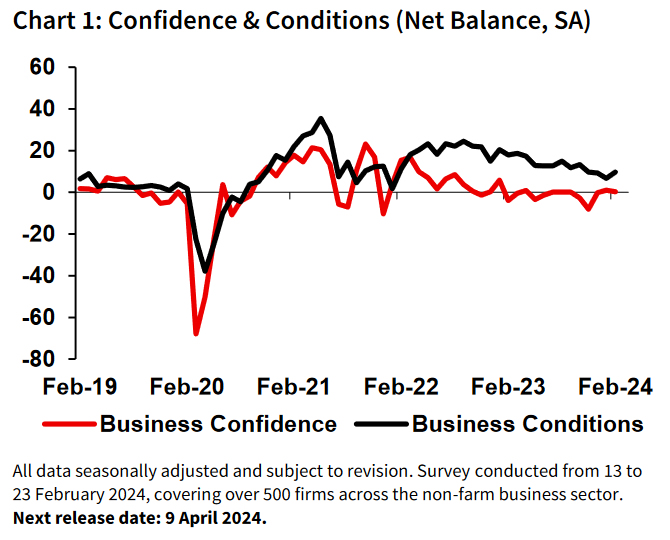
Australia NAB business confidence falls to 0, cost pressures clearly remain elevated
Australia's NAB Business Confidence ticked down from 1 to 0 in February. Business Conditions rose from 7 to 10. Trading conditions rose form 9 to 14. Profitability conditions rose from 6 to 9. Employment conditions rose from 5 to 6.
Cost pressures remain a significant concern. Labor (2.0% in quarterly equivalent terms) and purchase cost (1.8%) growth stayed constant. Product price growth rose from 1.1% to 1.3% while retail price growth surged from 0.9% to 1.4%.
Alan Oster, NAB's Chief Economist, pointed out that cost pressures "clearly remain elevated", and there's scope for firms to pass this through to output prices."
He emphasized the role of global supply improvements in driving the progress on disinflation so far, cautioning that future advancements is "unlikely to be linear."
According to Oster, the path to returning inflation within RBA's target band by 2025 is fraught with uncertainties. He predicts a "cautious approach" from RBA, with interest rates to be "on hold for most of this year."
RBA’s Hunter: Data broadly in line with expectations
RBA Assistant Governor Sarah Hunter noted that the incoming data were "broadly in line with what we were anticipating." Nevertheless, she emphasized that the central bank is "monitoring and looking" and will be updating the economic forecasts in May.
Hunter also touched on the challenges posed by interest rate hikes, particularly for households finding such adjustments difficult. However, she emphasized that "inflation is the single biggest drag", highlighting RBA's primary focus on managing inflation to ensure economic stability and growth.
BoE’s Mann: A long way to go on both services and goods inflation
BoE MPC member Catherine Mann delivered a stark message overnight, emphasizing that the UK has "a long way to go" in controlling both services and goods inflation.
"We're nowhere near the historical relationship between services and goods that is consistent with headline at 2(%)," she added.
Highlighting the "deterioration in the supply side" as a crucial factor, Mann pointed to the tight labour market as a potential source of sustained inflationary pressures.
Mann, recognized for her hawkish stance on monetary policy, was one of two MPC members who advocated for an interest rate hike in the previous month.
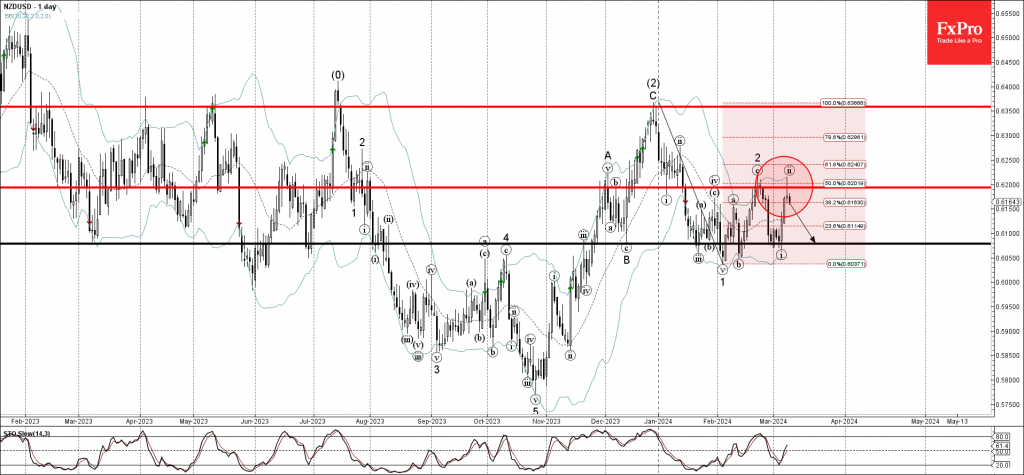
NZDUSD Wave Analysis
- NZDUSD reversed from resistance level 0.6200
- Likely to fall to support level 0.6080
NZDUSD currency pair today reversed down from the resistance level 0.6200 (which stopped the previous minor ABC correction 2 in the middle of February) intersecting with the 50% Fibonacci correction of the downward impulse 1 from January.
The downward reversal from the resistance level 0.6200 created the daily candlesticks reversal pattern Shooting Star.
Given the strength of the resistance level 0.62000, NZDUSD currency pair can be expected to fall further toward the next support level 0.6080 (low of the previous wave i).
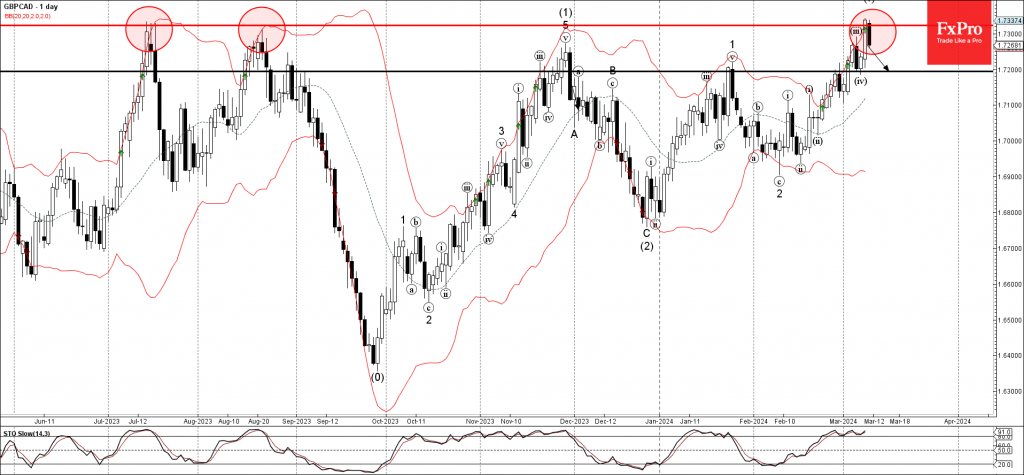
GBPCAD Wave Analysis
- GBPCAD reversed from resistance level 1.7325
- Likely to fall to support level 1.7200
GBPCAD currency pair today reversed down from the long-term resistance level 1.7325 (which has been reversing the pair from the middle of last year, as can be seen below).
The resistance level 1.7325 was further strengthened by the upper daily and the weekly Bollinger Bands.
Given the strength of the resistance level 1.7325 and the still overbought daily Stochastic indicator, GBPCAD currency pair can be expected to fall further toward the next support level 1.7200 (low of the previous correction iv).
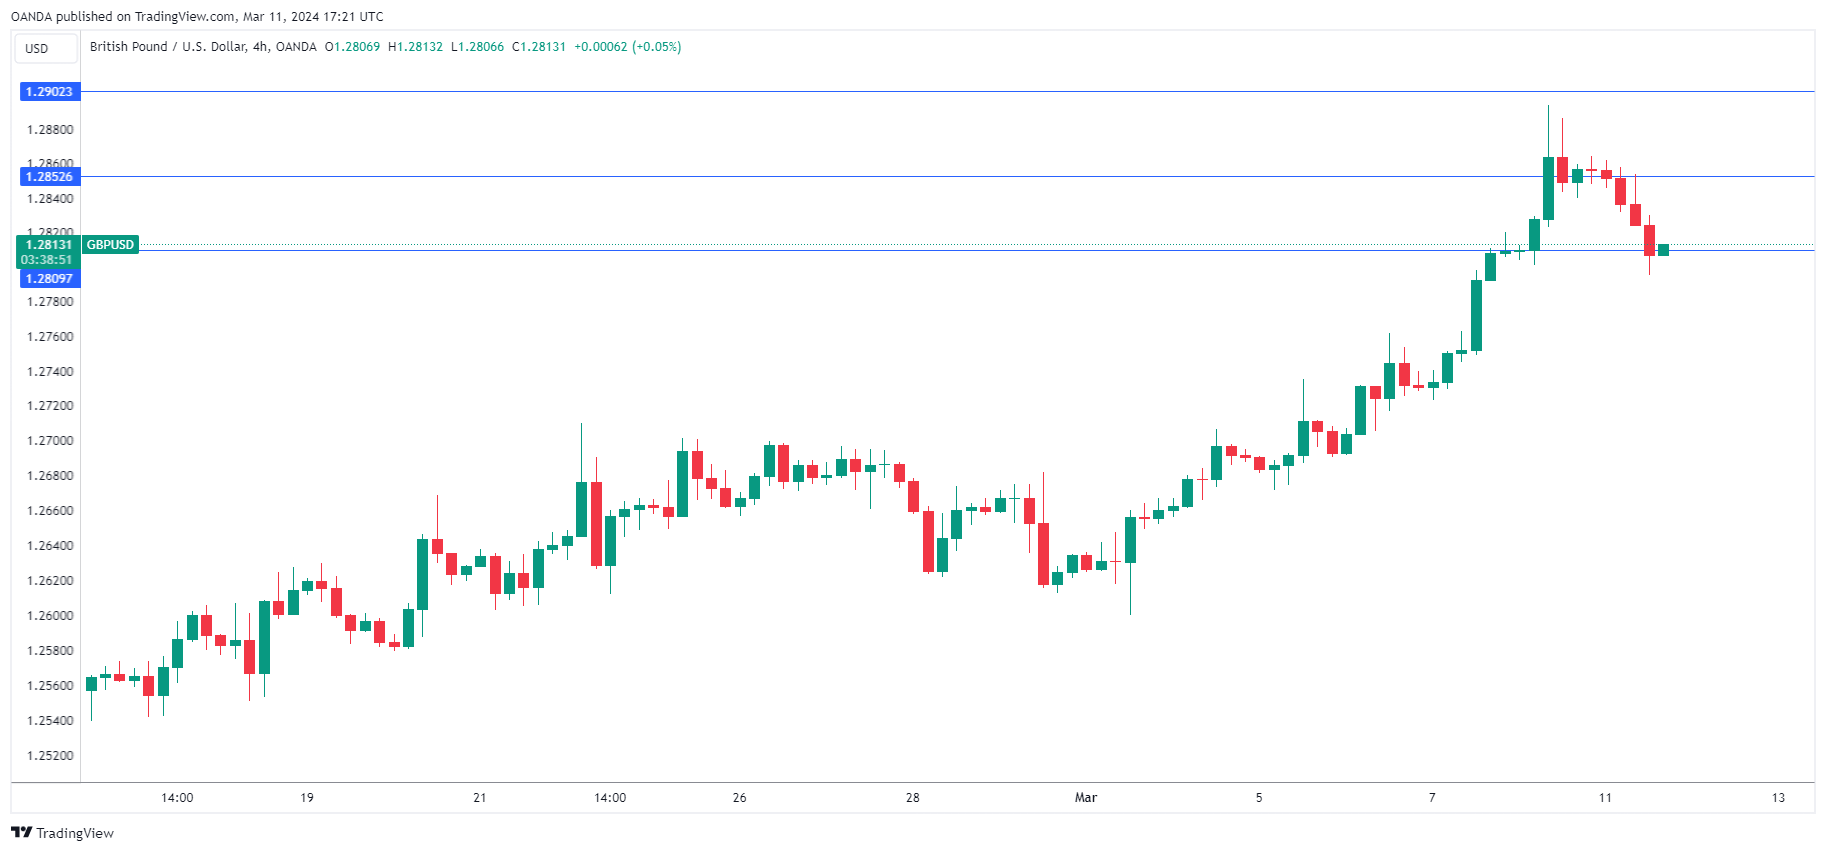
GBP/USD Edges Lower, UK Employment Next
The British pound has started the trading week in negative territory. In the North American session, GBP/USD is trading at 1.2807, down 0.39%. The pound has posted six straight winning days and climbed 1.56% last week against the US dollar.
UK employment expected to decelerate
The UK releases the employment report on Tuesday. The labor market has remained resilient even with the steep rise in interest rates, and the new measure for employment data has indicated that the labour market is stronger than previously thought. For instance, the unemployment rate in the fourth quarter of 2023 stood at 3.8%, compared to 4.2% under the old measure. The unemployment rate is expected to remain steady at 3.8% in the first quarter.
We could see a large drop in job growth, with an estimate of 10,000 for Q4, compared to 72,000 in Q3. Wage growth has been dropping steadily and is expected to tick lower to 5.7% y/y including bonuses, down from 5.8% in the third quarter.
The Bank of England will be keeping a close eye on the employment release. The BoE meets on March 21 and Governor Bailey has eased up on his pushback against rate cut expectations. If Tuesday’s employment numbers are stronger than expected, it will likely raise the odds of a rate cut later this year.
In the US, Friday’s employment release was a mix. Job growth remained strong as nonfarm payrolls rose 275,000, easily beating the market estimate of 200,000 and the downwardly revised 229,000 in January.
However, the unemployment rate surprised by climbing to 3.9% after holding at 3.7% for three consecutive months, which was also the market estimate. This was the highest unemployment rate in two years and points to softer labor market conditions. The rise in the unemployment rate has raised the odds of a rate cut in June by the Federal Reserve. Currently, the likelihood of a cut is 71%, compared to 64% just one week ago, according to the CME’s FedWatch tool.
GBP/USD Technical
- There is resistance at 1.2902 and 1.2945
- GBP/USD pushed below support at 1.2852 and is testing support at 1.2809
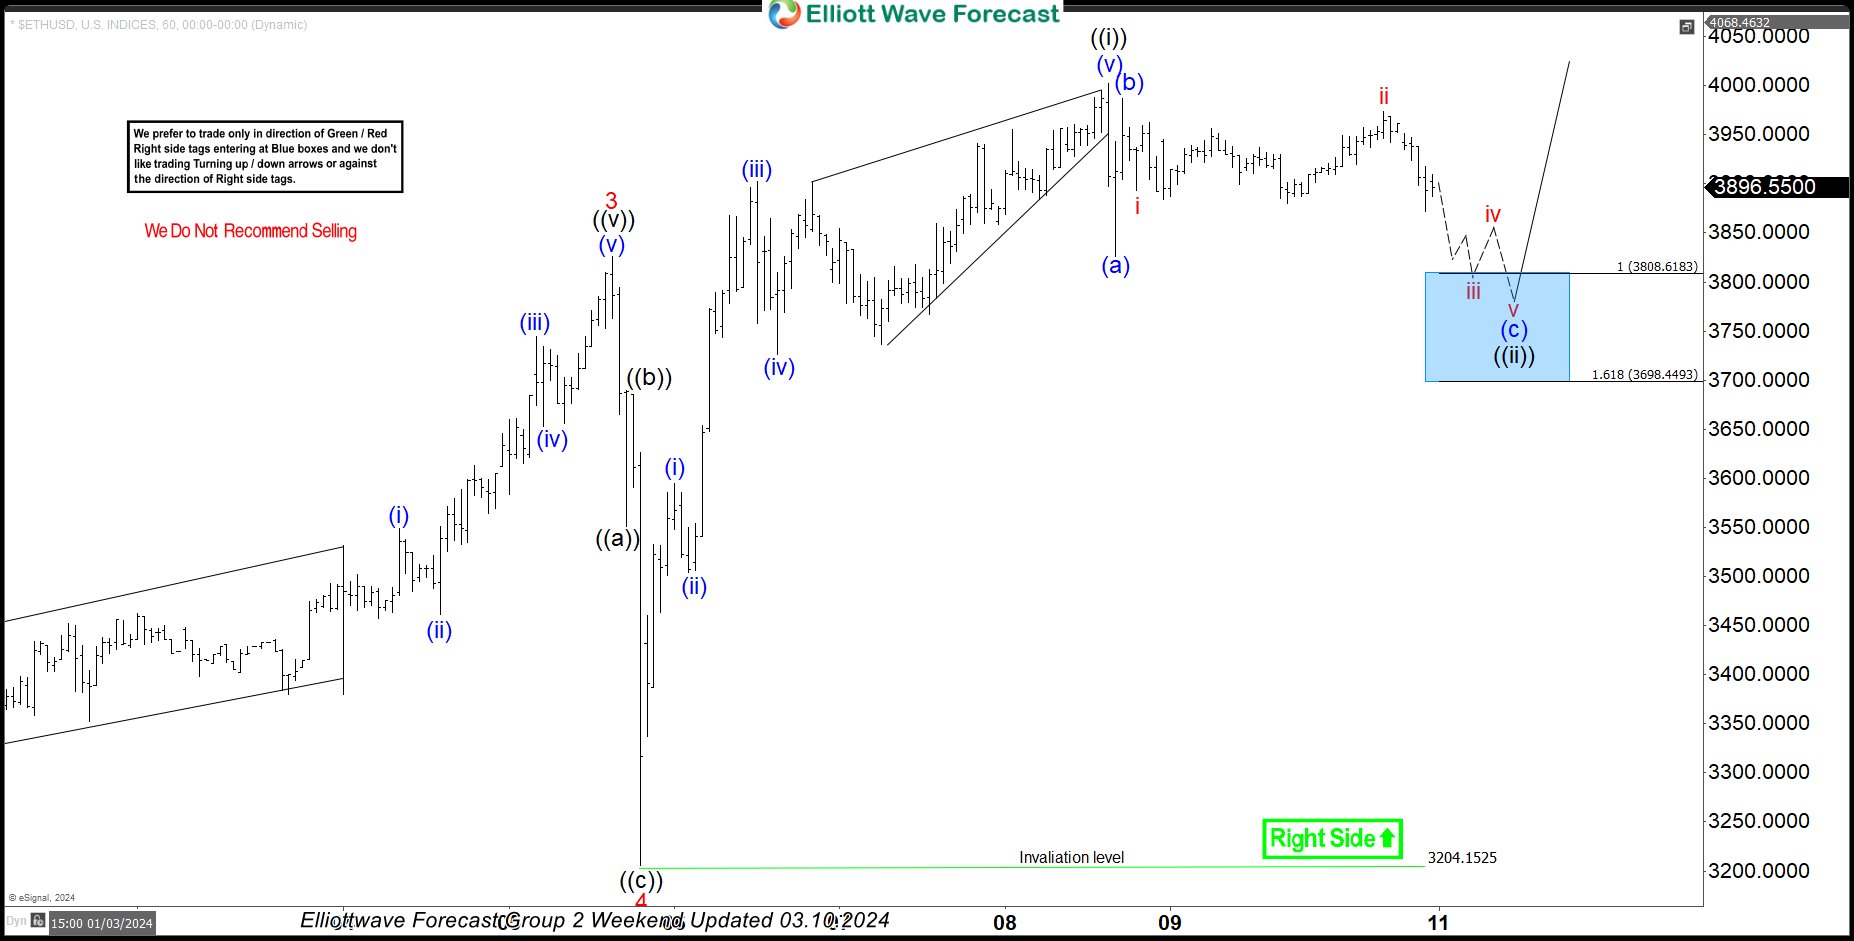
Ethereum (ETHUSD) : Buying The Dips At The Blue Box Area
Hello fellow traders. In this technical article we’re going to take a look at the Elliott Wave charts charts of ETHUSD published in members area of the website. As our members know Ethereum has given us 3 waves pull back recently that found buyers right at the Blue Box ( Buying Area). We have been favoring the long side due to impulsive bullish sequences the crypto is showing in the cycle from the October 2023 low. In further text we’re going to explain the short term Elliott Wave forecast and trading setup.
ETHUSD Elliott Wave 1 Hour Chart 03.10.2024
Current view suggests Ethereum ended short term cycle from the 3204.15 low as 5 waves rally -((i)) black. Currently the crypto is doing intraday pull back , wave ((ii)) black. We expect to see another leg down (c) of ((ii)) to complete the structure. We don’t recommend selling ETHUSD and prefer the long side from the marked Blue Box ( buying zone). Once Ethereum reaches our buying area, it should ideally make either rally toward new highs or in 3 waves bounce alternatively. When bounce reaches 50 Fibs against the (b) blue high, we will make long position risk free ( put SL at BE) and take partial profits.
Quick reminder on how to trade our charts :
Red bearish stamp+ blue box = Selling Setup
Green bullish stamp+ blue box = Buying Setup
Charts with Black stamps are not tradable. 🚫
Official trading strategy on How to trade 3, 7, or 11 swing and equal leg is explained in details in Educational Video, available for members viewing inside the membership area.
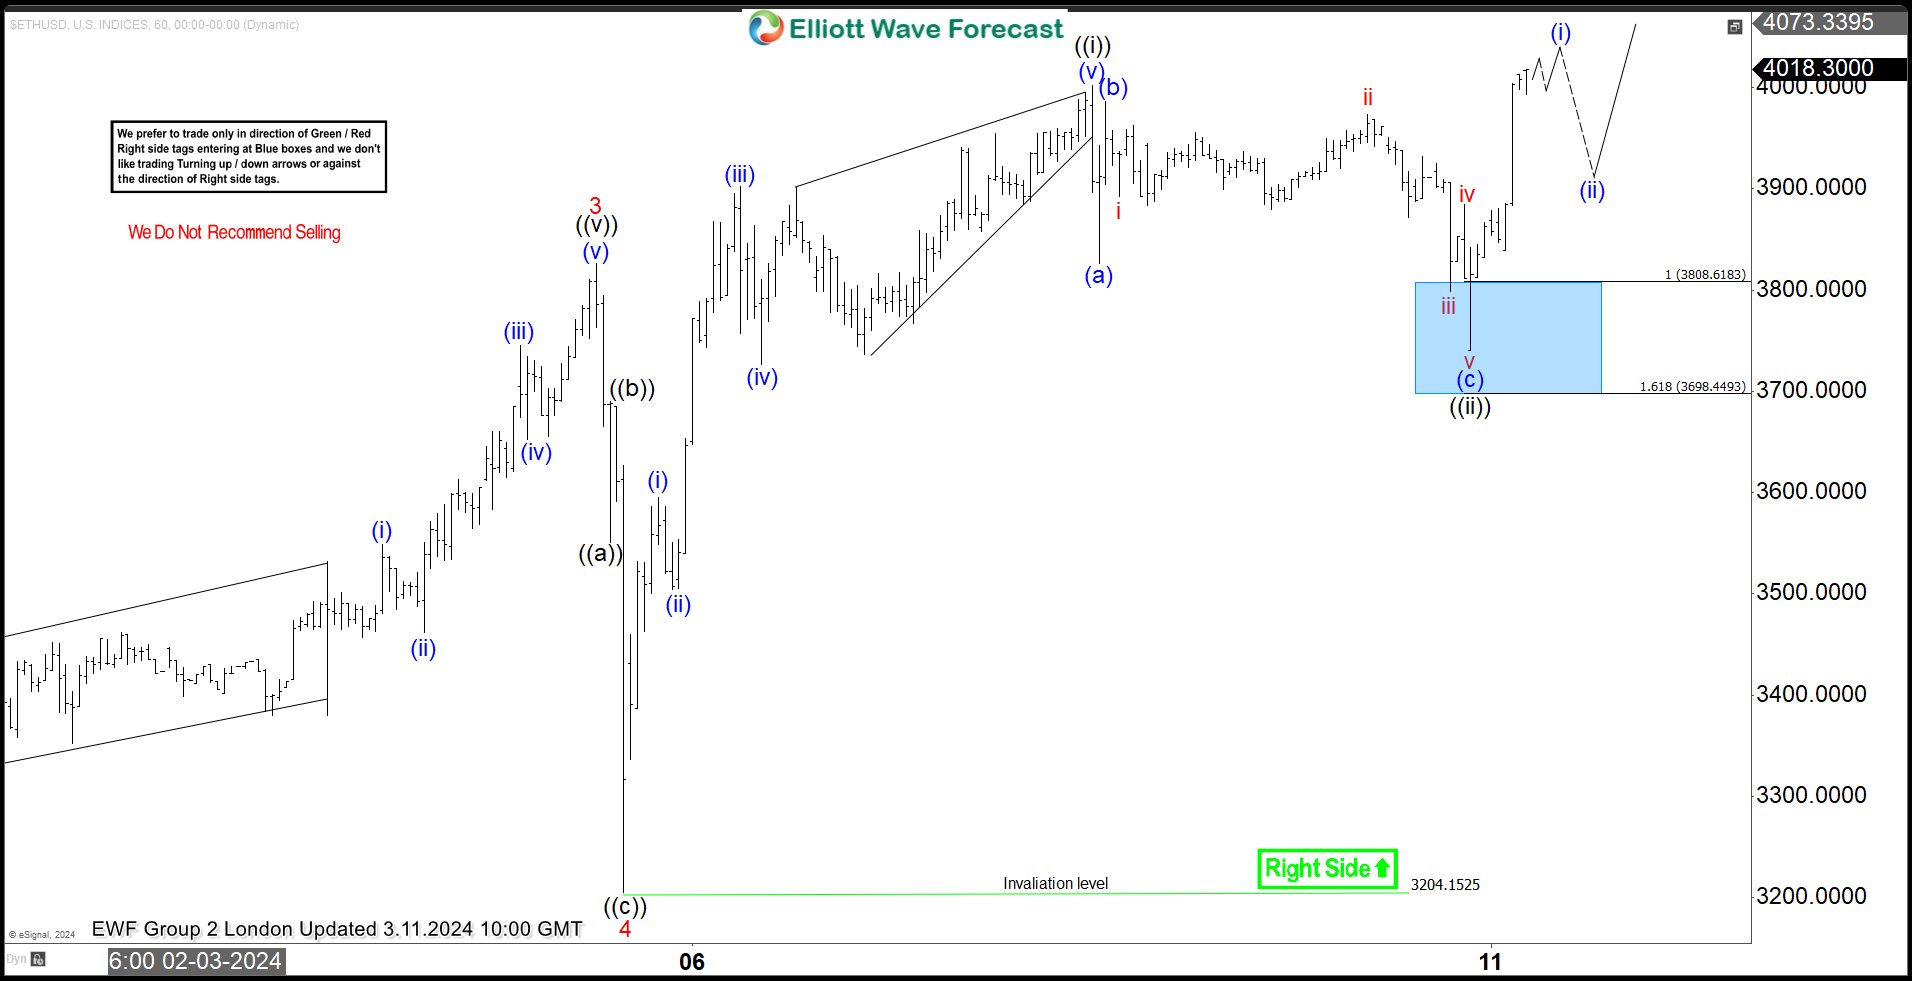
ETHUSD Elliott Wave 1 Hour Chart 03.11.2024
Ethereum found buyers right at the marked blue box as expected and we got good reaction from there. Pull back completed at 3733 low. Rally from that level looks impulsive. We expect ETHUSD to keep finding intraday buyers in 3,7,11 swings and we don’t recommend selling in any proposed pull back.
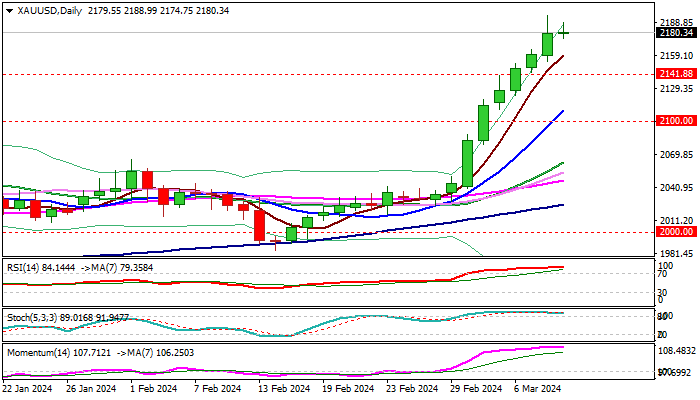
XAU/USD: Gold Consolidating After 4.6% Advance Last Week
Bulls are taking a breather and consolidating within a narrow range on Monday, just under new all-time high ($2195) and psychological $2200 barrier.
The yellow metal continues to shine (advanced 4.6% last week, in the biggest weekly gain since the second week of March 2023), lifted by growing expectations for Fed rate cut.
Strongly overbought conditions on daily chart suggest that traders may opt for partial profit taking, although relatively quiet trading on Monday, also indicates that markets await fresh signals from US inflation data, due on Tuesday.
Gold will likely rise further if February numbers confirm that inflation remains in a downward trajectory which will add to expectations for the first rate cut in June.
Conversely, higher than expected figures would raise worries about persisting price pressures and probably cool the expectations for the start of policy easing, as Fed Chief Powell said last week that the central bank’s policy decisions will directly depend on inflation data.
Initial support lays at $2174 (session low) followed by rising 5DMA ($2158), former top at $2141 and daily Kijun-sen/psychological ($2019/$2100 respectively).
Immediate resistances lay T $2200/06 (psychological / Fibo 138.2% projection), with sustained break of $2200 zone to expose targets at $2245 (161.8%) and $2270 (176.4% projection) in extension.
Res: 2195; 2200; 2206; 2245.
Sup: 2174; 2141; 2100; 2088.
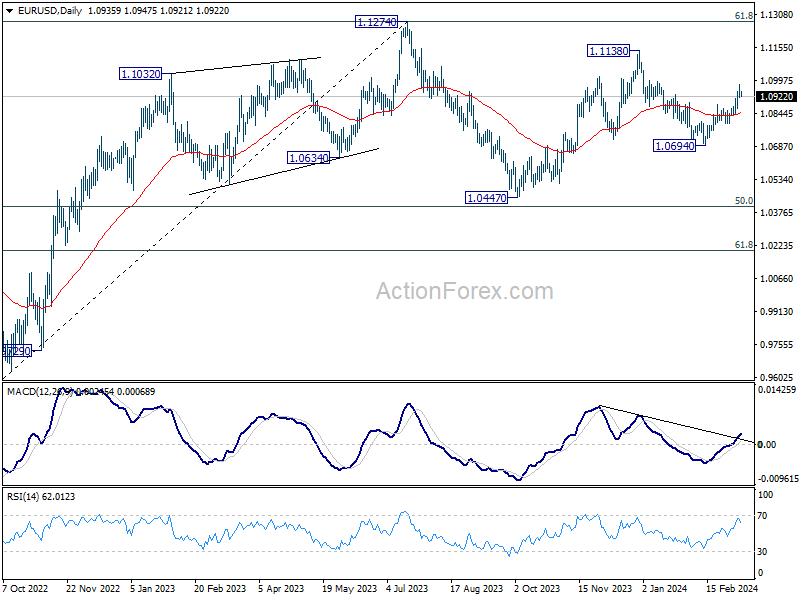
EUR/USD Mid-Day Outlook
Daily Pivots: (S1) 1.0911; (P) 1.0946; (R1) 1.0974; More...
Intraday bias in EUR/USD is turned neutral with current retreat. Some consolidations would be seen below 1.0980 temporary top first. But further rise would remain in favor as long as 1.0797 support holds. Fall from 1.1138 could have completed at 1.0694, as a correction to rise from 1.0447. Above 1.0980 will resume the rise from 1.0694 to retest 1.1138 high.
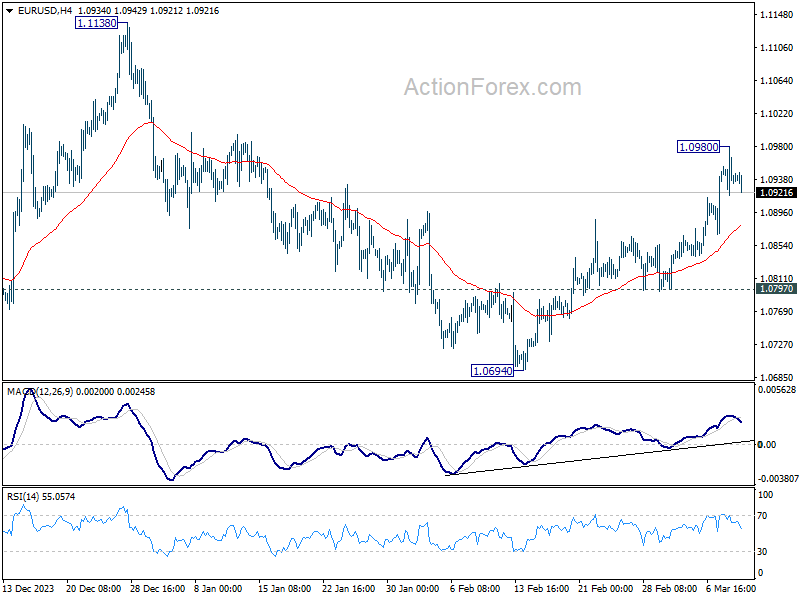
In the bigger picture, price actions from 1.1274 are viewed as a corrective pattern to rise from 0.9534 (2022 low). Rise from 1.0447 is seen as the second leg. While further rally could cannot be ruled out, upside should be limited by 1.1274 to bring the third leg of the pattern. Meanwhile, sustained break of 1.0694 support will argue that the third leg has already started for 1.0447 and possibly below.