
Sample Category Title
Jobs Friday
Yesterday’s European Central Bank (ECB) meeting and Lagarde’s press conference went according to the plan. The ECB left its rates unchanged for the fourth straight meeting, lowered its inflation forecasts, predicted that inflation will reach the 2% target by next year and suppressed its growth forecast for this year. Still, Lagarde said that they aren’t ‘sufficiently confident’ in inflation to lower rates but that they ‘will know a little bit more in April and that they will know a lot more in June’. It was heard as ‘we will start cutting the rates in June if inflation continues to ease as predicted’. The dovish message was well received from the market: the Eurozone bond yields fell, the Stoxx 600 hit a fresh record, but the EURUSD extended gains above the 1.0955 as the US dollar fell more than the euro did as the Federal Reserve (Fed) Chair Jerome Powell reiterated that rate reduction in the US ‘can and will begin’ this year.
Who will cut first?
Mr. Powell sounded more confidently dovish Madame Lagarde. While Lagarde said they are not confident enough to lower rates, the Fed head said that he and his colleagues are ‘waiting to become more confident that inflation is moving sustainably at 2%’, that ‘when they get that confidence, they will begin dial back the level of restriction’ and that they are ‘not far from it’!
You don’t need to repeat such a confident message twice. The US dollar index tumbled to the lowest levels since January, and the dollar bears now target the 100 mark on expectation that the Fed is done cooking the idea of a rate cut, they are just waiting for it to cool before bringing it on the table. The smell of that dovish cake sent the S&P500 to a fresh record, of course. Nvidia gained another 4.5% - really I am not kidding – the company added another 4.5% yesterday just like that, whereas Broadcom – which also jumped more than 4% yesterday – fell 3% in the afterhours trading after announcing disappointing sales last quarter. Happily, the company highlighted that their AI demand is growing and that’s all that matters.
A different game is played in Asia
Japanese stocks fell below 40’000 level as the USDJPY tumbled below the 148 level on rising speculation that the Bank of Japan (BoJ) could be closer to exiting the negative rates than many think. The most aggressive hawks bet that the BoJ will already hike rates at their March meeting. I think that they will – in the best case scenario – hint that there could be a hike in April. But you never know with the BoJ.
The growing divergence between more hawkish BoJ expectations and more dovish Fed expectations should back a USDJPY decline to at least 140. Then, depending on how hawkish the BoJ sounds, we shall see the USDJPY ease to 125/130 level. But be careful because the BoJ will unlikely to raise its rates at the same speed than the ECB or the Fed did. The chances are that the BoJ will move slowly. Hence, the road below the 140 could be choppy.
Beyond Japan, the rebound in Chinese stocks began losing steam this week, as the government’s 5% growth and 3% inflation target looked overstretched and yesterday’s jump in trade numbers were ignored, as investors realized that the boost was due to the fact that the January and February data is announced together to avoid the Chinese New Year fall in activity. The iShares MSCI China ETF saw the biggest one-day outflows on Wednesday since last December.
Jobs Friday
Due today, the US jobs numbers could further boost the dovish enthusiasm… or not. Note that the last two readings were abnormally strong with NFP reads above 300K mark. The latter interrupted the downtrend in US payrolls – a downtrend that was in play following the post-pandemic peak.
But on the other hand, other metrics – like lower job openings and lower quit rates – hint that there is a normalization and a certain loosening in the US jobs market. The quit rates for example fell below the pre-pandemic average hinting that the Great Resignation era is leaving its place to Great Stay and that means a possible downward pressure on wages growth.
The US economy is expected to have added around 200K jobs last month, and the monthly average pay may have increased at a slower speed. Unemployment rate is seen steady at 3.7%. If the data is sufficiently soft – or ideally softer than expected, the Fed doves will finish the week on a dominant note. But if we see another month of blowout jobs report, confusion will reign.
But in all cases, what matters the most is inflation. Even if the US jobs data comes in hot, if next week’s US CPI read is soft enough, investors will continue to daydream about that first rate cut. Oh that first rate cut…
USD/JPY Nosedives After Rejection, Gold Extends Rally
Key Highlights
- USD/JPY started a major decline from the 150.80 resistance zone.
- It traded below a key bullish trend line with support at 150.00 on the 4-hour chart.
- Gold prices surged above the $2,120 resistance zone.
- The nonfarm payrolls could change by 200K, down from 353K.
USD/JPY Technical Analysis
The US Dollar struggled to clear the 150.80 resistance zone against the Japanese Yen. USD/JPY started a major decline after it settled below 150.00.
Looking at the 4-hour chart, the pair settled below the 150.00 level, the 100 simple moving average (red, 4-hour), and the 200 simple moving average (green, 4-hour). It also traded below a key bullish trend line with support at 150.00.
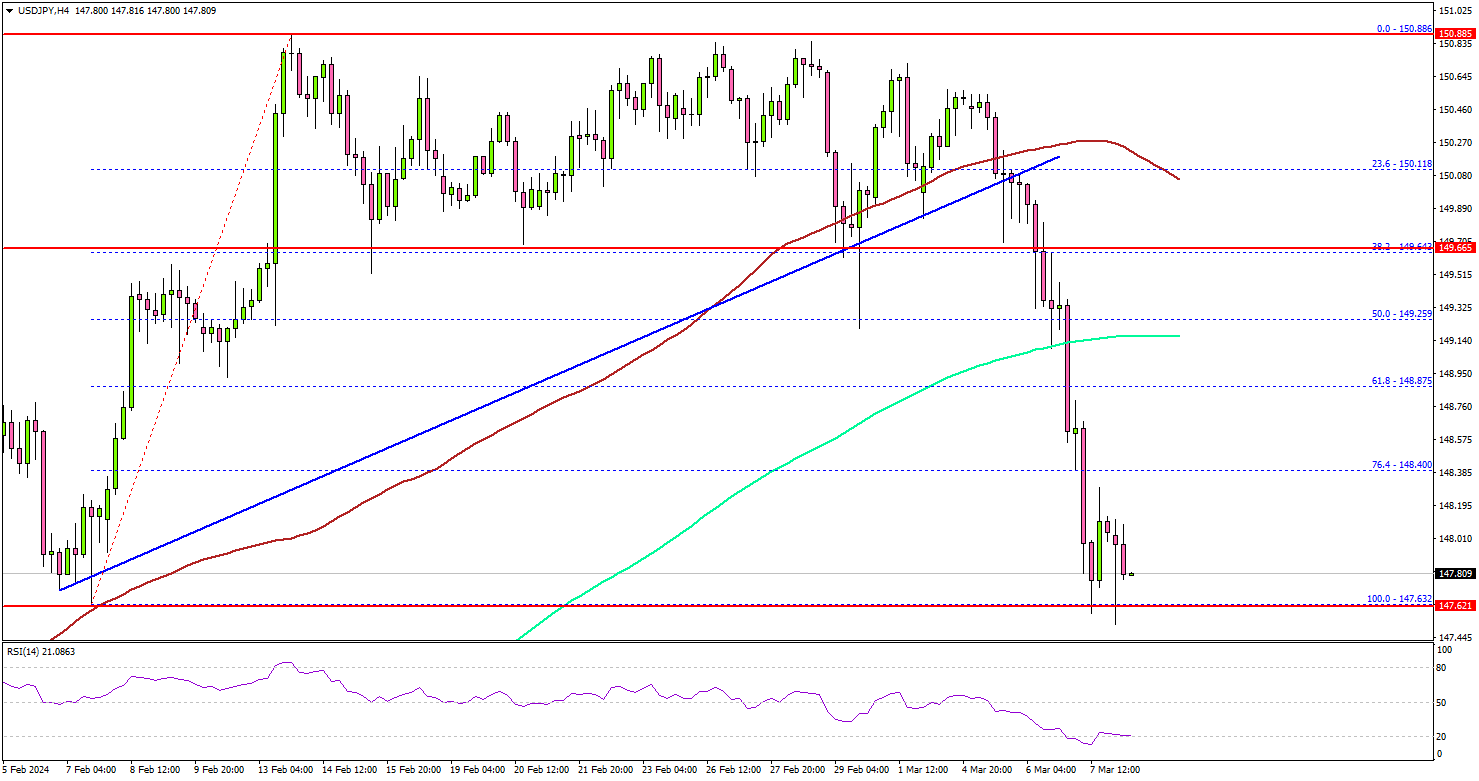
The bears took control and dumped the pair below the 148.80 support zone. There was a clear move below the 76.4% Fib retracement level of the upward move from the 147.63 swing low to the 150.88 high.
Immediate support is near the 147.60 level. The next major support is at 147.20. If there is a downside break below the 147.20 support, the pair could decline toward the 146.00 support.
If there is a recovery wave, the pair could face resistance near the 148.20 level. The first major resistance is now forming near the 148.80 level and the 200 simple moving average (green, 4-hour). The main resistance is near 149.20. A close above the 149.20 zone could open the doors for more upsides. The next stop for the bulls might be 150.00.
Looking at Gold, there was a strong increase above the $2,120 resistance and the bulls might aim for a move toward $2,180.
Economic Releases
- US nonfarm payrolls for Feb 2024 – Forecast 200K, versus 353K previous.
- US Unemployment Rate April 2024 - Forecast 3.7%, versus 3.7% previous.
Technical Outlook and Review
DXY:
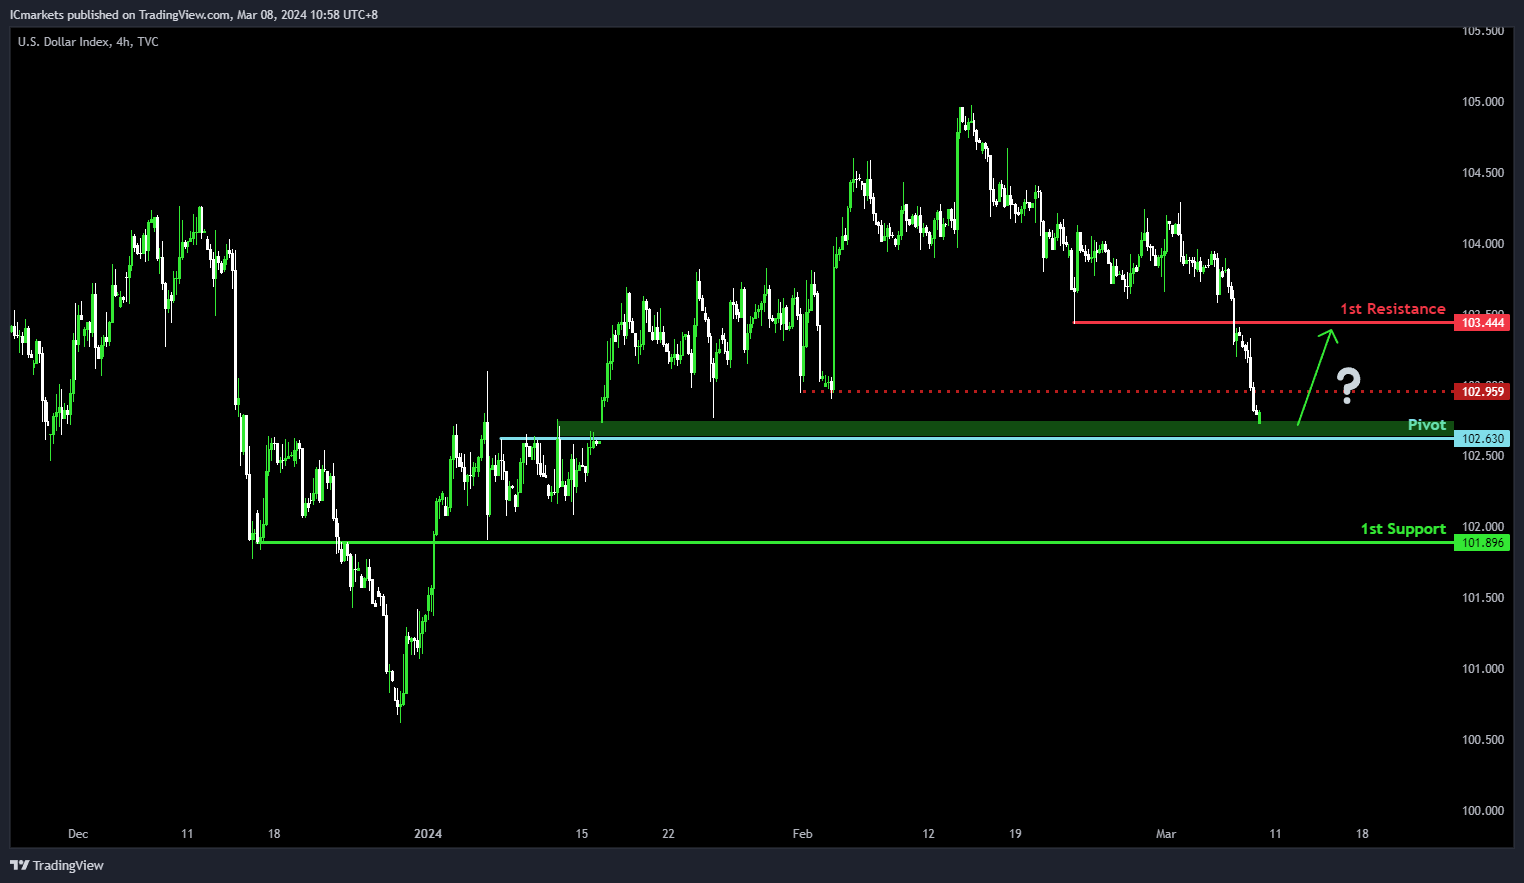
The DXY (US Dollar Index) chart currently maintains its bullish momentum, indicating a potential scenario of a bullish bounce off the pivot and a subsequent move towards the 1st resistance.
The pivot level at 102.63 serves as an overlap support, suggesting historical significance as a level where buying interest has previously emerged to support the price. Additionally, the 1st support at 101.89 is identified as an overlap support, further reinforcing its importance as a level
On the resistance side, the 1st resistance level at 103.44 is noted as a pullback resistance, indicating its historical significance as a barrier where selling pressure may increase, potentially limiting upward movement. An intermediate resistance level at 102.95 is highlighted as a pullback resistance.
EUR/USD:
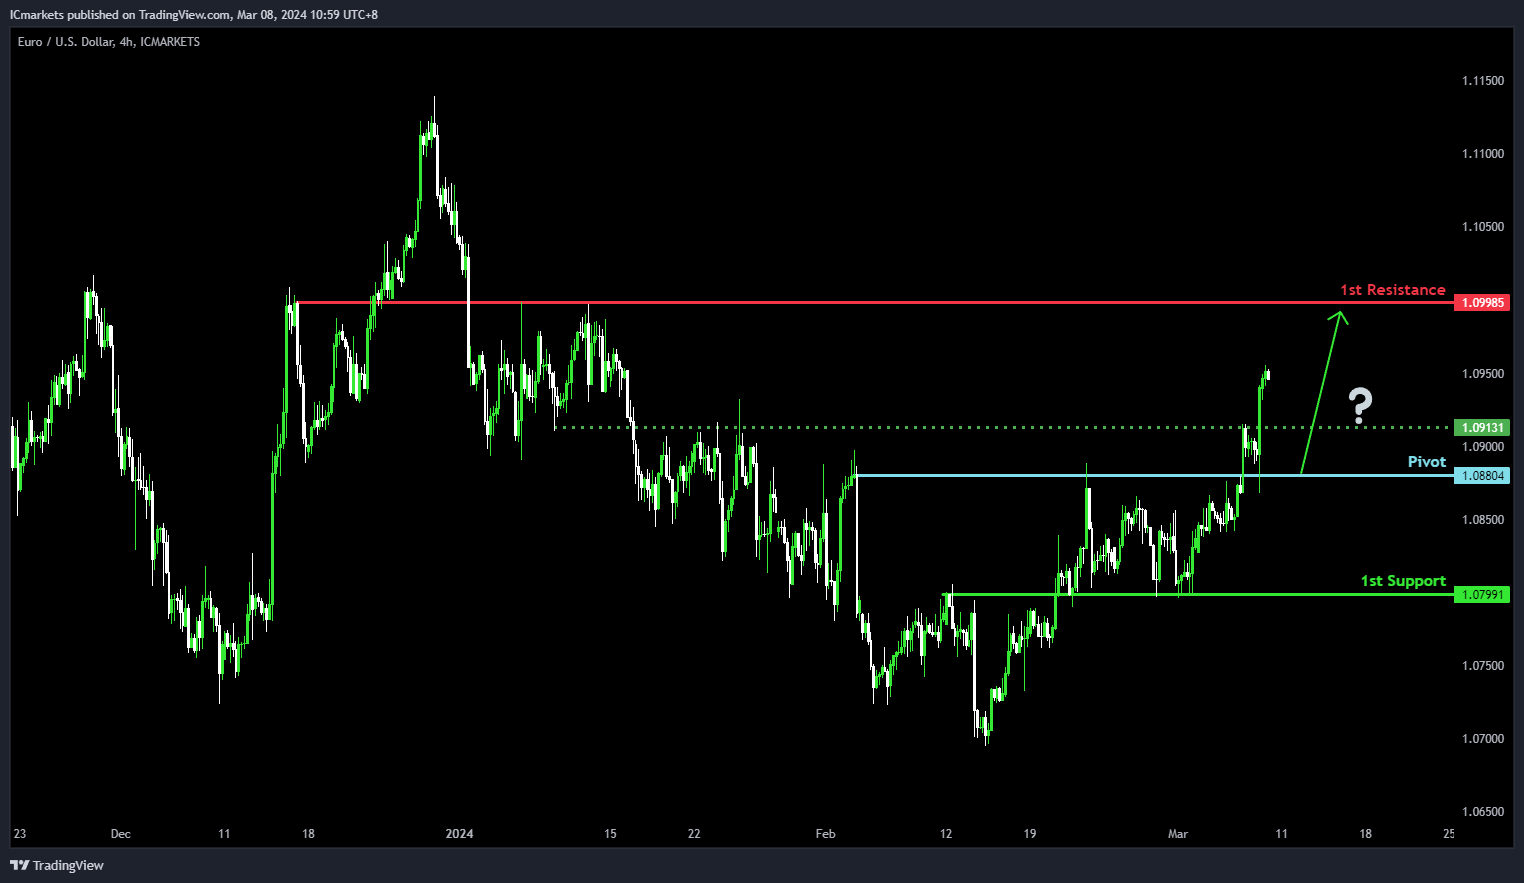
The EUR/USD chart currently exhibits bullish momentum, suggesting a potential scenario of a bullish bounce off the pivot and a subsequent move towards the 1st resistance.
The pivot level at 1.0880 is identified as an overlap support, indicating historical significance as a level where buying interest has previously emerged to support the price. Additionally, the 1st support at 1.0799 is also noted as an overlap support, further reinforcing its importance as a level where price has historically found support.
On the resistance side, the 1st resistance level at 1.0998 is identified as an overlap resistance, suggesting its historical significance as a barrier where selling pressure may increase, potentially limiting upward movement.
EUR/JPY:
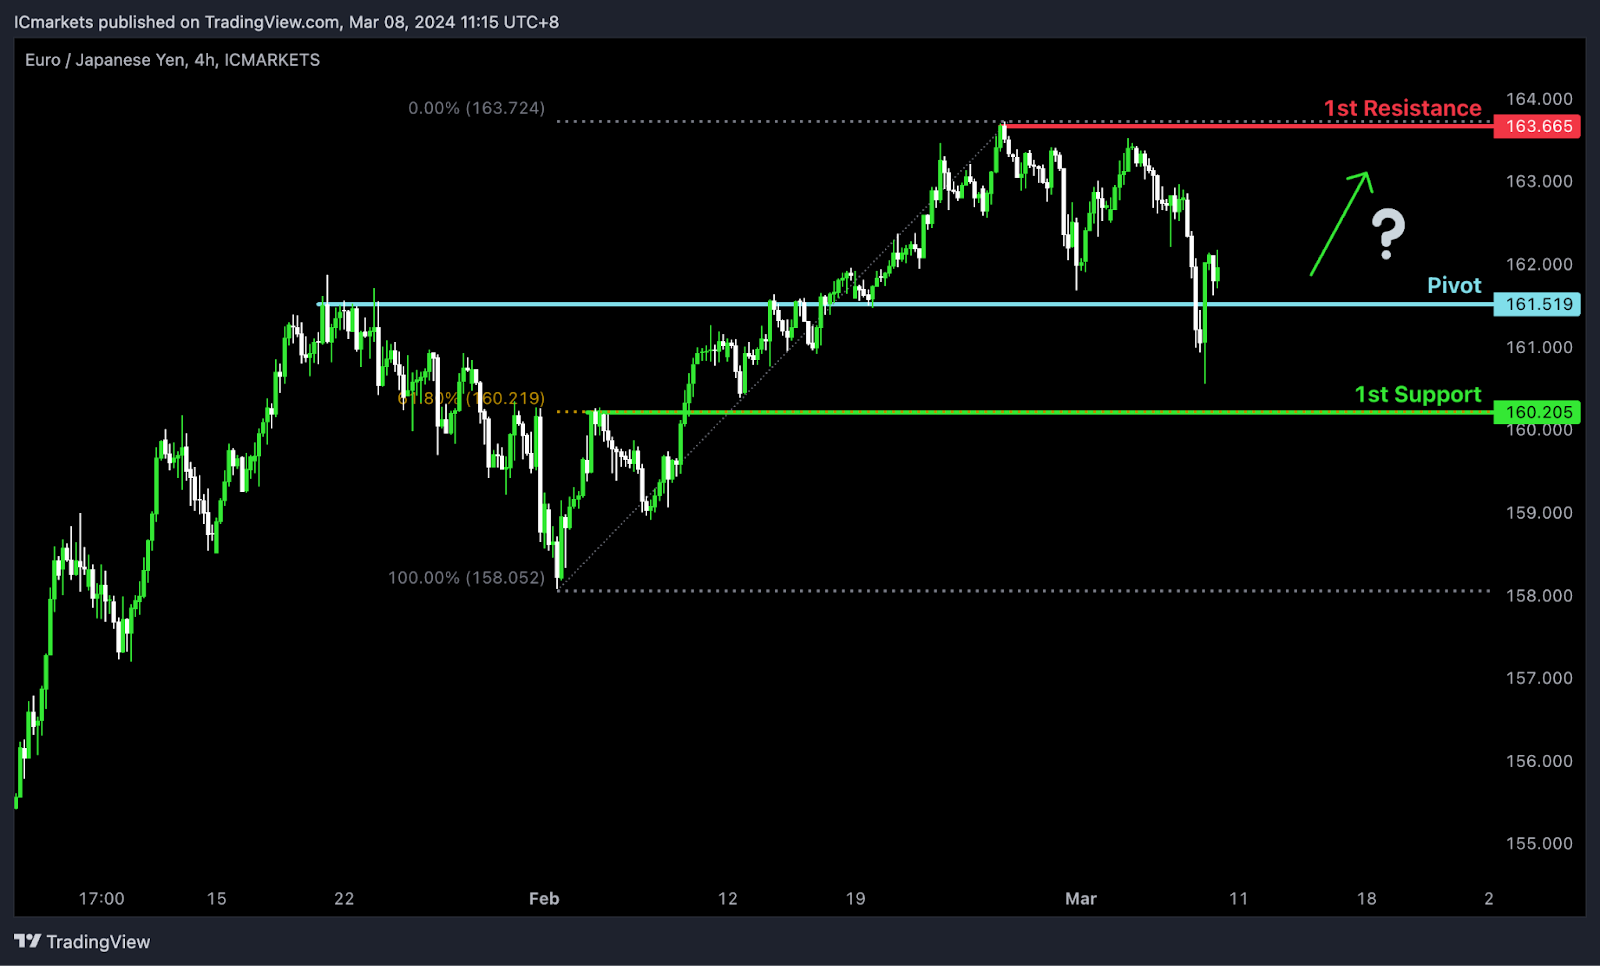
The EUR/JPY chart currently demonstrates bullish momentum, suggesting a potential continuation of the upward trend. Several key levels support the possibility of a bullish movement towards the 1st resistance.
The Pivot level at 161.519 serves as an overlap support, indicating a significant historical level where buying interest could emerge. Additionally, the 1st support at 160.205 aligns with a pullback support and coincides with the 61.80% Fibonacci Retracement level, further reinforcing its significance as a potential area of support.
On the resistance side, the 1st resistance level at 163.665 is identified as a swing high resistance, suggesting a historical barrier to upward movement.
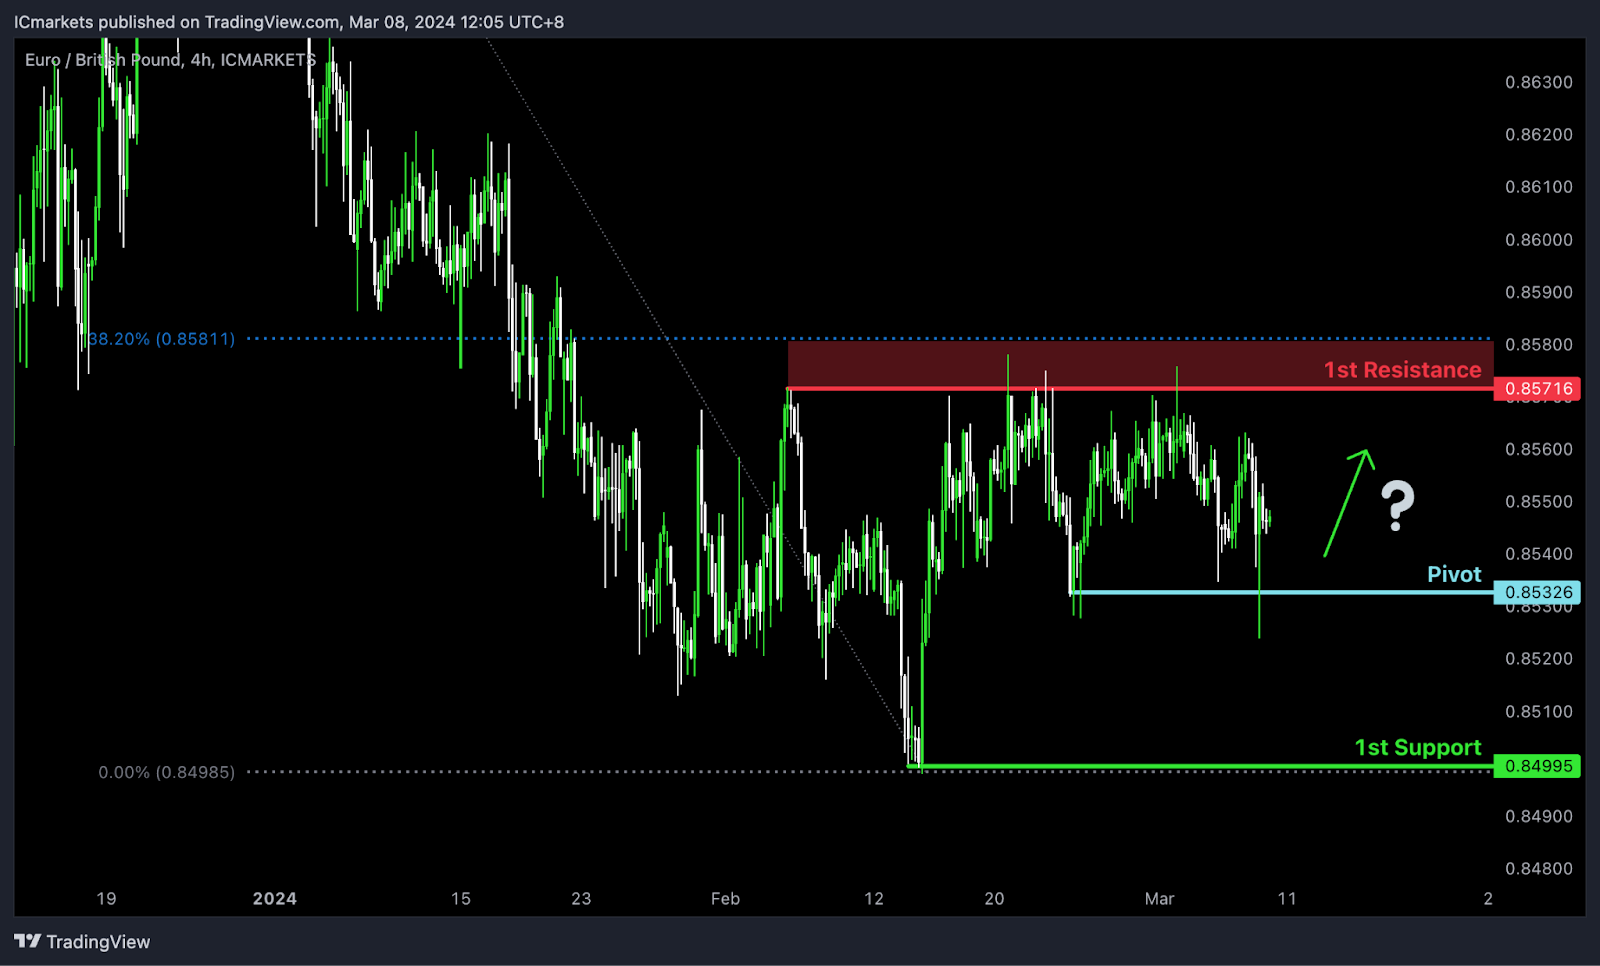
EUR/GBP:
The EUR/GBP chart currently demonstrates neutral momentum, suggesting a potential fluctuation between the 1st resistance and 1st support levels. Key levels support this scenario.
The Pivot at 0.85326 serves as a swing low support, indicating historical buying interest. Another swing low support is observed at 0.89445, suggesting significant historical support.
On the resistance side, the 1st resistance at 0.85716 is identified as a swing high resistance and coincides with the 38.20% Fibonacci Retracement level, indicating a historical barrier to upward movement.
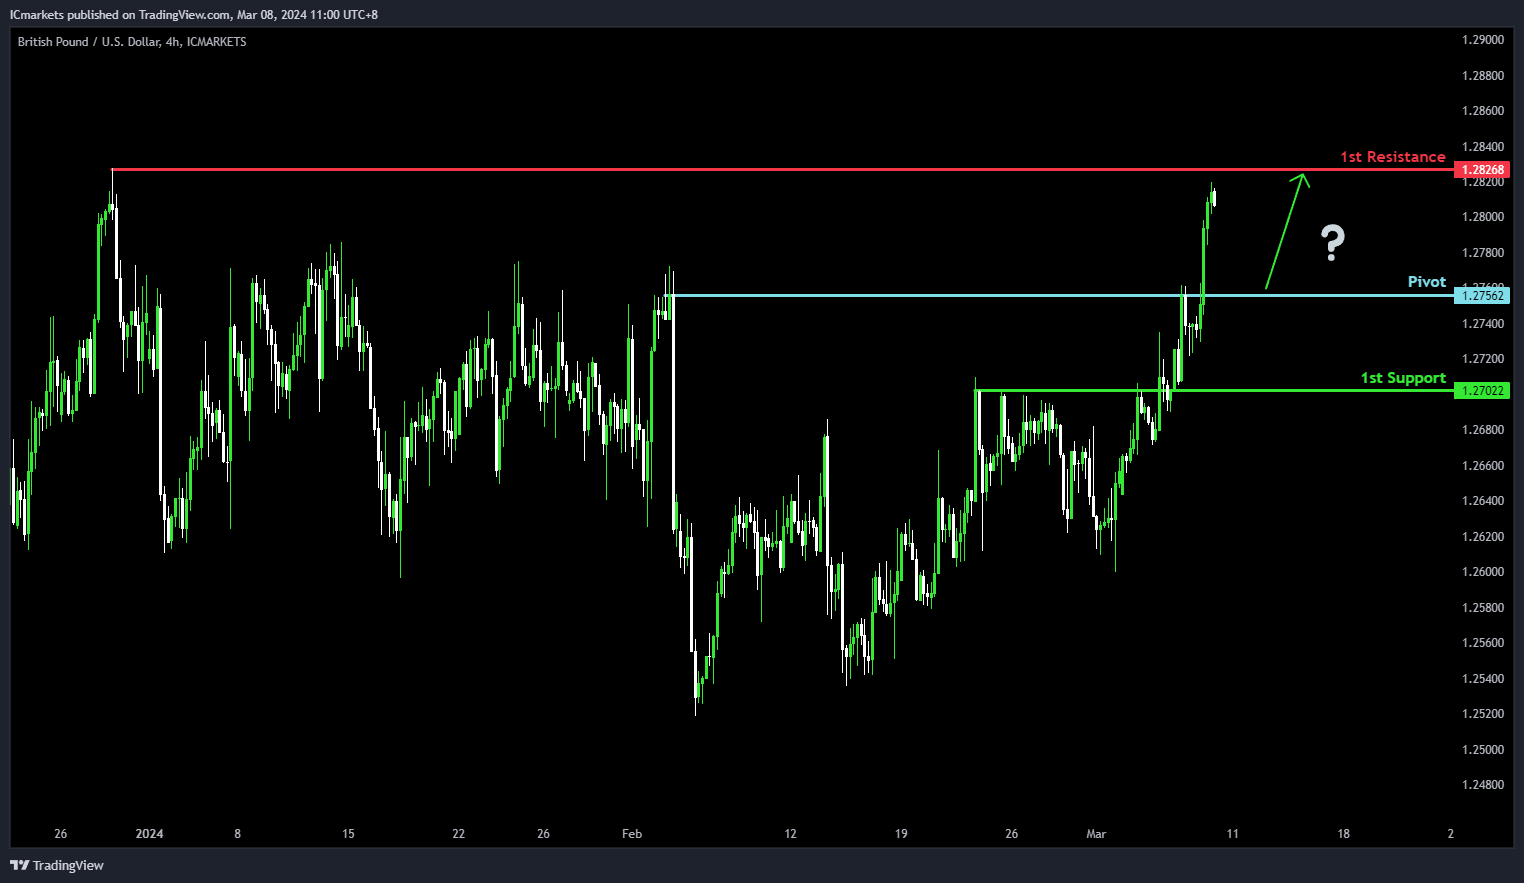
GBP/USD:
The GBP/USD chart currently shows bullish momentum, suggesting a potential scenario where the price could experience a bullish bounce off the pivot and move towards the 1st resistance.
The pivot level at 1.2756 is identified as a pullback support, indicating its significance as a level where buyers may step in to support the price, potentially leading to a bullish bounce. Additionally, the 1st support at 1.2702 is noted as an overlap support, further reinforcing its importance as a level where buying interest has historically emerged.
On the resistance side, the 1st resistance level at 1.2826 is identified as a swing high resistance, suggesting its historical significance as a level where selling pressure may increase, potentially limiting further upward movement.
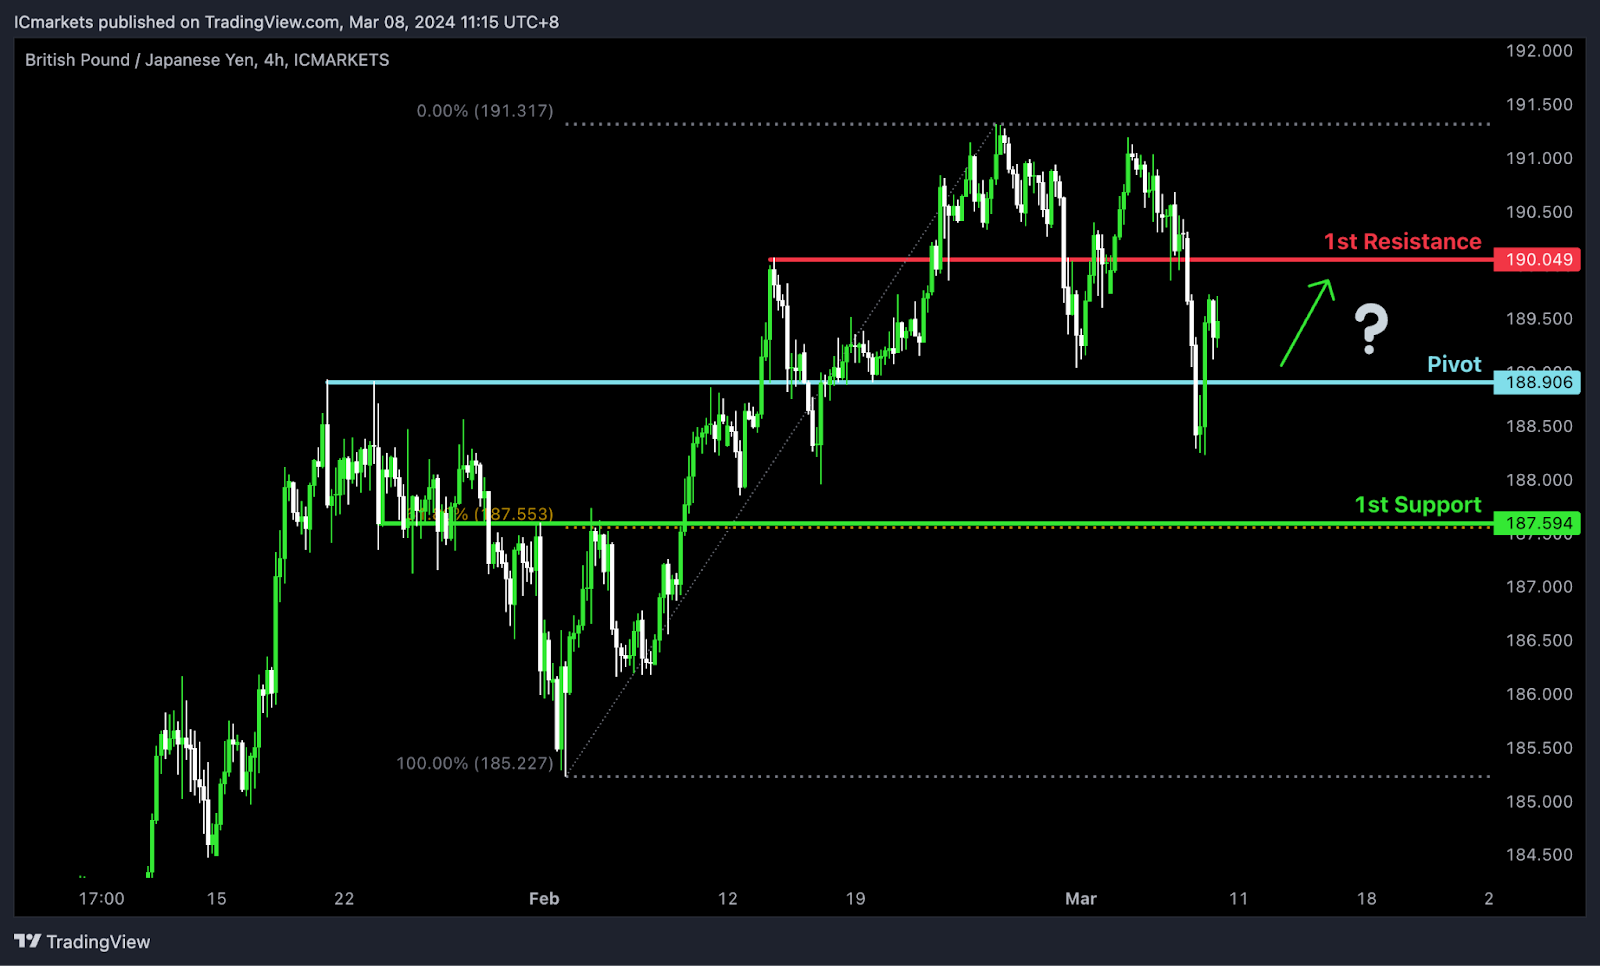
GBP/JPY:
The GBP/JPY chart currently exhibits bullish momentum, indicating a potential continuation of the upward trend. Several key levels support the possibility of a bullish movement towards the 1st resistance.
The Pivot level at 188.906 serves as a pullback support, suggesting a significant historical level where buying interest may emerge. Furthermore, the 1st support at 187.594 aligns with an overlap support and the 61.80% Fibonacci Retracement, reinforcing its significance as a potential area of support.
On the resistance side, the 1st resistance level at 190.049 is identified as a pullback resistance, indicating a historical barrier to further upward movement.
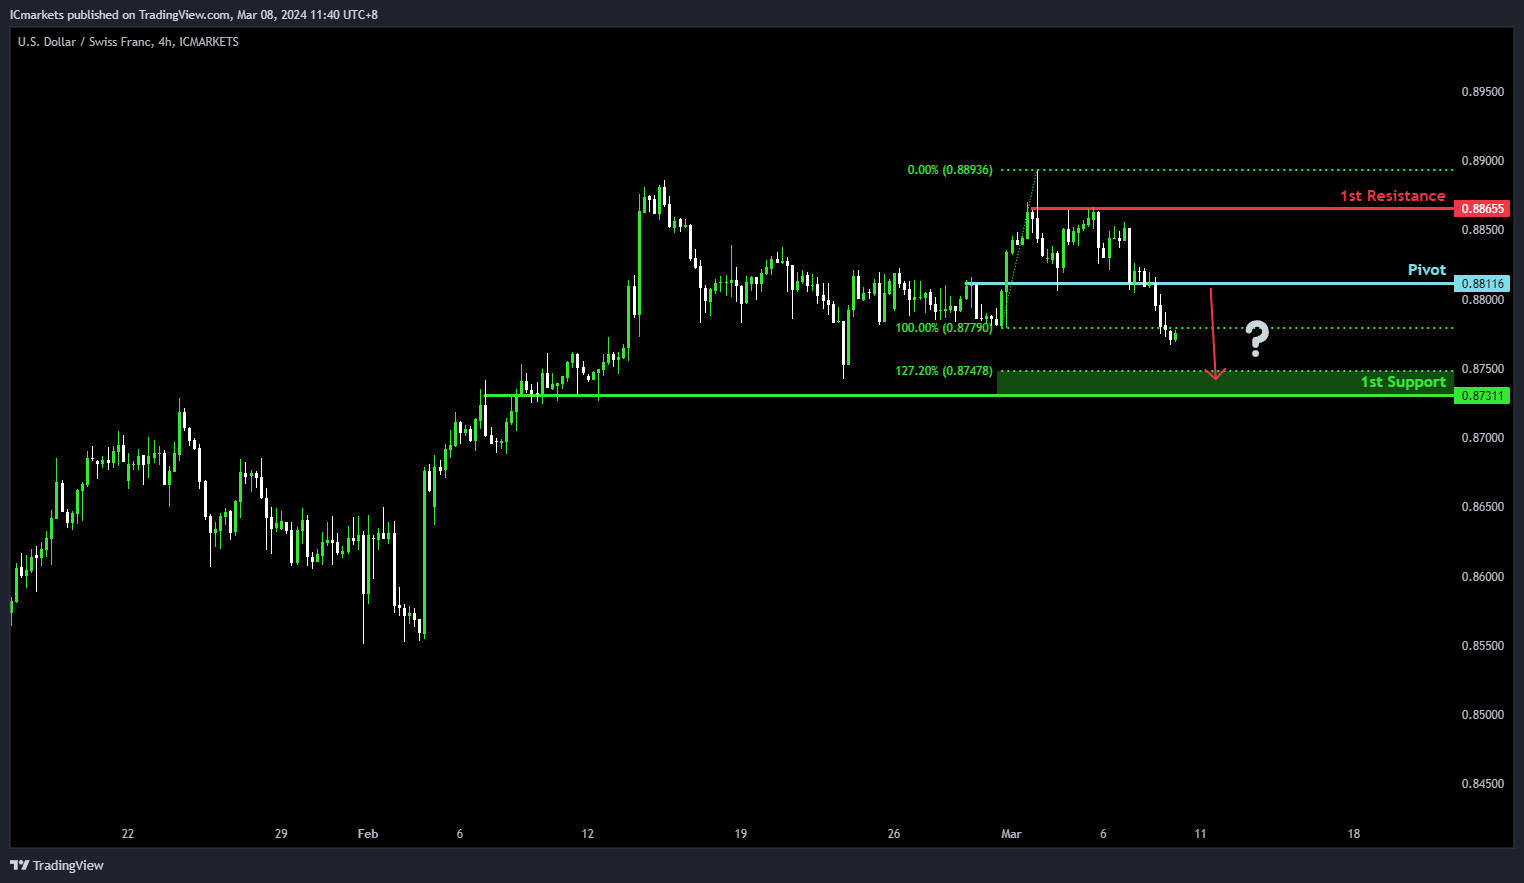
USD/CHF:
The USD/CHF chart currently exhibits bearish momentum, implying a potential scenario where the price might encounter a bearish reaction as it reaches the pivot level and subsequently declines towards the 1st support.
The pivot point at 0.8811 is recognized as a significant area of pullback resistance, accentuated by the presence of the 127.20% Fibonacci Extension. This indicates a level where selling pressure could escalate, potentially triggering a bearish response in the price. Moreover, the 1st support level at 0.8731 is identified as an overlap support, underscoring its historical role as a level where buying interest has traditionally emerged to provide support.
Conversely, the 1st resistance level at 0.8865 is noted as a multi-swing high resistance. This highlights its historical importance as a level where selling pressure has been notable, potentially constraining further upward movement in the price.
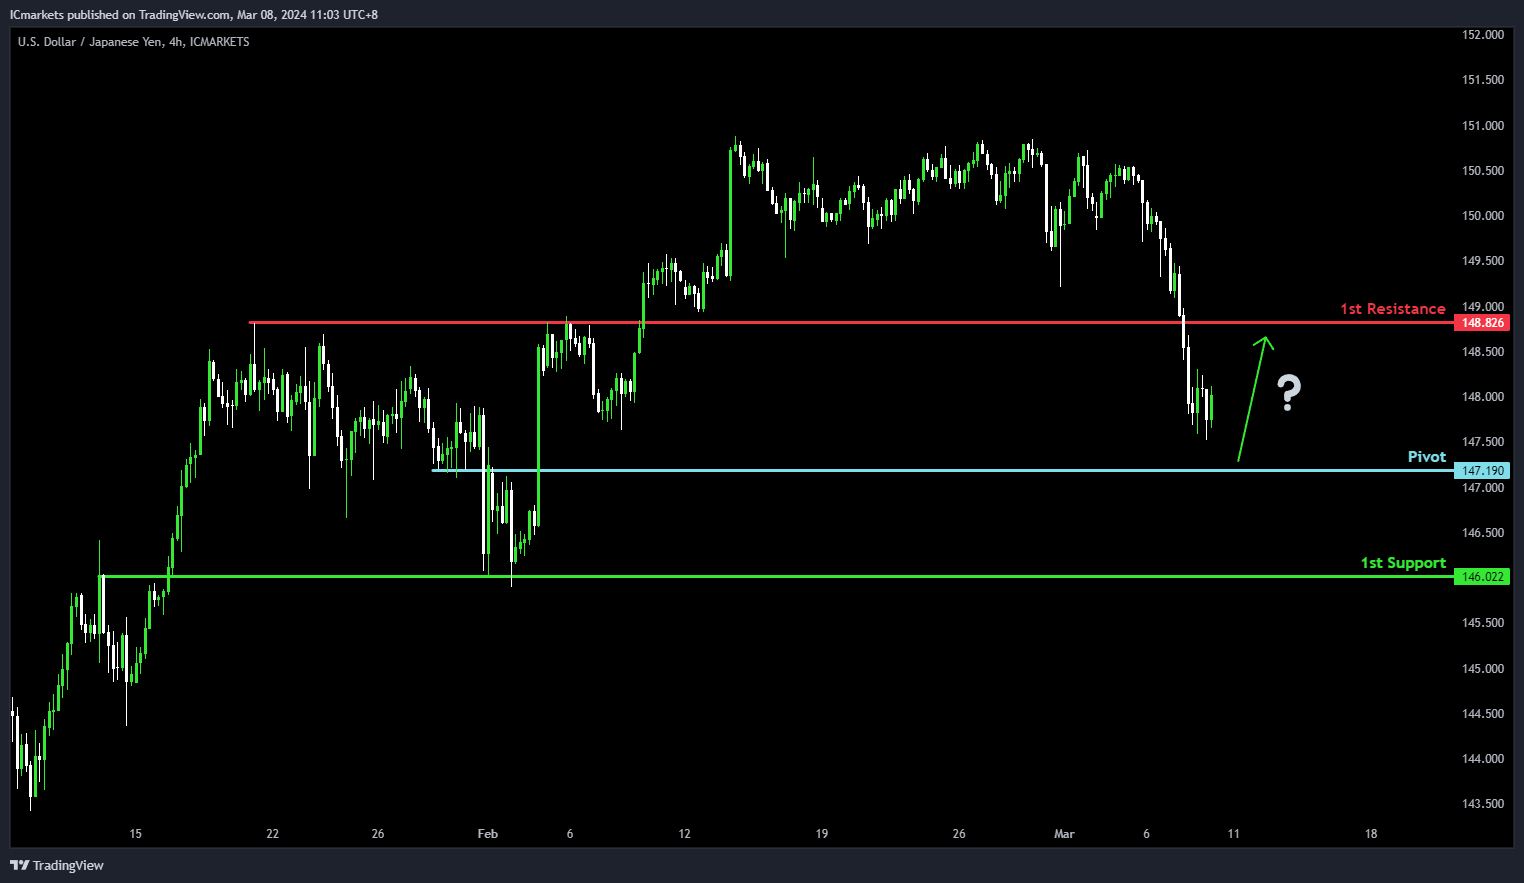
USD/JPY:
The USD/JPY chart currently displays bullish momentum, indicating a possible scenario where the price may undergo a bullish rebound upon reaching the pivot level and subsequently advance towards the 1st resistance.
The pivot point at 147.19 is recognized as a significant level of pullback support, suggesting its potential role as a level where buyers could intervene to support the price, facilitating a bullish rebound. Additionally, the 1st support level at 146.02 is identified as an overlap support, further bolstering its significance as a historical area where buying interest has been notable.
On the resistance side, the 1st resistance level at 148.82 is noted as a pullback resistance. This suggests its historical importance as a level where selling pressure may intensify, potentially limiting further upward movement in the price.
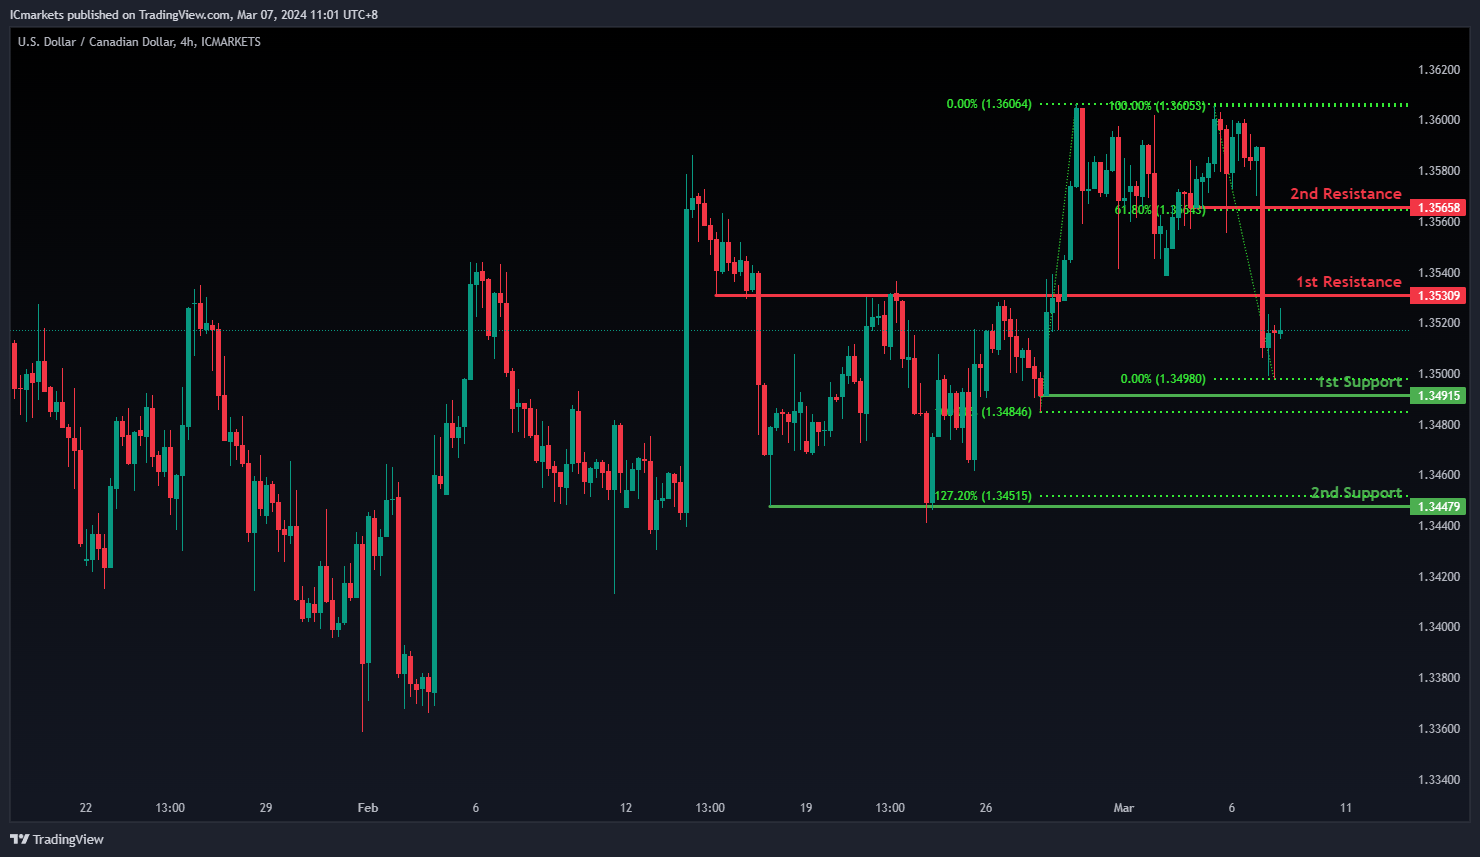
USD/CAD:
The USD/CAD chart currently exhibits an overall bearish momentum. In this context, there is a potential scenario for price to fall towards the 1st support.
The 1st support level at 1.3491 is identified as a pullback support. Further below, the 2nd support level at 1.3447 is also marked as a pullback support that aligns close to the 127.20% Fibonacci Extension level, reinforcing its significance as a key support level.
To the upside, the 1st resistance level at 1.3530 is identified as an overlap resistance. Higher up, the 2nd resistance level at 1.3565 is marked as a pullback resistance that aligns with the 61.80% Fibonacci retracement level, further highlighting its importance as a potential resistance zone.
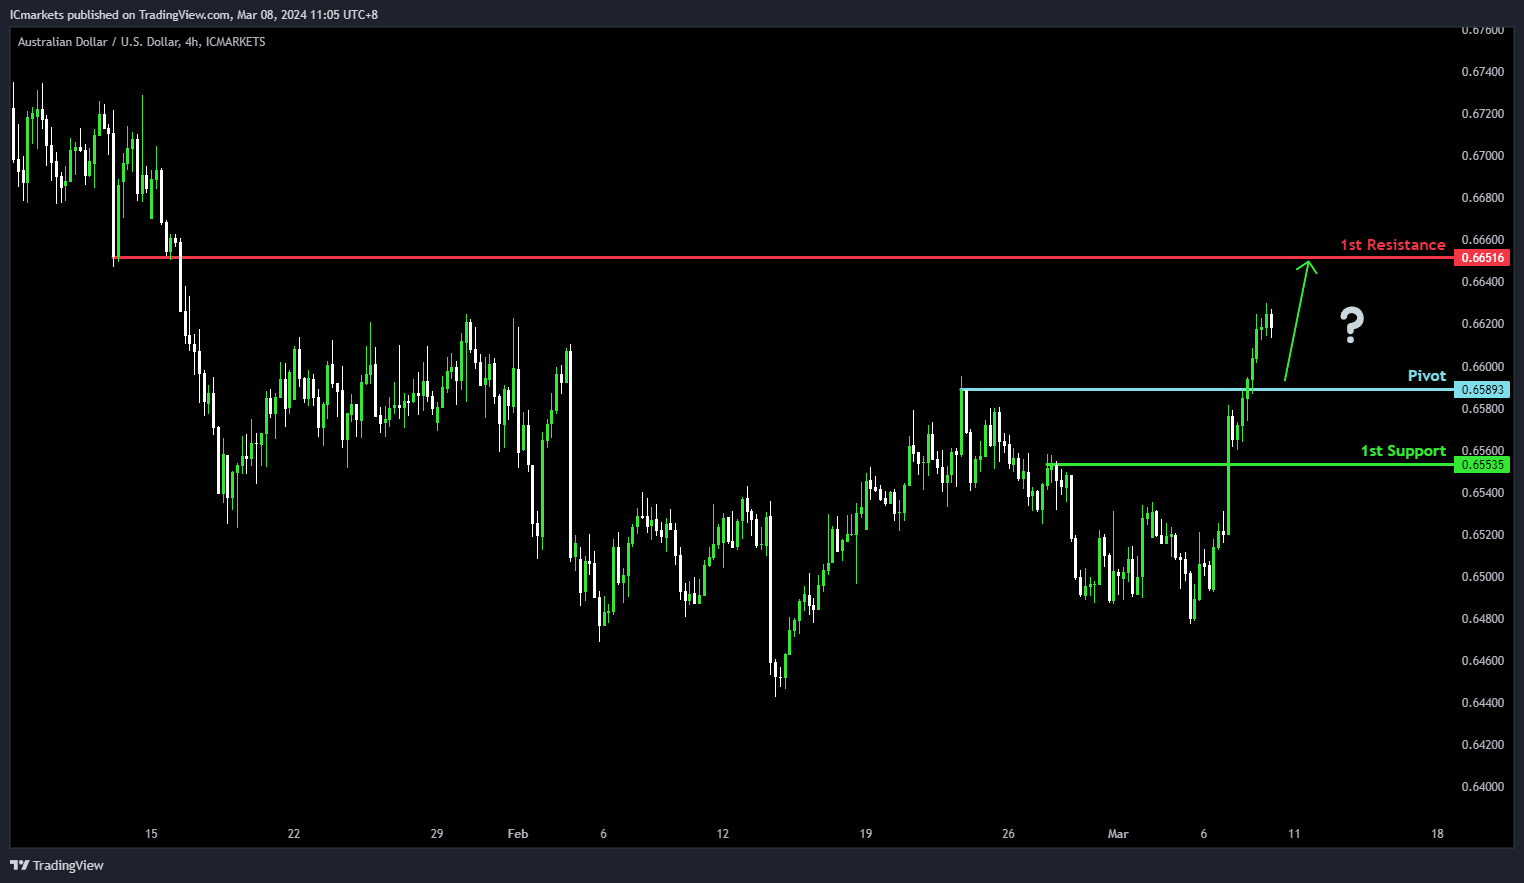
AUD/USD:
The AUD/USD chart currently demonstrates bullish momentum, suggesting a potential scenario where the price could experience a bullish rebound upon reaching the pivot level and subsequently advance towards the 1st resistance.
The pivot point at 0.6589 is identified as a significant level of pullback support, indicating its potential role as a level where buyers may intervene to support the price, potentially leading to a bullish bounce. Additionally, the 1st support level at 0.6553 is recognized as a pullback support, further reinforcing its significance as a historical area where buying interest has been notable.
On the resistance side, the 1st resistance level at 0.6651 is noted as a pullback resistance area. This level suggests a potential barrier where selling pressure may increase, potentially limiting further upward movement in the price.
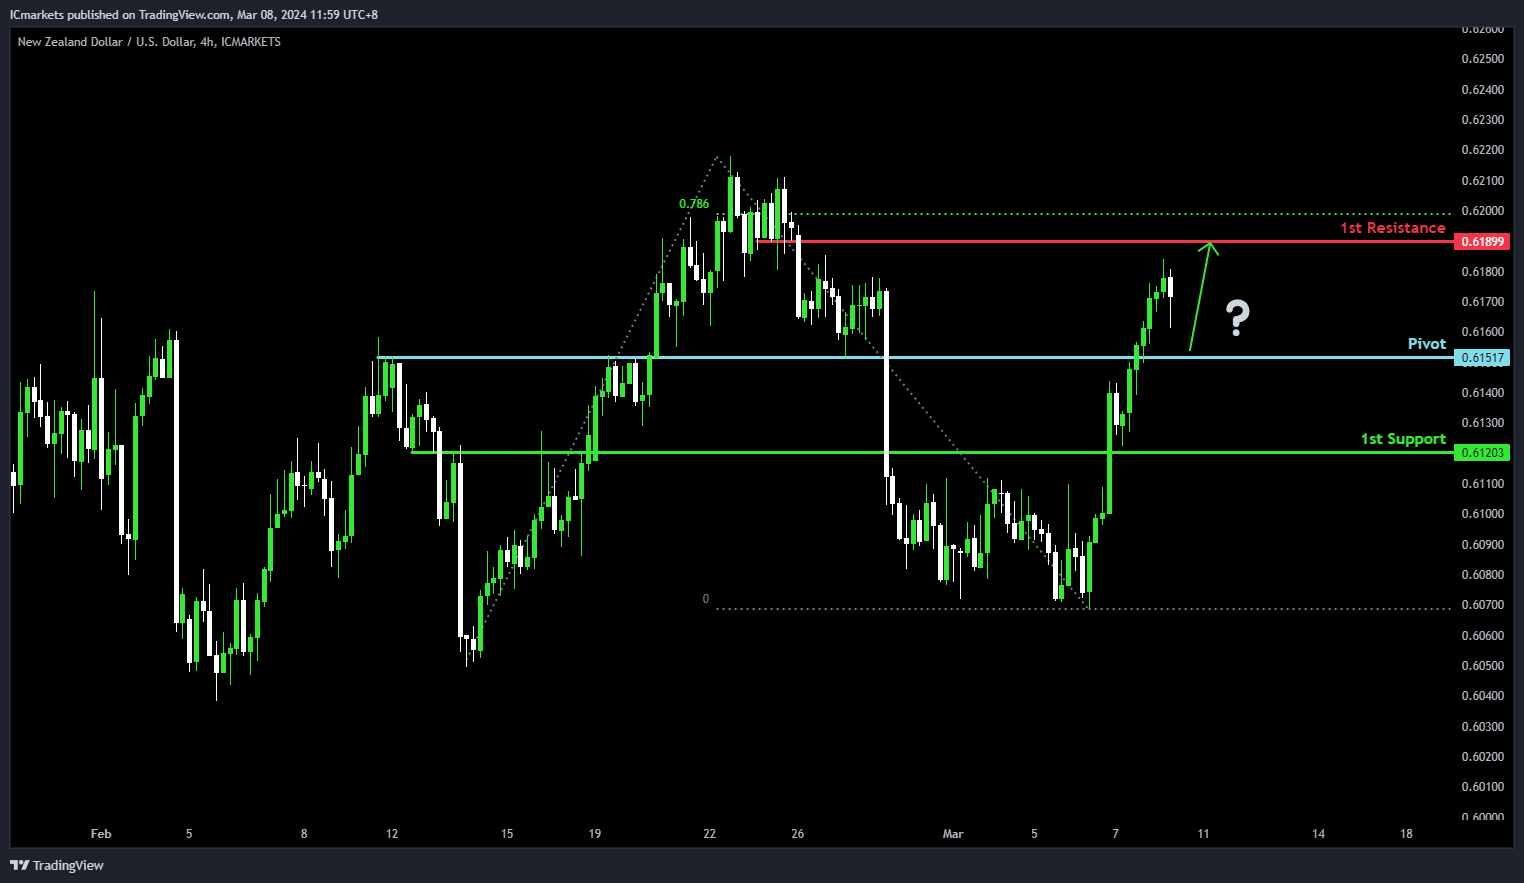
NZD/USD
The NZD/USD chart currently shows bullish momentum, indicating a potential scenario where the price could experience a bullish rebound upon reaching the pivot level and subsequently move towards the 1st resistance.
The pivot point at 0.6151 is identified as a significant level of pullback support, suggesting its potential role as a level where buyers might intervene to support the price, potentially leading to a bullish bounce. Additionally, the 1st support level at 0.6120 is recognized as an overlap support, further reinforcing its significance as a historical area where buying interest has been observed.
On the resistance side, the 1st resistance level at 0.6189 is noted as an overlap resistance area. This level may act as a barrier where selling pressure could increase, potentially limiting further upward movement in the price.
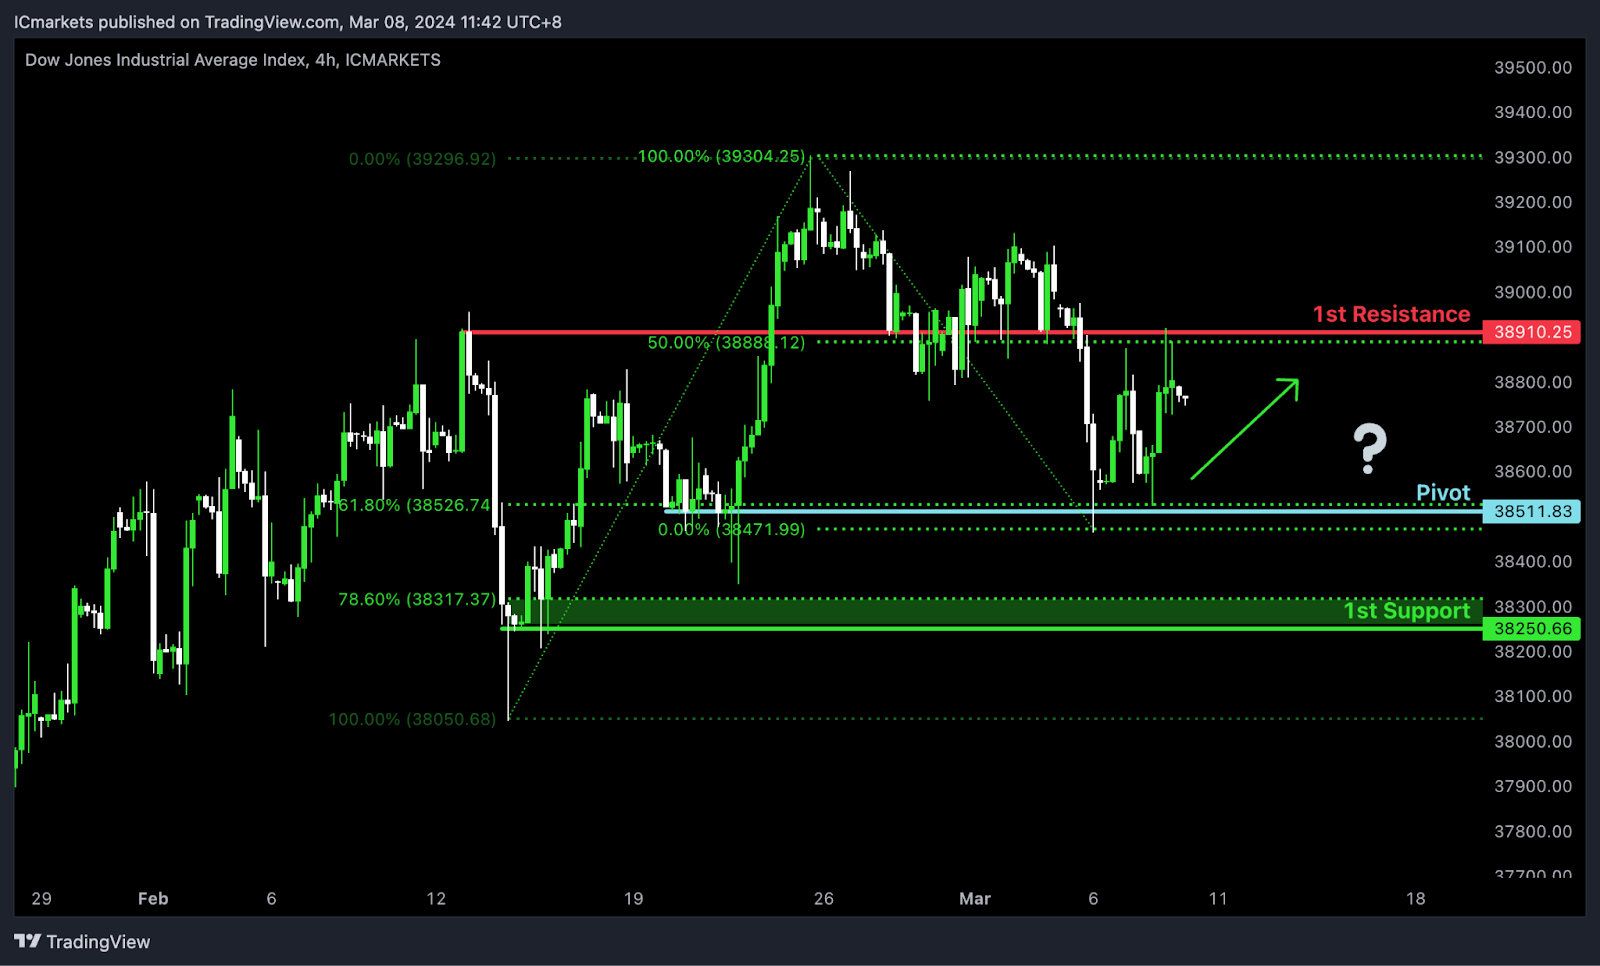
DJ30:
The DJ30 chart currently maintains a bullish momentum, indicating a potential continuation of the upward trend. Several key levels suggest the possibility of a bullish movement towards the 1st resistance.
The Pivot level at 38511.83 serves as a swing low support and coincides with the 61.80% Fibonacci Retracement, highlighting its significance as a historical level where buying interest could emerge. Additionally, the 1st support at 38250.66 aligns with another swing low support and the 78.60% Fibonacci Retracement, further reinforcing its importance as a potential area of support.
On the resistance side, the 1st resistance level at 38910.25 is identified as a pullback resistance, suggesting a historical barrier to further upward movement. The confluence with the 50% Fibonacci Retracement adds to its significance as a potential barrier.
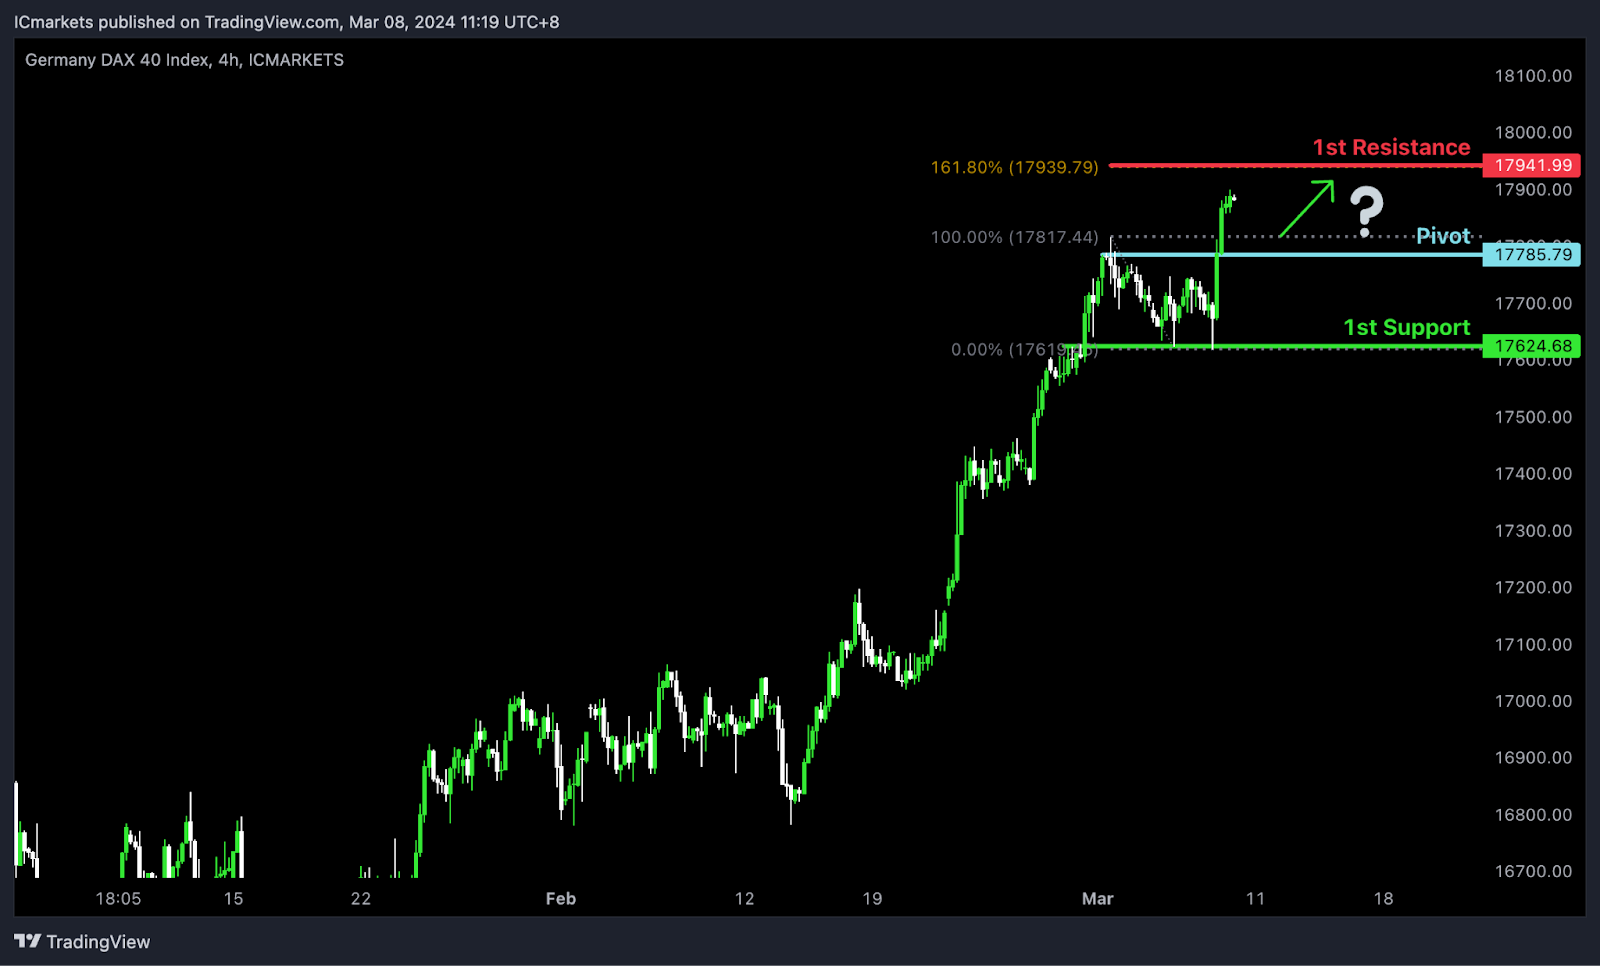
GER40:
The GER40 chart currently exhibits a bullish momentum, indicating a potential continuation of the upward trend. Several factors contribute to this momentum, supporting the possibility of a bullish movement towards the 1st resistance.
The Pivot level at 17785.78 serves as a pullback support, suggesting a significant historical level where buying interest might emerge. Furthermore, the 1st support at 17624.68 aligns with a swing low support, reinforcing its importance as a potential area of support.
On the resistance side, the 1st resistance level at 17941.99 corresponds to the 161.80% Fibonacci Extension, indicating a potential target for bullish continuation.
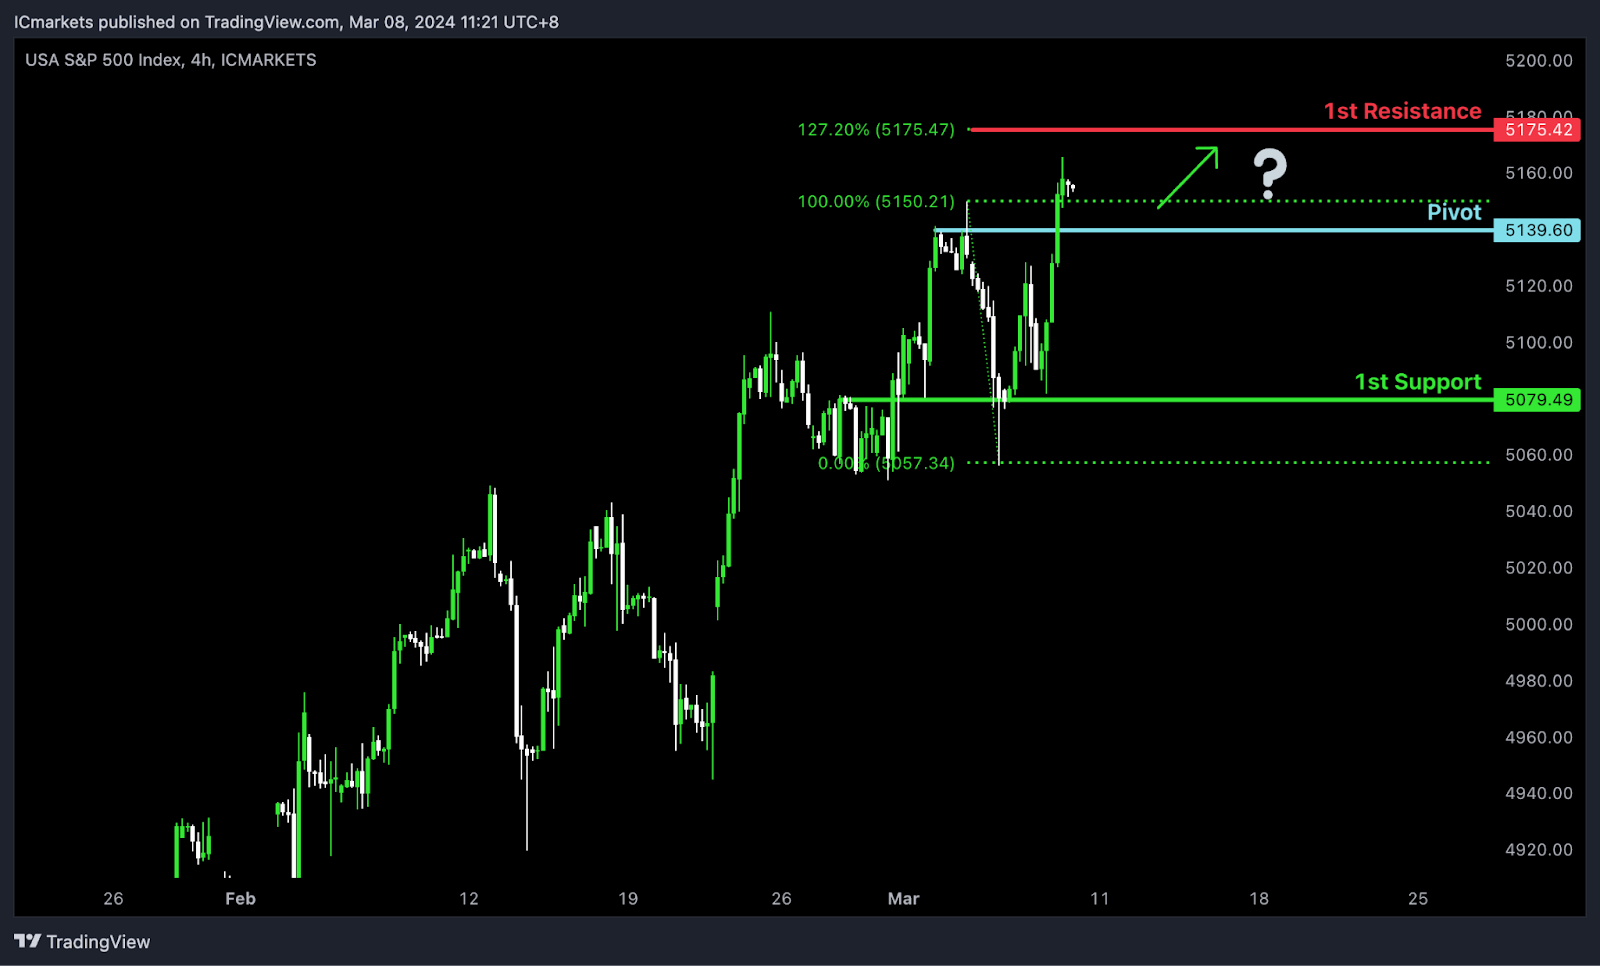
US500:
The US500 chart currently indicates bullish momentum, suggesting a potential continuation of the upward trend. There are indications that price might experience a bullish bounce off the 1st support level, heading towards the 1st resistance.
The Pivot level at 5139.60 serves as a pullback support, indicating a significant historical level where buying interest could emerge. Additionally, the 1st support at 5079.49 aligns with an overlap support, further reinforcing its significance as a potential area of support.
On the resistance side, the 1st resistance level at 5175.42 corresponds to the 127.20% Fibonacci Extension, suggesting a potential target for bullish movement.
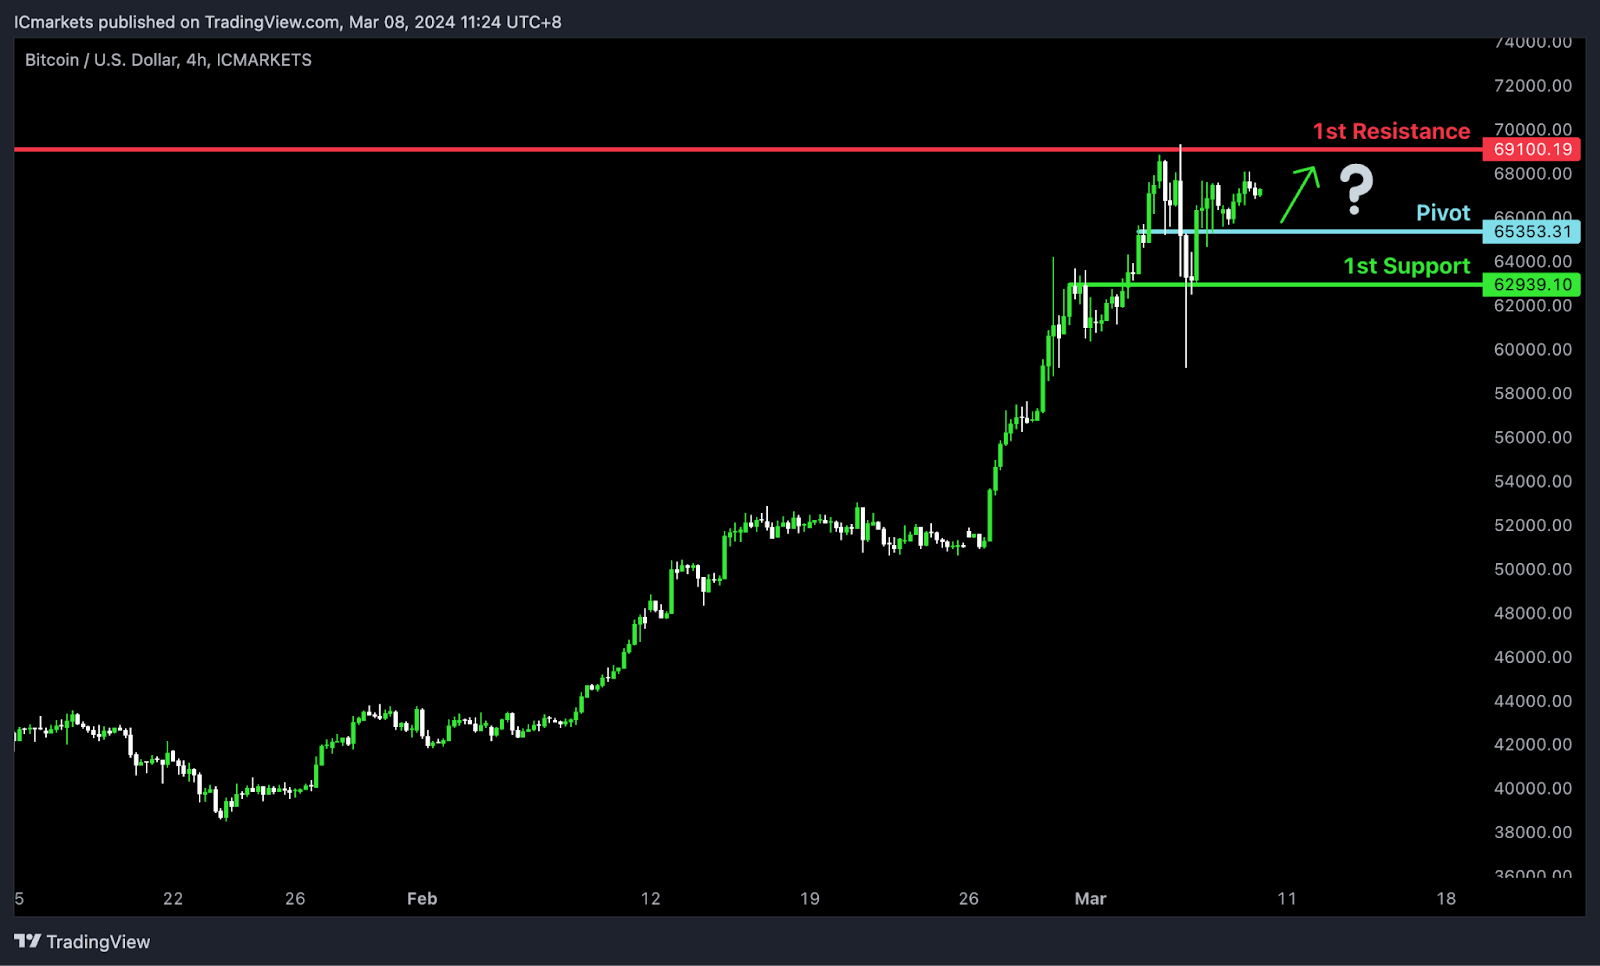
BTC/USD:
The BTC/USD chart currently demonstrates bullish momentum, suggesting a potential continuation of the upward trend. There are indications that price could potentially make a bullish continuation towards the 1st resistance level.
The Pivot level at 65353.31 serves as a pullback support, indicating a significant historical level where buying interest may emerge. Additionally, the 1st support at 62939.10 aligns with an overlap support, further reinforcing its significance as a potential area of support.
On the resistance side, the 1st resistance level at 69100.19 is identified as a swing high resistance, suggesting a historical barrier to upward movement.
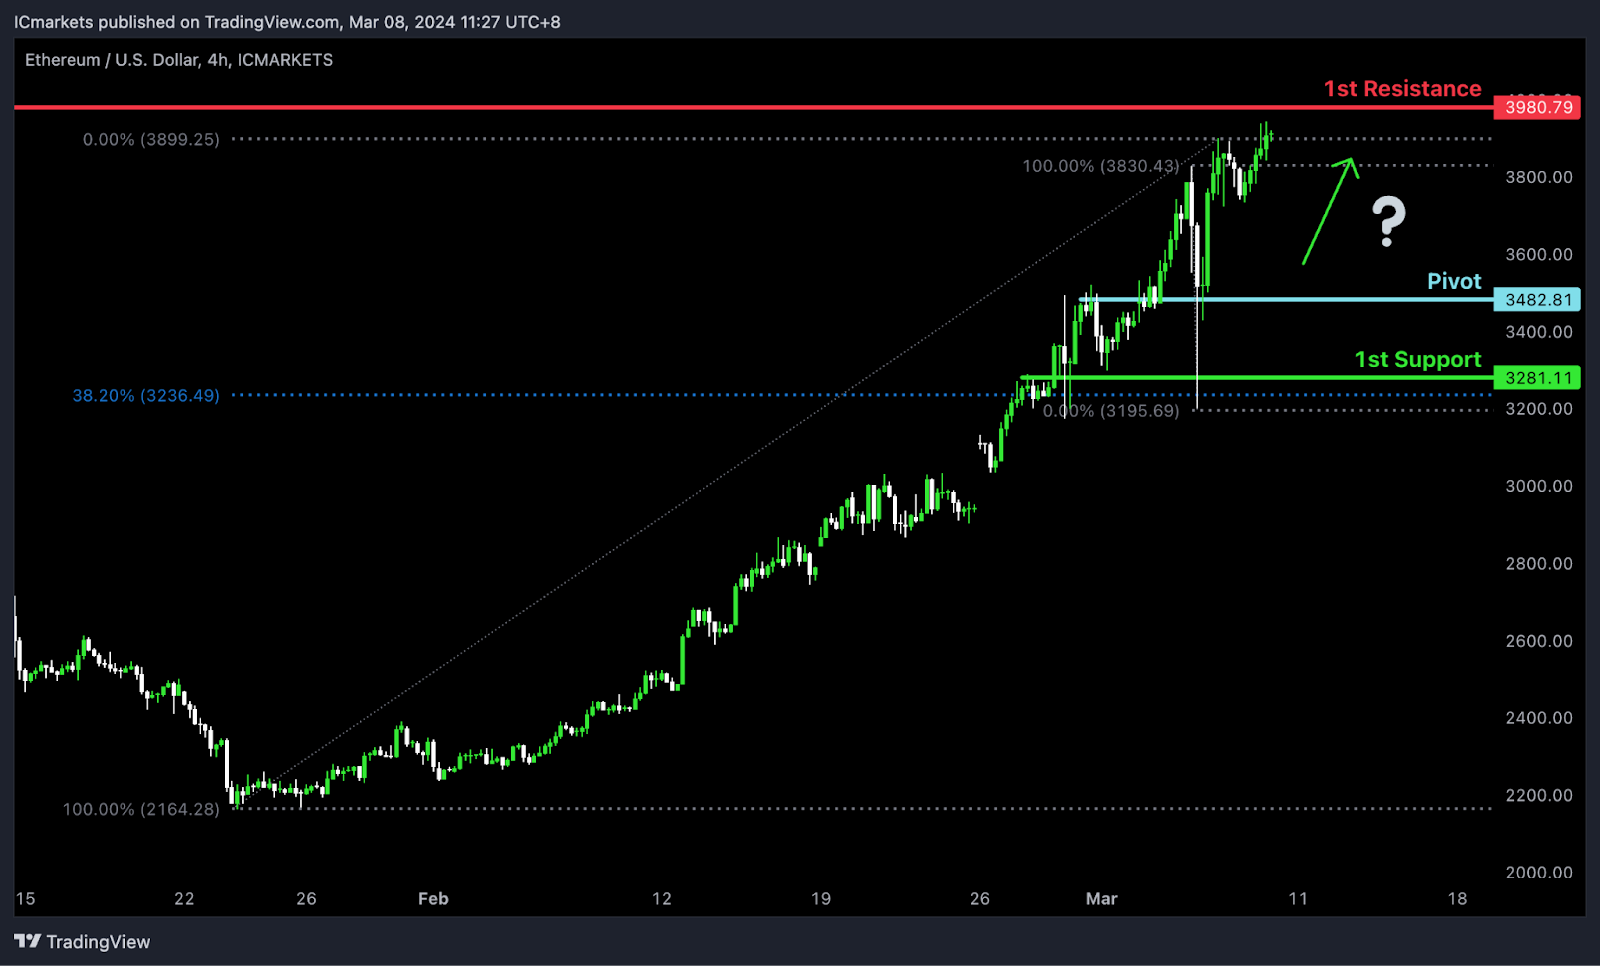
ETH/USD:
The ETH/USD chart currently exhibits bullish momentum, with several factors contributing to this outlook. There are indications that price could potentially make a bullish continuation towards the 1st resistance level.
The Pivot level at 3482.81 serves as an overlap support, indicating a significant historical level where buying interest is likely present. Additionally, the 1st support at 3281.11 aligns with another overlap support and coincides with the 38.20% Fibonacci Retracement level, further reinforcing its significance as a potential area of support.
On the resistance side, the 1st resistance level at 3980.79 is identified as an overlap resistance, suggesting a historical barrier to upward movement.
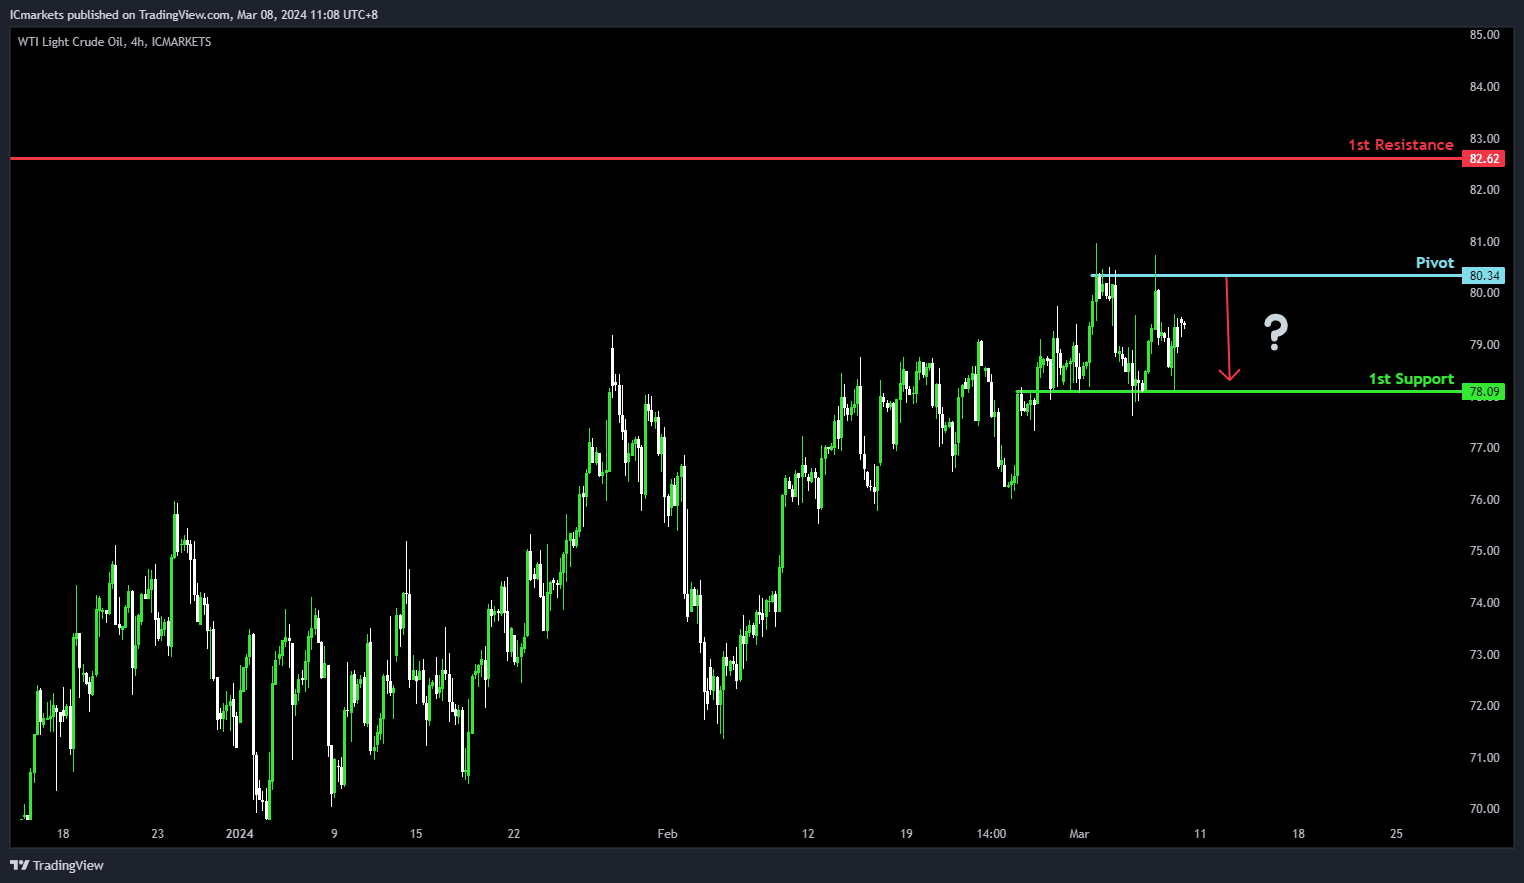
WTI/USD:
The WTI (West Texas Intermediate) chart currently demonstrates bearish momentum, suggesting a possible scenario where the price might experience a bearish reaction upon reaching the pivot level and subsequently decline towards the 1st support.
The pivot point at 80.34 is recognized as a significant level of multi-swing high resistance. This suggests its importance as a potential barrier where selling pressure may intensify, potentially leading to a bearish reaction in the price.
On the downside, the 1st support level at 78.09 is identified as an overlap support, indicating its historical significance as a level where buying interest has emerged, potentially offering support for the price during a decline.
Conversely, the 1st resistance level at 82.62 is noted as a pullback resistance, suggesting its historical importance as a barrier where selling pressure may increase, potentially limiting upward movement in the short term.
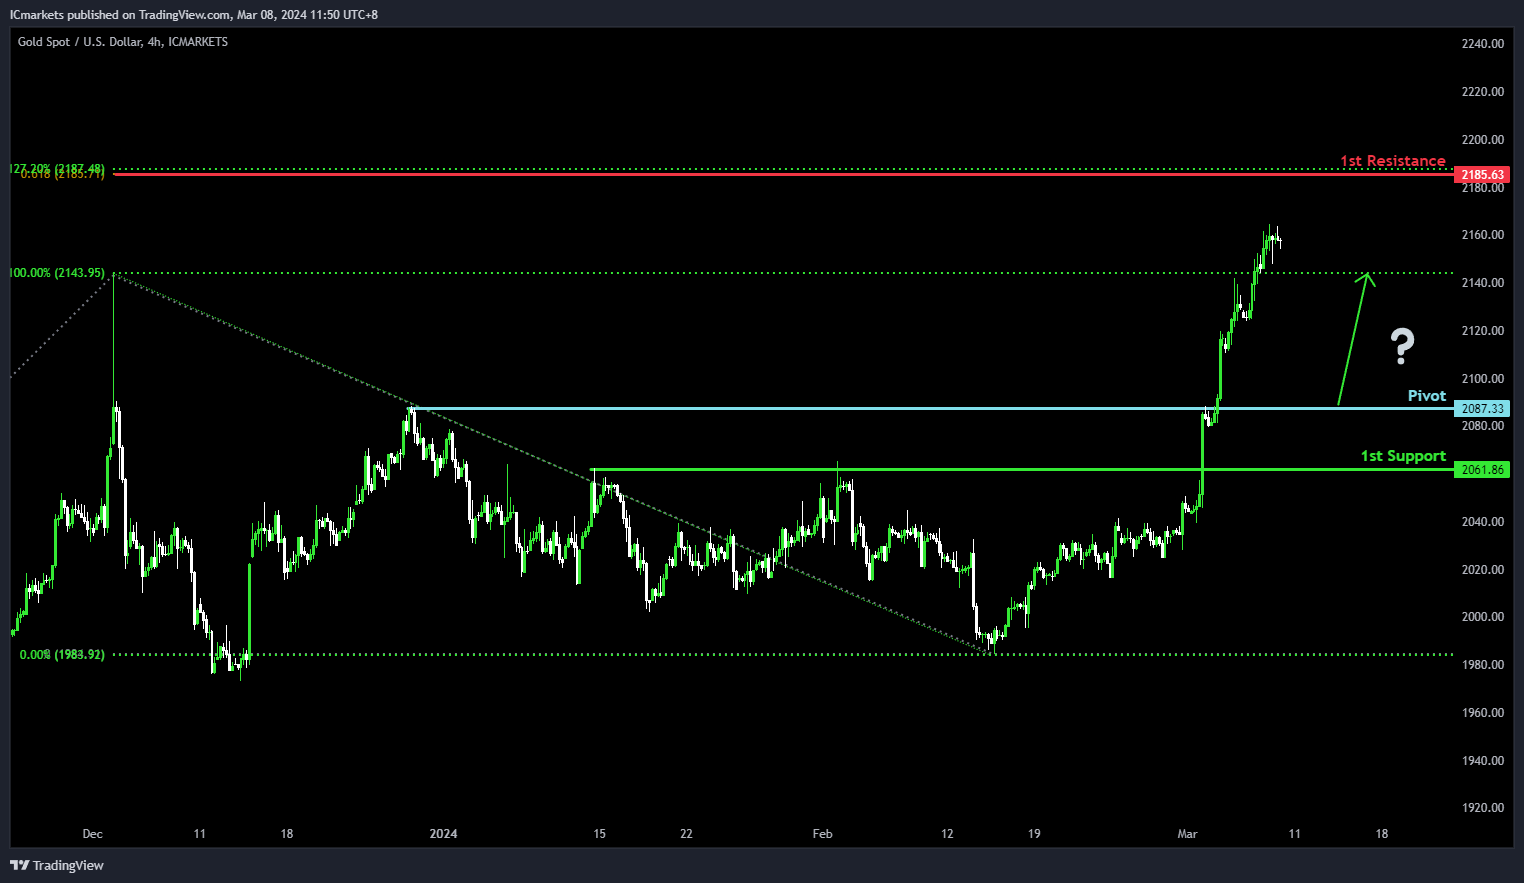
XAU/USD (GOLD):
The XAUUSD chart currently exhibits bullish momentum, suggesting a potential scenario where the price could experience a bullish rebound upon reaching the pivot level and subsequently advance towards the 1st resistance.
The pivot point at 2087.33 is identified as a significant level of pullback support, indicating its potential role as a level where buyers may intervene to support the price, potentially leading to a bullish bounce. Additionally, the 1st support level at 2061.86 is recognized as a pullback support
On the resistance side, the 1st resistance level at 2185.63 is noted as a strong resistance area. This level is reinforced by the confluence of the 127.20% Fibonacci Extension and the 61.80% Fibonacci Projection, indicating a potential barrier where selling pressure may increase, potentially limiting further upward movement in the price.
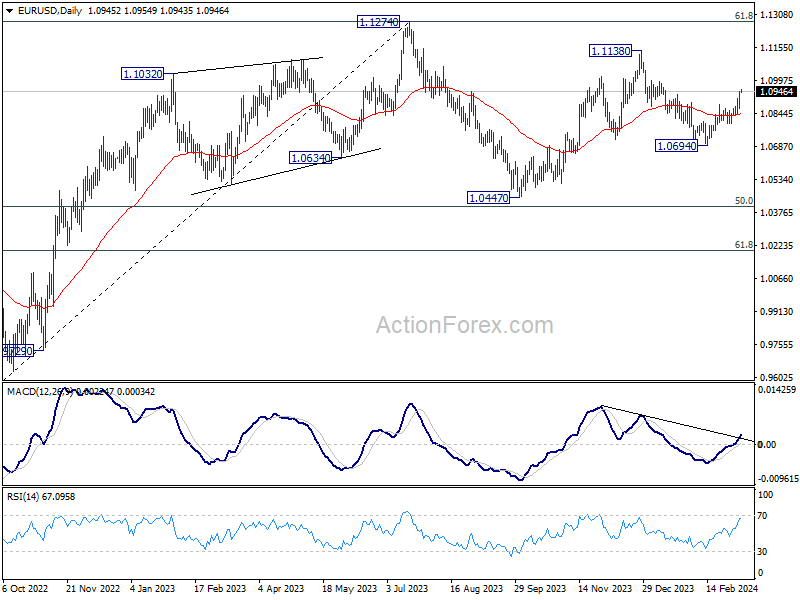
EUR/USD Daily Outlook
Daily Pivots: (S1) 1.0894; (P) 1.0922; (R1) 1.0975; More...
EUR/USD's rally from 1.0694 resumed after brief retreat and intraday bias is back on the upside. Further rally should be seen to retest 1.1138 resistance next. On the downside, below 1.0867 minor support will turn intraday bias neutral and bring consolidations first.
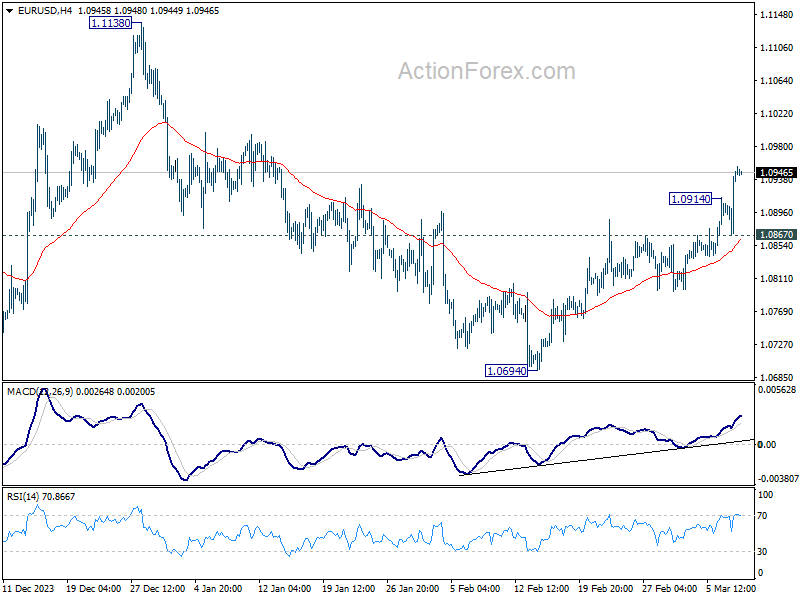
In the bigger picture, price actions from 1.1274 are viewed as a corrective pattern to rise from 0.9534 (2022 low). Rise from 1.0447 is seen as the second leg. While further rally could cannot be ruled out, upside should be limited by 1.1274 to bring the third leg of the pattern. Meanwhile, sustained break of 1.0694 support will argue that the third leg has already started for 1.0447 and possibly below.
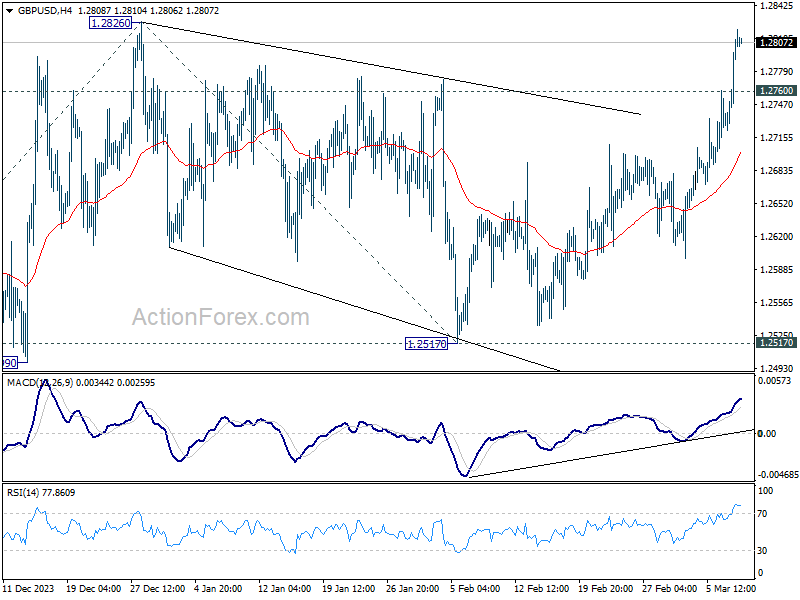
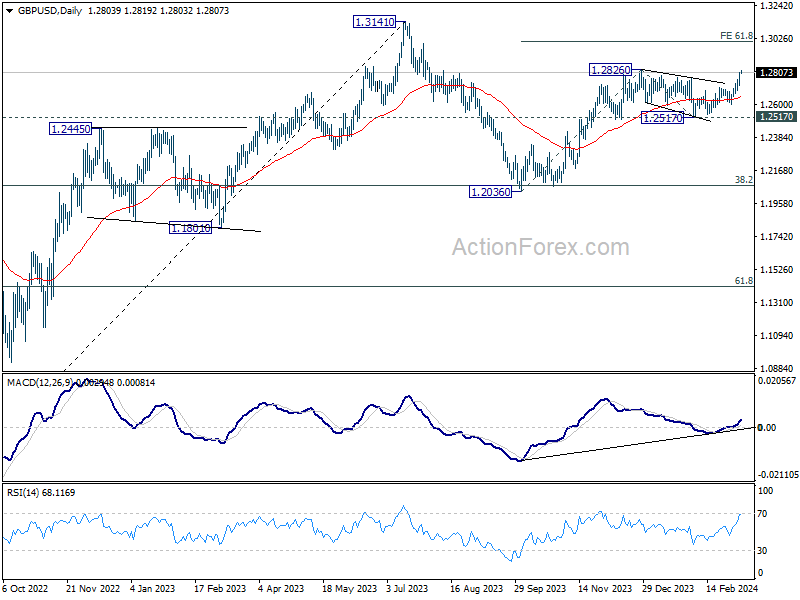
GBP/USD Daily Outlook
Daily Pivots: (S1) 1.2750; (P) 1.2781; (R1) 1.2839; More...
GBP/USD rises further to as high as 1.2819 so far today and intraday bias remains on the upside for 1.2826 resistance. Firm break there will resume whole rally from 1.2036, and target 61.8% projection of 1.2036 to 1.2826 from 1.2517 at 1.3005 next. On the downside, below 1.2760 minor support will intraday bias neutral and bring consolidations first, before staging another rally.
In the bigger picture, price actions from 1.3141 medium term top are seen as a corrective pattern to up trend from 1.0351 (2022 low). Rise from 1.2036 is seen as the second leg, which could be still in progress. But upside should be limited by 1.3141 to bring the third leg of the pattern. Meanwhile, break of 1.2517 support will argue that the third leg has already started for 38.2% retracement of 1.0351 (2022 low) to 1.3141 at 1.2075 again.
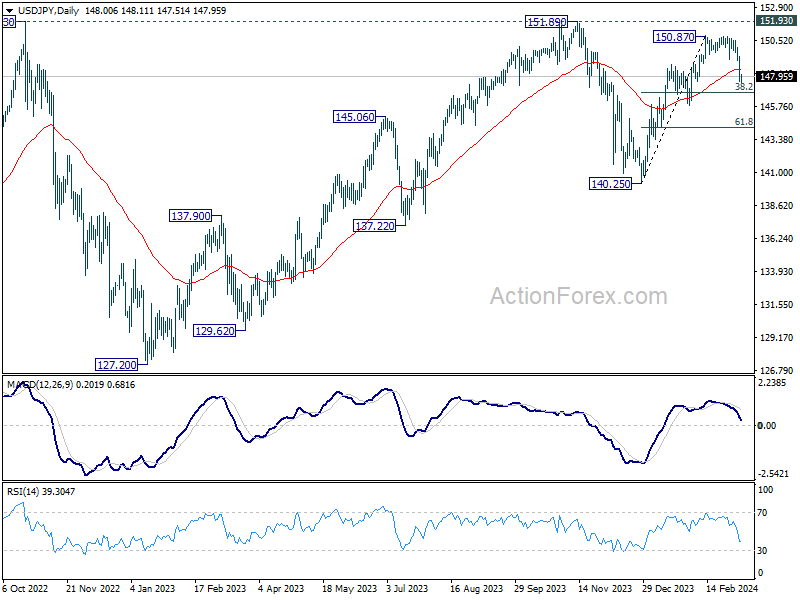
USD/JPY Daily Outlook
Daily Pivots: (S1) 147.28; (P) 148.34; (R1) 149.08; More...
Intraday bias in USD/JPY remains on the downside for 38.2% retracement of 140.25 to 150.87 at 146.81. Sustained break of there will argue that fall from 150.87 is reversing the whole rally from 140.25. In this case, deeper decline would be seen to 61.8% retracement at 144.30 and below. Nevertheless, strong support from 146.81, followed by break of 149.20 resistance, will argue that fall from 150.87 is merely a correction, which has completed already.
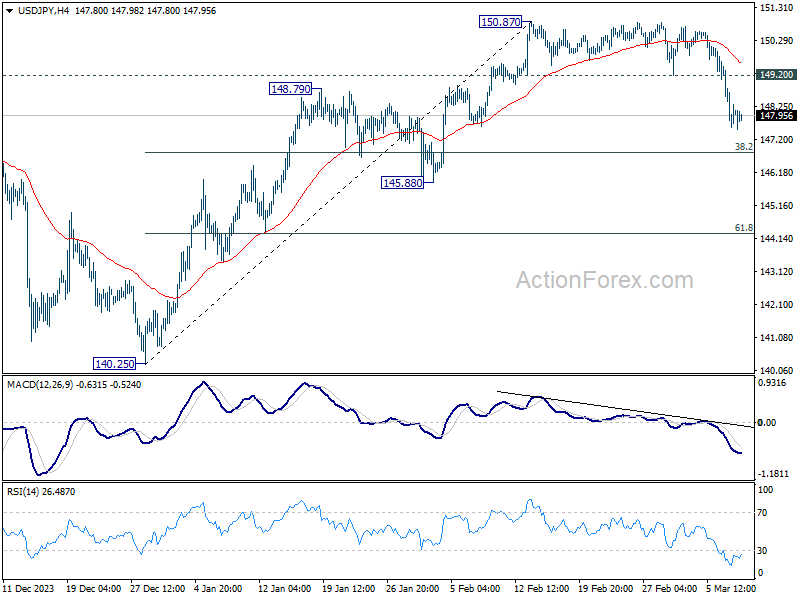
In the bigger picture, outlook is mixed up as fall from 150.87 accelerates lower. Sustained trading below 55 D EMA (now at 148.45) will open up the case that corrective pattern from 151.89 (2023 high) is extending, with fall from 150.87 as the third leg. In this case, deeper decline would be seen to 140.25 support or below. Nevertheless, strong bounce from 55 D EMA will retain near term bullishness for at least another take on 151.89.
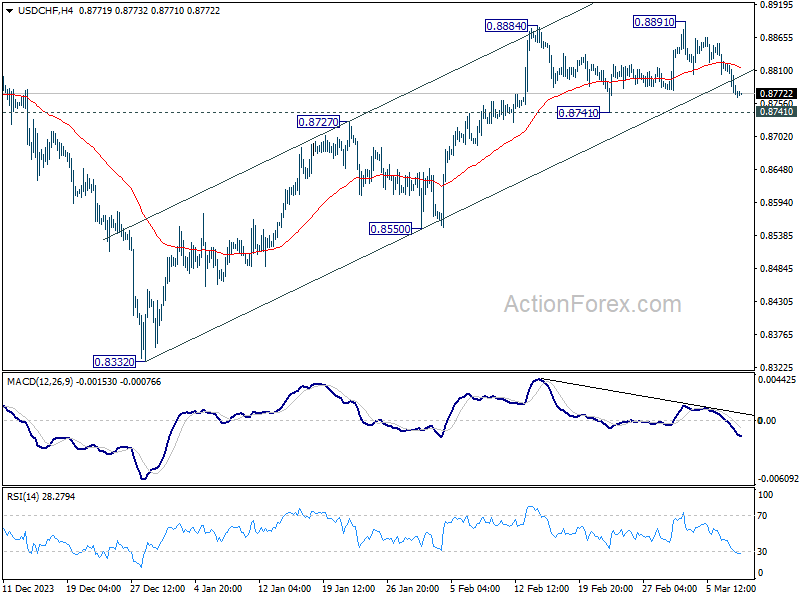
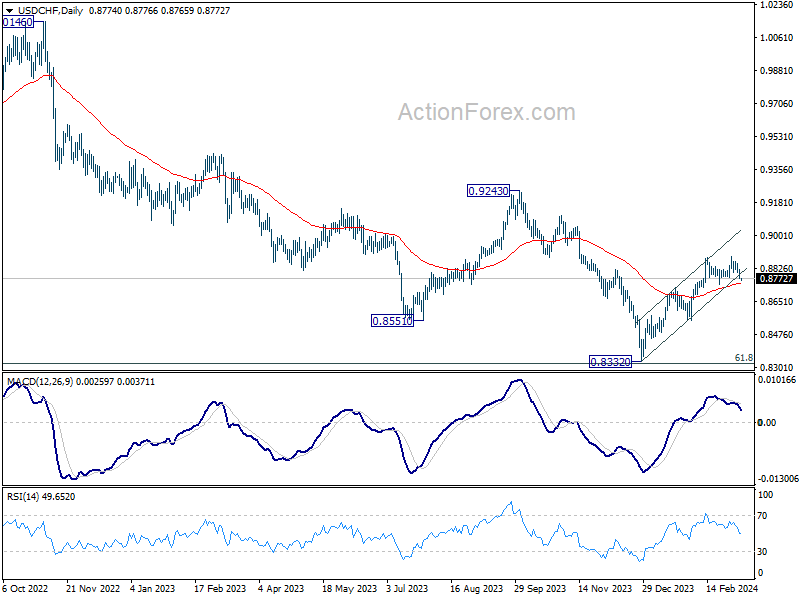
USD/CHF Daily Outlook
Daily Pivots: (S1) 0.8757; (P) 0.8793; (R1) 0.8813; More....
USD/CHF is staying in range below 0.8891 and outlook is unchanged. Intraday bias stays neutral and further rally remains in favor. On the upside, break of 0.8891 will resume the whole rebound from 0.8332 towards 0.9243 key resistance. Nevertheless, break of 0.8741 support will turn bias back to the downside for deeper pullback.
In the bigger picture, a medium term bottom should be formed at 0.8332, on bullish convergence condition in W MACD, just ahead of 0.8317 long term fibonacci support. It's still early to decide if the larger down trend from 1.0146 (2022 high) is reversing. But further rise should be seen to 0.9243 resistance even as a correction.
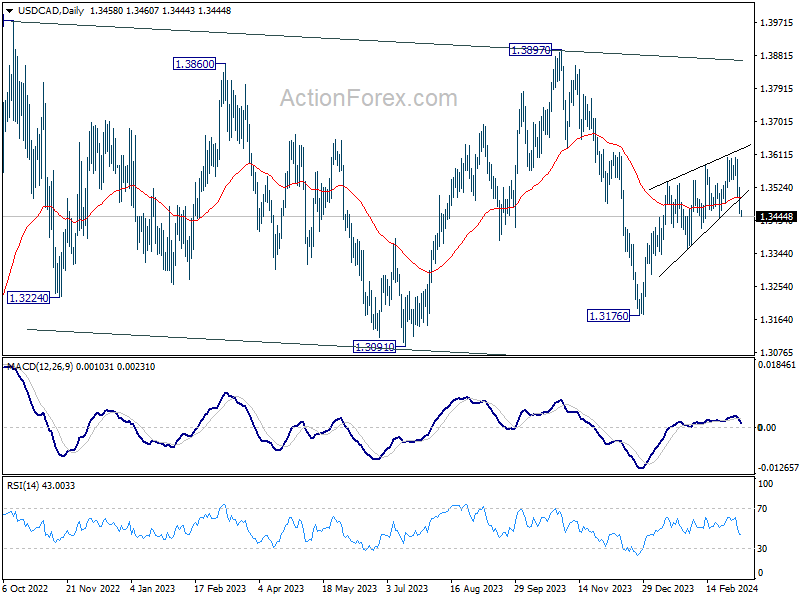
USD/CAD Daily Outlook
Daily Pivots: (S1) 1.3433; (P) 1.3480; (R1) 1.3505; More...
Immediate focus is now on 1.3439 in USD/CAD with current decline. Decisive break there will argue that rebound from 1.3176 has completed as a corrective move to 1.3605. Near term outlook will be turned bearish for 1.3357 support first. On the upside, though, break of 1.3524 minor resistance will retain near term bullishness, and turn bias back to the upside for retesting 1.3605 resistance instead.
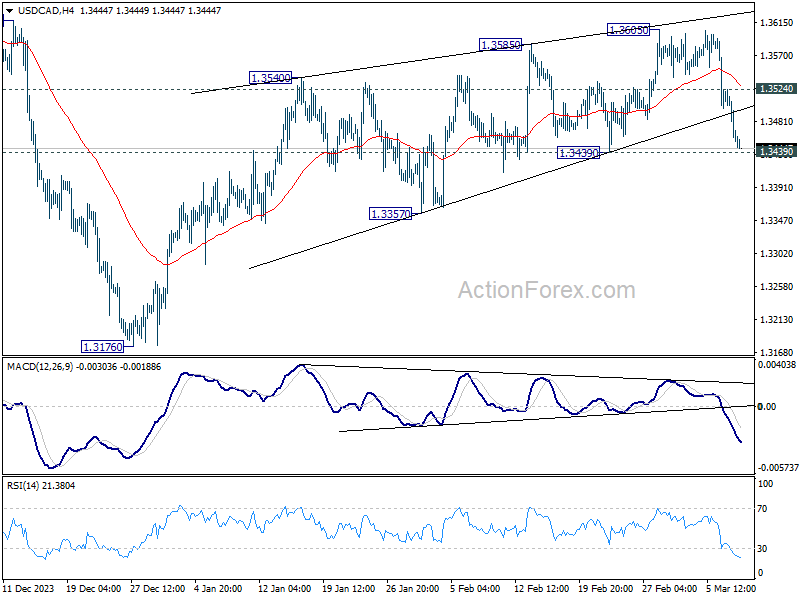
In the bigger picture, price actions from 1.3976 (2022 high) are viewed as a corrective pattern only. In case of another fall, strong support should emerge above 1.2947 resistance turned support to bring rebound. Overall, larger up trend from 1.2005 (2021 low) is still expected to resume through 1.3976 at a later stage.
AUD/USD Daily Report
Daily Pivots: (S1) 0.6580; (P) 0.6602; (R1) 0.6643; More...
AUD/USD's rebound extends to as high as 0.6629 so far today, breaking 38.2% retracement of 0.6877 to 0.6442 at 0.6605. Current upside acceleration as seen in 4H MACD indicates that further rally is underway. Intraday bias stays on the upside for 61.8% retracement at 0.6707 next. On the downside, below 0.6580 minor support will turn intraday bias neutral first.
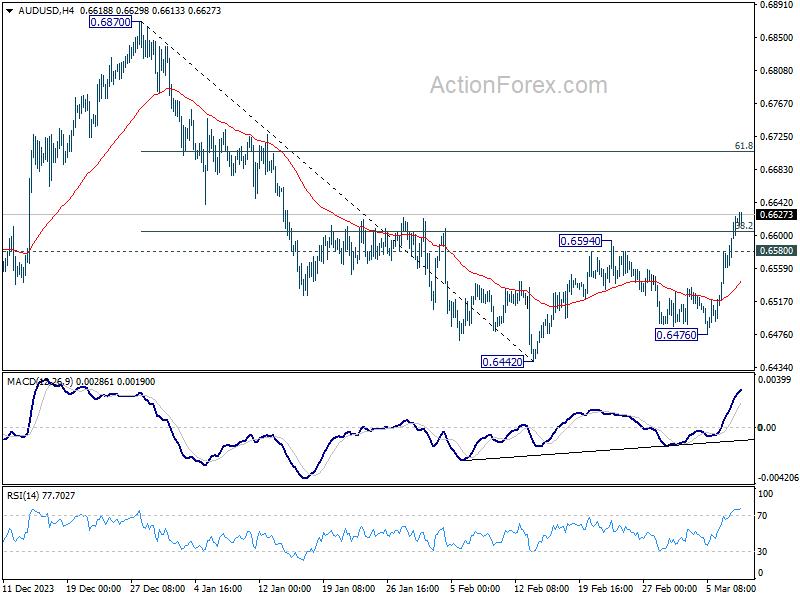
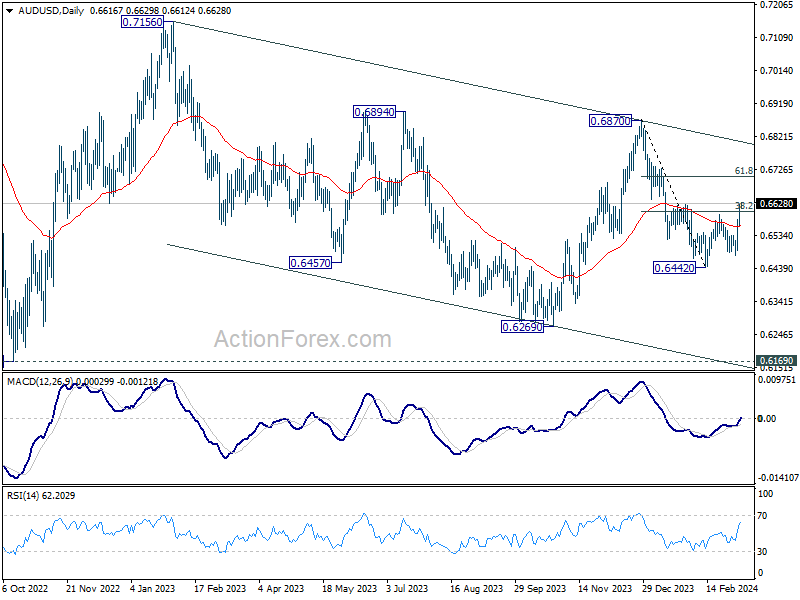
In the bigger picture, price actions from 0.6169 (2022 low) are seen as a medium term corrective pattern to the down trend from 0.8006 (2021 high). Fall from 0.7156 (2023 high) is seen as the second leg, which might still be in progress. Overall, sideway trading could continue in range of 0.6169/7156 for some more time. But as long as 0.7156 holds, an eventual downside breakout would be mildly in favor.
Aussie Tops on Risk-On Wave and China Trade Boost, Dollar in Limbo Before NFP
Dollar is continuing its streak as the weakest performer for the week, amid a global surge in risk appetite. Major stock indices around the world, including S&P 500, NASDAQ, DAX, and CAC, have notched new record highs overnight. This wave of optimism has seamlessly transitioned into Asian session today. Investors have been absorbing the latest adjustment in central bank rate cut expectations rather well. While a bit later than originally thought, Fed and ECB are on course to deliver their first rate cuts in June. Focuses will now turn to non-farm payroll report from the US today, so further solidify the expectation on Fed.
Australian Dollar overtakes Yen's position as the best performer for the week so far. Aussie is buoyed by news from China's Guangdong Energy regarding its plans to import 80 million tons of coal from Australia this year. This move signals a return to pre-sanction trade levels between Australia and China, providing a notable lift to Australian Dollar. Meanwhile, despite paring much of earlier gains, Japanese Yen is currently in the second spot in terms of strength, support by increasing bets on BoJ rate hike later this month.
Conversely, Swiss Franc is only marginally outperforming the Dollar, with Canadian Dollar trailing closely as market participants await Canadian employment data for further direction. Euro and the British Pound find themselves in a relatively neutral position, with Pound having a slight advantage.
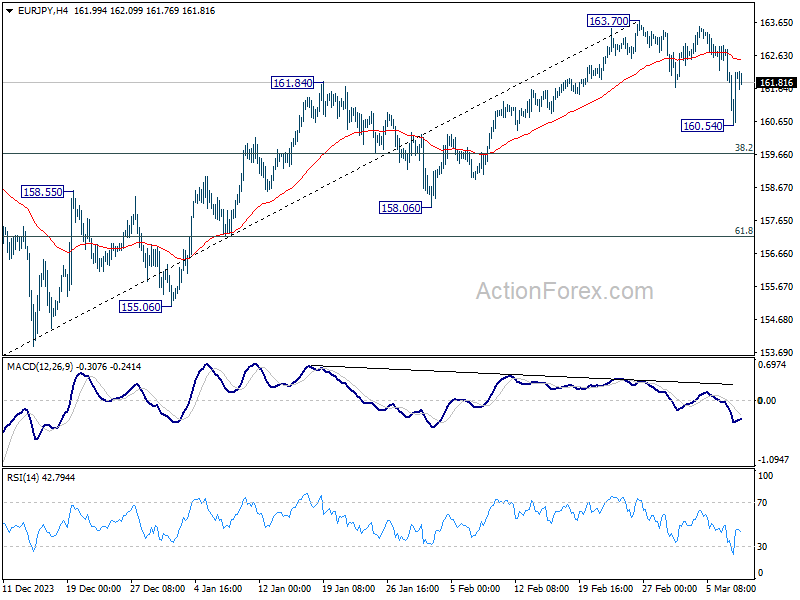
Technically, Yen has pared back much gains against most but Dollar. For example, EUR/JPY recovered strongly after dipping to 160.54. Current development open up the case that fall from 163.70 is merely a near term corrective pullback. Sustained trading above 55 D EMA (now at 162.51) would argue that this correction has completed and bring stronger rebound back to 163.70. If realized in this way, Yen's reversal in crosses might help USD/JPY bounce from 38.2% retracement of 140.25 to 150.87 at 146.81. Let's see how it plays out.
In Asia, at the time of writing, Nikkei is up 0.47%. Hong Kong HSI is up 1.22%. China Shanghai SSE is up 0.11%. Singapore Strait Times is up 0.65%. Japan 10-year JGB yield is up 0.0014 at 0.735. Overnight, DOW rose 0.34%. S&P 500 rose 1.03%. NASDAQ rose 1.51%. 10-year yield fell -0.012 to 4.092.
Japan's household spending falls -6.3% yoy in Jan, deepening contraction
Japan's household spending fell -6.3% yoy in January well below expectation of -4.3% yoy. That's the 11th consecutive month of contraction, and the biggest annual drop since February 2021. On a seasonally adjusted, spending fell -2.1% mom, versus expectation of 0.4% mom increase.
The Ministry of Internal Affairs and Communications noted that one-off factors such as decreases in new car purchases amid factory suspensions and lower energy bills due to warm weather contributed to the spending drop. Also, the bigger-than-expected fall was also against the backdrop of higher spending in the same month last year from post-pandemic travel subsidies.
NFP takes center stage, S&P 500 hits record, Dollar Index falters
The main focus of the day is February US non-farm payroll report, with the market anticipating headline job growth of 200k. Unemployment rate is expected to hold steady at 3.7%. Attention is particularly focused on average hourly earnings, anticipated to grow by 0.2% mom, amidst a backdrop of mixed employment indicators from related data sources.
The manufacturing sector, as represented by ISM manufacturing employment index, witnessed a decline from 47.1 to 45.9, while the services sector, through ISM services employment figure, also saw a decrease from 50.5 to 48.0. ADP private employment report indicated a modest job growth of 140k. There was a slight uptick in four-week moving average of initial jobless claims from 208k to 212k. Together they suggest the labor market's resilience may be cooling. These indicators collectively temper expectations for a significant upside surprise in the NFP data, while wage growth presenting an unpredictable element as usual.
Investors are particularly interested in how the payroll data might reinforce the likelihood of a June rate cut by Fed. A favorable set of data supporting this case would at least align Fed with its projected path of three rate cuts this year, with the other two in Q3 and Q4, as in the latest dot plot projections.
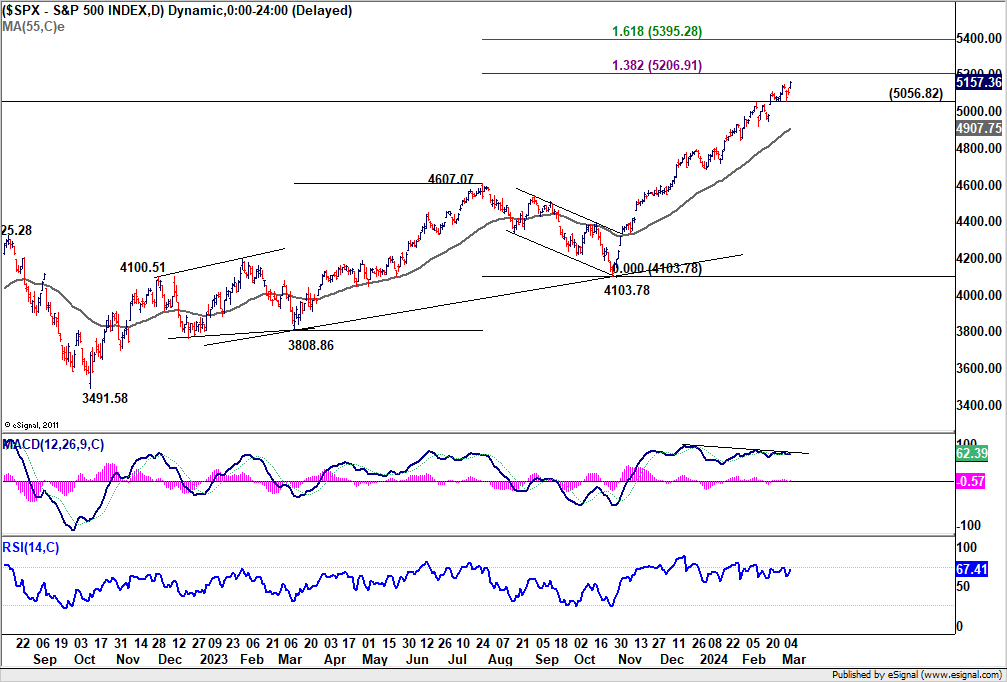
S&P 500 closed at new record high overnight as its recent uptrend continued. For now, outlook will stay bullish as long as 5056.82 support holds. Next target is 138.2% projection of 3808.86 to 4607.07 from 4103.78 at 5206.91. Firm break there will pave the way to 161.8% projection at 5395.28. Nevertheless, considering bearish divergence condition in D MACD, break of 5056.82 should indicate short term topping, and bring deeper pullback first.
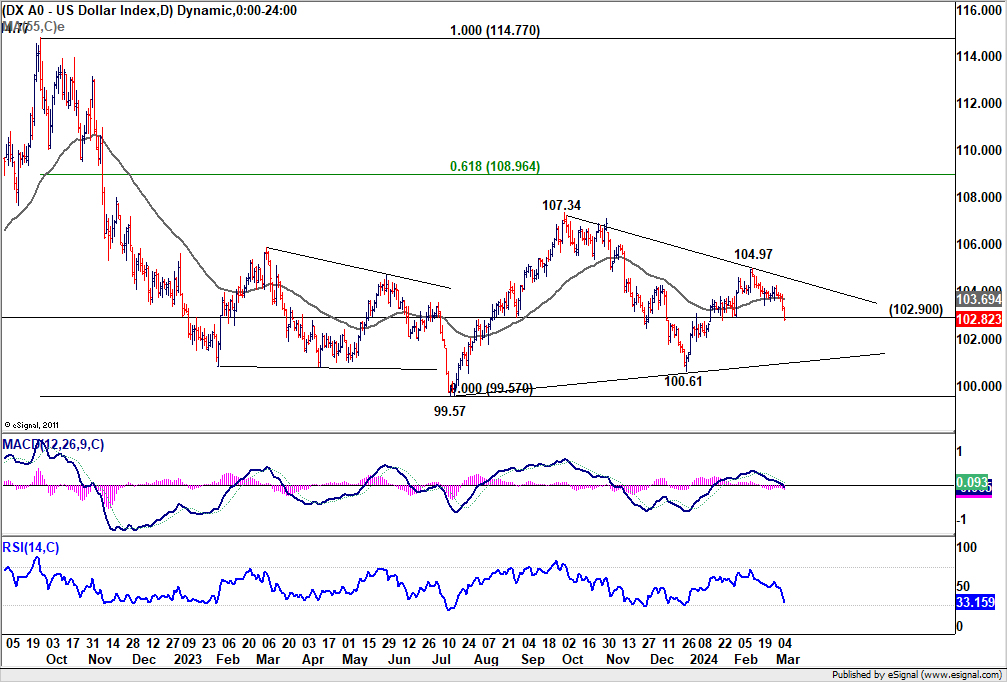
Dollar Index's close below 102.90 support overnight argues that rebound from 100.61 has completed much earlier than expected at 104.97. Risk will now stay on the downside as long as 55 D EMA (now at 103.69) holds. Deeper decline would be seen back towards 100.61 support, aligning with rally in stock markets. But strong support should emerge around 100 psychological level to bring rebound, to extend medium term range trading.
Looking ahead
Germany industrial production and PPI, France trade balance and Eurozone GDP revision will be featured in Euroepan session. Later in the day US non-farm payrolls and Canada employment will be the main focuses.
AUD/USD Daily Report
Daily Pivots: (S1) 0.6580; (P) 0.6602; (R1) 0.6643; More...
AUD/USD's rebound extends to as high as 0.6629 so far today, breaking 38.2% retracement of 0.6877 to 0.6442 at 0.6605. Current upside acceleration as seen in 4H MACD indicates that further rally is underway. Intraday bias stays on the upside for 61.8% retracement at 0.6707 next. On the downside, below 0.6580 minor support will turn intraday bias neutral first.
In the bigger picture, price actions from 0.6169 (2022 low) are seen as a medium term corrective pattern to the down trend from 0.8006 (2021 high). Fall from 0.7156 (2023 high) is seen as the second leg, which might still be in progress. Overall, sideway trading could continue in range of 0.6169/7156 for some more time. But as long as 0.7156 holds, an eventual downside breakout would be mildly in favor.
Economic Indicators Update
| GMT | Ccy | Events | Actual | Forecast | Previous | Revised |
|---|---|---|---|---|---|---|
| 23:30 | JPY | Overall Household Spending Y/Y Jan | -6.30% | -4.30% | -2.50% | |
| 23:50 | JPY | Bank Lending Y/Y Feb | 3.00% | 3.20% | 3.10% | |
| 23:50 | JPY | Current Account (JPY) Jan | 2.73T | 2.07T | 1.81T | |
| 05:00 | JPY | Leading Economic Index Jan P | 109.9 | 109.7 | 110.2 | |
| 05:00 | JPY | Eco Watchers Survey: Current Feb | 50.6 | 50.2 | ||
| 07:00 | EUR | Germany Industrial Production M/M Jan | 0.50% | -1.60% | ||
| 07:00 | EUR | Germany PPI M/M Jan | -0.10% | -1.20% | ||
| 07:00 | EUR | Germany PPI Y/Y Jan | -6.60% | -8.60% | ||
| 07:45 | EUR | France Trade Balance (EUR) Jan | -6.5B | -6.8B | ||
| 10:00 | EUR | Eurozone GDP Q/Q Q4 | 0.00% | 0.00% | ||
| 13:30 | USD | Nonfarm Payrolls Feb | 200K | 353K | ||
| 13:30 | USD | Unemployment Rate Feb | 3.70% | 3.70% | ||
| 13:30 | USD | Average Hourly Earnings M/M Feb | 0.20% | 0.60% | ||
| 13:30 | CAD | Capacity Utilization Q4 | 79.90% | 79.70% | ||
| 13:30 | CAD | Net Change in Employment Feb | 20.0K | 37.3K | ||
| 13:30 | CAD | Unemployment Rate Feb | 5.80% | 5.70% |