Sample Category Title
EUR/USD Signals Breakout But This Resistance Is The Key
Key Highlights
- EUR/USD is attempting a fresh increase toward the 1.0930 resistance.
- It broke a major bearish trend line with resistance at 1.0815 on the 4-hour chart.
- GBP/USD is consolidating above the 1.2620 support.
- Gold price is facing resistance near the $2,040 level.
EUR/USD Technical Analysis
The Euro started a decent increase from the 1.0700 zone against the US Dollar. EUR/USD gained pace for a move above the 1.0780 and 1.0800 resistance levels.
Looking at the 4-hour chart, the pair traded above a major bearish trend line with resistance at 1.0815. There was a move above the 1.0850 level, but the bears faced resistance near the 1.0885 level. A high was formed near 1.0888 and the pair is now well above the 100 simple moving average (red, 4-hour).
However, the pair failed to settle above the 200 simple moving average (green, 4-hour). On the upside, the pair is facing resistance near the 1.0840 level.
A close above the 1.0840 zone could open the doors for more upsides. The next stop for the bulls might be 1.0885. Any more gains might send EUR/USD toward 1.0930.
Immediate support is near the 1.0800 level. The first major support sits near the 1.0780 level and the 100 simple moving average (red, 4-hour). The next major support sits at 1.0765, below which the pair might gain bearish momentum. In the stated case, the pair could even visit the 1.0720 support level.
Looking at Gold, the bulls are attempting a fresh increase but they are facing hurdles near the $2,040 level.
Economic Releases
- US New Home Sales for Jan 2024 (MoM) – Forecast +1.8% versus +8.0% previous.
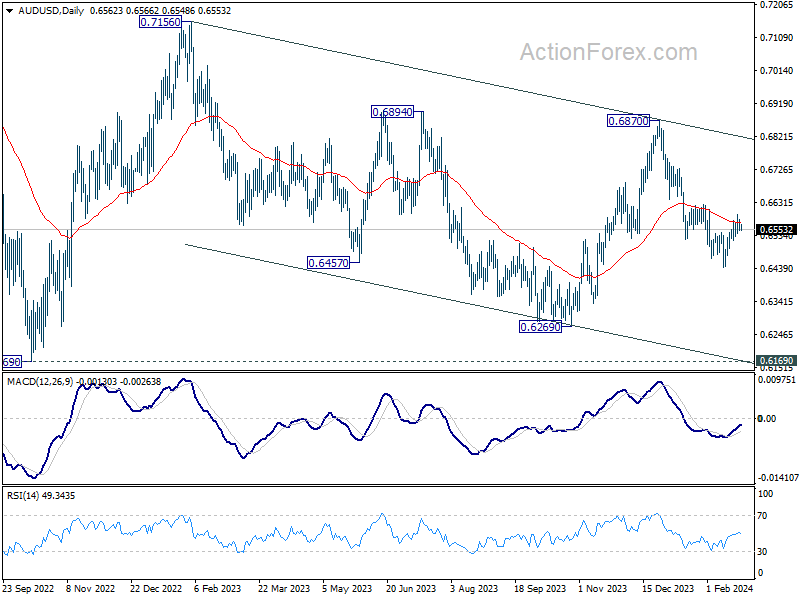
AUD/USD Daily Report
Daily Pivots: (S1) 0.6549; (P) 0.6565; (R1) 0.6580; More...
Intraday bias in AUD/USD remains neutral for the moment and outlook is unchanged. Recovery from 0.6442 could extend higher, but outlook will remain bearish as long as 0.6621 resistance holds. On the downside, below 0.6520 minor support will turn bias to the downside for retesting 0.6442. Nevertheless, considering bullish convergence condition in 4H MACD, decisive break of 0.6621 will turn near term outlook bullish for 0.6870 resistance instead.
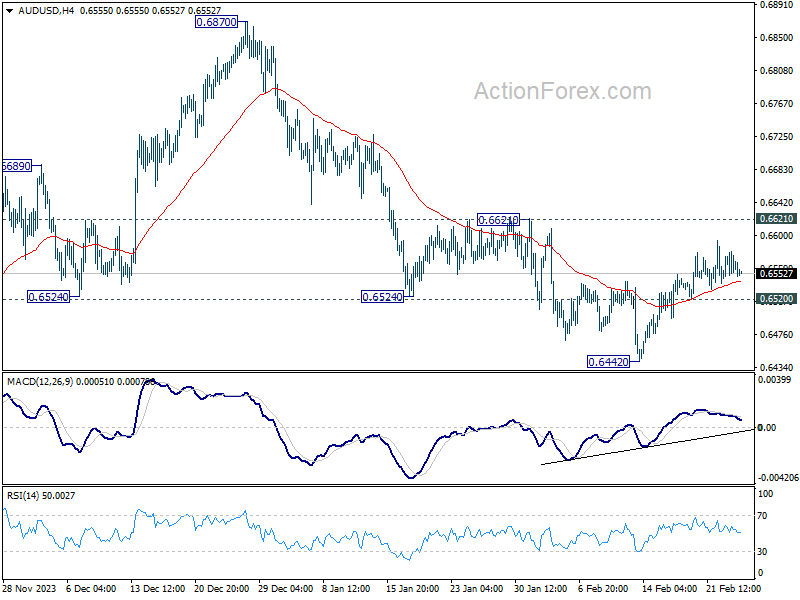
In the bigger picture, price actions from 0.6169 (2022 low) are seen as a medium term corrective pattern to the down trend from 0.8006 (2021 high). Fall from 0.7156 (2023 high) is seen as the second leg, which might still be in progress. Overall, sideway trading could continue in range of 0.6169/7156 for some more time. But as long as 0.7156 holds, an eventual downside breakout would be mildly in favor.
Caution Sets In Ahead of RBNZ, Global Inflation Data to Shake Markets
New Zealand Dollar weakens broadly in Asian session today, reflecting market caution ahead the RBNZ decision later this week, on concerns of less hawkish than expected outcome. The selloff in Kiwi is also dragging down Australian Dollar some what, while Yen and Dollar found some room to recover from last week's losses. At the same time, European majors are currently mixed. Nevertheless, all major currency pairs and crosses are maintaining their positions within Friday's range, with New Zealand Dollar being the sole exception.
The day's trading might remain subdued due to a nearly empty economic calendar. However, scheduled appearances by central bankers, including BoE Deputy Governor Sarah Breeden and Chief Economist Huw Pill, ECB President Christine Lagarde, and Kansas City Fed President Jeffrey Schmid, could inject some volatility into the markets. As the week progresses, the focus will shift to inflation data from US, Eurozone, Japan, and Australia, alongside other key economic indicators such as US durable goods orders, consumer confidence, and ISM manufacturing, as well as Swiss GDP, Canadian GDP, and Chinese PMIs.
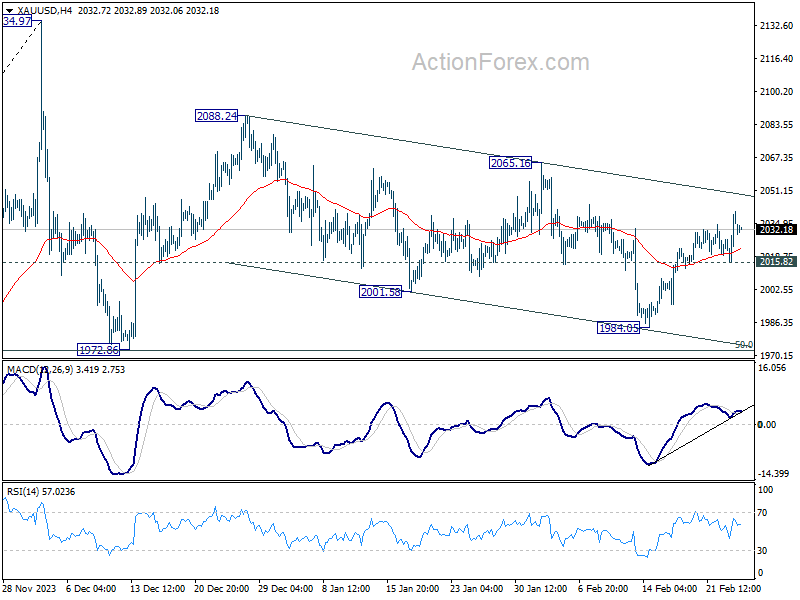
Technically, Gold edges lower today but holds above 2015.82 support. At this point, it's unsure yet if the corrective fall from 2088.24 has completed with three waves down to 1984.05. Break of 2015.82 support will extend the pattern with another falling leg towards 1984.05 and possibly below. However, sustained break the the near term channel resistance will argue that rebound from 1972.86 is ready to resume through 2088.24. As always, the next movements in Gold will be instrumental in assessing the Dollar's direction, given their inverse relationship.
In Asia, at the time of writing, Nikkei is up 0.29%. Hong Kong HSI is down -0.31%. China Shanghai SSE is down -0.25%. Singapore Strait Times is down -0.92%. Japan 10-year JGB yield is down -0.0255 at 0.696, back below 0.7% handle.
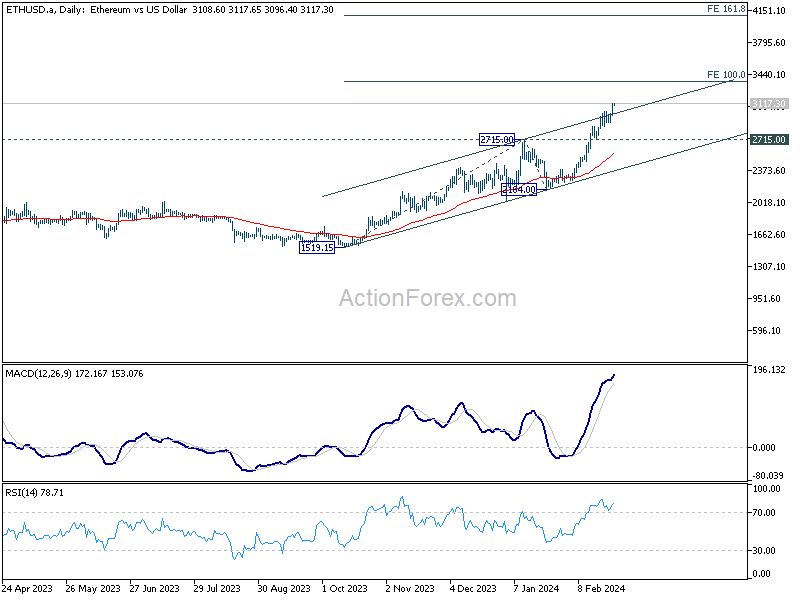
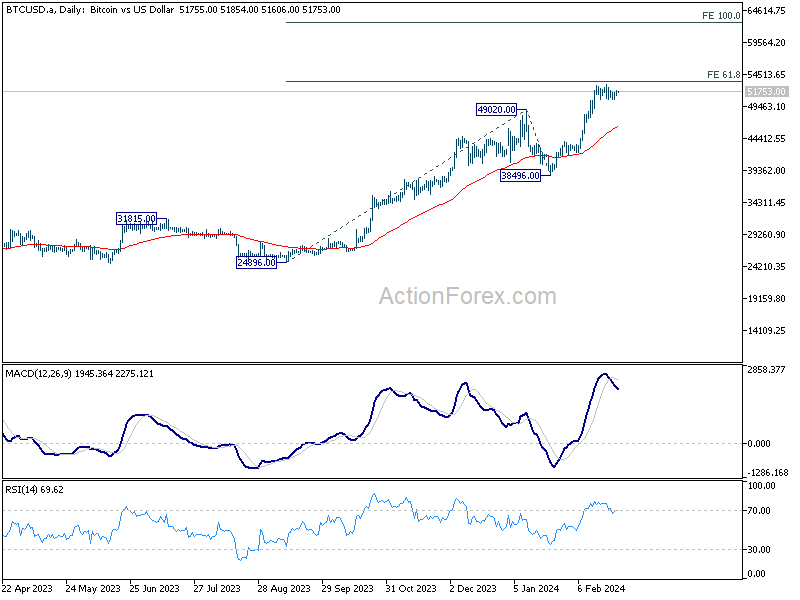
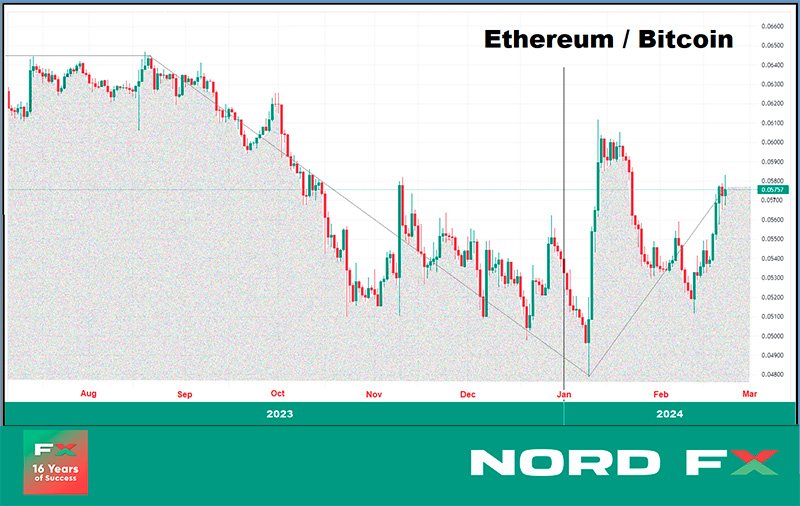
Ethereum leads crypto charge with upside breakout
Ethereum staged an upside breakout over the weekend, and edged above 3100 mark. For the moment, it's outperforming Bitcoin is stuck in range after breaching 53000 briefly earlier in the month. There is prospect for Ethereum to continue to outshine Bitcoin in the near term, in anticipation of a new wave of spot crypto ETF on the world's second-largest digital asset.
The approval of the first spot Bitcoin ETFs by US regulators in January has already marked a significant milestone. These ETFs have attracted over USD 5B in net inflows since their inception on January 11. There is growing speculation that Ether ETFs could receive regulatory approval as soon as the second quarter, possibly in May.
Technically, Ethereum is in upside acceleration mode as seen in D MACD, and the break of channel resistance. Next target is 100% projection of 1519 to 2715 from 2164 at 3360. Considering overbought condition as seen in D RSI, upside might be limited there on first attempt and bring consolidations first. But in any case, outlook will stay bullish as long as 2715 resistance turned support holds. Meanwhile, decisive break of 3360 will pave the way to 161.8% projection at 4099 next, which is above 4k psychological level.
As for Bitcoin, outlook will stay bullish as long as 55 D EMA (now at 46376 holds). Decisive break of 61.8% projection of 24896 to 49020 from 38496 at 53404 will pave the way to 100% projection at 62620.
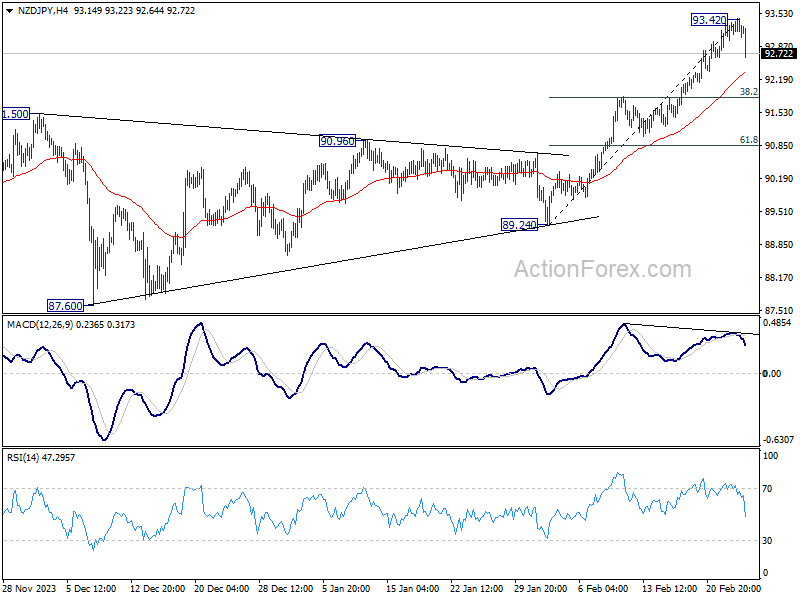
NZD retreats broadly as caution prevails ahead of RBNZ
New Zealand Dollar weakens broadly in Asian session, as market participants are likely adjusting their positions in anticipation of the upcoming RBNZ rate decision. This cautious approach stems from a blend of profit-taking and hedging against surprises that might deviate from some market expectations. Despite a robust rally earlier in the month, spurred by rate hike speculations, the prevailing market consensus leans towards a steady rate with a side of hawkish rhetoric from RBNZ. Investors are currently scaling back, wary of any outcomes that could fall short of the hawkish forecast.
Technically, with today's decline, immediate focus for NZD/USD is now on 55 4H EMA (now at 0.6153). Sustained break there will argue that the rebound from 0.6037 has completed as a three-wave corrective move to 0.6217. In this case, NZD/USD could be ready to resume the fall from 0.6368 through 0.6037 to 61.8% projection of 0.6368 to 0.6037 from 0.6217 at 0.6012 next.
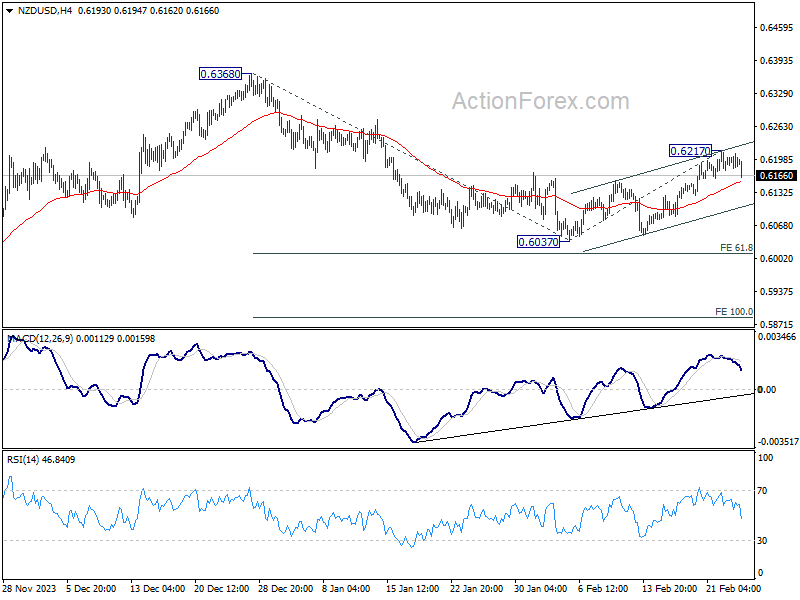
Bearish divergence condition in 4H MACD argues that a short term top was already formed at 93.42 in NZD/JPY. Risk will now stay on the downside as long as 93.42 holds. Deeper fall would be seen to 55 4H EMA (now at 92.31) and below. But for now, considering the overall weakness in Yen, downside should be contained by 38.2% retracement of 89.24 to 93.42 at 91.82 to bring rebound.
RBNZ rate decision and global inflation watch
This coming week places RBNZ squarely in the limelight as it makes its highly anticipated rate decision. While the consensus among financial analysts is for RBNZ to hold official cash rate at 5.50%, the unanimity is not without its dissenters. Notably, ANZ has forecasted a 25bps increase, with expectations of an additional hike in April. This forecast hinges on the perception that RBNZ's current measures may fall short in adequately addressing inflation, which persisted at 4.7% in the fourth quarter, more than double the target.
RBNZ Governor Adrian Orr's recent remarks underscored the ongoing struggle against inflation, advocating for more decisive action to ensure inflation expectations are securely anchored around 2% mark. Orr's cautionary tone, although not convincing all economists of imminent further tightening, reinforces the argument against any expectations for rate cuts within this year.
Eventually, RBNZ's upcoming decision should be heavily influenced by the latest economic projections outlined in the quarterly Monetary Policy Statement. The prevailing wisdom suggests the central bank might opt to conserve its policy ammunition, delivering a hawkish narrative without altering rates. However, the door remains ajar for a surprise rate hike.
Beyond the shores of New Zealand, a slew of inflation data from US, Eurozone, Australia and Japan will draw significant market attention. Analysts and investors alike are keen to see if US PCE and core inflation data resonate with recent CPI report's implications of disinflationary pause. Such an outcome could lend weight to the argument favoring a Fed rate cut in the second half of the year, rather than the first.
ECB finds itself at a crossroads, with market participants eyeing rate cuts potentially starting in April or June. A slight deviation below expectations in the upcoming Eurozone CPI flash might not precipitate an immediate rate cut in March but could bring forward the timing to April. Conversely, unexpected inflationary pressures could push the window for easing to June.
Other notable economic indicators to watch include US durable goods orders, consumer confidence, and ISM manufacturing, along with Swiss GDP, Canadian GDP, and Chinese PMIs.
Here are some highlights for the week:
- Monday: Japan corporate service prices; US new home sales.
- Tuesday: Japan CPI; Germany Gfk consumer sentiment; Eurozone M3 money supply; US durable goods orders, house price index, consumer confidence.
- Wednesday: Australia monthly CPI; RBNZ rate decision; Germany import prices; Swiss Credit Suisse economic expectations; Canada current account; US CPI revision, goods trade balance.
- Thursday: Japan industrial production, retail sales, housing starts; New Zealand ANZ business confidence; Australia retail sales; Germany retail sales, CPI flash, unemployment; Swiss GDP, KOF economic barometer; UK M4 money supply, mortgage approvals; Canada GDP; US jobless claims, personal income and spending, PCE inflation, Chicago PMI, pending home sales.
- Friday: New Zealand building permits; Japan unemployment rate PMI manufacturing final, consumer confidence; China NBS PMIs, Caixin PMI manufacturing; Swiss retail sales PMI manufacturing; Eurozone PMI manufacturing final, CPI flash, unemployment rate; UK PMI manufacturing final; Canada PMI manufacturing; US PMI manufacturing final, ISM manufacturing.
AUD/USD Daily Report
Daily Pivots: (S1) 0.6549; (P) 0.6565; (R1) 0.6580; More...
Intraday bias in AUD/USD remains neutral for the moment and outlook is unchanged. Recovery from 0.6442 could extend higher, but outlook will remain bearish as long as 0.6621 resistance holds. On the downside, below 0.6520 minor support will turn bias to the downside for retesting 0.6442. Nevertheless, considering bullish convergence condition in 4H MACD, decisive break of 0.6621 will turn near term outlook bullish for 0.6870 resistance instead.
In the bigger picture, price actions from 0.6169 (2022 low) are seen as a medium term corrective pattern to the down trend from 0.8006 (2021 high). Fall from 0.7156 (2023 high) is seen as the second leg, which might still be in progress. Overall, sideway trading could continue in range of 0.6169/7156 for some more time. But as long as 0.7156 holds, an eventual downside breakout would be mildly in favor.
Economic Indicators Update
| GMT | Ccy | Events | Actual | Forecast | Previous | Revised |
|---|---|---|---|---|---|---|
| 23:50 | JPY | Corporate Service Price Index Y/Y Jan | 2.10% | 2.40% | 2.40% | |
| 15:00 | USD | New Home Sales M/M Jan | 685K | 664K |
NZD retreats broadly as caution prevails ahead of RBNZ
New Zealand Dollar weakens broadly in Asian session, as market participants are likely adjusting their positions in anticipation of the upcoming RBNZ rate decision. This cautious approach stems from a blend of profit-taking and hedging against surprises that might deviate from some market expectations. Despite a robust rally earlier in the month, spurred by rate hike speculations, the prevailing market consensus leans towards a steady rate with a side of hawkish rhetoric from RBNZ. Investors are currently scaling back, wary of any outcomes that could fall short of the hawkish forecast.
Technically, with today's decline, immediate focus for NZD/USD is now on 55 4H EMA (now at 0.6153). Sustained break there will argue that the rebound from 0.6037 has completed as a three-wave corrective move to 0.6217. In this case, NZD/USD could be ready to resume the fall from 0.6368 through 0.6037 to 61.8% projection of 0.6368 to 0.6037 from 0.6217 at 0.6012 next.
Bearish divergence condition in 4H MACD argues that a short term top was already formed at 93.42 in NZD/JPY. Risk will now stay on the downside as long as 93.42 holds. Deeper fall would be seen to 55 4H EMA (now at 92.31) and below. But for now, considering the overall weakness in Yen, downside should be contained by 38.2% retracement of 89.24 to 93.42 at 91.82 to bring rebound.
Ethereum leads crypto charge with upside breakout
Ethereum staged an upside breakout over the weekend, and edged above 3100 mark. For the moment, it's outperforming Bitcoin is stuck in range after breaching 53000 briefly earlier in the month. There is prospect for Ethereum to continue to outshine Bitcoin in the near term, in anticipation of a new wave of spot crypto ETF on the world's second-largest digital asset.
The approval of the first spot Bitcoin ETFs by US regulators in January has already marked a significant milestone. These ETFs have attracted over USD 5B in net inflows since their inception on January 11. There is growing speculation that Ether ETFs could receive regulatory approval as soon as the second quarter, possibly in May.
Technically, Ethereum is in upside acceleration mode as seen in D MACD, and the break of channel resistance. Next target is 100% projection of 1519 to 2715 from 2164 at 3360. Considering overbought condition as seen in D RSI, upside might be limited there on first attempt and bring consolidations first. But in any case, outlook will stay bullish as long as 2715 resistance turned support holds. Meanwhile, decisive break of 3360 will pave the way to 161.8% projection at 4099 next, which is above 4k psychological level.
As for Bitcoin, outlook will stay bullish as long as 55 D EMA (now at 46376 holds). Decisive break of 61.8% projection of 24896 to 49020 from 38496 at 53404 will pave the way to 100% projection at 62620.
Forex and Cryptocurrencies Forecast
EUR/USD: ECB Rhetoric Against the Dollar
Data on consumer inflation (CPI) in the US, published on February 13, exceeded expectations. The Producer Price Index (PPI) also indicated a rise in industrial inflation in the country. However, despite this, the American currency failed to gain additional support. The Dollar Index (DXY) began to decline from February 14, while EUR/USD steadily climbed higher.
The minutes of the latest FOMC (Federal Open Market Committee) meeting of the US Federal Reserve were published on Wednesday, February 21, serving as a reminder that the American regulator might not be in a hurry to lower interest rates. However, market expectations still dominate that the Fed will begin to ease its monetary policy significantly earlier than the ECB. This factor exerts serious pressure on the dollar, especially as such expectations are constantly fuelled by statements from high-ranking European officials. ECB Executive Board member Isabel Schnabel stated that monetary policy must remain restrictive until the regulator is confident that inflation has sustainably returned to the medium-term target level of 2.0%.
A similar stance was taken by Schnabel's ECB colleague, Bundesbank President Joachim Nagel. On Friday, February 23, he stated that "it is still too early to cut rates, even if this step might seem tempting to some." According to Nagel, the price forecast is not clear enough yet, and key data on price pressure will only be received in Q2, which is when it might be appropriate to consider lowering interest rates.
The Bundesbank head believes that the period of rapid inflation decrease has ended, some setbacks are possible ahead, and in the coming months, inflation will remain noticeably above the target level of 2.0%. (According to the latest forecasts by MUFG Bank, CPI in the Eurozone is expected to be 2.7% in 2024).
EUR/USD surged to 1.0887 on Thursday February 22 and then fell to 1.0802, due to uneven business activity (PMI) data across various Eurozone countries. Preliminary estimates showed that France's manufacturing PMI jumped from 43.1 to 46.8 points, exceeding the expected 43.5. The services index rose from 45.4 to 48.0, surpassing the anticipated 45.7. Significantly exceeding expectations, these indicators ignited investor risk appetite, encompassing not only stock indices but also purchases of the common European currency against the dollar.
However, the joy of euro bulls was short-lived, halted by the publication of Germany's PMI. The manufacturing index of this powerhouse of the European economy plummeted from 45.5 to 42.3, against a forecast of 46.1. The Eurozone's manufacturing PMI dropped from 46.6 to 46.1, contrary to the expected rise to 47.0. It's important to note that all these indicators are below the key horizon of 50.0, indicating an economic downturn. Only the services sector reached this significant threshold of 50.0. Overall, the Eurozone's composite PMI increased to 48.9, the highest since June 2023, but it still remains in the negative zone for the seventh consecutive month.
Regarding the situation on the other side of the Atlantic, these indicators suggest economic growth in the US. Preliminary data showed that the business activity indicator in the services sector was 51.3 points, and in the manufacturing sector, 51.5. On Thursday, the traditional number of initial unemployment claims in the United States was also published, decreasing from 213K to 201K over the week (forecast was 217K), indicating a strengthening labour market.
EUR/USD closed the last week at 1.0820. According to some analysts, the recent macroeconomic data suggest that the dollar's weakening is a temporary phenomenon, and the DXY is expected to return to an upward trajectory. Only extraordinary events in the economy or politics could prevent this. As of the writing of this review, on the evening of Friday, February 23, 50% of experts voted for the strengthening of the dollar and the fall of the pair. 30% sided with the euro, while 20% took a neutral position. Among the oscillators on D1, only 10% are coloured red, 15% are in neutral grey, and 75% are green, with 20% of them in the overbought zone. The balance among trend indicators is different: 35% are red, and 65% are green. The nearest support for the pair is located in the 1.0800 zone, followed by 1.0725-1.0740, 1.0695, 1.0620, 1.0495-1.0515, 1.0450. Bulls will encounter resistance in the areas of 1.0840-1.0865, 1.0925, 1.0985-1.1015, 1.1050, 1.1110-1.1140, 1.1230-1.1275.
Key events to highlight for the upcoming week include Tuesday, February 27, when updates on US durable goods orders will be released. Preliminary data on the American GDP volume for Q4 2023 will follow the next day. Data on retail sales and consumer prices (CPI) in Germany will be published on Thursday, along with the Personal Consumption Expenditures Index and labour market statistics in the US. Significant volatility can be expected towards the end of the working week. On the first day of spring, the annual inflation rate (CPI) in the Eurozone and the final figures of the Business Activity Index (PMI) in the United States will be disclosed.
GBP/USD: UK Economy Gains Momentum
Alongside business activity data from the US and the Eurozone, preliminary indicators for the United Kingdom were also released on Thursday, February 22. The UK's manufacturing sector Business Activity Index (PMI), though slightly below the forecast of 47.5, showed a modest increase from 47.0 to 47.1 points. The services sector indicator remained steady at 54.3. However, the composite PMI reached 53.3, surpassing both the forecast and the previous value of 52.9. Values in the green zone above 50.0 clearly indicate an improvement in the outlook for the British economy. It seems that the technical recession experienced in the second half of 2023 has ended or is at least close to ending.
In a previous review, we cited economists from Scotiabank's forecast that, starting from a strong long-term support zone of 1.2500, GBP/USD would begin to rise towards 1.2700. This prediction came true on 22 February, following the publication of the British PMI, as the pair reached a peak of 1.2709, returning to the very centre of the medium-term sideways channel of 1.2600-1.2800.
Favourable data on the UK economy and the recovery of global risk appetites should have a positive impact on the pound. In such a situation, strategists from the Japanese MUFG Bank write, "if the Fed and the ECB delay the timing of the first rate cut, then the Bank of England (BoE) will delay it as well." Recall that at the conclusion of the meeting that ended on February 1, the BoE announced it would keep the bank rate at its current level of 5.25%. The accompanying statement mentioned that "before lowering rates, more evidence is needed that the Consumer Price Index will fall to 2.0% and remain at this level." Market participants expect the first rate cut to occur in August. This expectation is already priced in and prevents GBP/USD from falling.
MUFG believes, "although the pound's correlation with global stocks has begun to weaken, it remains stronger than the dollar's correlation with risk. And if risk appetite persists, this could cause some strengthening of the pound." However, the bank's experts warn that some concerns about the growth of the British economy still remain, and this could restrain the growth of GBP.
GBP/USD closed the past week at 1.2670. As for the median forecast of analysts for the coming days, 65% voted for the pair's decline, while 35% supported its growth. Among the oscillators on D1, only 10% point south, 15% look east, and the remaining 75% point north, of which 10% signal overbought conditions. Trend indicators show a significant bias towards the British currency: 90% point north, with the remaining 10% pointing south. Should the pair move southward, it will encounter support levels and zones at 1.2635-1.2650, 1.2570, 1.2500-1.2535, 1.2450, 1.2370, 1.2330. In case of an increase, resistance will be met at levels 1.2695-1.2710, 1.2755-1.2775, 1.2825, 1.2880, 1.2940, 1.3000, and 1.3140-1.3150.
No significant macroeconomic data releases related to the UK economy are scheduled for the upcoming week.
USD/JPY: To the Moon and Beyond, Mars is Next
The yield on 10-year US Treasury bonds, currently around 4.30%, continues to support the dollar against the yen, with its low yield and negative interest rates. USD/JPY once again rose above 150.00 last week and attempted to storm the 151.00 mark. Again, it was unsuccessful: the local maximum was recorded at 150.76, with the week closing at 150.52.
The caution of bulls on USD/JPY is largely due to the fact that the 150.00-152.00 zone was where the Ministry of Finance of Japan initiated currency interventions in October 2022 and November 2023. However, every trader knows that past results do not guarantee future performance. Thus, it is not certain that the Ministry of Finance and the Bank of Japan (BoJ) will follow the same path this time.
It should be noted that Japan's GDP has fallen for the last two quarters. A weak national currency supports exporters by making Japanese products more attractive and competitive in foreign markets, thereby stimulating the country's economy. This explains the reluctance of Japanese financial regulators to tighten monetary policy. According to Kazuo Ueda, the head of the BoJ, the question of maintaining or changing monetary policy, including the negative interest rate, will only be considered "when there is a chance of sustainable and stable achievement of the target price level."
As mentioned, the likelihood of a reversal in USD/JPY southward from the 151.00-152.00 zone is high, yet it remains less than 100%. Currently, the pair's rate is approximately 14% higher than a year ago. As some experts note, the financial authorities in Japan start to get nervous when this figure approaches 20% year-on-year. For now, they can feel relatively relaxed and comfortable, especially since the country's economy has already adapted to such an exchange rate over the past two years. Therefore, it's not entirely out of the question that instead of falling to 140.00 as expected by Danske Bank, we might see the pair reach heights of 160.00, as was the case 34 years ago in April 1990.
Regarding the near future, specialists at Singapore's United Overseas Bank believe that within one to three weeks, USD/JPY is likely to trade within the range of 148.70 to 150.90. However, UOB does not rule out that a breakthrough above 150.90 could trigger a rise to 152.00. At the time of writing this review, 40% of experts sided with the dollar, while the majority (60%) voted for the strengthening of the yen. Trend indicators and oscillators on D1 all point north, yet 10% of the latter are in the overbought zone. The nearest support level is located in the zone of 149.70-150.00, followed by 148.25-148.40, 147.65, 146.65-146.85, 144.90-145.30, 143.40-143.75, 142.20, 140.25-140.60. Resistance levels and zones are at 150.90, 151.70-152.05, and 153.15.
No significant events related to the Japanese economy are scheduled for the upcoming week.
CRYPTOCURRENCIES: Five Reasons for the End of the Crypto Winter
Throughout the past week, there was a lull in the battle between bitcoin bears and bulls. Choosing $51,500 as the Pivot Point, BTC/USD moved sideways in a narrow corridor of $50,500-$52,500. Bulls' attempt to break through resistance on 20 February ended in failure, and the pair returned to its defined boundaries. However, as experience shows, any calm is not everlasting. It is inevitably replaced by thunder rolls, stormy winds, and squally showers, especially true for the highly volatile crypto market. So, what can we expect if the weather changes?
According to Lucas Outumuro, head of research at IntoTheBlock, there's an 85% likelihood that bitcoin will reach a new all-time high within the next six months, potentially surpassing $70,000. The analyst identified five factors that could catalyse this growth.
1. Halving in April: This will be the fourth halving event, reducing the block reward from 6.25 BTC to 3.125 BTC, leading to decreased selling pressure. Outumuro does not rule out the possibility of bitcoin reaching an all-time high (ATH) just a month after the halving.
2. Continued inflow into spot Bitcoin ETFs: While the duration of strong inflows remains uncertain, a stable inflow over time is expected to bolster the price of bitcoin by increasing demand.
3. Federal Reserve's interest rate policy: The Fed's stringent stance on interest rates in 2022 laid the groundwork for a bearish trend in risk assets, including the crypto market. With inflation dropping from 10% to 3% by 2024, many anticipate a policy shift by the Fed and the beginning of a rate-cutting cycle. "This expectation is likely the main driving force behind the recent rallies in both bitcoin and stocks... This time, bitcoin's price movement has been more closely linked with traditional assets, leading to its correlation with the Nasdaq and S&P 500 reaching two-month highs," explains Outumuro.
4. US Presidential Elections: Despite the current President Joe Biden's general opposition to digital assets, election campaigns positively impact the crypto market. "The prediction market Polymarket currently gives Biden just a 33% chance of re-election, making Donald Trump, who is significantly more crypto-friendly, the most likely victor," reports IntoTheBlock. The Fed may begin to ease its monetary policy more aggressively to increase the current US President's re-election chances, benefiting stock and cryptocurrency markets.
5. Hedge Funds: Outumuro points out that when bitcoin recovered after the COVID-19 pandemic in 2020, traditional financial giants first recognized cryptocurrency's potential. With the launch of spot Bitcoin ETFs, hedge funds have the opportunity to accumulate a new asset class, leading to increased adoption and acceptance of digital assets.
However, IntoTheBlock acknowledges that these scenarios could change due to several factors. For instance, if the Fed does not ease policy, bitcoin could face a 10% correction. Geopolitical conflicts also negatively impact digital gold's price. Unexpected selling pressure in the event of major player bankruptcies is not ruled out.
As mentioned (in point 3), the correlation between bitcoin and the S&P 500 is increasing, suggesting BTC could rise alongside the US stock market. Following the S&P 500 surpassing 5,000 points, investment bank Goldman Sachs revised its end-of-year forecast for the index to 5,200, potentially providing additional support for bitcoin.
Every trader knows that determining the optimal moment to sell an asset is just as important as the decision to buy it. Dennis Liu, also known as Virtual Bacon, shared his bitcoin investment methodology a few days ago, identifying three elements designed to signal that the market may have reached its peak.
1. Specific Price Milestones: The first sign to look out for is reaching certain price milestones: $200,000 for bitcoin and $15,000 for Ethereum. Liu's assumption is based on historical cycles and diminishing returns. This is a clear, quantifiable indicator that eliminates guesswork when deciding to exit a position.
2. Time-based Exit Strategy: The second benchmark Liu mentions is time-bound. Regardless of the asset's price dynamics, the trader plans to exit positions by the end of 2025. This decision is grounded in the importance of historical patterns and is based on the analysis of halving cycles and the duration of bull markets.
3. Monitoring Price Patterns: The last element of Liu's methodology involves closely monitoring price patterns, specifically BTC's behaviour relative to its 200-day and 21-week exponential moving averages (EMAs). A fall below these support levels would signal the need to sell bitcoin.
It's clear that $200,000 for bitcoin is a forecast, and moreover, a forecast for the relatively distant future. As for the near future, as we've noted, many on-chain indicators from Glassnode have already entered what's termed the "risk zone." They record a relatively low level of realized profit considering the active price growth in the last four weeks. According to Glassnode specialists' observations, a high risk indicator is usually seen in the early stages of a bull market. This is because, upon reaching a "significant level" of profitability, hodlers may begin to take profits, potentially leading to a sharp correction downwards.
Analyst Gareth Soloway suggested that bitcoin could potentially fall to the $30,000 mark, especially if the stock market undergoes a correction. The expert referred to the new potential support for bitcoin as the "line in the sand." "My main line in the sand is between $30,000 to $32,000. [...]. If we drop there, I'll start buying quite large volumes of BTC," he wrote.
Investor and founder of MN Trading, Michael Van De Poppe, also advises investors to wait for a 20-40% correction before entering the market. The specialist believes that a bitcoin pullback could occur upon reaching the $53,000-$58,000 zone. "However," adds Van De Poppe, "if you're buying bitcoin with the intention to hold it for two to three years, and if you believe it will rise to $150,000 during that period, then nothing should stop you from purchasing it at these [current] prices."
While the leading cryptocurrency has been in a flat trend over the last week (a 4% fluctuation for BTC is definitely considered flat), its main competitor, Ethereum, has been significantly more active. Recovering from the previous year, this altcoin has shown excellent dynamics since the end of January, growing by more than 35% and reaching a significant level of $3,000. This is related to both a revival in the DeFi sector and hopes for the launch of ETH-based ETFs in May this year. Although previous reviews have cited several leading experts' doubts about this, there are also many optimists. For instance, analysts at Bernstein believe that the likelihood of the US Securities and Exchange Commission (SEC) approving an ETH-ETF in May is almost 50%, and there is almost a 100% certainty of approval within the next 12 months.
"Ethereum, with its dynamic yield rates, environmentally friendly design, and utility in creating new financial markets, has good prospects for mass institutional adoption. It's probably the only digital asset alternative to bitcoin that could receive unequivocal ETF approval from the SEC," Bernstein analysts argue. They believe that officials might be influenced by the fact that participants in the traditional stock market not only want to launch spot ETH ETFs similar to bitcoin ETFs but also express the intention "to build more transparent and open tokenized financial markets on the ETH network, where utility goes beyond simple asset accumulation." According to Standard Chartered bank estimates, with the anticipation of ETH-ETF approval, the coin's price could rise to $4,000 in the near future.
As of the evening of February 23 when this review is written, BTC/USD is trading in the $51,000 zone, and ETH/USD is at $2,935. The total market capitalization of the crypto market has remained unchanged over the week, standing at $1.95 trillion. The Crypto Fear & Greed Index has risen to the lower boundary of the Extreme Greed zone at 76 points (up from 72 a week ago).
Continued Euphoria Pushes Global Markets to New Records
The past week marked a significant milestone in global financial markets, as major indices like DOW, S&P 500, DAX, CAC, and even Nikkei all reached new record highs, buoyed by the widespread euphoria surrounding artificial intelligence related sectors. This wave of optimism to eclipsed the recalibrated expectations that some major central banks, like Fed, would delay anticipated interest rate cuts. Additionally, China's historic rate cut injected further momentum into the market, leading to a sharp rally in Chinese stocks and bolstering confidence across the region.
In the currency realm, Yen emerged as the week's weakest performer, alongside Swiss Franc and Dollar. These safe-haven currencies found themselves out of favor as traders shifted their focus towards riskier assets amid the prevailing positive sentiment. Canadian Dollar also faced a downturn, reacting negatively to unexpectedly weak CPI data.
Conversely, New Zealand and Australian Dollars stood out as the week's strongest currencies, benefiting from the risk-on market environment and the positive ripple effects of China's monetary policy actions. Sterling followed closely, capitalizing on the general market optimism too. Euro, however, displayed a mixed performance, caught between divergent views within ECB Governing Council on the timing of monetary policy easing.
Hawkish Fed Meets AI Mania
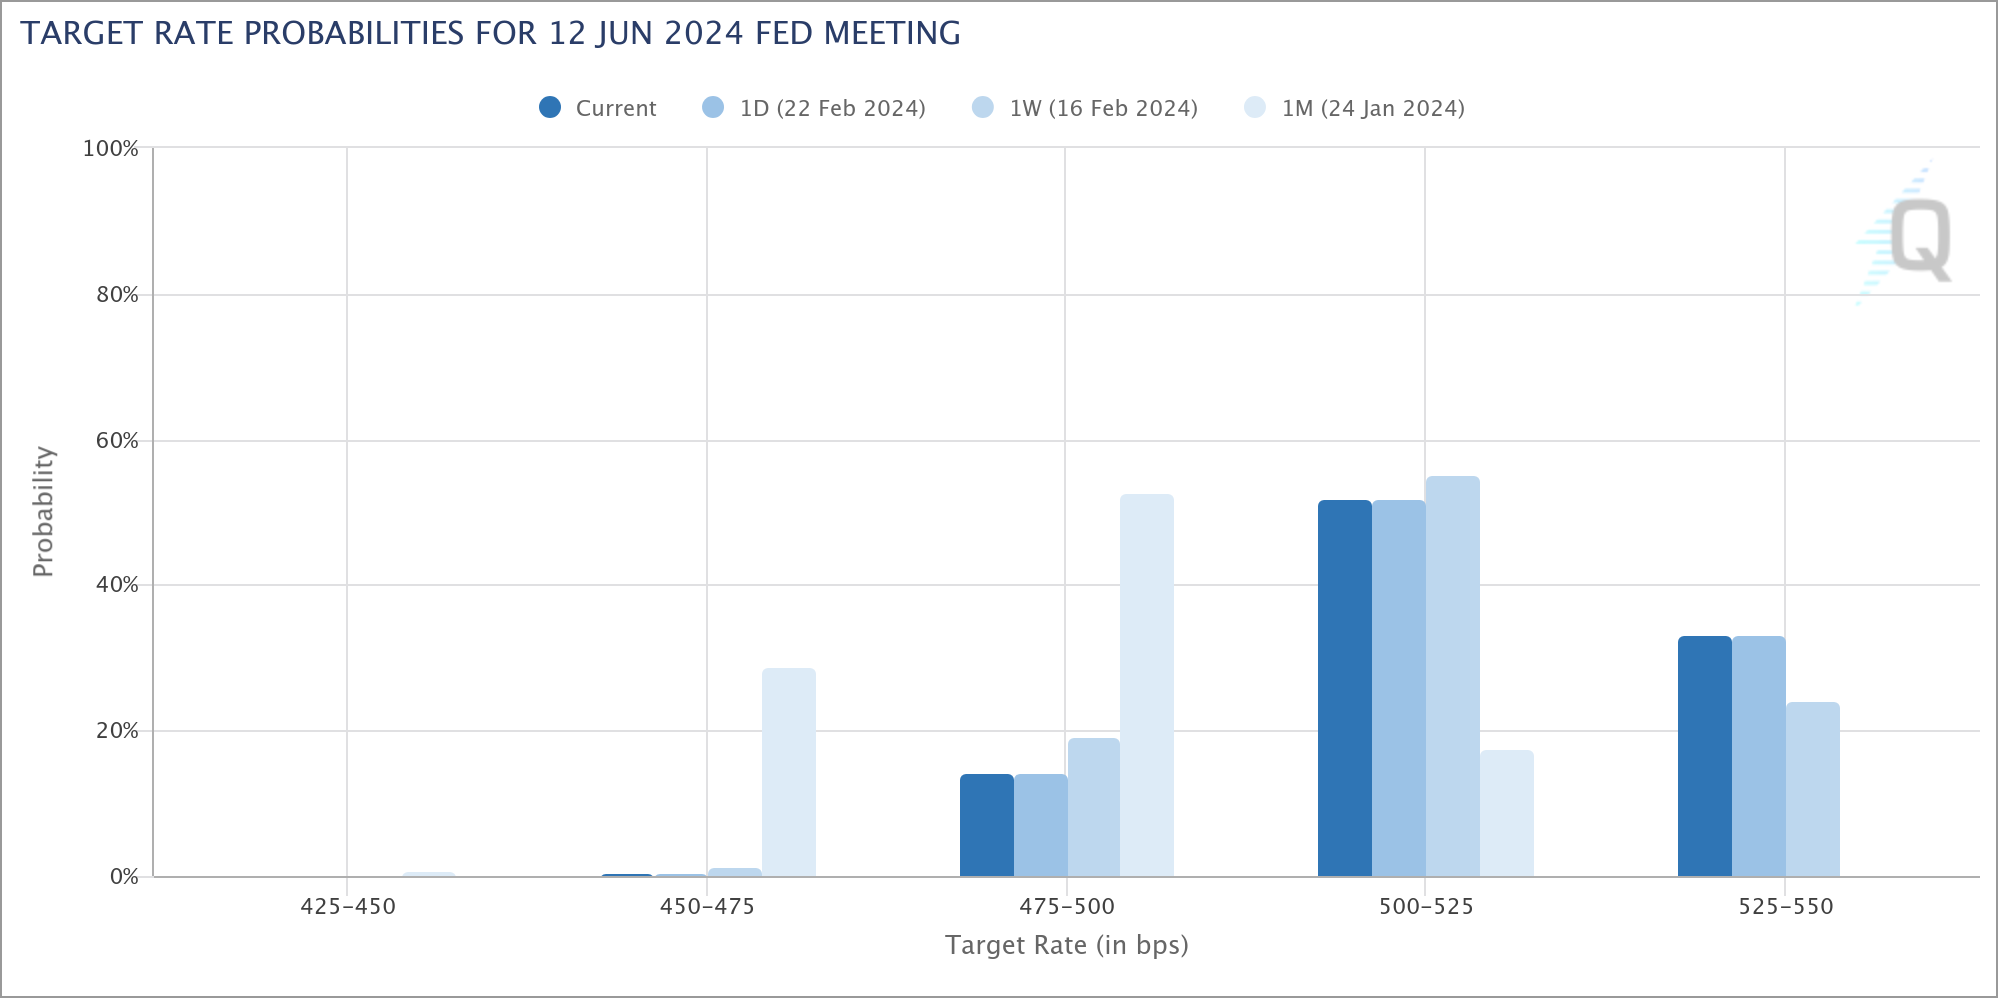
In the wake of Fed's latest meeting minutes, which carried a decidedly hawkish tone, the financial markets are undergoing a notable recalibration of rate cut expectations. The shift in sentiment is starkly evident in fed fund futures, where there's now a 33% likelihood that Fed will maintain the interest rate at the current bracket of 5.25-5.50% following the June meeting. That's a significant departure from the 0% chance anticipated just a month earlier.
This pivot in expectations is largely attributed to Fed policymakers' cautious stance on rate reductions, as outlined in the January FOMC minutes. The document highlighted a majority concern among participants over the perils of easing monetary policy too early, indicating a preference, from a risk management viewpoint, for prolonging the wait before any rate cuts, with the flexibility to accelerate policy easing later if necessary.
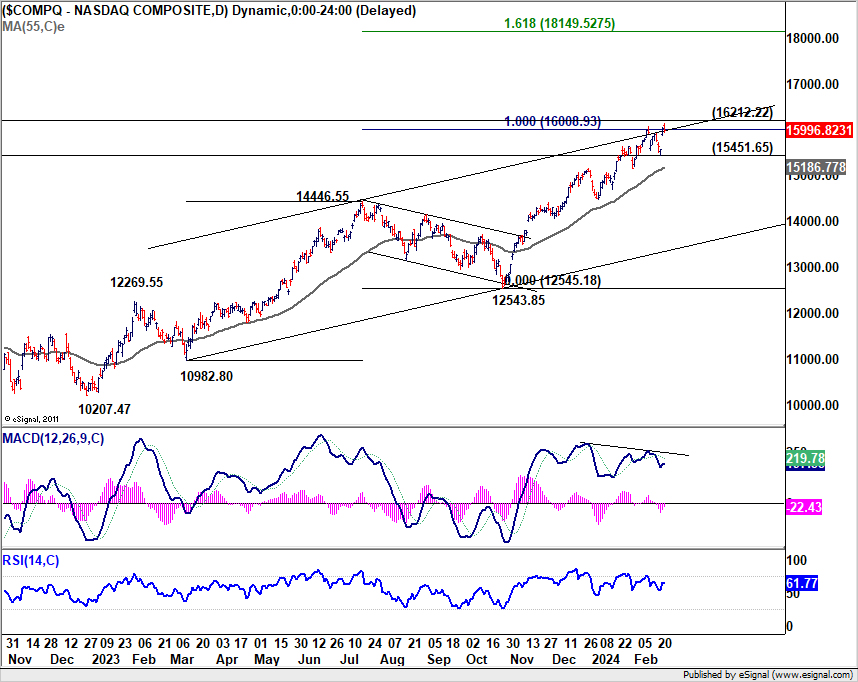
Despite these adjustments in monetary policy expectations, stock investors continue to ride the wave of AI euphoria, propelling the DOW and S&P 500 to record highs, with NASDAQ not far behind.
However, from a technical perspective, NASDAQ is not sitting at a critical juncture, confronting a cluster of resistances levels. That include medium term channel resistance, 100% projection of 10982.80 to 14446.55 from 12543.85 at 16008.93, as well as 16212.22 (2021 high). Additionally, bearish divergence in D MACD hints at diminishing upside momentum, suggesting potential shifts in the near future.
Firm break of 15451.65 support could be the first sign that whole rise from 10207.47 has completed a five-wave rally. Further break of 55D EMA (now at 15186.77) would bring deeper correction back to 12543.85/14446.55 support zone.
Conversely, decisive break of 16000/16200 resistance zone will set the next target at 161.8% projection at 18149.52. However,this development would imply a fifth-wave extension structure that often heralds the climax of a major uptrend. Investors should remain vigilant, as such developments could indicate an approaching end to the current bullish phase.
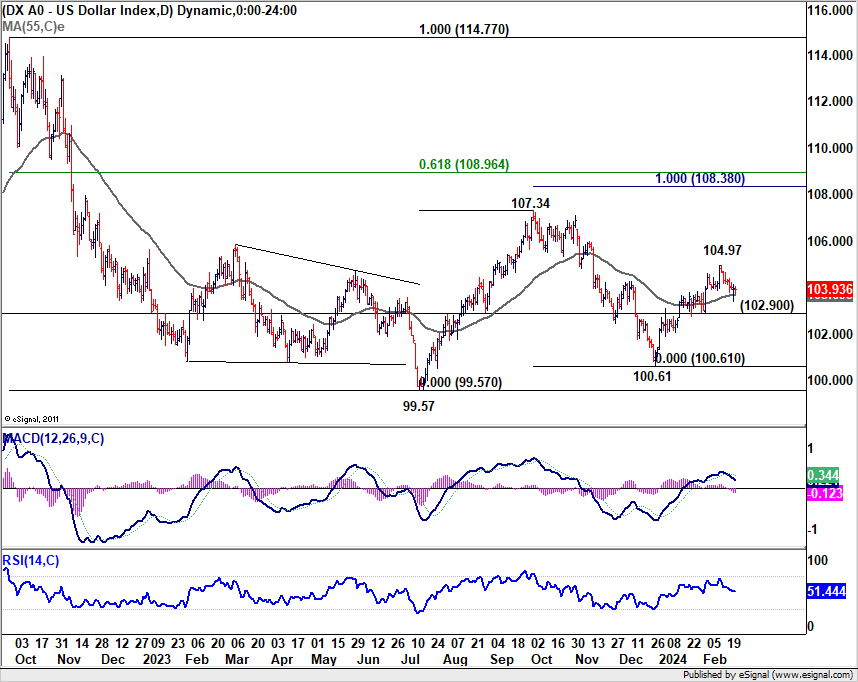
Retreating Dollar Index and Stalled 10-Year Yield Rally
Dollar index extended the retreat from 104.97, in reaction to broad risk-on sentiment. For now, further rally is still in favor as long as 102.90 support holds. Rise from 100.61 is seen as the third leg of the pattern from 99.57 (2023 low). Above 104.97 will target 107.34 support and possibly above. However, firm break of 102.90 support will argue that rise form 100.61 has completed and turn near term outlook bearish for 99.57/100.61 support zone instead.
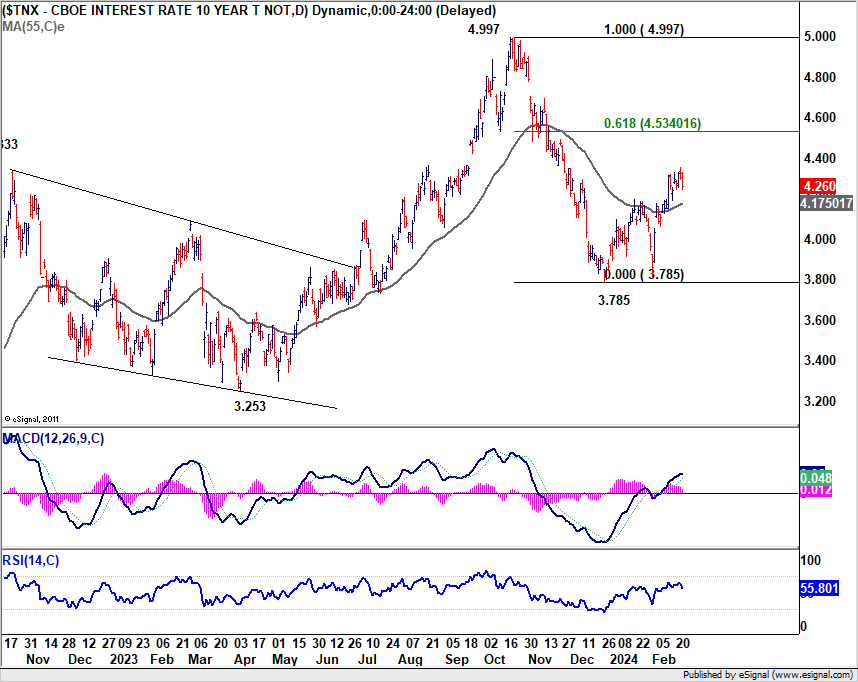
10-year yield also struggled to extend the rebound from 3.785 and closed the week slightly lower. Still, with 55 D EMA (now at 4.175) intact, outlook is unchanged. Rise from 3.785 is seen as the second leg of the three wave corrective pattern from 4.997. Further rally is in favor to 61.8% retracement of 4.997 to 3.785 at 4.534 and possibly above. However, sustained break of 55 D EMA will dampen this bullish view and bring deeper decline back towards 3.785.
The next moves of Dollar Index and 10-year yield would likely be in tandem.
PBoC's Surprise Rate Cuts Fuel Optimism, Shanghai SSE Marks a Turnaround
Another important development to note was the sharp turnaround in the Chinese stock markets in the past two weeks. Sentiment was given a strong boost by PBoC's record cut to a key lending rate. That was the latest in the surprise by the central bank, under the leadership of new Governor, after on the heels of last month's significant reduction in banks' reserve requirement ratio. These moves, seemingly aimed at garnering more market attention and altering sentiment, have led some economists to anticipate further surprises from PBoC too support market sentiment and the economy.
Technically, China's Shanghai SSE Composite should have made a medium term bottom at 2635.08 with subsequent rebound. The strong break of 2923.51 cluster resistance (38.2% retracement of 3418.95 to 2635.08 at 2934.51), as well as 55 D EMA (now at 2909.09) are clearly bullish signals. The close above 3000 handle is also psychologically important.
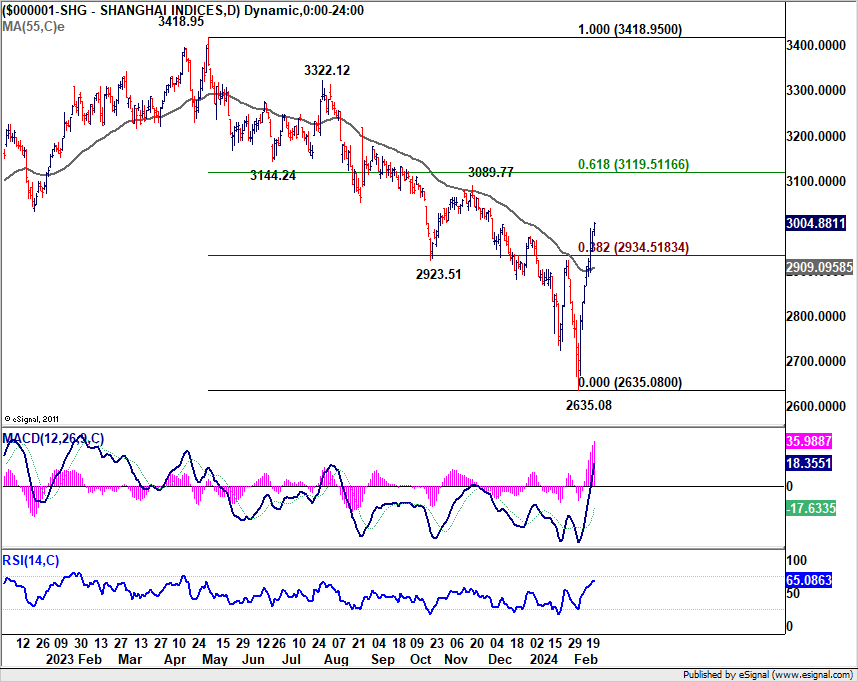
The critical test now lies in whether SSE can break through 55 W EMA (now at 3081.47) with the same vigor. If realized that would suggest that whole down trend from 3731.68 (2021 high) has completed. SSE should then be in a medium term up trend to 3418.95/3731.68 resistance zone to extend the long term range pattern. Nevertheless, rejection by, or failure to break through 3081.47 will keep medium term outlook bearish for down trend resumption at a later stage.
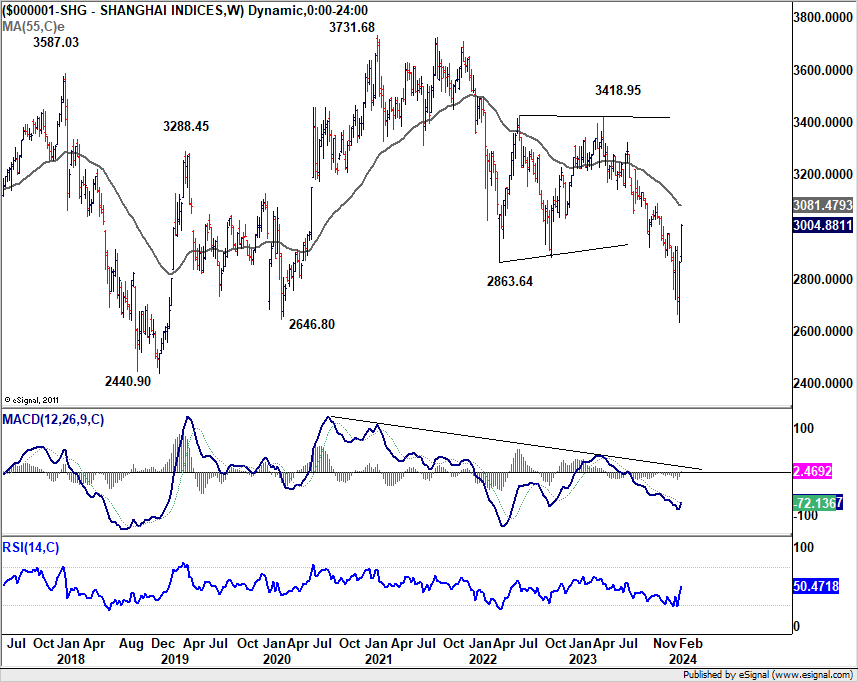
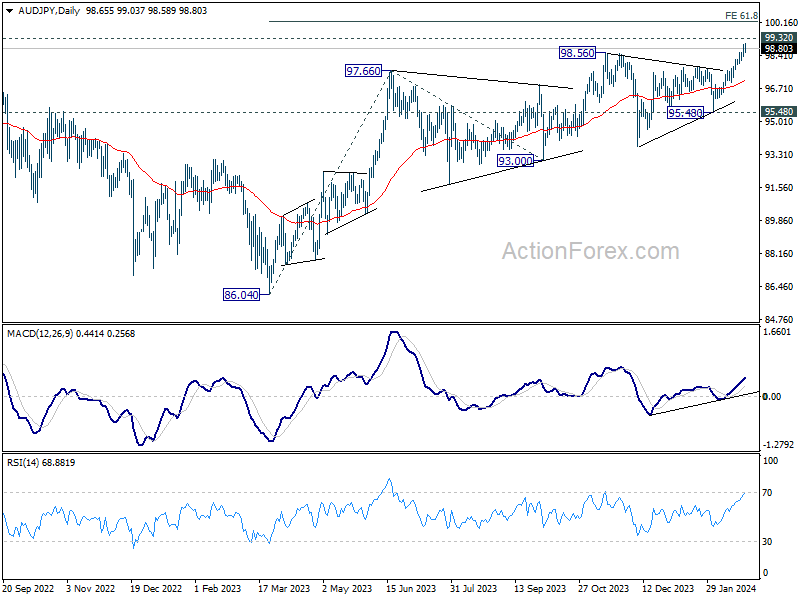
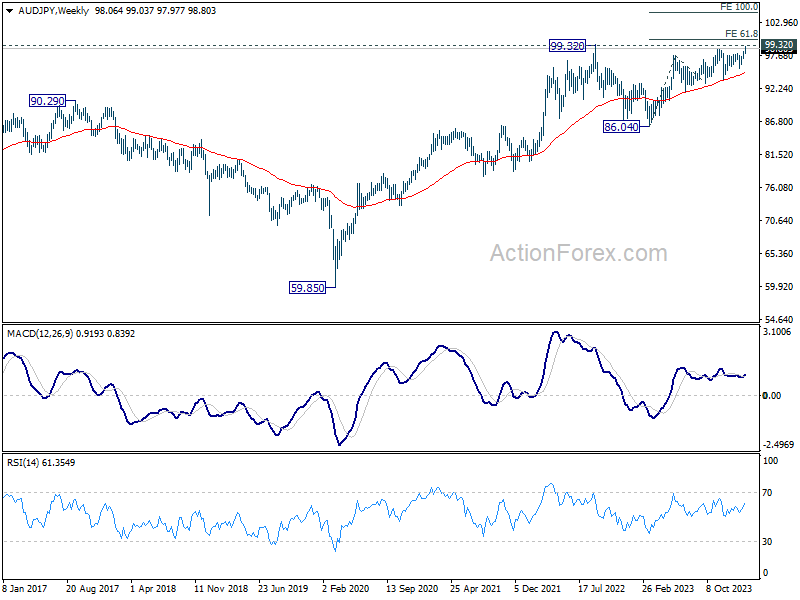
The pivot in China's stock market has also lent some support to Australian Dollar. AUD/JPY is now eyeing 99.32 key resistance (2022 high) with last week's rally. Decisive break there will confirm resumption of whole up trend from 59.85 (2020 low). In this case, next near term target will be 61.8% projection of 86.04 to 97..66 from 93.00 at 100.18, which is close to 100 psychological level.
ECB's Dovish Voices Clash with Hawkish Cautions
ECB's January meeting minutes revealed broad consensus that it was too soon to consider interest rate cuts at "that meeting". Members also emphasized the "high reputational costs" that could arise from having to reverse policy direction should the central bank be forced to hike again after policy loosening. Yet, a closer inspection of individual comments from Governing Council members reveals a spectrum of opinions, ranging from dovish openness to hawkish restraint.
On the dovish front, Portuguese central bank's chief Mario Centeno emphasized the importance of being "open" to the possibility of discussing rate cuts as early as March meeting, citing the significant influx of new data expected by that time. This stance found resonance with Maltese central bank head Edward Scicluna, who suggested that "March could be it" for initiating discussions on policy loosening.
Conversely, the hawkish camp, led by Bundesbank President Joachim Nagel, insists that the current price outlook is not clear enough to justify immediate policy easing. Austrian central bank head Robert Holzmann went even further, highlighting ECB's historical tendency to trail Fed's policy decisions by about six months, implying a more delayed approach to rate cuts if Fed opts for easing in the latter half of the year.
ECB President Christine Lagarde occupies a more central position in this debate. While open to the idea of a rate cut, she predicates such a move on the forthcoming Q1 wage data expected in May. That would set June as the earliest plausible timing for policy easing, contingent on economic conditions aligning with ECB's expectations.
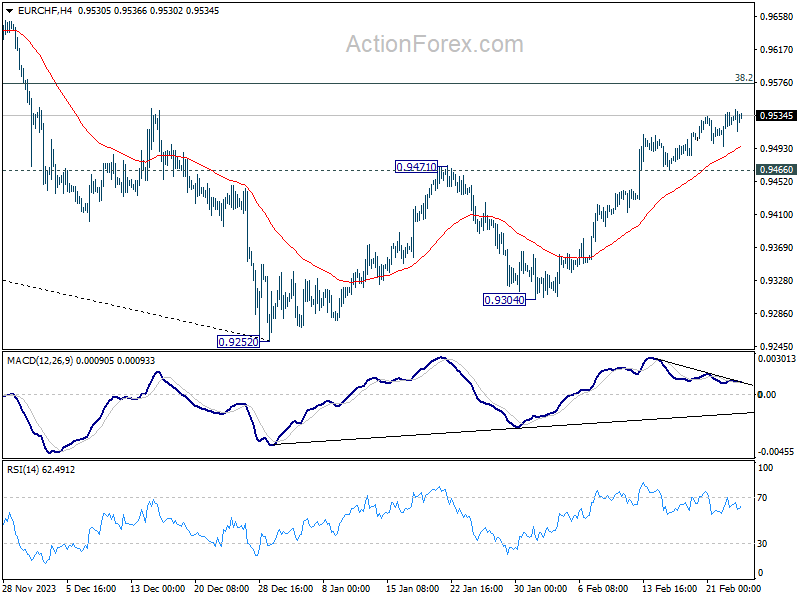
Euro's mixed performance over the week seems to mirror the uncertainty stemming from these diverse viewpoints within the ECB. EUR/CHF edged higher last week as rebound form 0.9252 continued, despite loss of upside momentum as seen in 4H MACD. Further rise is still in favor to 38.2% retracement of 1.0095 to 0.9252 at 0.9574 as long as 0.9466 support holds.
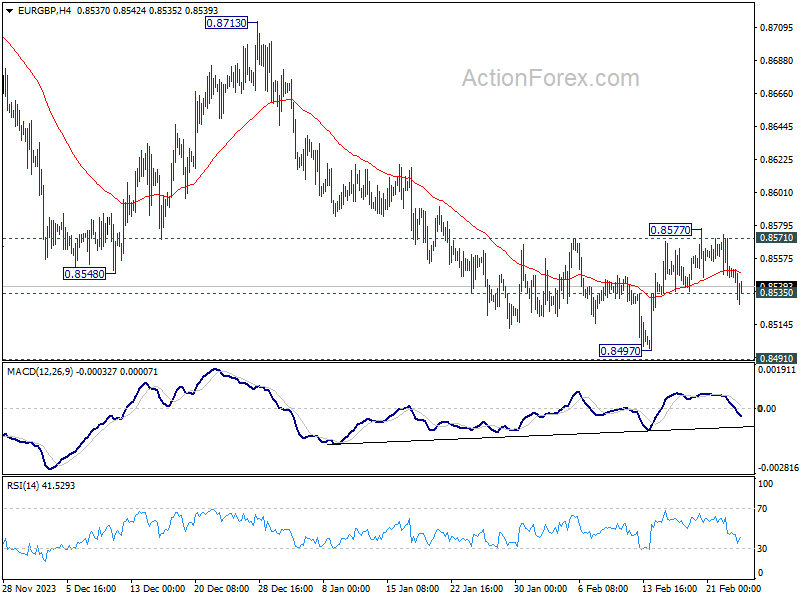
On the other hand, EUR/GBP's breach of 0.8535 support argues that recovery from 0.8497 has completed at 0.8577, after rejection by 0.8571 resistance. Deeper decline is in favor for retesting 0.8491/7 support, and decisive break there will resume larger down trend.
GBP/JPY Weekly Outlook
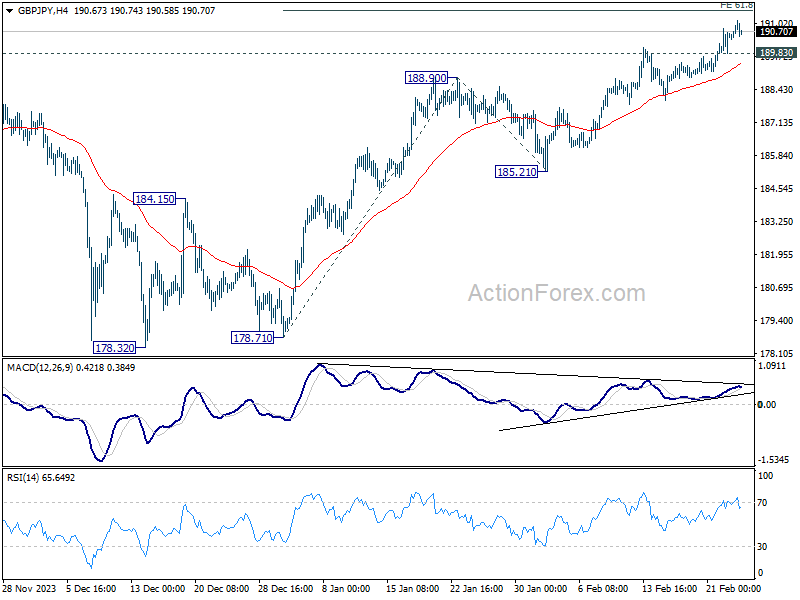
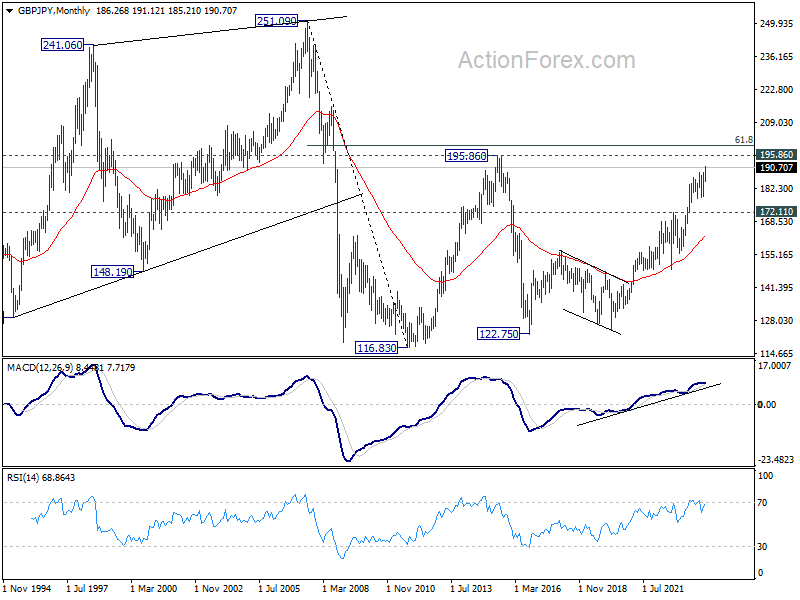
GBP/JPY's up trend continued last week and there is no sign of topping yet. Initial bias remains on the upside this week for 61.8% projection of 178.71 to 188.90 from 185.21 at 191.50. Firm break there will target 100% projection at 195.40. On the downside, below 189.83 minor support will turn intraday bias neutral and bring consolidations, before staging another rally.
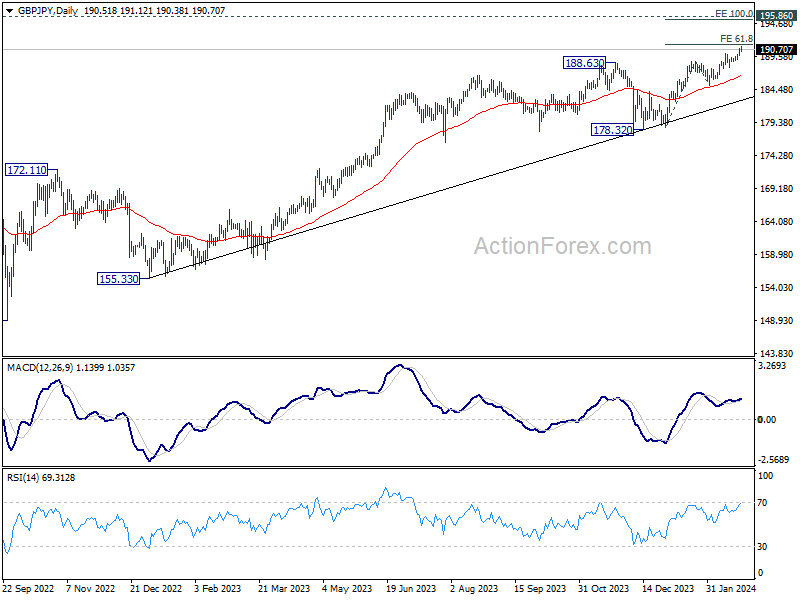
In the bigger picture, up trend from 123.94 (2020 low) is in progress. Medium term outlook will stay bullish as long as 178.32 support holds. Next target is 195.86 long term resistance (2015 high).
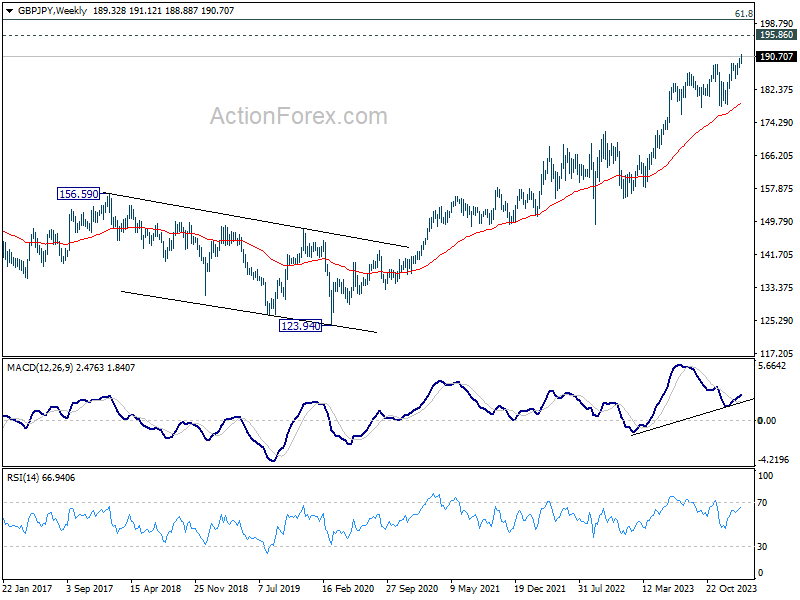
In the longer term picture, rise from 122.75 (2016 low) is seen as the third leg of the pattern from 116.83 (2011 low). Further rally will remain in favor as long as 172.11 resistance turned support holds. Break of 195.86 (2015 high) is possible. But strong resistance could be seen from 61.8% retracement of 251.09 (2007 high) to 116.83 at 199.80 to limit upside, at least on first attempt.
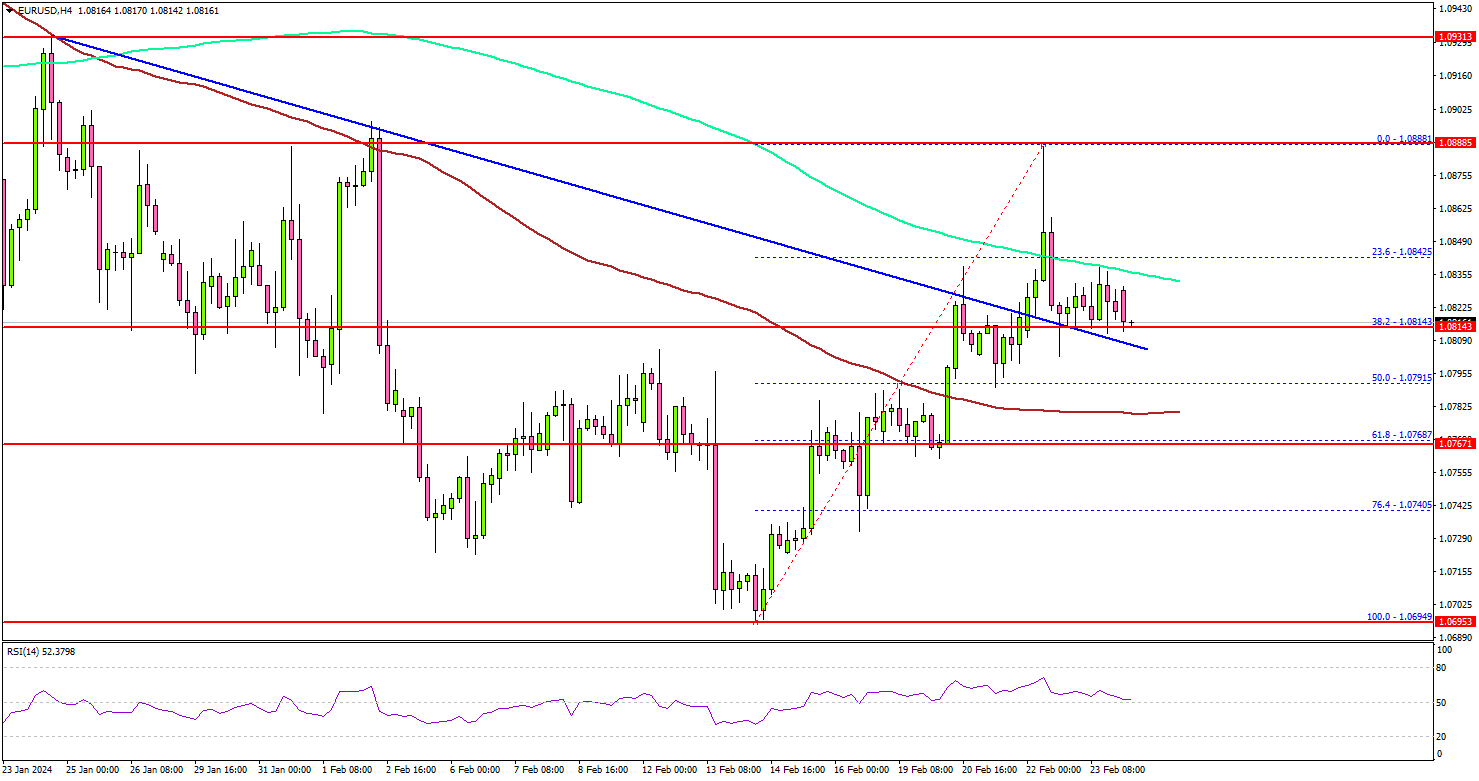
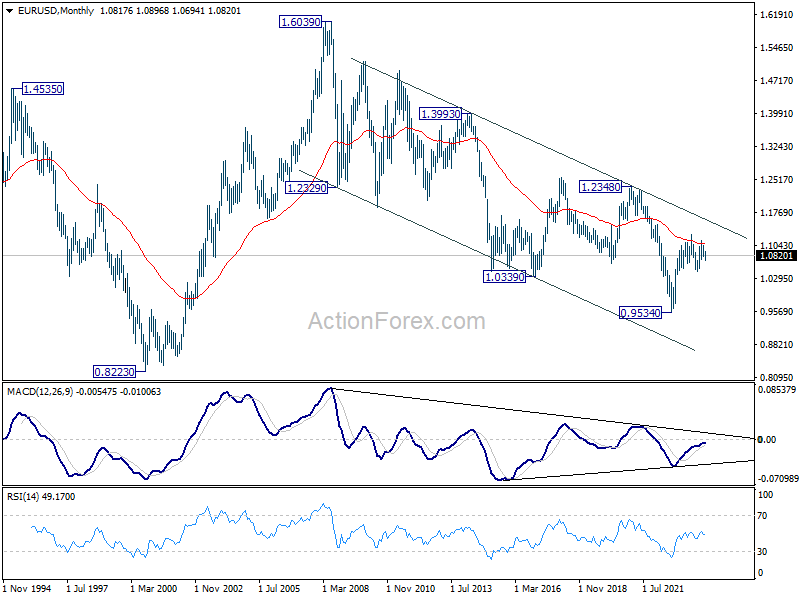
EUR/USD Weekly Outlook
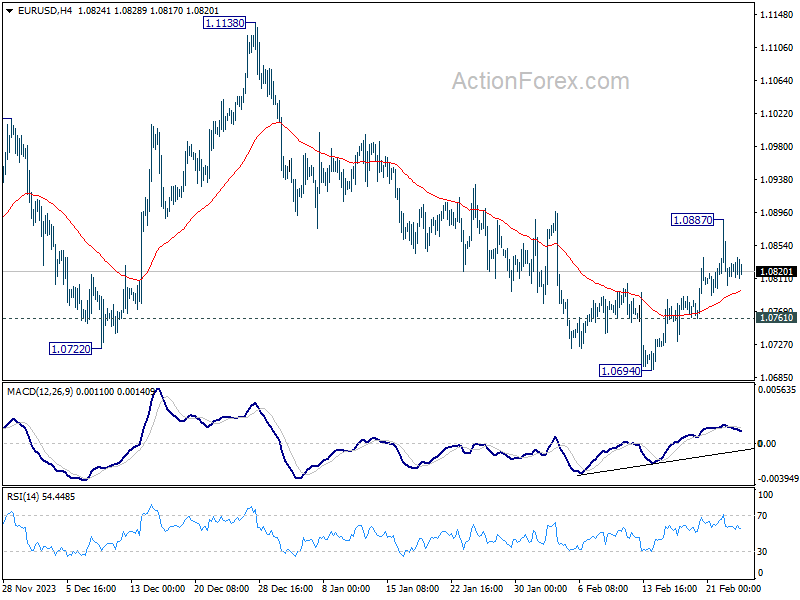
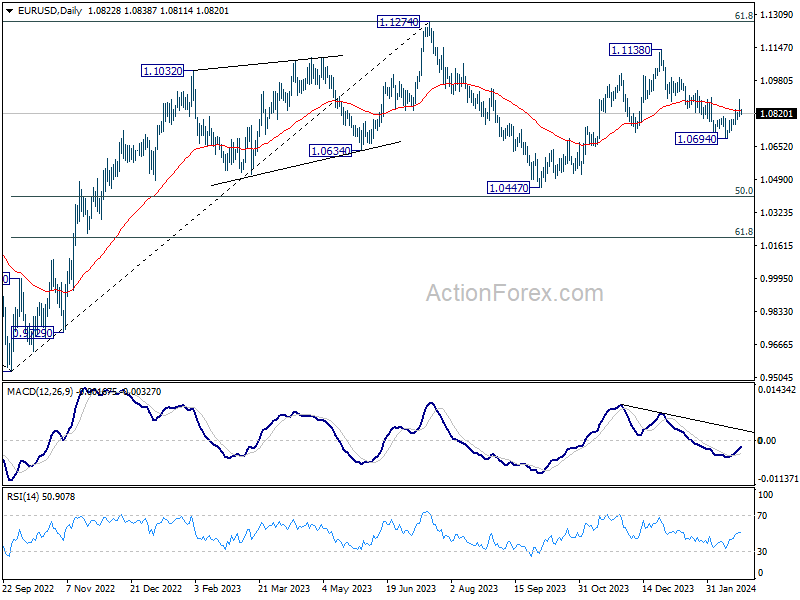
EUR/USD rebounded further to 1.0887 last week but lost momentum and retreated. Initial bias remains neutral this week first. On the upside, break of 1.0887 and sustained trading above 55 D EMA (now at 1.0831) will affirm the case that fall from 1.1138 has completed. Stronger rally would then be seen back to 1.1138. . However, break of 1.0761 will turn bias back to the downside for retesting 1.0694 support.
In the bigger picture, price actions from 1.1274 are viewed as a corrective pattern to rise from 0.9534 (2022 low). Rise from 1.0447 is seen as the second leg. While further rally could cannot be ruled out, upside should be limited by 1.1274 to bring the third leg of the pattern. Meanwhile, sustained break of 1.0694 support will argue that the third leg has already started for 1.0447 and possibly below.
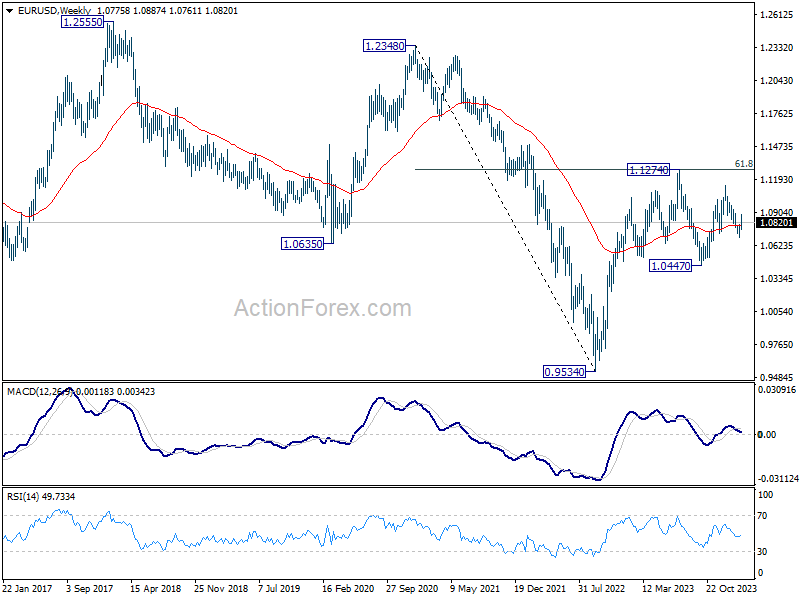
In the long term picture, a long term bottom is in place at 0.9534 on bullish convergence condition in M MACD. It's still early to call for bullish trend reversal with the pair staying inside falling channel in the monthly chart. Nevertheless, sustained trading above 55 M EMA (now at 1.1059) and break of 1.1274 resistance will raise the chance of reversal and target 1.2348 resistance for confirmation.
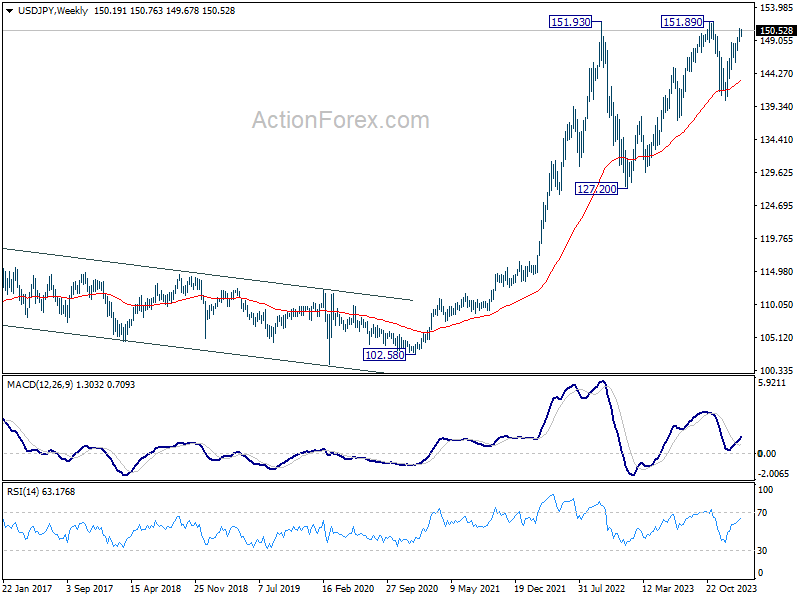
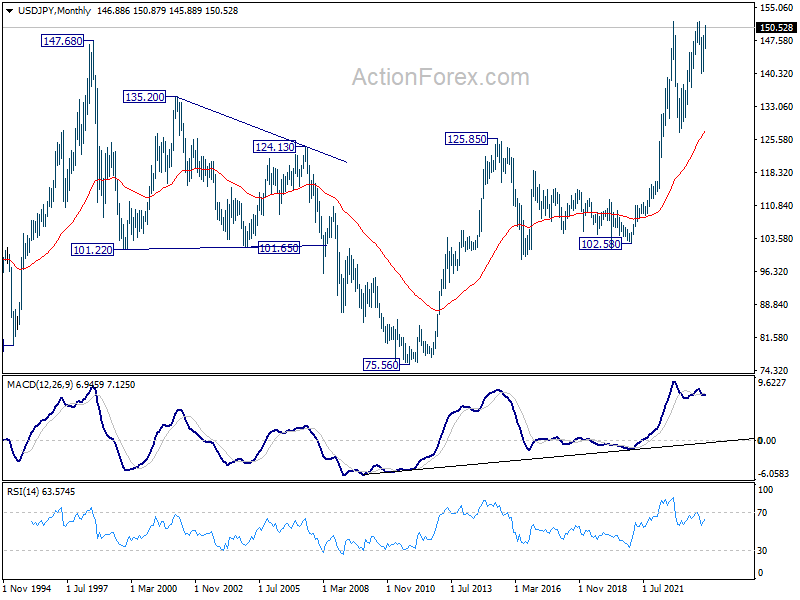
USD/JPY Weekly Outlook
USD/JPY stayed in consolidation below 150.87 last week and outlook is unchanged. Initial bias remains neutral this week first. Further rally is expected as long as 148.79 resistance turned support holds. Break of 150.87 will resume 140.25 to 151.89/93 key resistance zone. Decisive break there will confirm larger up trend resumption of 155.50 projection level next.
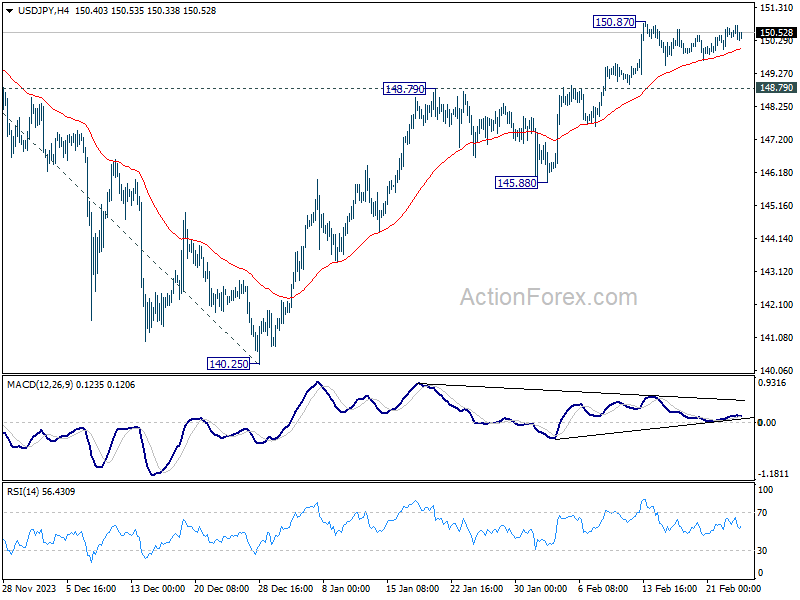
In the bigger picture, rise from 140.25 is seen as resuming the trend from 127.20 (2023 low). Decisive break of 151.89/.93 resistance zone will confirm this bullish case and target 61.8% projection of 127.20 to 151.89 from 140.25 at 155.50. However, break of 148.79 resistance turned support will delay this bullish case, and extend the corrective pattern from 151.89 with another falling leg.
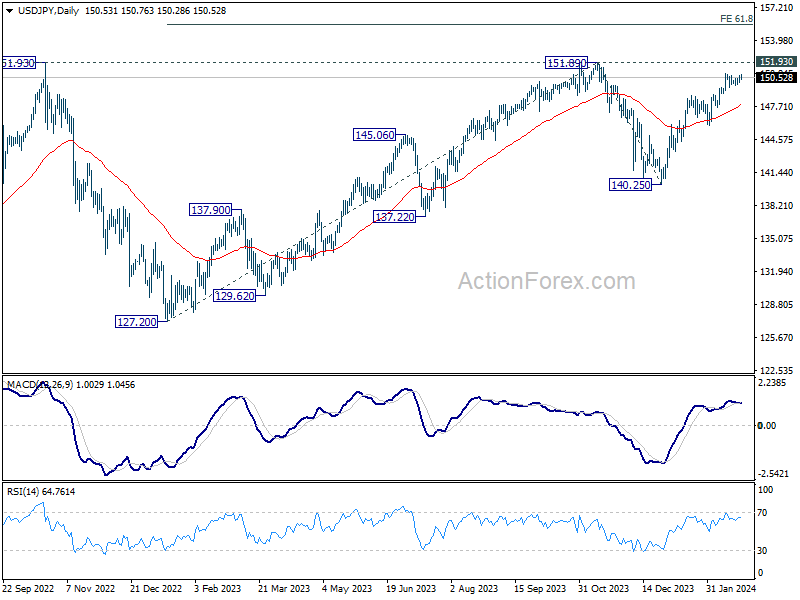
In the long term picture, as long as 125.85 resistance turned support holds (2015 high), up trend from 75.56 (2011 low) is still in favor to continue through 151.93 (2022 high) at a later stage.