Sample Category Title
WTI Oil: Oil Price Extends Weakness on Fading Fed Rate Cut Expectations
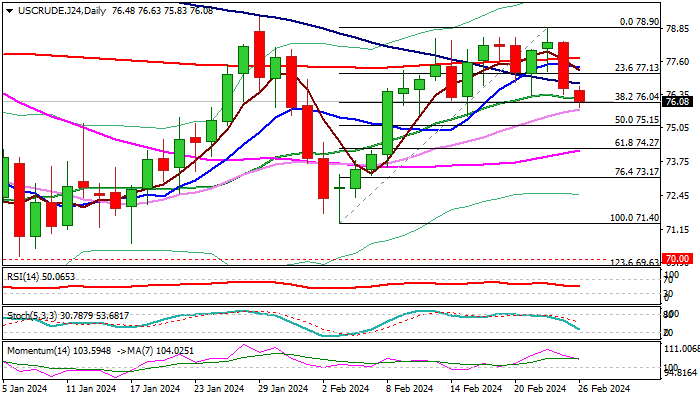
WTI oil price fell further in early Monday trading, in extension of Friday’s 2.2% drop, as the sentiment soured on signals that higher than expected US inflation may delay Fed rate cuts.
Fresh weakness emerged after several upside rejections and repeated failure to register a weekly close above important Fibo resistance at $78.13 (38.2% retracement of $95.00/$67.70 downtrend), which left a platform at $78.50/90 zone.
Near-term structure weakened as the price broke below a cluster of converged daily MA’s (200/10/100/ 20) and bullish momentum is fading, with formation of bearish engulfing pattern on weekly chart, adding to negative signals.
Bears cracked pivotal Fibo support at $76.04 (38.2% of $71.40/$78.90) with close below this level to further boost fresh bears for attack at $75.34/15 (daily Kijun-sen / 50% retracement) loss of which to confirm reversal.
Falling 10DMA ($76.75) offers solid resistance which should keep the upside protected and keep near-term bears intact.
Res: 76.99; 77.65; 78.50; 79.27.
Sup: 76.17; 75.81; 74.97; 74.12.
XAU/USD: Geopolitical Tensions Continue to Support Gold Price
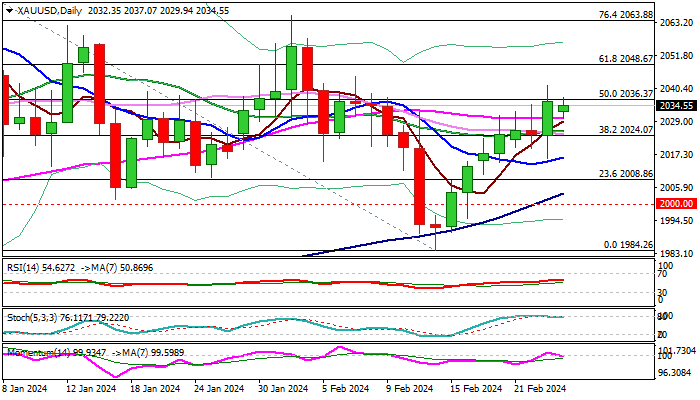
Gold stands at the front foot at the start of the week and holds near two-week high ($2041) posted on Friday.
Growing tensions in the Middle East and overall negative geopolitical picture, continue to fuel safe haven demand and boost metal’s price, along with neutral / negative near-term outlook for the US dollar.
Technical picture on daily chart is improving, as moving averages turned to full bullish configuration, though overbought stochastic and flat momentum requires caution.
Last week’s gains completed reversal pattern on weekly chart, adding to positive signal, which looks for verification on sustained break of cracked $2036 pivot (50% retracement of $2088/$1984 / 10WMA).
Near-term bias is expected to remain with bulls while the price stays above $2024 (daily Kijun-sen / broken Fibo 38.2%) and keep in focus next target at $2048 (Fibo 61.8%), guarding $2065 (Feb 1 high).
Markets await release of key US economic indicators this week (Q4 GDP on Wednesday and PCE price index on Thursday) which are expected to provide more details about Fed’s next steps regarding interest rates and generate fresh direction signals.
Res: 2041; 2048; 2057; 2065.
Sup: 2024; 2016; 2008; 2003.
NZD/USD Technical Analysis: Bearish Start To News-heavy Week
After 8 consecutive days of growth, the price of NZD/USD is forming a bearish candle this morning, thereby indicating possible concerns among market participants at the beginning of a week full of important economic news:
→ On Wednesday, at 4:00 GMT+3, the RBNZ decision on interest rates will be published. There will also be a press conference by the leadership of the Central Bank.
→ On the same day, at 16:30 GMT+3, news about US GDP is expected.
→ On Thursday, at 16:30 GMT+3, inflation data in the United States will be published, namely Core PCE Price Index GMT+3.
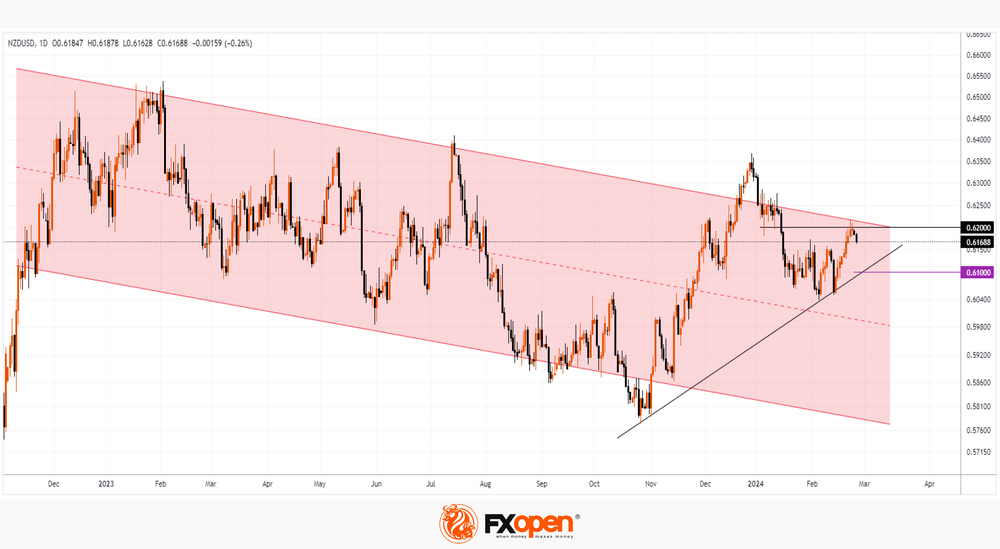
Note that in 2023, the NZD/USD price behaved bearishly, forming a downward channel (shown in red).
Technical analysis of the NZD/USD price chart provides confirmation of bearish sentiment in the form of a test of the 0.62 level — which showed support in early January and now appears to be resisting.
If the news acts as a driver for downward momentum:
→ the price of NZD/USD may fall towards the trend line shown in black. It is enhanced by the psychological level of 0.61.
→ This could result in a strategic reversal downwards from the area where the upper border of the red channel lies.
Be prepared for spikes in volatility throughout the week.
Trade over 50 forex markets 24 hours a day with FXOpen. Take advantage of low commissions, deep liquidity, and spreads from 0.0 pips. Open your FXOpen account now or learn more about trading forex with FXOpen.
This article represents the opinion of the Companies operating under the FXOpen brand only. It is not to be construed as an offer, solicitation, or recommendation with respect to products and services provided by the Companies operating under the FXOpen brand, nor is it to be considered financial advice.
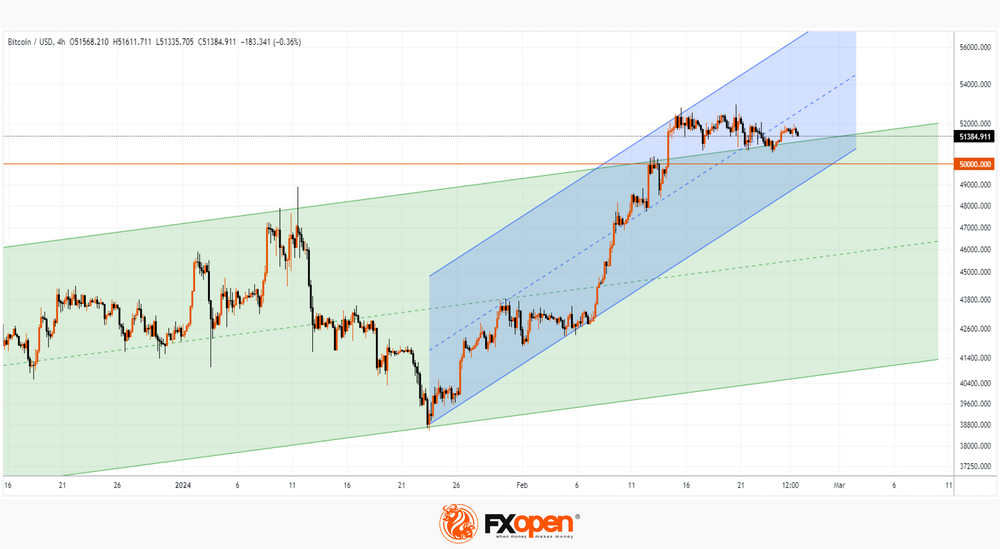
Bitcoin Price Risks Not Staying above $50k
On February 14, a strong bullish impulse was recorded in the BTC/USD market, which pushed the price of bitcoin to the area above USD 50k.
The main driver of growth was the effect of the launch of a bitcoin ETF. More than a month has passed since this event, and according to media reports, the ETF has seen an influx of more than USD 7 billion. For example, BlackRock has about 125k bitcoins on its balance sheet to support its ETF fund.
Also adding to the positive mood among market participants is news about the benefits received by companies that invested in bitcoin: MicroStrategy, Block and others. Among the latest news is Reddit's decision to invest in bitcoin.
However, technical analysis of the BTC/USD chart shows alarming signs:
→ bitcoin price has slightly exceeded the upper limit of the larger ascending channel (shown in green), but how does it behave in tests? The upper border has changed its role from resistance to support (according to the classic technical analysis pattern), but rebounds from this support line quickly lose momentum. The price does not seem to have the energy (force of demand) to rise from the existing support level.
→ Bitcoin price dropped to the lower border of a smaller ascending channel (shown in blue) - a sign that the February positive is running out.
Given the signs of weakening demand, it is possible that we will see an attempt by the bears to take the initiative and return the price of bitcoin below the psychological level of 50k per coin.
FXOpen offers the world's most popular cryptocurrency CFDs*, including Bitcoin and Ethereum. Floating spreads, 1:2 leverage — at your service. Open your trading account now or learn more about crypto CFD trading with FXOpen.
*At FXOpen UK and FXOpen AU, Cryptocurrency CFDs are only available for trading by those clients categorised as Professional clients under FCA Rules and Professional clients under ASIC Rules respectively. They are not available for trading by Retail clients.
This article represents the opinion of the Companies operating under the FXOpen brand only. It is not to be construed as an offer, solicitation, or recommendation with respect to products and services provided by the Companies operating under the FXOpen brand, nor is it to be considered financial advice.
EUR/USD Going Nowhere North of 1.08
Markets
Fed governor Waller’s “What’s the rush?” got a European follow-up. ECB members on Friday hijacked the news by similarly advising against jumping the gun in terms of rate cuts. The economy may be not as surprisingly resilient as the US’, the European labour market is. Many governors, both doves and hawks, pointed at the outcome of Q1 wage negotiations as key and suggested June as the earliest occasion to lower rates. Because that meeting precedes the Fed’s, July is still in the running as well. Centeno from Portugal was the exception to the rule, saying that the ECB should at least be open for a move in March. The slew of comments did not prevent core bond yields from declining going into the weekend. German rates eased between 5.2-7.7 bps with the belly outperforming. US yields dropped 2.1 (2-y) to 8.6 (30-y) bps in a technically driven session. Lower rates failed to inspire equity markets. After stellar Nvidia earnings triggered another blistering rally on Thursday, most indices steadied around their recent/all-time highs. Currency markets were a spa resort with the dollar nor the euro choosing direction. Sterling gained marginally.
We’re looking at a very quiet start of the week in Asian markets this morning. Equities trade mixed. Futures point at a lower open in both Europe and the US as stocks look for new catalysts now the earnings season basically ended. The economic calendar this week fortunately contains some potential impetus. PCE deflators in the US (Thursday) are worth mentioning as they are the Fed’s preferred inflation gauge. Despite strong expected m/m readings (0.3% headline, 0.4% core), the yearly figures should have eased further in January, be it only gradually (especially for the core gauge). CPI’s earlier this month, if any, suggest upside risks. February CPI in the euro area (Friday, after national readings in the run-up) could drop to 2.5% y/y even as monthly prices may jump a 0.6%. Strong negative base effects (which last through April) are the reason why. Similarly, core inflation is set for a drop sub 3%. Japanese inflation on Tuesday will be watched as the Bank of Japan’s window of opportunity to ditch negative rates/drop YCC is closing. Aside from some price data, the US publishes durable goods orders on Tuesday as well as the manufacturing ISM on Friday. The latter is seen extending the bottoming out process that started in November (49.5 from 49.1). We expect both bond and currency markets to display technically insignificant moves in the run-up to these data. The US 10-y yield is nearing first intermediate support around 4.18%. The German one is set for a lower open with 2.29% acting as support parallel to the US. EUR/USD is going nowhere north of 1.08.
News & Views
Rating agency Fitch raised the outlook on the Czech Republic’s AA- rating from negative to stable. Fitch praises the country for successfully navigating pandemic and energy price shocks without lasting effects on the long-term macro outlook. Short term growth nevertheless took a hit (-0.4% in 2023) and will only slowly recover (1.2% in 2024). The nation significantly reduced reliance to Russian gas imports, diverging to Norwegian supply or LNG terminals in the Netherlands and Germany. Fiscal consolidation measures have stabilized general government debt/GDP. Fitch expects the budget deficit to narrow to 2.3% of GDP in 2024 and 2% in 2025 from 3.3% in 2023. Public debt/GDP should be broadly stable at 44.6% in 2024, from 44.2% expected in 2023, and to gradually decline to 44.1% in 2027, driven by narrowing primary budget deficits. The inflation shock has not led to a permanent de-anchoring of inflation expectations with credible monetary policy pulling headline CPI within the CNB’s target range this year and next.
Bloomberg reports that the ECB is close to agreeing on a new monetary framework which they hope will open to door for an ultimate revival of the interbank market. The design under consideration will allow the ECB to operate with a smaller balance sheet and still deliver stable funding conditions for banks. It is envisaged to rely on bond holdings and bank loans to provide sufficient liquidity. A structural bond portfolio is seen providing a portion of the necessary funding, though not enough to fulfill banks’ needs entirely. In addition, banks will be able to participate in refinancing operations, with durations anticipated to be similar to offerings over the past years. It will take the ECB at least two years to transition into the new system as excess liquidity evaporates from financial markets, according to sources who believe that the central bank is still on track to announce results in the spring.
USD/JPY: All Eyes on Japan’s Core-Core Inflation Tomorrow
- Japan’s core-core CPI for January 2024 is expected to come in soft at 3.2% y/y versus 3.7% y/y in December 2023.
- Leading economic indicators, Japan’s Consumer Confidence, and Average Cash Earnings of employees suggest a more potentially upbeat core-core inflation rate for January 2024.
- Watch the 150.70 key short-term resistance of USD/JPY with near-term support at 149.60.
In the past month, the movement of the USD/JPY has inched higher by +364 pips (+2.48%) on a month-to-date basis as of today, 26 February 2024 at this time of the writing.
The recent strength of the USD/JPY printed an intraday high of 150.88 on 13 February (ex-post hotter than expected US CPI print for January 2024) has prompted key Japanese officials from the Ministry of Finance (MoF) to issue a slew of verbal interventions to talk down the US dollar strength against the JPY as the USD/JPY has been trading a few whiskers away from a key technical resistance level of 151.95 where prior bulls have been rejected on 1 and 13 November 2023 that led to a sell-off of -7.7% to print an intraday low of 140.25 on 28 December 2023.
In addition, market participants are likely to have a “fearful” recency bias at around the 151.95 level of the USD/JPY where the Bank of Japan (BoJ) under the instructions of MoF intervened in the foreign exchange market “vigorously” via the sale of US dollars on 21 October 2022 after the USD/JPY hit an intraday high of 151.95.
USD/JPY came in top on a one-month rolling performance
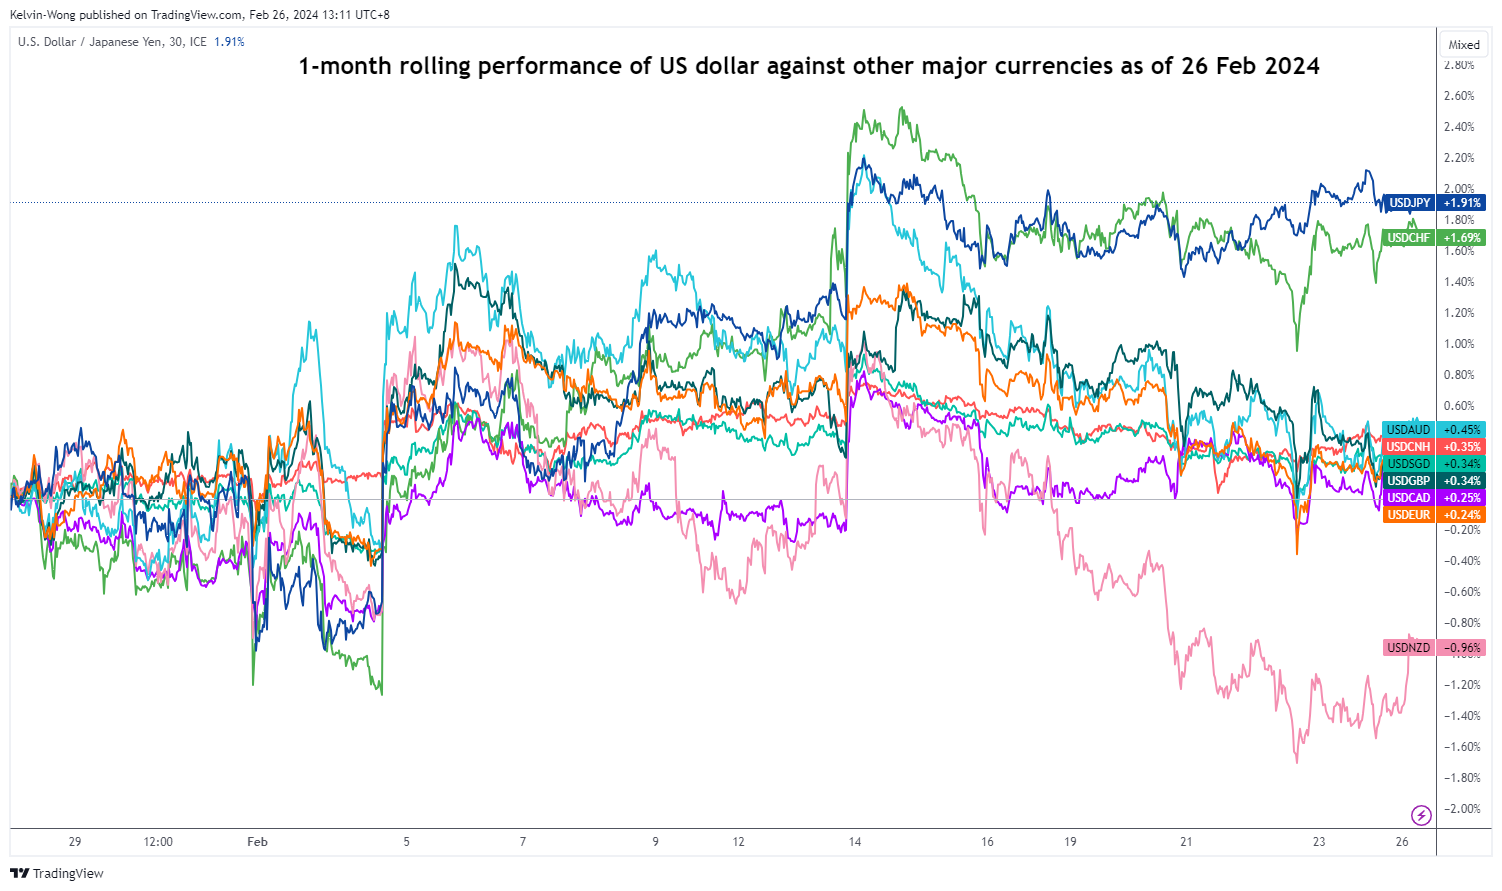
Fig 1: 1-month rolling performance of USD against other major currencies as of 26 Feb 2024 (Source: TradingView, click to enlarge chart)
So far, the US dollar has been the top performer against the JPY on a one-month rolling basis where the USD/JPY recorded a gain of +1.9% versus other major currencies (see Fig 1). The primary focus now will be on the release of Japan’s nationwide inflation data for January 2024 especially on the demand-pull sensitive core-core inflation rate (excluding fresh food and energy) that BoJ monitors to gauge where Japan has exited from its persistent 25-year long of deflationary environment.
Japan’s core-core inflation (y/y) growth has remained above BoJ’s inflation target of 2% since November 2022 and printed a 42-year high of 4.3% y/y in September 2023. It has started to soften to 3.7% y/y in December, and the forecast by Trading Economics expects another soft print of 3.2% y/y in January 2024.
Consumer Confidence & Average Cash Earnings may point to a more upbeat core-core CPI growth rate
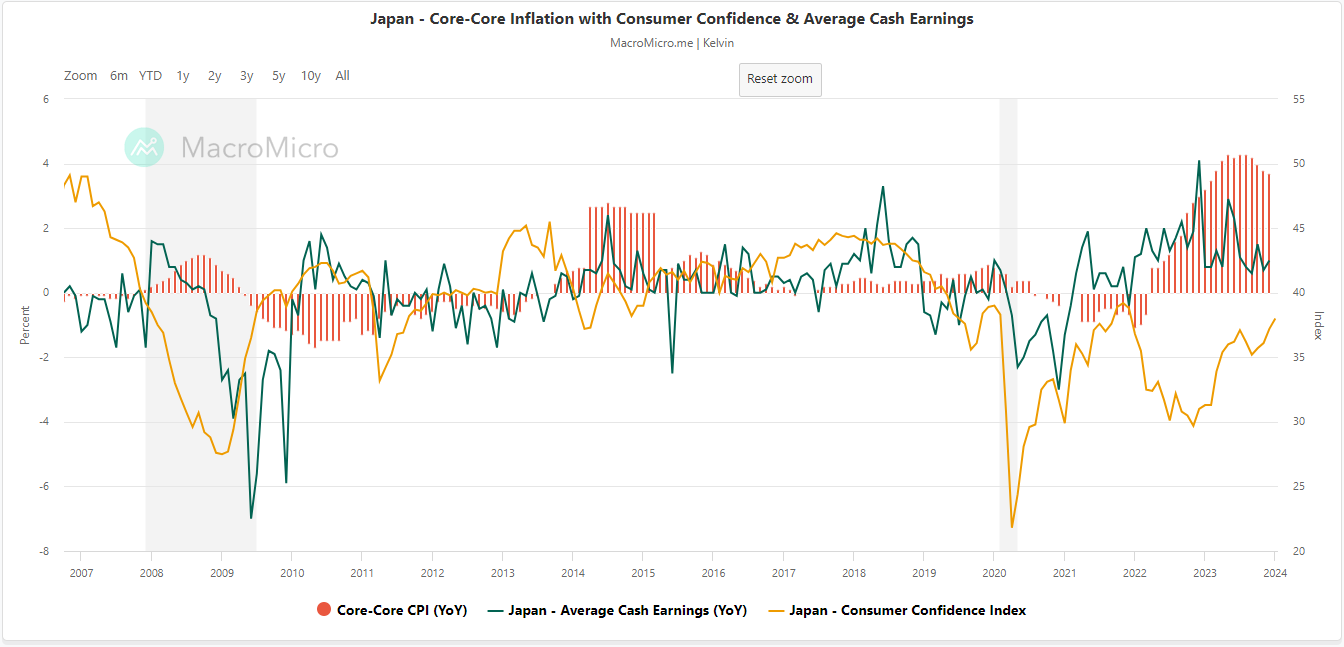
Fig 2: Japan’s core-core CPI with Consumer Confidence & Average Cash Earnings as of Jan 2024 (Source: MacroMicro , click to enlarge chart)
Since core-core inflation is more driven by demand-pull factors such as consumer spending, thus we can monitor and track the movement of the 2 key leading economic indicators that are related directly to consumer spending; consumer confidence and average cash earnings of Japanese employees (y/y)
By overlaying Japan’s consumer confidence and the average cash earnings of Japanese employees with Japan’s core-core inflation (CPI), we can see that their long-term trends are moving in synch with consumer confidence and average cash earnings leading over core-core inflation when they grew (for example during the periods of April 2011 to September 2013, and most recently from February 2022 to February 2023) (see Fig 2).
The latest data on consumer confidence for January has remained resilient as it staged a further advance to 38 from 37.2 in December 2023, its highest reading since December 2023.
In addition, the recent soft patch seen in the growth rate of average cash earnings started to stabilize in January where it increased slightly to 1% y/y from 0.7% y/y in December 2023.
Hence, January’s core-core inflation print for Japan may come in better than expected and is likely to keep the imminent removal of short-term negative interest rates in Japan on track during the next BoJ’s monetary policy on 26 April which in turn may put a cap on the recent US dollar strength against the JPY.
150.70 key short-term resistance to watch on USD/JPY
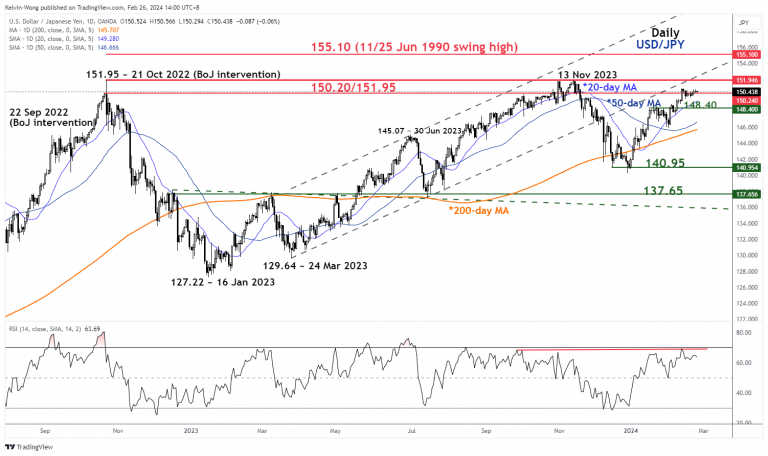
Fig 3: USD/JPY medium-term trend as of 26 Feb 2024 (Source: TradingView, click to enlarge chart
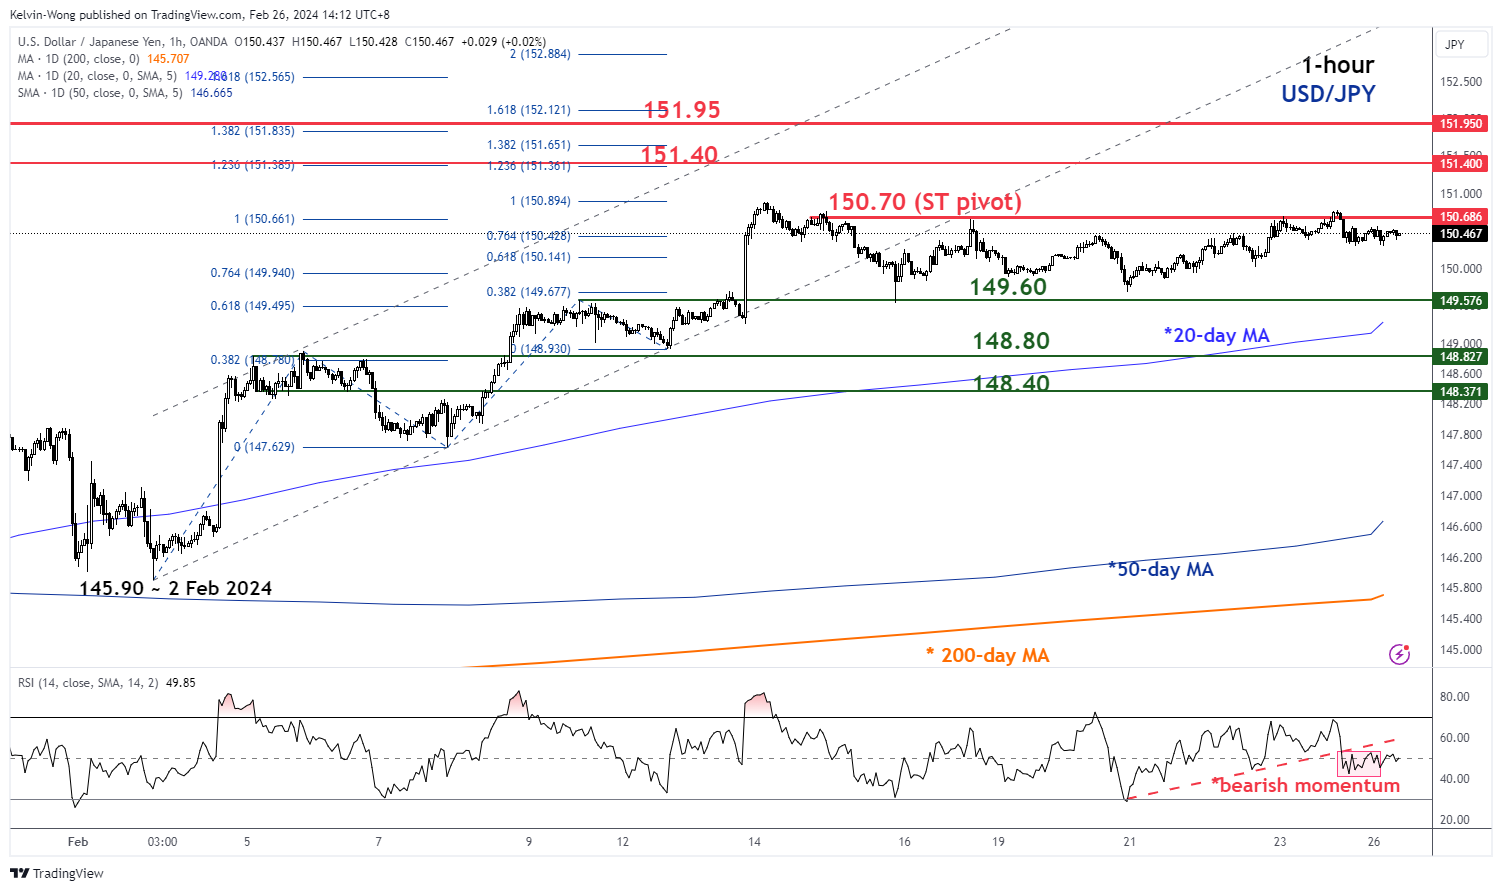
Fig 4: USD/JPY short-term trend as of 26 Feb 2024 (Source: TradingView, click to enlarge chart)
The recent short-term rally from the 2 February low of 145.90 seems to have stalled as the price actions of USD/JPY have failed to make any tailwinds above 150.70 since 16 February.
The short-term hourly RSI momentum indicator has recently broken down below its parallel former ascending support last Friday, 23 February which indicated a potential resurgence of short-term bearish momentum.
Watch the 150.70 key short-term pivotal resistance of USD/JPY and a break below 149.60 exposes the next intermediate support zone of 148.80/40.
On the other hand, a clearance above 150.70 invalidates the bearish tone for a squeeze-up to see the major resistance zone coming in at 151.40/95.
Attention Shifts to Economic Data
Even though we saw some consolidation on Friday following a significant rally during the week, last week ended on a great note for the major US, European and Japanese stocks. Many major indices hit ATH levels after Nvidia reported blowout quarterly results. This week starts with the relief that there is not a major fireball that could fall in the middle of the market and wreak havoc across the financial markets. Nvidia was pointed as one thing that could possibly go wrong. And not only did it not go wrong, but it did go very well, on the contrary. But consolidation wouldn’t be a bad thing, given that the S&P500, for example, is still trading very close to the overbought market conditions, and at ATH levels.
It’s important to keep in mind that while everybody was watching Nvidia with their stomachs in their mouth - and the broad-based stock rally that followed its earnings, the US yields were gently drifting higher. The 2-year yield hit 4.75% last week, and the 10-year yield hit 4.35% before falling back to around 4.22% this morning. Higher yields – which are the result of the delayed rate cut expectations are not necessarily good for stock valuations, but the negative correlation between the yields and the technology stocks has significantly softened. Technology stocks go where they want to go regardless of the Fed expectations. That could change when the news flow from earnings slow and attention shifts toward the economic data and to Fed again, but there is no short interest against the Magnificent 7, investors are not willing to play against the tech giants that are clearly surfing on the AI rally, no matter where the Fed goes with its rates.
This week, investors’ attention will gently shift from earnings to economic data. At this point, the US economy has been resilient and the latest uptick in the CPI data helped investors understand that the Fed will not be cutting its rates any time before summer. The first Fed cut expectation is seen coming by June, with a little less than 70% probability and the Fed is seen cutting the rates by 80bp this year. Also due this week, the latest US GDP update – due Wednesday - is expected to confirm a 3.3% growth in Q4, with significantly lower price index. And on Thursday, the PCE data are expected to confirm relatively soft figures – softer than the CPI, most probably thanks to the different weights that the index attributes to different categories of goods and services. In all cases, a strong growth could revive the goldilocks optimism if inflation numbers continue to trend lower. For the market rally to continue, we just need strong growth and soft inflation data from the US. Easy, no?
Elsewhere, the Reserve Bank of New Zealand (RBNZ) will announce its latest policy decision on Wednesday and is expected to keep its rates unchanged at 5.5%. There are some rising rumours regarding the possibility of a rate hike from the RBNZ this week, but I believe that the Kiwis will simply warn that more policy tightening cannot be ruled out without however taking a concrete action this week. If they did, that could eventually weigh on broad market sentiment. Yet, that’s a tail risk. Other than that, Europeans will release their latest inflation updates throughout the week. Both headline and core figures are expected to have further eased below the 3%. Softening European inflation – if coupled with strong US growth – could keep the EURUSD under pressure near its 200-DMA. Even though European Central Bank’s (ECB) Holzmann said last week that he doesn’t see euro-area cut rates before a Fed move, the euro-area officials should face the fact that their economies are doing nowhere near the US’. Of course, the ECB cannot act alone, because a too early rate cut compared to the Fed would dampen the euro’s valuations against the US dollar and fuel inflation – something that no one wants to happen. But fundamentally, the Europeans are in a better position to start cutting first and I continue to believe that the EURUSD deserves more to depreciate against the greenback at the current levels than the contrary.
Euro Inflation Key Market Mover This Week
In focus today
The Hungarian parliament is expected to vote to ratify Swedish NATO Membership.
Early Tuesday we get Japanese inflation data for January. With Japan in technical recession, it will be interesting to see if also inflation data will further complicate a potential rate hike decision from the Bank of Japan. January Tokyo inflation data suggested price pressures eased significantly.
In the remainder of the week focus will be on inflation euro area Flash CPI for February Friday and US PCE inflation for January, which is released on Thursday. We expect the euro area CPI to still be well behaved measured on monthly momentum in the core CPI, which the ECB is watching closely. We also get unemployment data for the euro area on Friday. Friday we will also have US manufacturing ISM and China manufacturing PMI. Tuesday the Central Bank of Hungary will release its rate decision, while the Reserve Bank of New Zealand will release its cash rate decision on Wednesday.
Economic and market news
What happened over the weekend
In the US, Donald Trump took an expected but nevertheless big win with 60% of the votes in the race to become republican nominee at the US presidential election by defeating his only opponent in the race Nikki Haley in her home state South Carolina. Haley vowed to stay in the race, even though experts seem to agree that a comeback in the race is now very unlikely. Tuesday this week the primaries continue to Michigan. The following Tuesday 5 March is the so-called Super Tuesday where primary elections will be held in fourteen states and one Caucasus in one day.
Also in the US, President Joe Biden issued new sanctions against Russia in response to the death of opposition politician Alexei Navalny last week. Biden called the sanction package the largest since Russia invaded Ukraine exactly two years ago on Saturday. The sanctions are aimed at industries and people who supported Russia's war efforts and commodity exports. The Biden administration is planning further sanctions with international partners - including the EU, where new sanctions on 200 companies and persons were also announced on Friday.
In Germany, the Ifo index showed improved business confidence in January due to a more optimistic outlook. Sentiment about current business conditions remained at low levels. The final GDP print for Q4 confirmed that activity in the German economy fell 0.3% q/q.
The European commission president Ursula Von der Leyen announced on Friday that EU will start 'unfreezing' Poland's EUR137bn in frozen EU funds this week. The decision comes amid efforts by Poland's newly elected government under Pro-European prime minister Tusk to restore the independence of the judiciary system.
Equities: Global equities were marginally higher Friday but worth noticing, we had yet another week with equity gains and several all-time highs. The earnings report for Nvidia received a lot of attention, but please note that gains were very broad-based, and industrials were the best performing sector last week. Higher-for-longer is still the dominating narrative and small caps was last week's loser in relative space, gaining only 0.2%. In US on Friday, Dow +0.2%, S&P 500 +0.03%, Nasdaq -0.3%) and Russell 2000 +0.1%. Asian markets are mixed this morning with the Japanese market continuing higher while Chinese shares are about to break the 9-day gaining streak. Futures in Europe and US are lower this morning.
FI: Long-end yields trended lower in Friday's session following a string of relatively optimistic statements from various ECB speakers on wages. 10Y Bund yields ended the day down by 8bp, with the German curve flattening from the back, while peripheral bonds fared slightly better than core EGBs. German ASW spreads fell marginally across tenors. Long-end yields also headed lower in the US, where 10Y UST yields closed down by 7bp at 4.24%. The pricing of rate cuts in 2024 for the ECB and the Fed is now 100bp and 78bp, respectively.
FX: Last week was characterized by positive risk appetite in markets, which led to the first weekly decline of the USD this year, bringing EUR/USD above the 1.08 mark. NZD, SEK, and GBP were the top performers in the G10 space, while CAD, JPY, and NOK were on the other side of the spectrum. In Denmark, banks' net position dropped by DKK 2bn more than projected on Friday, but it will need to drop significantly more in the coming weeks for EUR/DKK FX swaps to start to move.
What to Look For From RBNZ This Week
- This week's Monetary Policy Statement could be the most contentious in a while.
- We think the OCR will remain unchanged and stay unchanged for 2024.
- The key issue is whether the RBNZ is considering a change in monetary policy strategy – is it still a 5.5% OCR for longer approach or do rates need to go higher?
- The key will be what level of inflation the RBNZ is comfortable with in H2 2025?
- As will judgements on the persistence of non-tradables inflation and the importance of current weak economic momentum.
Does the RBNZ want to change horse?
This week's February Monetary Policy Statement is one of the most anticipated OCR reviews since late 2022, when the RBNZ kicked off a further boost in the OCR from the then 3.5% towards the current 5.5% level. Right now, there is considerable divergence in views about the economic outlook and future path of interest rates. Our report last week canvassed the arguments supporting both hawkish and dovish perspectives.
Our preview discussed our view on what we expect at the Statement. Given our assessment of the recent data flow and the implications for the medium-term inflation outlook, we think the OCR will remain unchanged. And if the economy remains on its current trajectory, we expect the RBNZ to leave the OCR unchanged throughout 2024. But it is possible that the RBNZ might view the data differently to us or that it may change its approach even if they view the data the same as we do.
The key issue is whether the RBNZ will adjust it's strategy for the OCR for the year ahead. Since May 2023, the RBNZ has signalled an OCR at 5.5% for longer strategy when confronted with information suggesting sticky core inflation pressures and labour market resilience. Rate increases have not been ruled out in recent meetings, but there has been a preference from the RBNZ to extend the period where the OCR is held as opposed to tightening further. Some commentators have suggested this strategy will now change and market pricing reflects this to some extent. So, what should we be looking for in determining whether those commentators are merely jumping at shadows or whether there really is a change in RBNZ strategy coming sooner or later? This note discusses the main things we will be looking for in the RBNZ's commentary this week as we assess what the RBNZ's strategy will be going forward.
Obviously, the OCR change itself is a key metric!
In terms of outcomes of this meeting, it seems likely that the options open to the RBNZ are either no change or a 25bp increase – a surprise easing doesn't seem on the cards right now. But the key questions to ask are:
- If it's no change, does that signal comfort with the medium-term outlook or are there signs that either (a) a tightening is coming soon or (b) the RBNZ is prepared to further push out the period over which the OCR stays at 5.5%?
- If it's a 25bp increase to 5.75% then how much more tightening should we expect and when?
Where's the neutral OCR?
The level of the neutral rate could be a key driver of their strategy and their forward OCR profile. The RBNZ has made 25bp adjustments up at the last two Statements, but the neutral rate still sits at a relatively low 2.5%. They could be in the process of moving this up towards 3-3.5% (our own terminal level is 3.5%).
This judgement is not a technical modelling issue independent of how the MPC sees the stance of policy. It might make sense for them to further adjust the neutral rate higher if they judge that inflation is remaining stickier than expected at the current OCR (although the weak economy might give them pause on coming to that view).
But this assumption is a key driver of where the MPC sees the OCR ultimately going over time which will drive the medium to longer term OCR profile they publish. While we have little confidence anyone really knows where the neutral OCR is this judgement will give us a read on how large an eventual easing cycle to expect – all else equal. It matters less for what policy does in the next six months.
What is the desired level of CPI inflation in late 2025?
We think this is the critical judgement as views on this divide the hawks and doves. Can the MPC wait for the 5.5% OCR to do the job (the RBA approach)? In November, the RBNZ indicated the objective is to achieve 2% CPI inflation in H2 2025. Can the RBNZ go down the route of the RBA and allow more time for inflation pressures to subside? We are doubtful on this given the recent changes to the RBNZ's mandate that focus it on inflation more squarely. But if the MPC sees room to wait and push out the time when the mid-point can be achieved, then this would be significant and allow for sooner cuts (and kill off tightening expectations).
The shape of the OCR forecast profile.
Even if the OCR doesn't change, the MPC might still signal a change of strategy through the forward OCR profile. We can see a case for the RBNZ rattling the sabre but is it ready to strike on any provocation? If the RBNZ brought forward or increased the OCR peak in Q2 2024 then this tells us future tightening risk is real. Pushing the OCR profile down or back tells us the MPC still sees the OCR at 5.5% for longer as the preferred strategy. Similarly, pushing the peak OCR out and pushing the cuts out is also consistent with an unchanged strategy.
But what about if the RBNZ increases the OCR? The issue here is how quickly will we see any follow up hikes? We don't think that one tightening requires a firm view that another tightening will be forthcoming. This really depends on how sure the MPC is on the outlook. Their confidence on that score will be signalled in the nearterm OCR profile. If it's steep, then a further increase in April will look likely. But if the MPC is not so sure then the forward profile will be flatter, indicating a preference to give the data more time to justify further movement (and on that score there is a lot more inflation available for the May Statement than in the April review).
An OCR profile showing more than one 25bp hike could be associated with a flat track after the last hike indicating a "higher sooner" strategy. In this case, the MPC could even consider bringing forward when the first cut could come.
The degree of concern on labour market adjustment.
As we noted last week, the labour market hasn't yet adjusted as quickly as the RBNZ expected. This has implications for the medium-term inflation profile. We will be looking for how much adjustment to the RBNZ's unemployment rate forecasts occur. Will the RBNZ keep the same peak unemployment rate (5.3%) or revise it down? Judgements here could tell us much about how much (if any) extra monetary policy work is required to get core inflation sustainably down.
The non-tradables inflation profile.
Does the RBNZ see as much near-term risk as Westpac (Q1 non-tradables 1.4% vs RBNZ November MPS 0.9%) and critically how persistent are these risks? We suspect OCR increases will be justified by increases in these forecasts if they occur.
Fiscal policy assessment.
What did the RBNZ take from the HYEFU and what is the bar required for Budget 2024 to forestall rate rises? The RBNZ wasn't relaxed about this issue in November. The HYEFU was worse than PREFU although it didn't include most of the new Government's policies. Since HYEFU perhaps the most significant policy change was the small minimum wage increase. Will fiscal policy help enough?
The housing market and migration assessment.
This was a key theme last time and came out of the blue. We tend to think we will see less focus this time – the data still shows plenty of newcomers, rents exploding, but the housing market looks quiet. This suggests there is enough uncertainty there to not focus on too much. But the MPC's take on the issue could drive things either way. A comforting observation is the RBNZ's scenario in the November MPS:
"The first scenario was one of persistent domestic demand strength supported by strong population growth, with increases in rents and aggregate consumption feeding into greater inflationary pressure and higher house prices."
But this scenario isn't really playing out. Population growth and rents pressures are persisting, but stronger demand and house prices do not seem evident in recent data. Instead, we've seen weak retail sales, flat house prices, and weak (possibly recessionary) GDP growth.
Commodity price improvements and implications.
In August 2023, the RBNZ saw significant downside risks to the domestic economy from weak global demand that was a factor supporting their view that a 5.5% OCR would prove sufficient. This risk has significantly receded – although remains to some extent. If we assume improving export sector incomes and global growth (supported by easier policy offshore) then how much does that matter for policy here?
Economic momentum and the output gap.
The RBNZ Chief Economist suggested the big downward revisions to past GDP reflected might reflect potential supply constraints (due to weak trend productivity) as well as weaker than expected demand. What was less clear was the RBNZ's judgement on the very weak Q3 2023 outcome and indications that Q4 was also weak. We think the RBNZ will take that onboard and could be a big reason they hold fire for now, or even take a slightly more sanguine view about the medium-term inflation outlook if they conclude that there is indeed more spare capacity in the economy than estimated previously.
Was there a vote at the MPC?
The MPC has once formally held a vote (in May 2023) as there was no consensus on the appropriate policy setting. A key indicator of uncertainty will be if we see this again. A decision not to change the OCR by unanimous vote would clearly be less hawkish than one in which there is dissent.
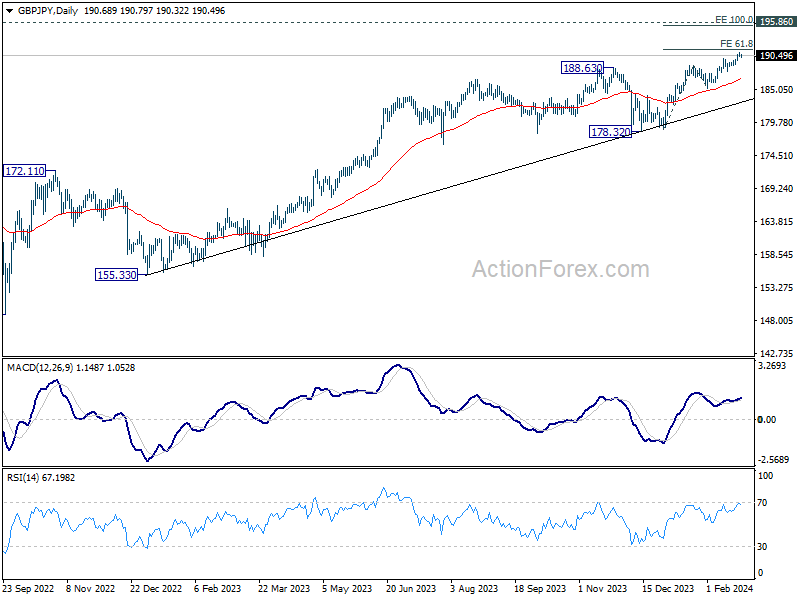
GBP/JPY Daily Outlook
Daily Pivots: (S1) 190.36; (P) 190.76; (R1) 191.11; More...
Intraday bias in GBP/JPY is turned neutral with current retreat, and some consolidations would be seen first. Downside should be contained by 188.90 resistance turned support to bring another rally. On the upside, firm break of 61.8% projection of 178.71 to 188.90 from 185.21 at 191.50 will extend larger up trend to 100% projection at 195.40.
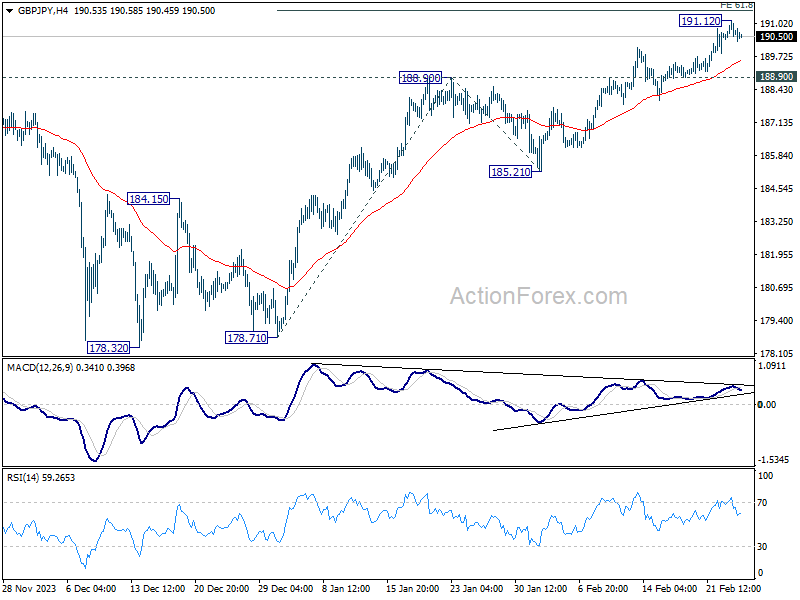
In the bigger picture, up trend from 123.94 (2020 low) is in progress. Medium term outlook will stay bullish as long as 178.32 support holds. Next target is 195.86 long term resistance (2015 high).