
Sample Category Title
EUR/AUD Daily Outlook
Daily Pivots: (S1) 1.6484; (P) 1.6522; (R1) 1.6548; More...
Intraday bias in EUR/AUD stays neutral and range trading continues. On the upside, decisive break of 1.6671 will revive the case that whole correction from 1.7062 has completed with three waves down to 1.6127. Further rally should then be seen to 1.6844 resistance for confirmation. Nevertheless, below 1.6455 minor support will turn bias to the downside for 1.6348 and possibly below.
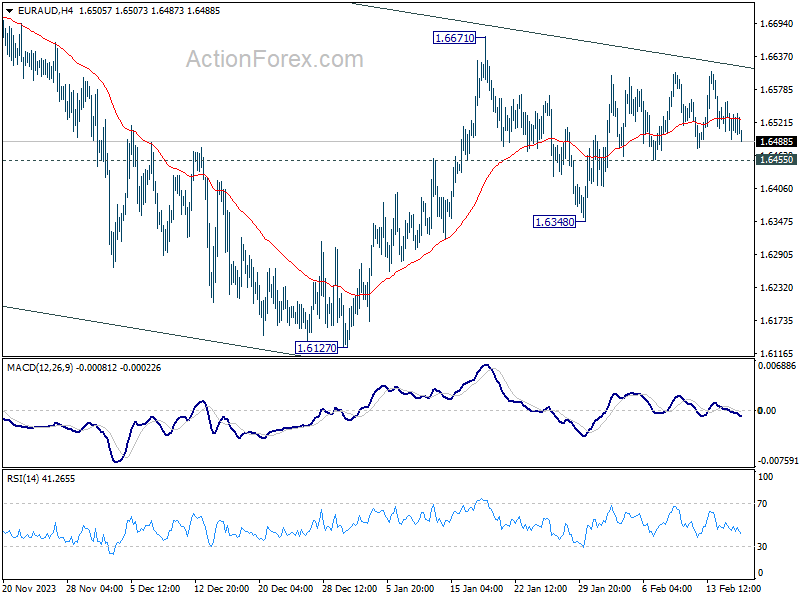
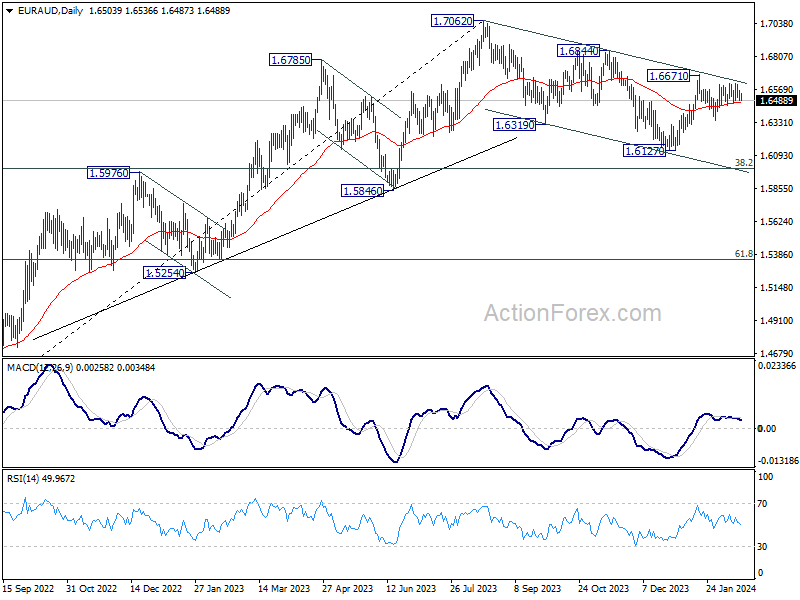
In the bigger picture, fall from 1.7062 medium term top is seen as a correction to the up trend from 1.4281 (2022 low). Break of 1.6844 resistance will argue that this up trend is ready to resume through 1.7062 high. In case of another fall, strong support should be seen around 1.5846 and 38.2% retracement of 1.4281 to 1.7062 at 1.6000 to bring rebound.
EUR/CHF Daily Outlook
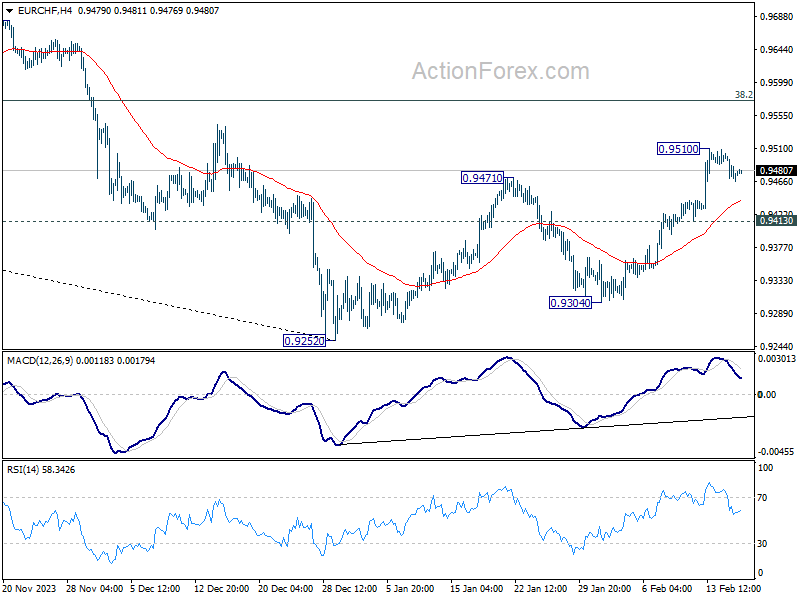
Daily Pivots: (S1) 0.9464; (P) 0.9485; (R1) 0.9501; More...
Intraday bias in EUR/CHF remains neutral and more consolidations could be seen below 0.9510. Downside of retreat should be contained by 0.9413 minor support to bring another rally. On the upside, break of 0.9510 will resume the rebound from 0.9252 and target 0.9574 fibonacci level and above.
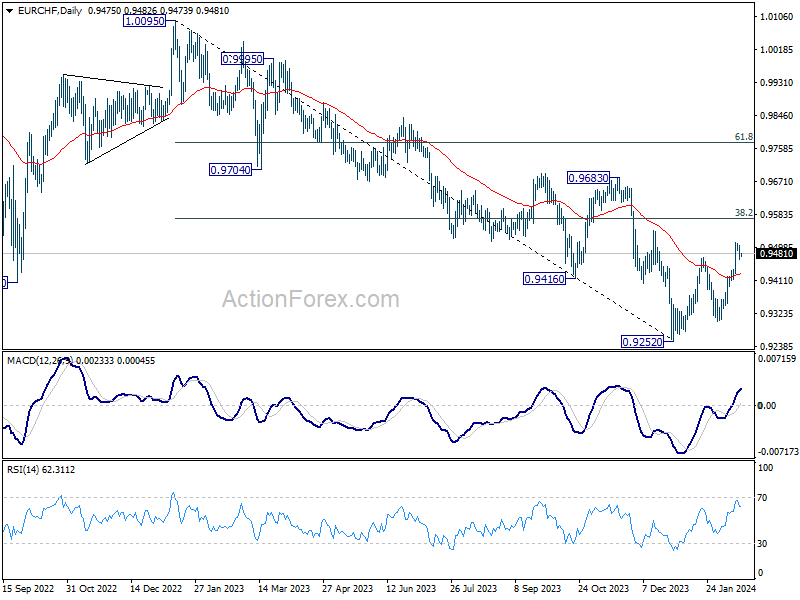
In the bigger picture, price actions from 0.9252 are tentatively seen as a correction to the five-wave down trend from 1.0095 (2023 high). Further rise would be seen to 38.2% retracement of 1.0095 to 0.9252 at 0.9574. But overall medium term outlook will remain bearish as long as 0.9683 resistance holds.
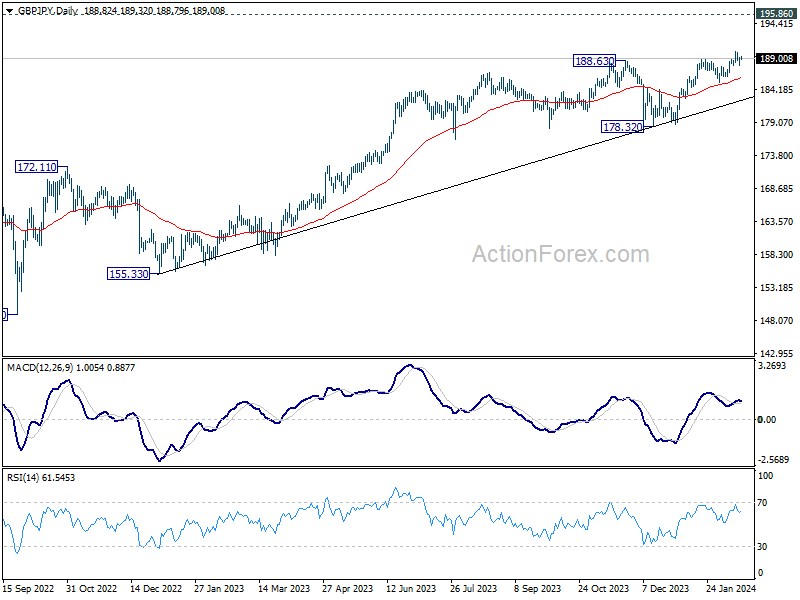
GBP/JPY Daily Outlook
Daily Pivots: (S1) 188.19; (P) 188.72; (R1) 189.44; More...
GBP/JPY is staying in consolidation below 190.05 and intraday bias remains neutral. On the upside, break of 190.05 will resume larger up trend. However, break of 187.83 will turn bias to the downside for deeper correction back to 185.21 support instead.
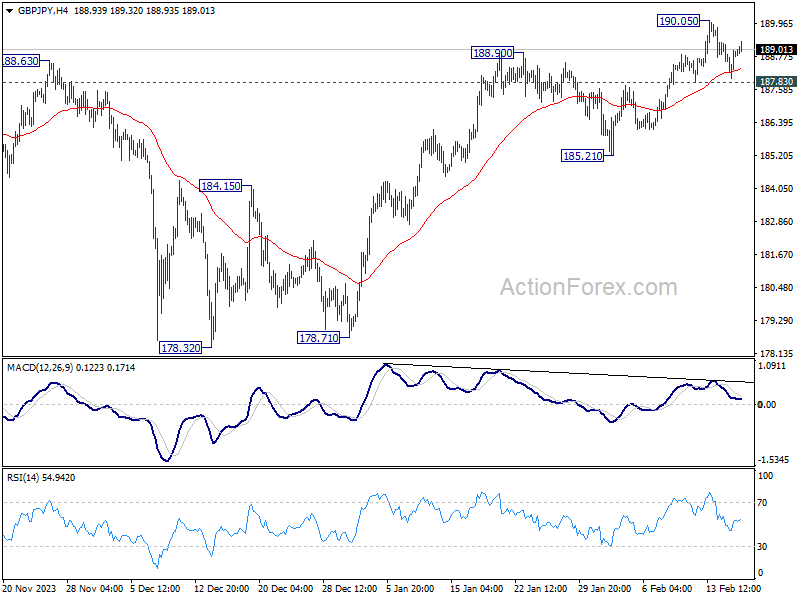
In the bigger picture, up trend from 123.94 (2020 low) in in progress. Medium term outlook will stay bullish as long as 178.32 support holds. Next target is 195.86 long term resistance (2015 high).
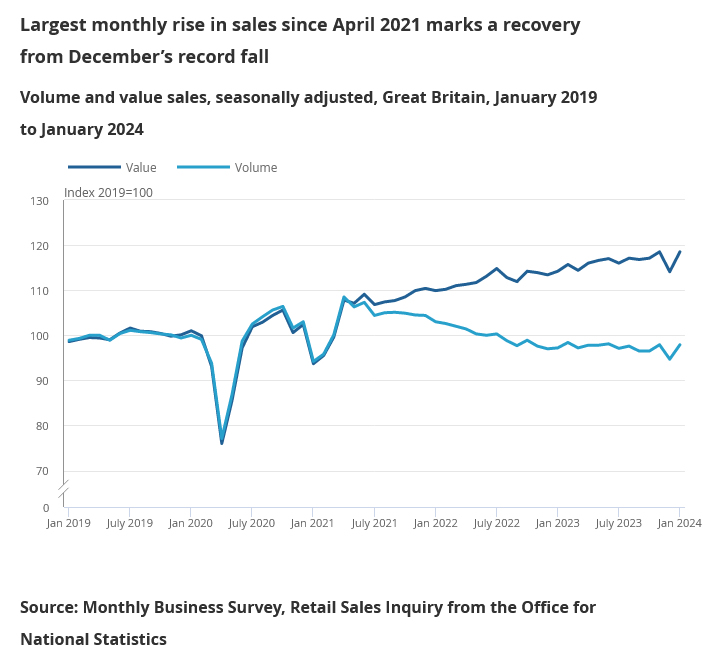
UK retail sales rises 3.4.% mom in Jan, largest since April 2021
UK retail sales volume rose 3.4% mom in January, well above expectation of 1.5% mom. That was the largest monthly rise since April 2021, reversing the deep decline of -3.3% mom in December.
Sales volumes in all subsectors except clothing stores increased over the month, with food stores such as supermarkets contributing most to the increase.
Sales value rose 3.9% mom, largest rise since January 2021. Sales volume rose 0.7%
EUR/JPY Daily Outlook
Daily Pivots: (S1) 161.14; (P) 161.37; (R1) 161.77; More...
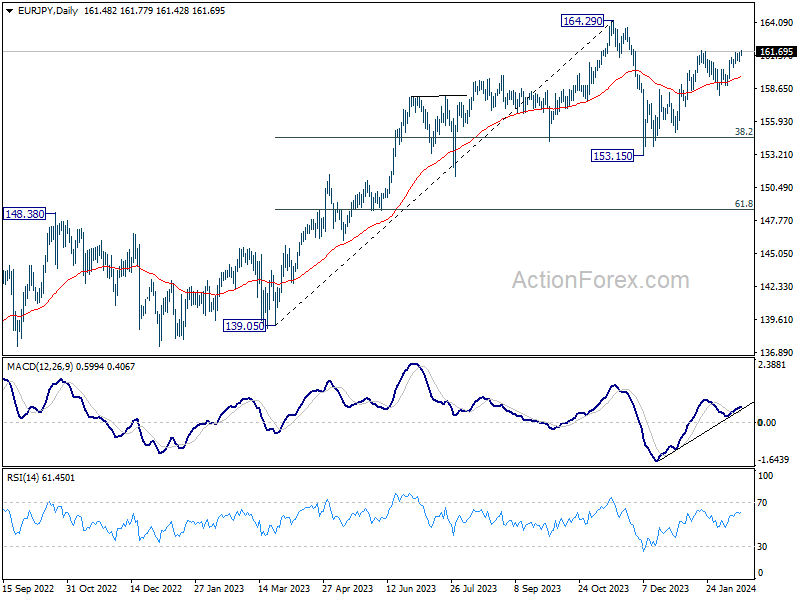
EUR/JPY's rally resume after brief consolidations and intraday bias is back on the upside. On the upside, firm break of 161.84 will confirm resumption of whole rise from 153.15. Next target is a retest on 164.29 high. On the downside, however, below 160.90 minor support will turn intraday bias neutral first.
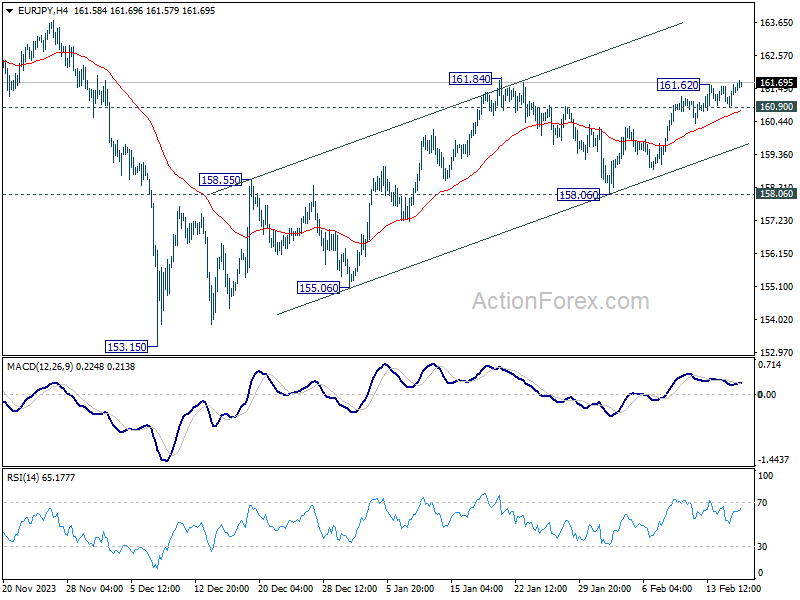
In the bigger picture, price actions from 164.29 medium term top are seen as a correction to rise from 139.05 only. As long as 148.38 resistance turned support holds (2022 high), larger up trend from 114.42 (2020 low) is expected to resume through 164.29 at a later stage. Next target would be 169.96 (2008 high).
Yen Dips as Nikkei Charges Toward Record High
Yen weakens mildly in Asian session today, contrasting with Nikkei's continued up trend towards historical high made in 1990. This development comes amidst diminishing impacts of Japanese officials' verbal interventions aimed at stemming Yen's decline. Without tangible policy measures to back these statements, the currency's depreciation has persisted. Meanwhile, Finance Minister Shunichi Suzuki's tone has softened a little bit, acknowledging the dual effects of its weakening, even though his major concerns are more on the negative side.
In the broader currency markets, Dollar remains the standout performer of the week, despite having a retreat in the US session overnight. Traders have shown hesitation in pushing the greenback through near term support levels against major peers, at least for now. Australian Dollar has risen to become the week's second strongest currency, followed by Canadian Dollar. New Zealand Dollar trails at the bottom, with Swiss Franc and Yen also facing behind. Euro and Sterling occupy intermediate positions, with British Pound giving up much ground after a series of mixed economic indicators this week.
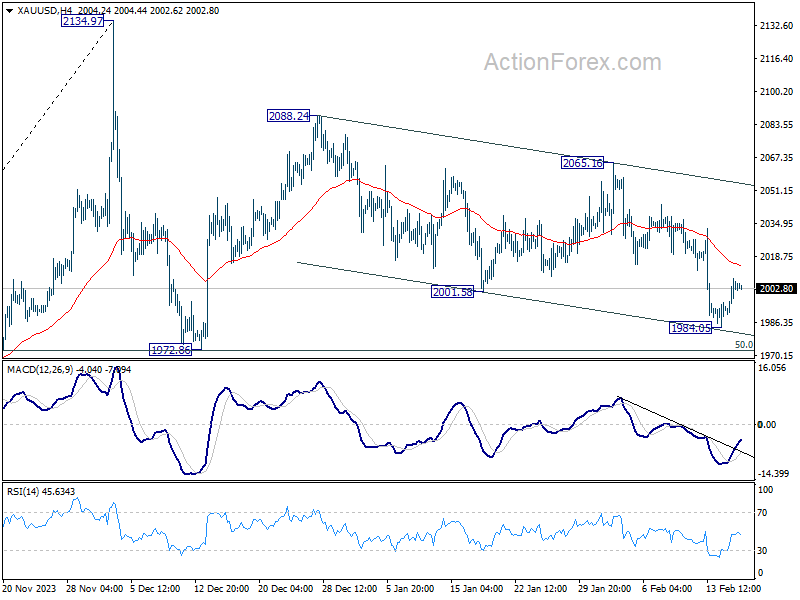
Technically, Gold resumed its near term fall to as low as 1984.05 this week on Dollar's rally. But it then recovered together with Dollar's pull back. Near term focus is back on 4H 55 EMA (now at 2014.77). Rejection by this EMA would likely push Gold through 1984.05, and even 1972.86 support to resume whole pattern from 2134.97. However, Sustained break of this EMA will argue that the decline from 2088.24 has completed in a three-wave correction structure. Near term outlook will then be turned bullish for 2088.24 and above.
In Asia, Nikkei closed up 0.86%. Hong Kong HSI is up 2.75%. Singapore Strait Times is up 1.36%. Japan 10-year JGB yield rose 0.0054 to 0.735. Overnight, DOW rose 0.91%. S&P 500 rose 0.58%. NASDAQ rose 0.30% 10-year yield fell -0.027 to 4.240.
Fed's Bostic: Robust economy allows for unhurried monetary easing without oppressive urgency
Atlanta Fed President Raphael Bostic noted there has been "substantial and gratifying progress" in reducing inflation's pace, but he warns against premature celebrations.
While inflation is expected to continue to decline, it would be "more slowly than the pace implied by where the markets signal monetary policy should be," Bostic said in a speech overnight.
With a "strong labor market and macroeconomy," Bostic highlighted the opportunity to deliberate policy shifts "without oppressive urgency".
BoE's Mann focuses on forward-looking indicators after last year's soft patch
BoE MPC Catherine Mann commented overnight on the -0.3% quarterly contraction in GDP for Q4 2023. She characterized this period as a "soft patch," adding that the downturn was anticipated and aligned with her expectations.
Rather than dwelling on past performance, Mann is directing her attention to forward-looking indicators, such as business surveys and PMIs, along with BoE's Decision Maker Panel. "Those are all looking good," she said.
However, Mann voiced ongoing concerns regarding the persistence of services price inflation in the UK, which she believes is more tenacious than in other advanced economies.
She added that decline in goods price inflation alone would not suffice to sustainably anchor consumer price inflation to the Bank's 2% target.
ECB's Scicluna: March could be it for rate cut
In an interview, ECB Governing Council member Edward Scicluna pointed to March economic projections as a crucial factor that could justify a shift in policy, opening the door for rate cuts. "March could be it," he suggested, "We'll see how many think that there's no need to wait for June."
Acknowledging the "bumpy" path toward achieving ECB's disinflation objectives, Scicluna emphasized the clear trend of declining inflation. "You should see the writing on the wall and admit objectively that the trend is going down," he stated.
Despite the possibility of justifying a hold on rate cuts due to various concerns, including geopolitical tensions, Scicluna argued for a more direct approach: "You have to make a judgment; you don't find these excuses."
"Let's face reality — of course, risks are flying all around us," he said. "But when you get a comprehensive look at things, prices are falling."
"At a time when demand is falling, I believe you can let off the pedal a bit," Scicluna said.
RBNZ's Orr stresses continued effort needed to anchor inflation expectations
In a forum today, RBNZ Governor Adrian Orr indicated that the central bank's primary challenge lies in firmly anchoring inflation expectations around the 2% target, a goal that remains elusive despite significant progress.
This "tail end" of the inflation fight, as Orr describes, requires meticulous attention to both "capacity pressures" within the economy and the public's "inflation expectation"s.
"We've got more work to do to have inflation expectations truly anchored at that 2% level, he added.
"We observe headline but we are targeting in a large sense core inflation," Orr stated, emphasizing the importance of these metrics in shaping the central bank's policy decisions.
NZ BNZ manufacturing rises to 47.3, still someway off to expansion
New Zealand BusinessNZ Performance of Manufacturing Index rose from 43.4 to 47.3 in January, hitting the highest level since June last year. Despite this uptick, it's important to note that the manufacturing sector remained in contraction for eleven straight months.
BusinessNZ's Director of Advocacy, Catherine Beard noted that while there are signs of improvement, "the sector is still someway off returning to expansion."
Looking at some details, production rose from 40.5 to 42.1. Employment rose from 47.0 to 51.3. New orders rose from 44.0 to 47.7. Finished stocks rose from 45.9 to 47.3. Deliveries rose from 43.7 to 49.3.
However, the persistence of negative sentiment among businesses cannot be overlooked. The proportion of negative comments in January rose to 63.2%, up from 61% in December and 58.7% in November, reflecting concerns over seasonal factors such as holiday disruptions and a sustained lack of demand or orders.
Looking ahead
UK retail sales is the main focus in European session. Later in the day, US will release PPI, housing starts and building permits, U of Michigan consumer sentiment. Canada will release wholesale sales.
EUR/JPY Daily Outlook
Daily Pivots: (S1) 161.14; (P) 161.37; (R1) 161.77; More...
EUR/JPY's rally resume after brief consolidations and intraday bias is back on the upside. On the upside, firm break of 161.84 will confirm resumption of whole rise from 153.15. Next target is a retest on 164.29 high. On the downside, however, below 160.90 minor support will turn intraday bias neutral first.
In the bigger picture, price actions from 164.29 medium term top are seen as a correction to rise from 139.05 only. As long as 148.38 resistance turned support holds (2022 high), larger up trend from 114.42 (2020 low) is expected to resume through 164.29 at a later stage. Next target would be 169.96 (2008 high).
Economic Indicators Update
| GMT | Ccy | Events | Actual | Forecast | Previous | Revised |
|---|---|---|---|---|---|---|
| 21:30 | NZD | Business NZ PMI Jan | 47.3 | 43.1 | 43.4 | |
| 04:30 | JPY | Tertiary Industry Index M/M Dec | 0.70% | 0.20% | -0.70% | -1.40% |
| 07:00 | GBP | Retail Sales M/M Jan | 1.50% | -3.20% | ||
| 13:30 | CAD | Wholesale Sales M/M Dec | 0.90% | |||
| 13:30 | USD | Building Permits Jan | 1.52M | 1.49M | ||
| 13:30 | USD | Housing Starts Jan | 1.47M | 1.46M | ||
| 13:30 | USD | PPI M/M Jan | 0.10% | -0.10% | ||
| 13:30 | USD | PPI Y/Y Jan | 0.70% | 1.00% | ||
| 13:30 | USD | PPI Core Y/Y Jan | 1.70% | 1.80% | ||
| 13:30 | USD | PPI Core M/M Jan | 0.10% | 0.00% | ||
| 15:00 | USD | Michigan Consumer Sentiment Index Feb P | 80 | 79 |
EURJPY Pullback Should Find Support for Further Upside
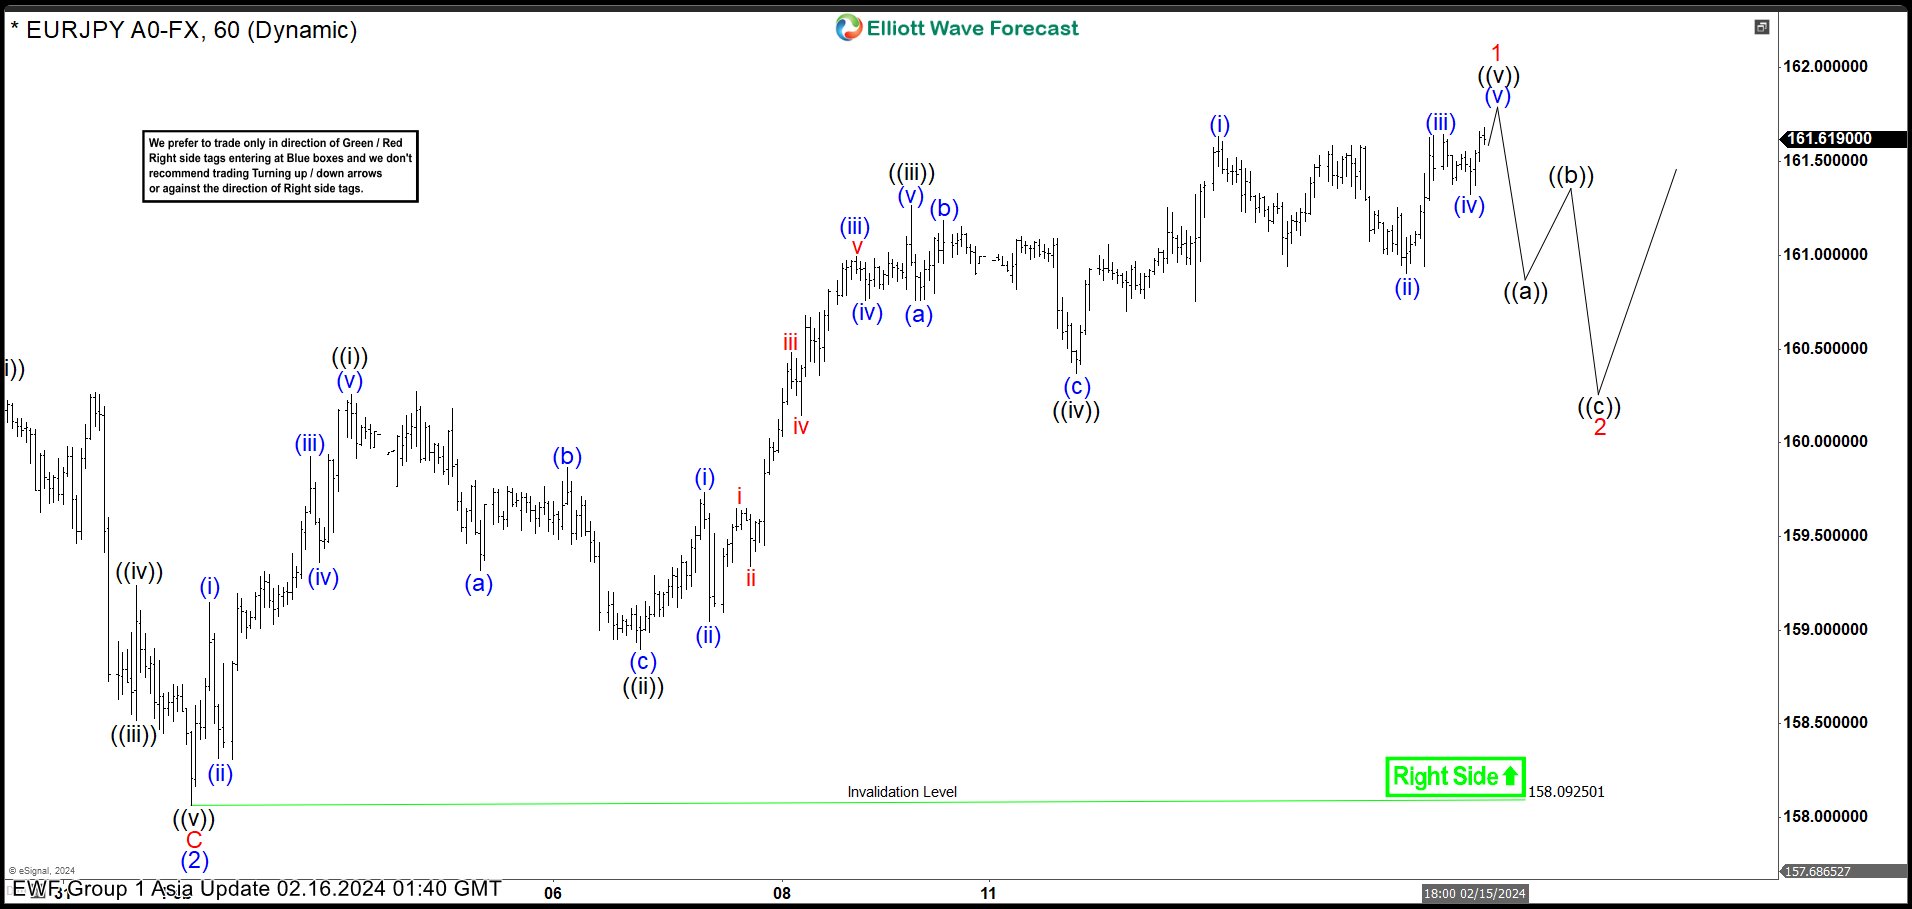
Rally from 2.1.2024 low is in progress as a 5 waves impulse Elliott Wave structure. Up from 2.1.2024 low, wave (i) ended at 159.14 and pullback in wave (ii) ended at 158.31. Pair extended higher in wave (iii) towards 159.92, and dips in wave (iv) ended at 159.36. Wave (v) higher ended at 160.26 which completed wave ((i)). Pair then pulled back in wave ((ii)) with internal subdivision as a zigzag structure. Down from wave ((i)), wave (a) ended at 159.32, wave (b) ended at 159.86, and wave (c ) lower ended at 158.89. This completed wave ((ii)) in higher degree.
Pair extended higher in wave ((iii)). Up from wave ((ii)), wave (i) ended at 159.73 and pullback in wave (ii) ended at 159.04. Pair extended higher in wave (iii) towards 160.99 and pullback in wave (iv) ended at 160.75. Final leg wave (v) ended at 161.26 which ccompleted wave ((iii)). Dips in wave ((iv)) ended at 160.36. Wave ((v)) is now in progress as a diagonal. Up from wave ((iv)), wave (i) ended at 161.63 and dips in wave (ii) ended at 160.9. Wave (iii) ended at 161.64 and pullback in wave (iv) ended at 161.32. Expect wave (v) to end soon which should complete wave ((v)) of 1 in higher degree.
Afterwards, pair should pullback in wave 2 to correct cycle from 2.1.2024 low in 3, 7, 11 swing before it resumes higher. Near term, as far as pivot at 158.09 low stays intact, dips should find support in 3, 7, 11 swing for further upside.
EURJPY 60 Minutes Elliott Wave Chart
EURJPY Elliott Wave Video
https://www.youtube.com/watch?v=Lkh5TLQgD80
Technical Outlook and Review
DXY:
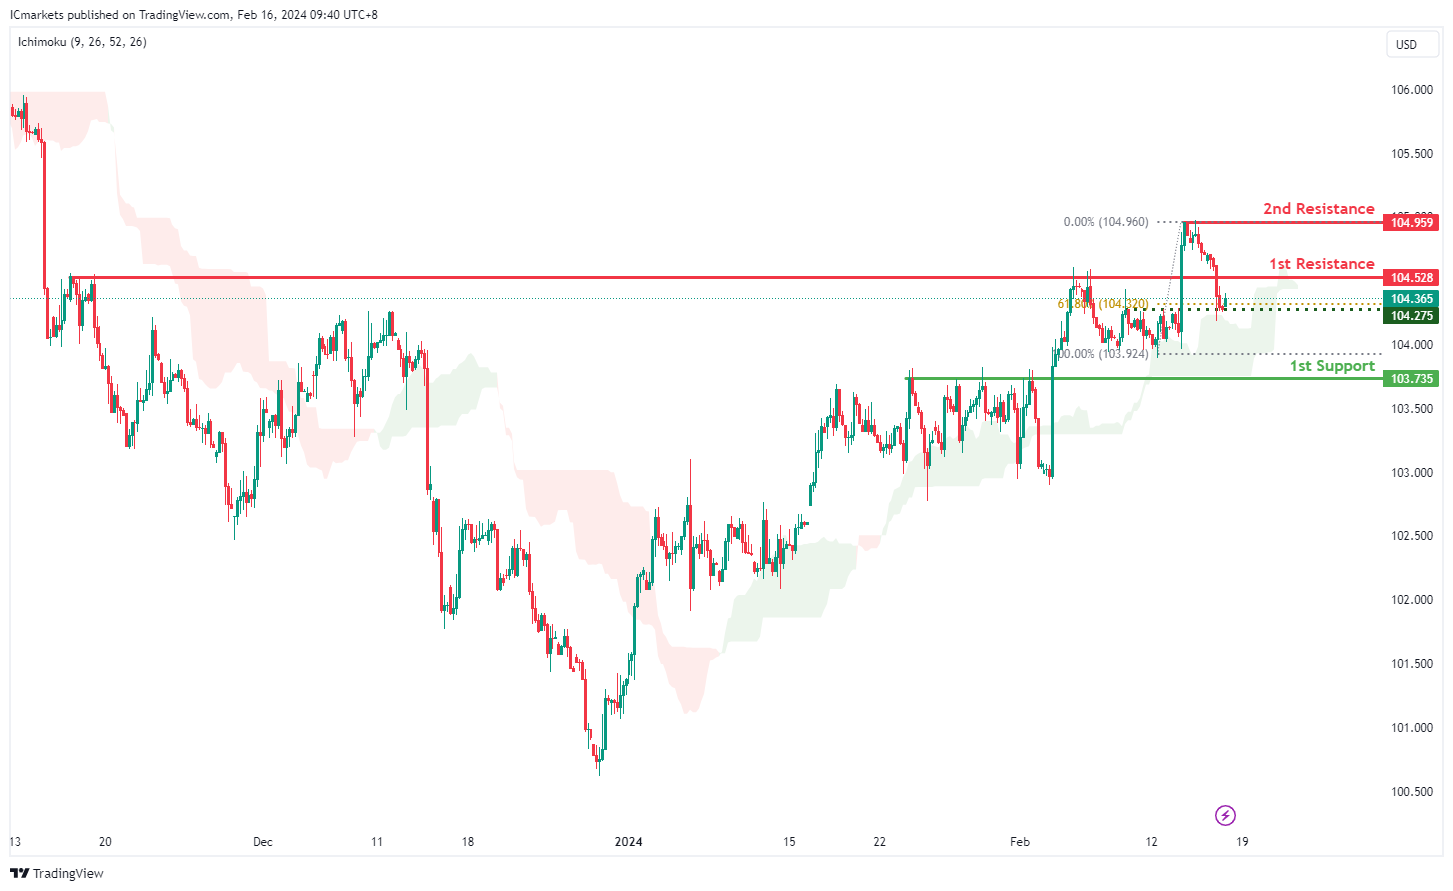
The DXY chart currently demonstrates a bullish overall momentum.
There’s a potential scenario where the price may drop further to the 1st support in the short term before bouncing from there and rising to the 1st resistance.
The 1st support level at 103.73 is identified as a pullback support, suggesting it may attract buying interest as it aligns with a historical pullback level.
On the resistance side, the 1st resistance level at 104.52 is noted as a swing high resistance, indicating its historical significance as a point where selling pressure has been observed in the past.
Additionally, there is a 2nd resistance level at 104.95, identified as a multi-swing high resistance, further reinforcing its importance as a potential barrier for further upward movement.
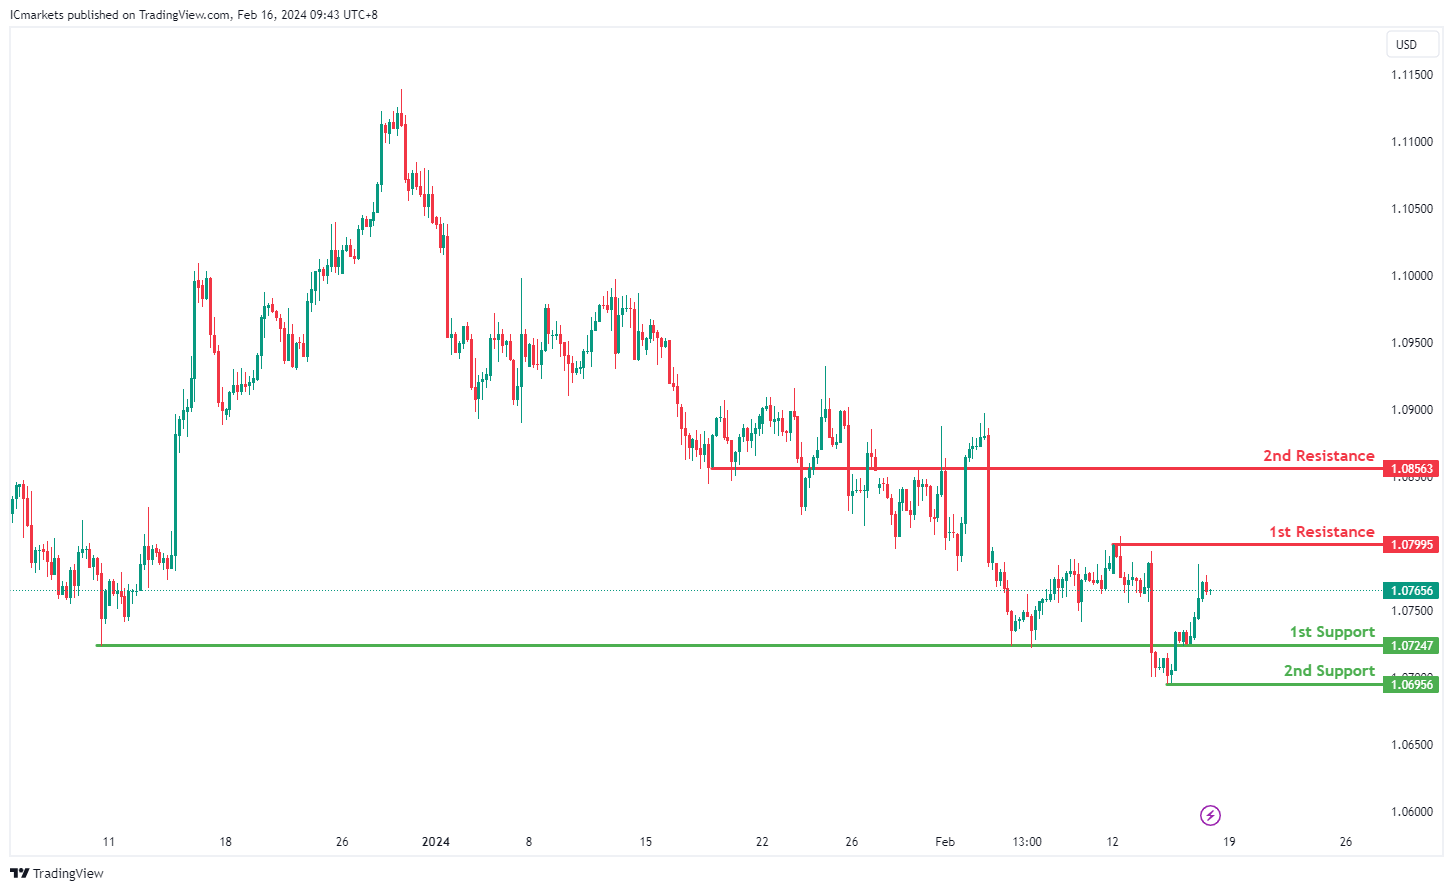
EUR/USD:
The EUR/USD chart currently exhibits a bearish overall momentum.
There’s a potential scenario where the price could continue its bearish movement towards the 1st support.
The 1st support level at 1.0724 is identified as an overlap support, indicating its historical significance as a level where buying interest may emerge.
Additionally, the 2nd support level at 1.0695 is characterized as a swing low support, further emphasizing its importance as a potential support zone.
On the resistance side, the 1st resistance level at 1.0799 is noted as a swing high resistance, suggesting its historical significance as a point where selling pressure has been observed in the past.
Furthermore, there is a 2nd resistance level at 1.0856, identified as a pullback resistance, which could act as a barrier for further upward movement.
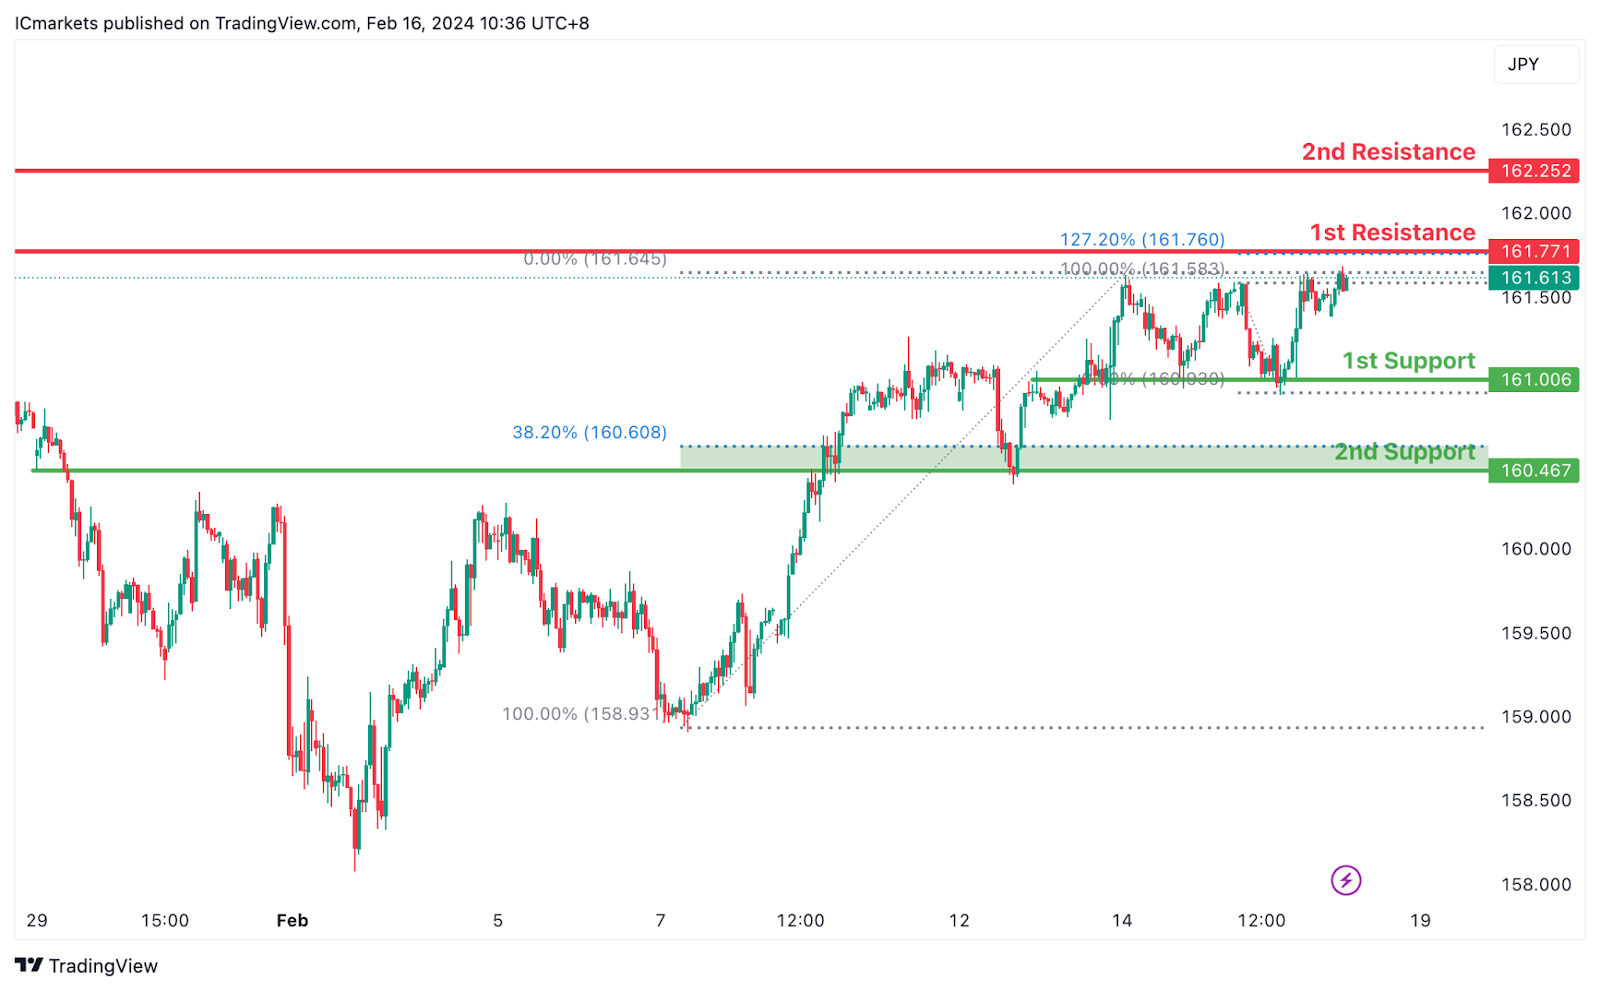
EUR/JPY:
The EUR/JPY chart currently demonstrates a bullish overall momentum, indicating a prevailing upward trend. Several factors contribute to this bullish sentiment, supporting the potential for further upward movement in price.
The 1st support level at 160.006 is significant as it aligns with an overlap support, suggesting a historical level where buying interest has emerged, potentially providing a foundation for continued upward momentum. Additionally, the 2nd support level at 160.467 coincides with both an overlap support and the 38.20% Fibonacci Retracement, further reinforcing its importance as a potential support zone.
On the resistance side, the 1st resistance level at 161.771 corresponds to a swing high resistance and the 127.20% Fibonacci Extension. This convergence of resistance factors suggests a significant historical point where selling pressure has been strong, potentially acting as a barrier to further upward movement.
Further up, the 2nd resistance level at 161.525 aligns with a swing high resistance, adding to its significance as a potential barrier to upward movement.
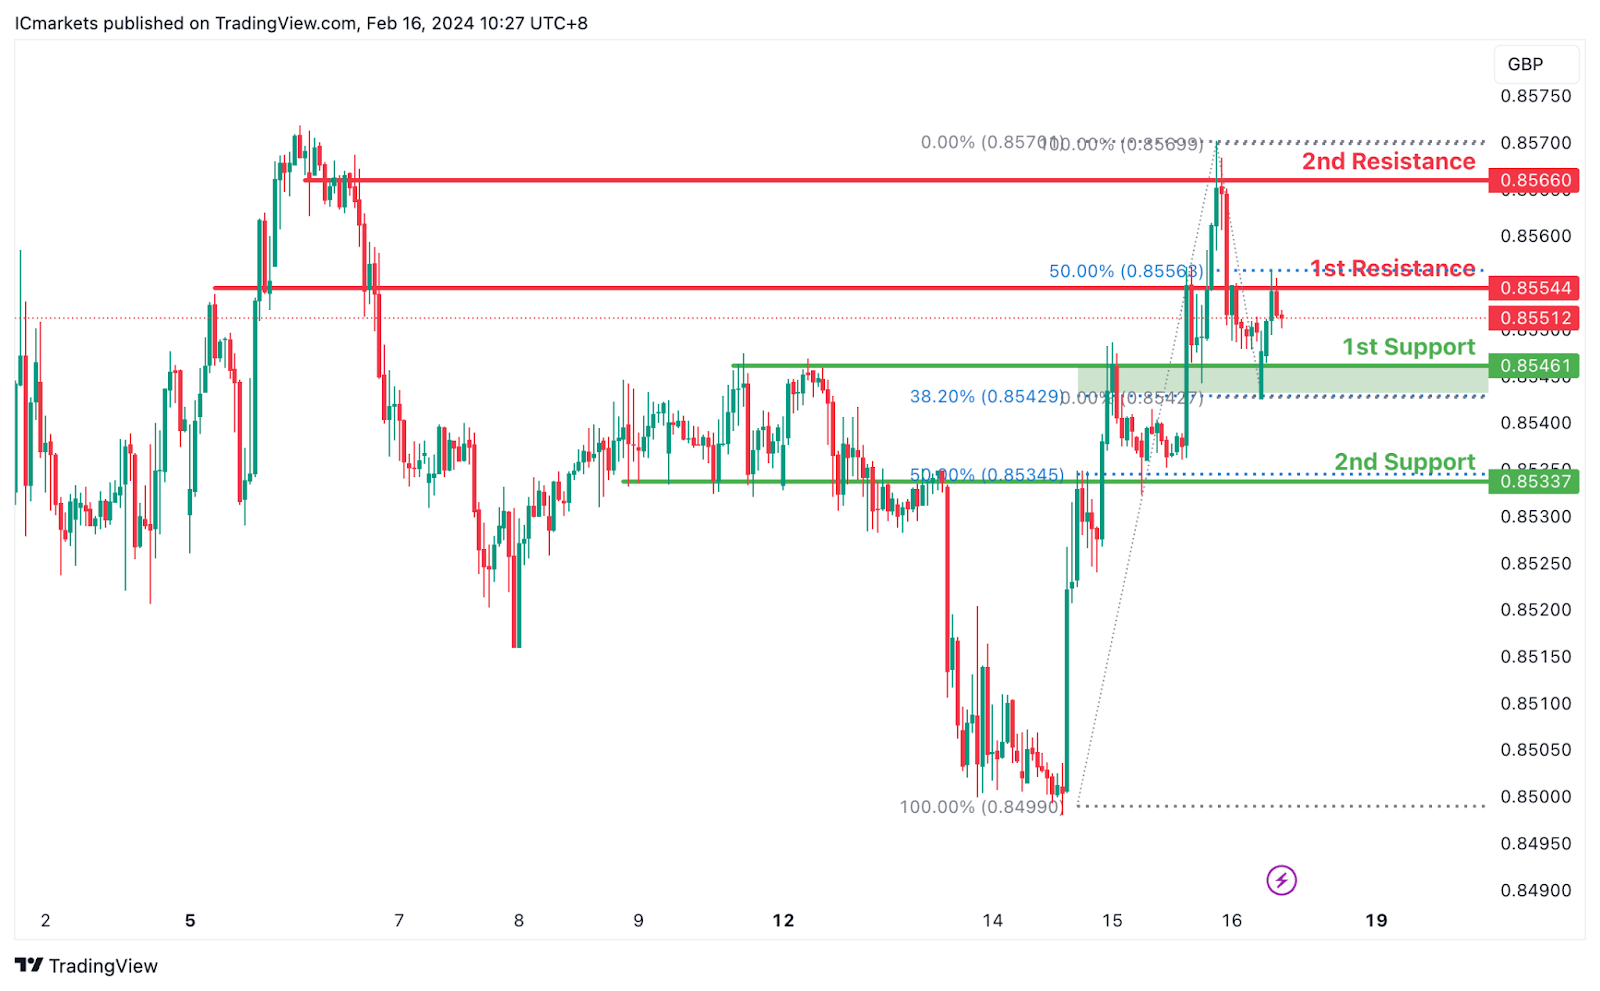
EUR/GBP:
The EUR/GBP chart currently indicates a bearish overall momentum, suggesting a prevailing downward trend. Several factors contribute to this bearish sentiment, supporting the potential for a continued downward movement in price.
The 1st support level at 0.85461 is significant as it aligns with a pullback support and the 38.20% Fibonacci Retracement level. This convergence of support factors suggests a strong level where buying interest may emerge, potentially offering some support to the price.
Furthermore, the 2nd support level at 0.85337 corresponds to an overlap support and the 50% Fibonacci Retracement, reinforcing its significance as a potential support zone.
On the resistance side, the 1st resistance level at 0.85544 aligns with an overlap resistance and the 50% Fibonacci Retracement. This level indicates a historical point where selling pressure may increase, potentially acting as a barrier to further upward movement.
Additionally, the 2nd resistance level at 0.85660 corresponds to an overlap resistance, further solidifying its importance as a potential barrier to upward movement.
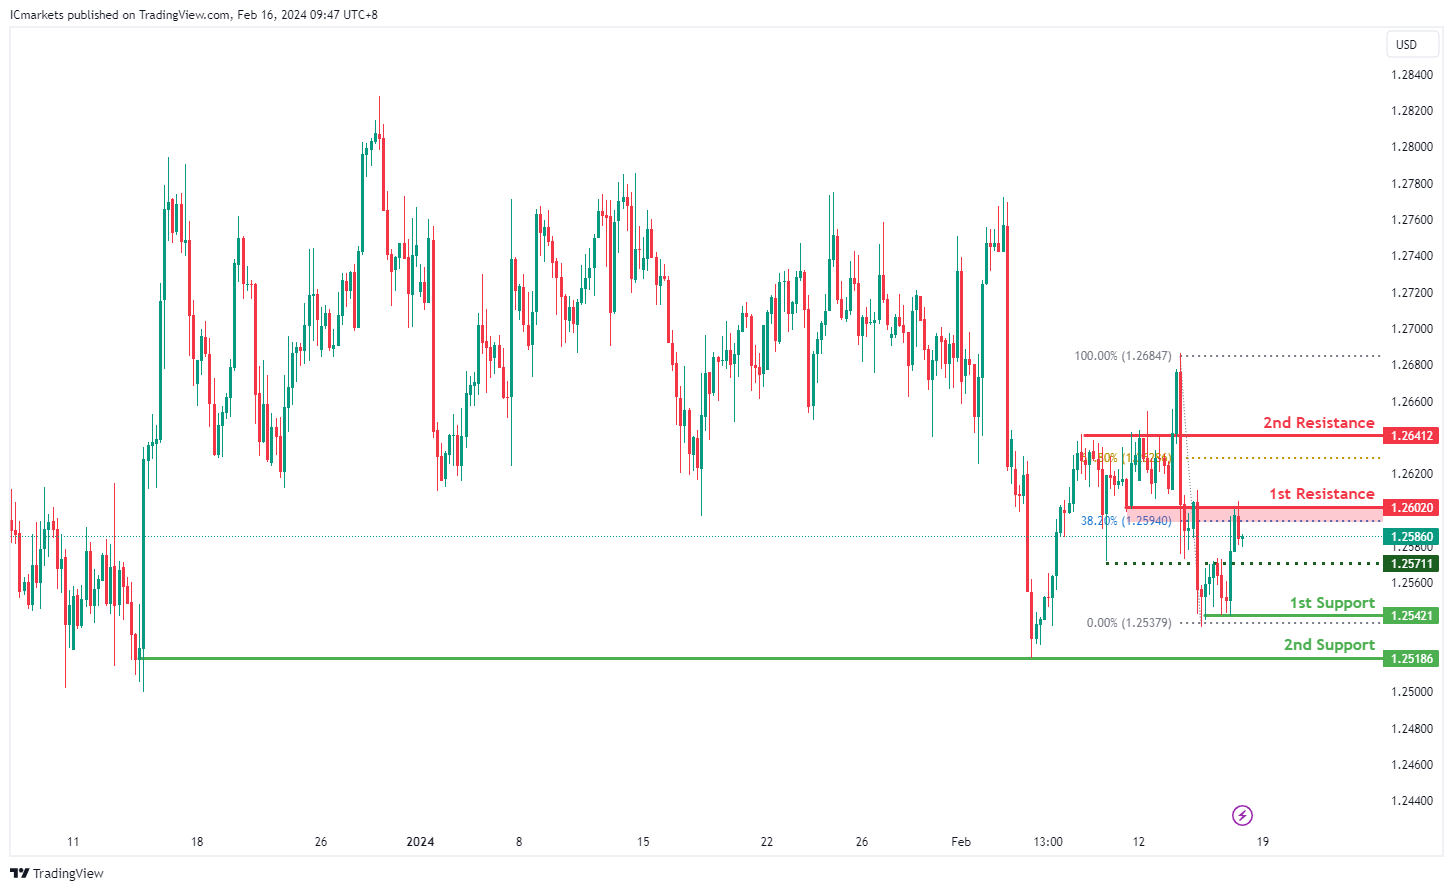
GBP/USD:
The GBP/USD chart currently demonstrates a bearish overall momentum.
There’s a potential scenario where the price reacts bearishly at the 1st resistance and declines towards the 1st support.
The 1st support level at 1.2542 is identified as a multi-swing low support, indicating its historical significance as a level where buying interest may emerge.
Similarly, the 2nd support level at 1.2518 is also noted as a multi-swing low support, reinforcing its importance as a potential support zone.
On the resistance side, the 1st resistance level at 1.2602 is recognized as an overlap resistance, with the presence of the 38.20% Fibonacci Retracement, indicating its historical significance as a potential resistance level.
Furthermore, there is a 2nd resistance level at 1.2641, characterized as a pullback resistance, suggesting its significance as a potential barrier for further upside movement.
Intermediate support at 1.2571 is considered a pullback support, providing additional reinforcement for potential buying interest.
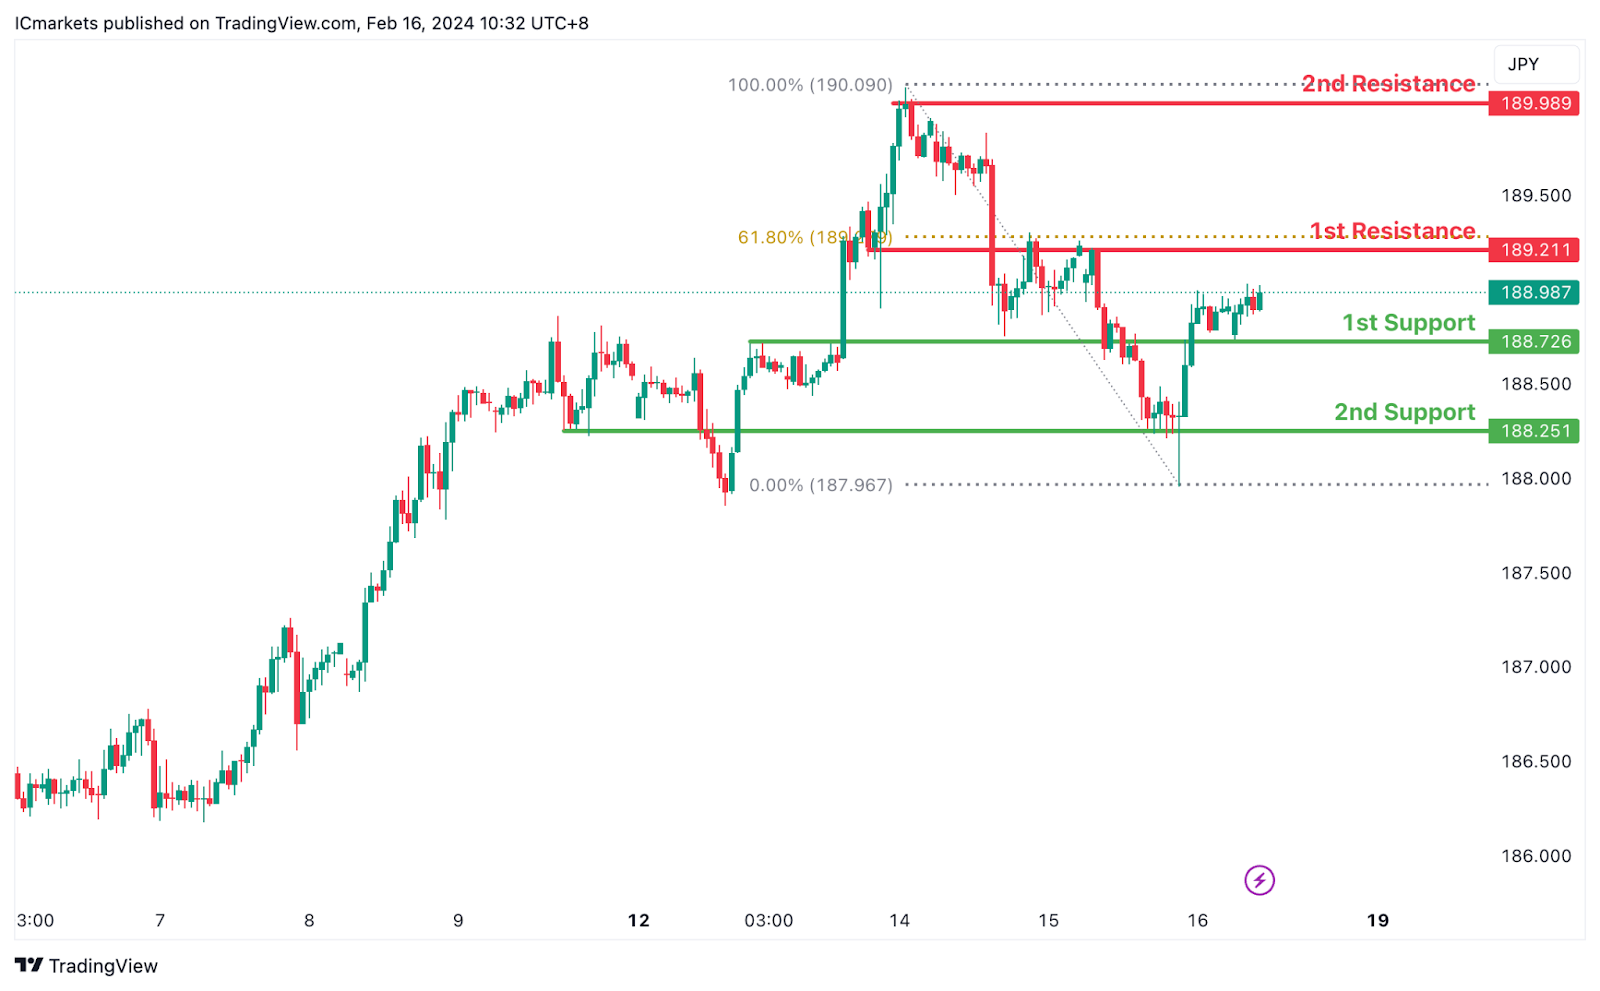
GBP/JPY:
The GBP/JPY chart currently indicates a bullish overall momentum, suggesting a prevailing upward trend. Several factors contribute to this bullish sentiment, supporting the potential for a continued upward movement in price.
The 1st support level at 188.726 aligns with an overlap support, indicating a significant historical level where buying interest has emerged. This level may act as a foundation for further upward movement.
Additionally, the 2nd support level at 188.251 also corresponds to an overlap support, further reinforcing its potential significance as a support zone.
On the resistance side, the 1st resistance level at 189.211 aligns with both an overlap resistance and the 61.80% Fibonacci Retracement. This convergence of resistance factors suggests a historical point where selling pressure may increase, potentially acting as a barrier to further upward movement.
Furthermore, the 2nd resistance level at 189.989 corresponds to a swing high resistance, adding to its significance as a potential barrier to upward movement.
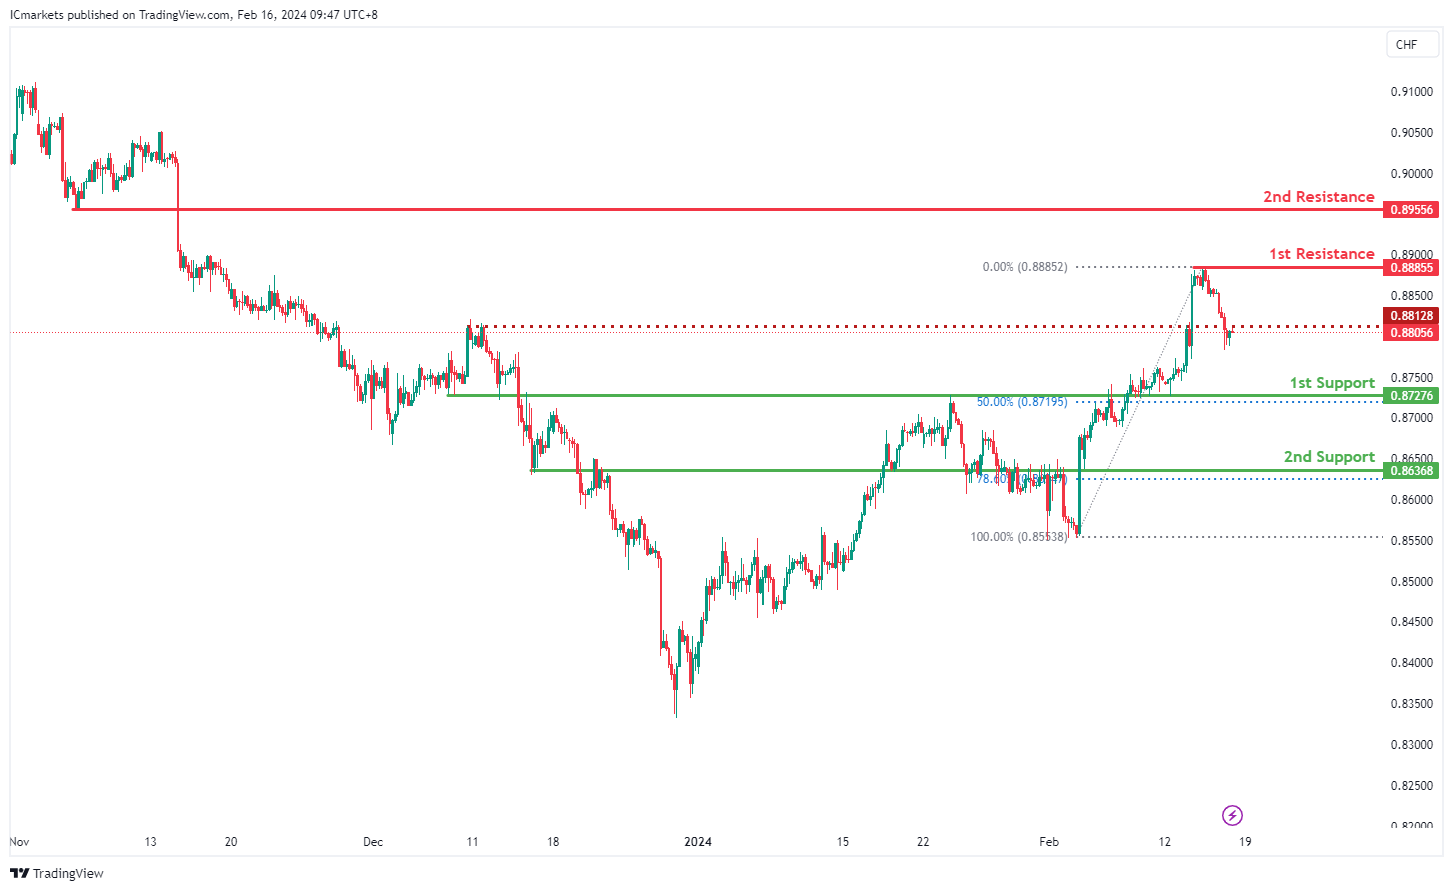
USD/CHF:
The USD/CHF chart currently exhibits a bearish overall momentum.
There’s a potential scenario where the price continues its bearish movement towards the 1st support level.
The 1st support level at 0.8727 is identified as an overlap support, coinciding with the 50% Fibonacci Retracement level, which adds further significance to this support zone.
Additionally, the 2nd support level at 0.8636 is noted as a pullback support, with the 78.60% Fibonacci Retracement level indicating a potential area where buyers might step in to push the price higher.
On the resistance side, the 1st resistance level at 0.8885 is recognized as a multi-swing high resistance, suggesting its historical significance as a level where selling pressure may increase.
Furthermore, there is a 2nd resistance level at 0.8955, characterized as a pullback resistance, indicating its potential role as a barrier for further upward movement in price.
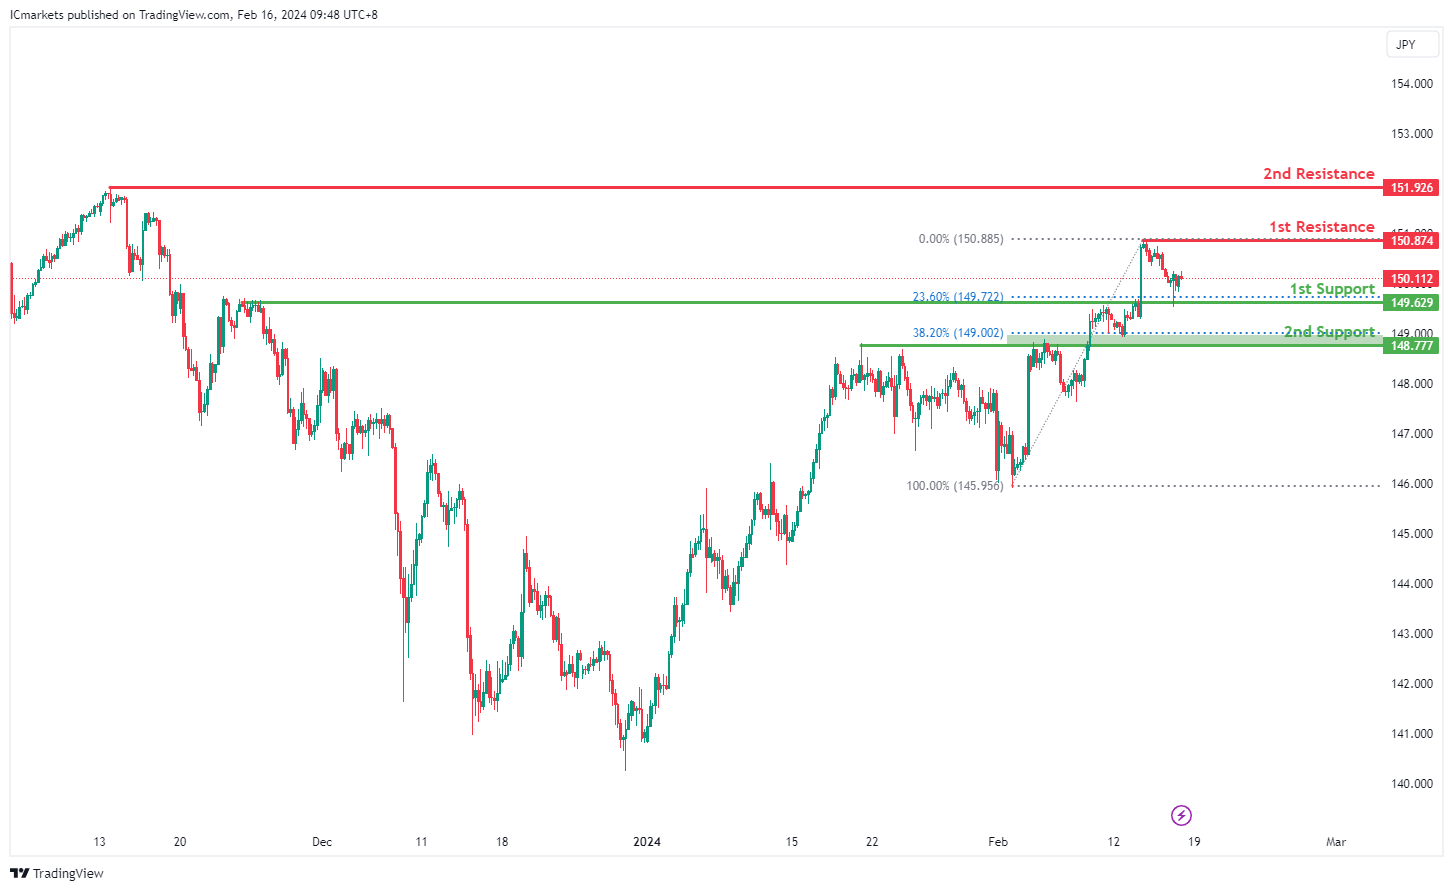
USD/JPY:
The USD/JPY chart currently demonstrates a bullish overall momentum.
There’s a potential scenario where the price continues its bullish movement towards the 1st resistance level.
The 1st support level at 149.62 is identified as an overlap support, coinciding with the 23.60% Fibonacci Retracement level, suggesting a significant level where buyers might enter the market.
Additionally, the 2nd support level at 148.77 is noted as a pullback support, with the 38.20% Fibonacci Retracement level indicating another area of potential buying interest.
On the resistance side, the 1st resistance level at 150.87 is recognized as a swing high resistance, historically acting as a barrier where selling pressure may increase.
Furthermore, there is a 2nd resistance level at 151.92, characterized as another swing high resistance, suggesting its potential role as a significant hurdle for further upward movement in price.
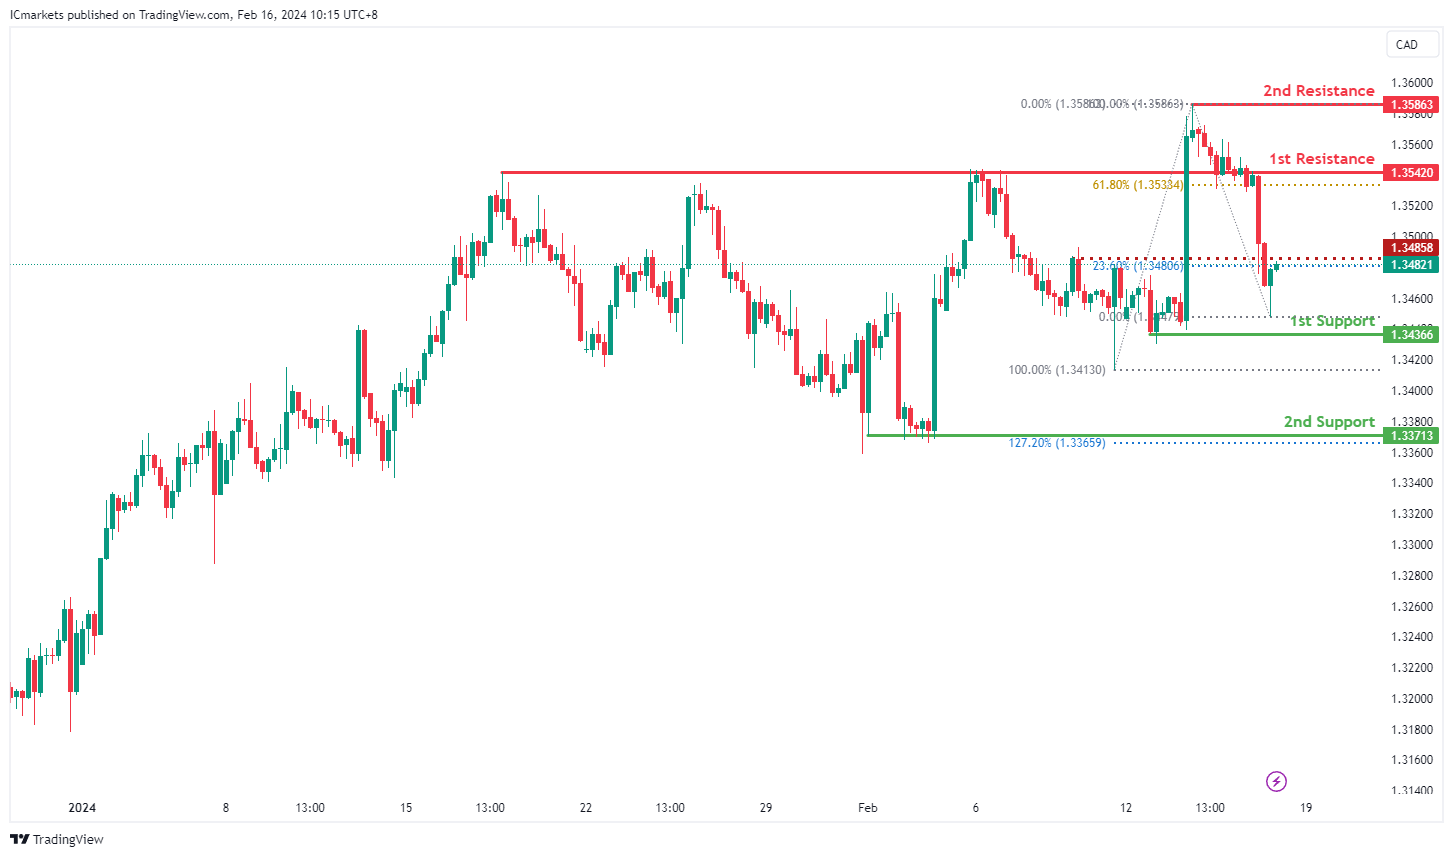
USD/CAD:
The USD/CAD chart currently exhibits an overall bearish momentum. In this context, there is a potential scenario for price to resume the bearish momentum and fall towards the 1st support.
The 1st support level at 1.3436 is identified as a pullback support. Further below, the 2nd support level at 1.3371 is also marked as a pullback support, further emphasizing its importance as a potential support zone.
To the upside, the intermediate resistance level at 1.3485 is identified as a pullback resistance that aligns close to the 23.60% Fibonacci Retracement level while the 1st resistance level at 1.3542 is also marked as a pullback resistance that aligns close to the 61.80% Fibonacci Retracement level. Higher up, the 2nd resistance level at 1.3586 is also noted as a pullback resistance, further highlighting its importance as a potential resistance point.
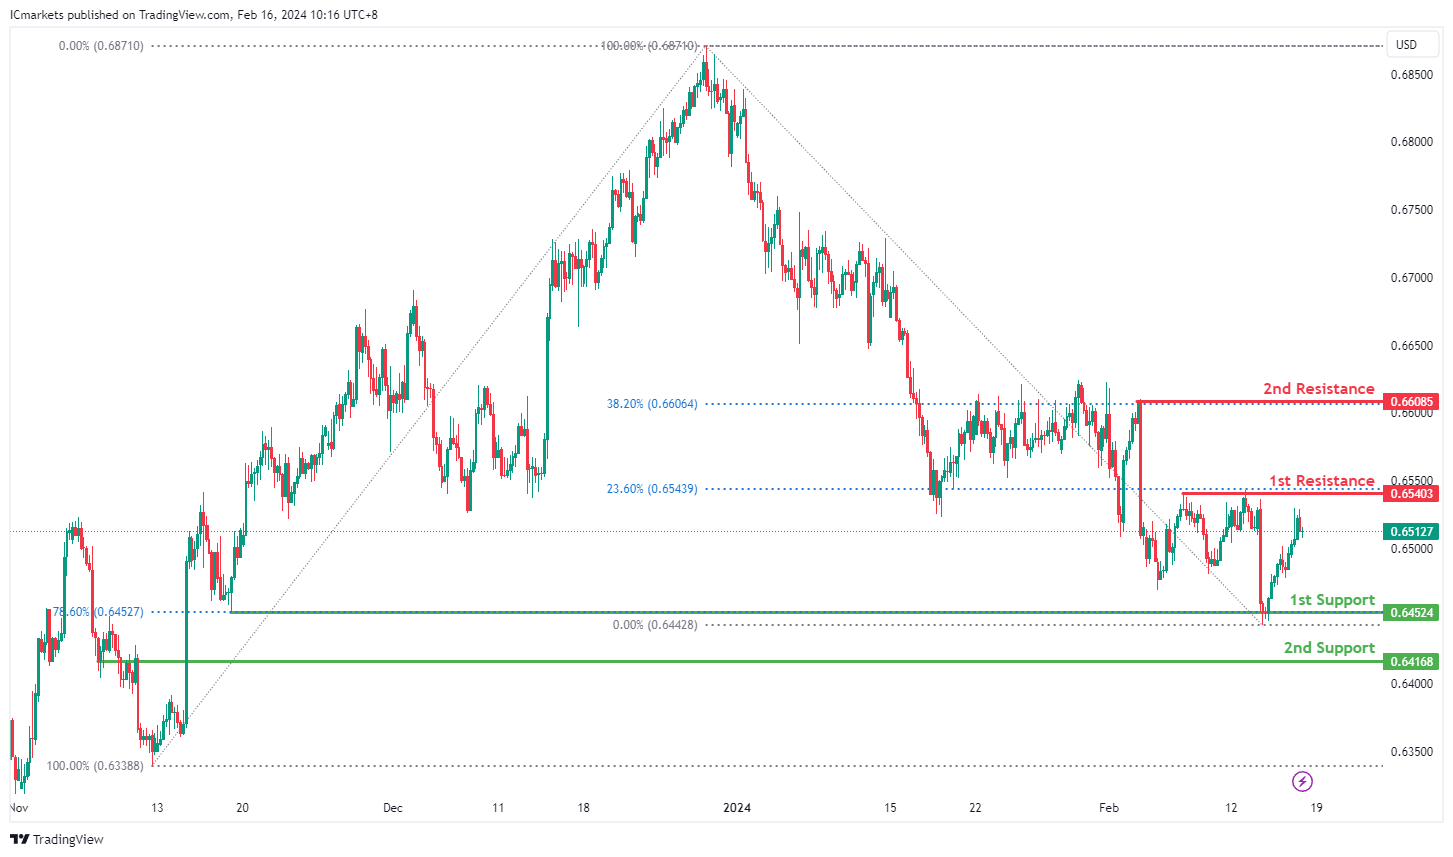
AUD/USD:
The AUD/USD chart currently exhibits a neutral bias. In this context, there is a potential scenario for price to fluctuate between the 1st resistance and the 1st support.
The 1st resistance level at 0.6540 is identified as a pullback resistance that aligns with the 23.60% Fibonacci Retracement level. Higher up, the 2nd resistance level at 0.6608 is also marked as a pullback resistance that aligns with the 38.20% Fibonacci Retracement level, further highlighting its importance as a potential resistance point.
To the downside, the 1st support level at 0.6452 is identified as pullback support that aligns with the 78.60% Fibonacci Retracement level. Further below, the 2nd support level at 0.6416 is noted as an overlap support, further emphasizing its importance as a potential support zone.
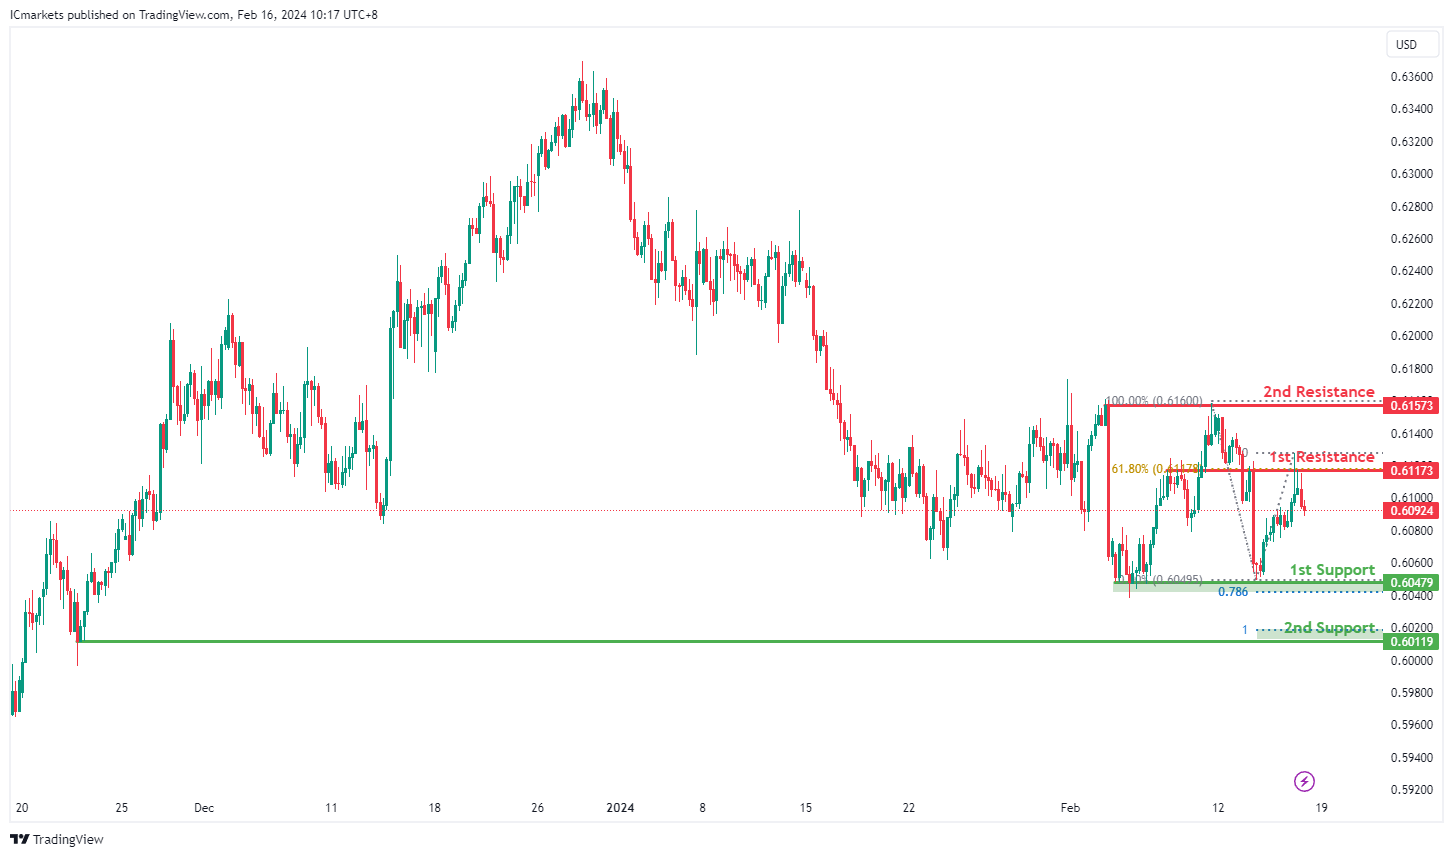
NZD/USD
The NZD/USD chart currently exhibits a neutral bias. In this context, there is a potential scenario for price to fluctuate between the 1st resistance and the 1st support.
The 1st resistance level at 0.6117 is identified as an overlap resistance that aligns with the 61.80% Fibonacci Retracement level. Higher up, the 2nd resistance level at 0.6157 is marked as a pullback resistance, further highlighting its importance as a potential resistance point.
To the downside, the 1st support level at 0.6047 is identified as a pullback support that aligns with the 78.60% Fibonacci Projection level. Further below, the 2nd support level at 0.6019 is also noted as a pullback support that aligns close to the 100.00% Fibonacci Projection level, further emphasizing its importance as a potential support zone.
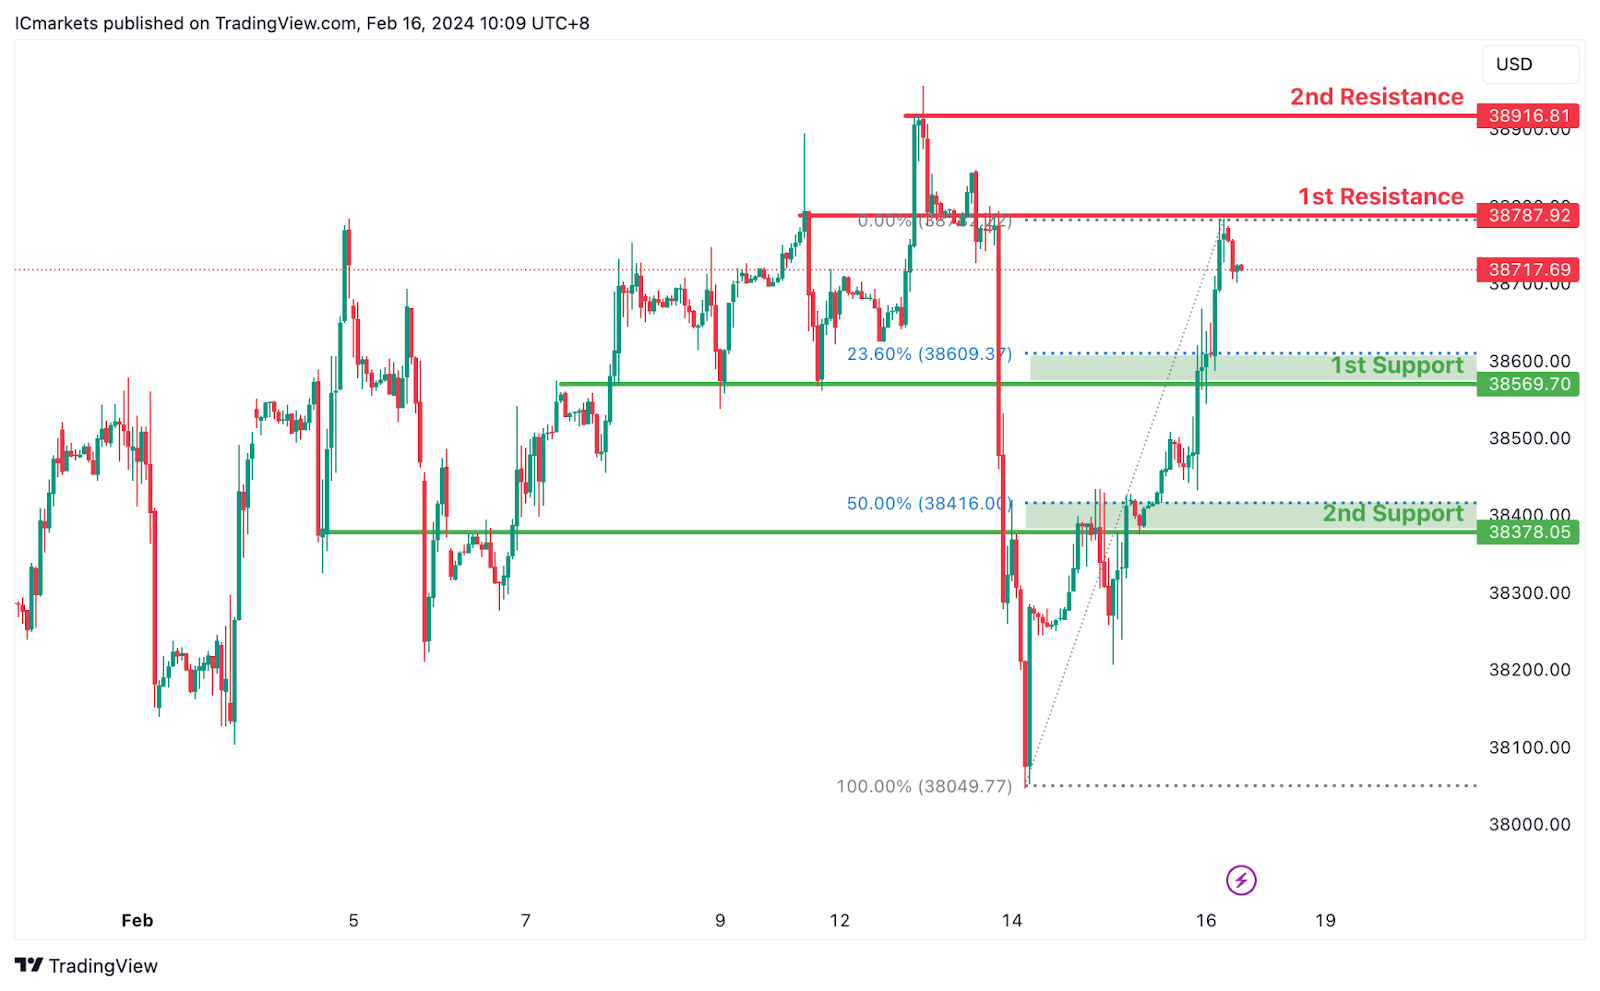
DJ30:
The DJ30 chart currently reflects a bearish overall momentum, indicating a prevailing downward trend. Several factors contribute to this bearish sentiment, supporting the potential for a continued downward movement in price.
The 1st support level at 38569.70 aligns with both an overlap support and the 23.60% Fibonacci Retracement, suggesting a significant historical level where buying interest has emerged. This convergence of support factors indicates a strong potential support zone.
Furthermore, the 2nd support level at 38378.05 corresponds to another overlap support and the 50% Fibonacci Retracement. This reinforces its importance as a potential support level where buyers may step in to support the price.
On the resistance side, the 1st resistance level at 38787.92 aligns with an overlap resistance, indicating a historical point where selling pressure may increase. This level could act as a barrier to further upward movement.
Moreover, the 2nd resistance level at 38916.81 corresponds to a swing high resistance, adding to its significance as a potential barrier to upward movement.
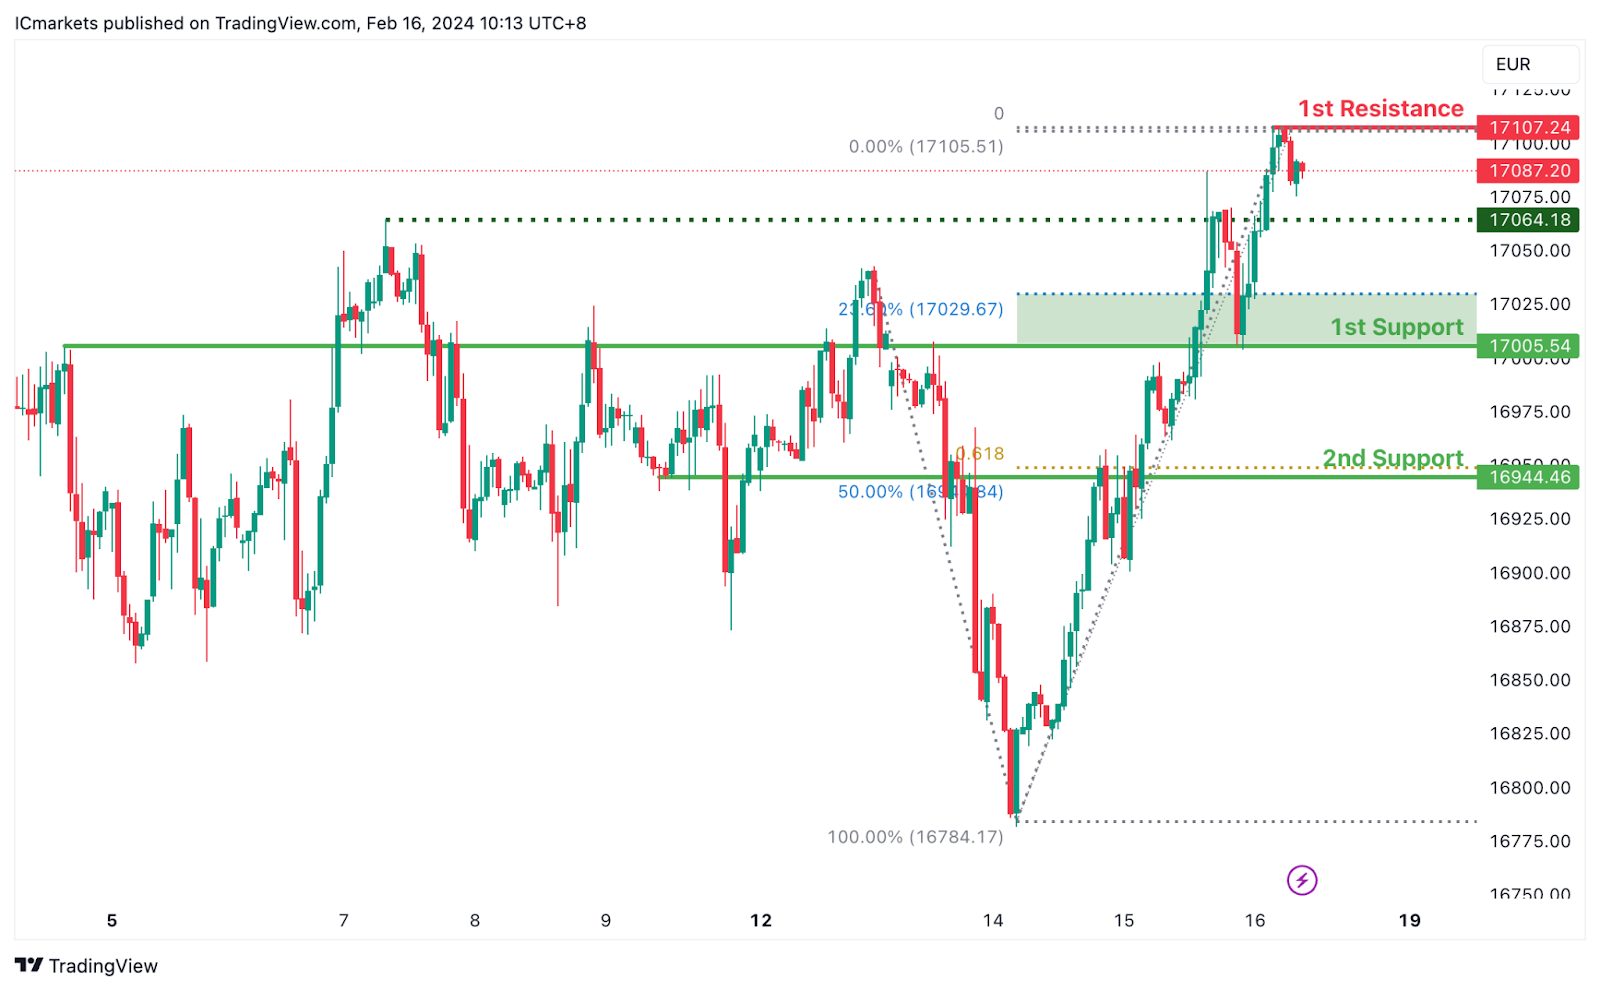
GER40:
The GER40 chart currently exhibits a bearish overall momentum, indicating a prevailing downward trend. Several factors contribute to this bearish sentiment, supporting the potential for a continued downward movement in price.
The 1st support level at 17005.5 aligns with both an overlap support and the 23.60% Fibonacci Retracement, indicating a significant historical level where buying interest has emerged. This convergence of support factors suggests a strong potential support zone.
Additionally, the 2nd support level at 16944.5 corresponds to another overlap support, the 50% Fibonacci Retracement, and the 61.80% Fibonacci Projection. This reinforces its importance as a potential support level where buyers may intervene to support the price. An intermediate support level at 17064.5 is also identified, which aligns with a pullback support, providing additional reinforcement to the support structure.
On the resistance side, the 1st resistance level at 17107.2 aligns with a swing high resistance, suggesting a historical point where selling pressure may increase. This level could act as a barrier to further upward movement.
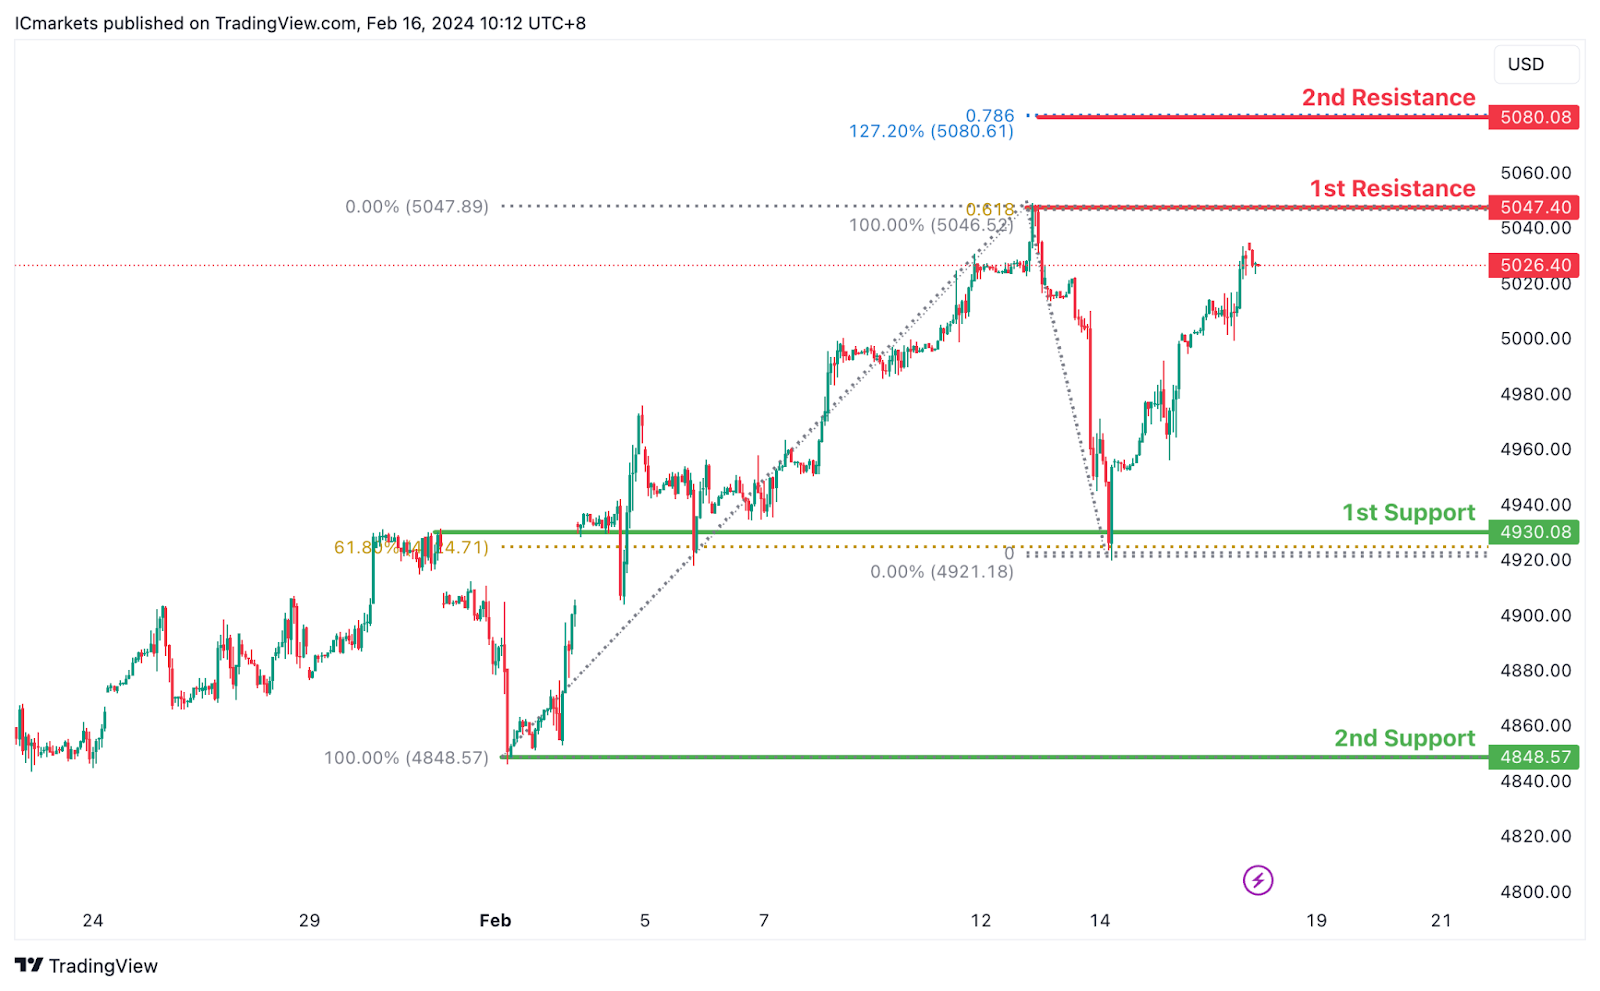
US500:
The US500 chart currently demonstrates a bullish overall momentum, indicating a prevalent upward trend. Several factors contribute to this bullish sentiment, suggesting the potential for a continued upward movement in price.
The 1st support level at 4930.1 is deemed significant as it aligns with both an overlap support and the 61.80% Fibonacci Retracement level. This convergence of support factors suggests a robust level where buying interest has historically emerged, potentially providing a solid foundation for further upward movement.
Additionally, the 2nd support level at 4848.6 corresponds to a swing low support, further reinforcing its importance as a potential support zone. This level indicates a significant historical level where buyers have previously intervened to support the price.
On the resistance side, the 1st resistance level at 5047.4 is identified as a point where selling pressure may increase, as it represents a swing high resistance and aligns with the 61.80% Fibonacci Projection. This suggests a historical point where selling interest has been strong and could act as a barrier to further upward movement.
Further up, the 2nd resistance level at 5080.1 aligns with both the 127.20% and 78.60% Fibonacci Extensions, adding to its significance as a potential barrier to upward movement.
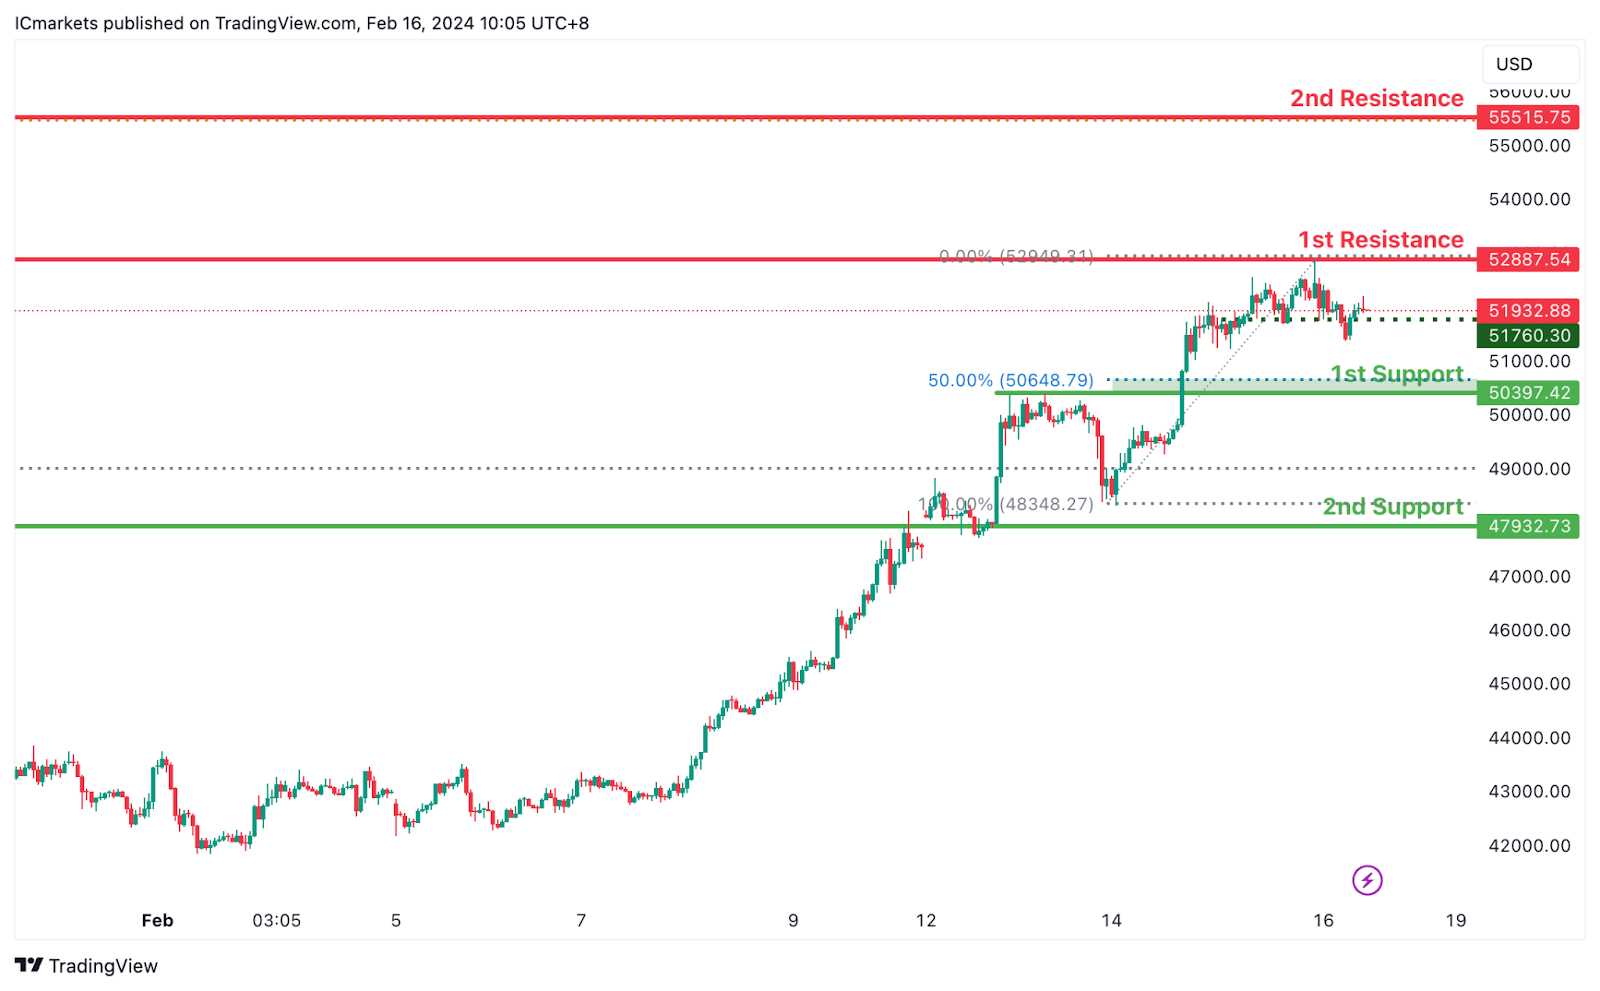
BTC/USD:
The BTC/USD chart currently demonstrates a bullish overall momentum, indicating a prevailing upward trend. Several factors support the potential for a continued upward movement in price.
The 1st support level at 50397.42 is significant as it aligns with both a pullback support and the 50% Fibonacci Retracement level. This confluence suggests a strong historical level where buying interest has emerged, potentially providing support for further upward movement.
Additionally, the 2nd support level at 47923.73 corresponds to an overlap support, reinforcing its importance as a potential support zone. This level indicates a significant historical level where buyers have previously stepped in to support the price.
On the resistance side, the 1st resistance level at 52887.54 is identified as a point where selling pressure may increase, as it represents a multi-swing high resistance. This level suggests a historical point where selling interest has been strong and could act as a barrier to further upward movement.
Further up, the 2nd resistance level at 55515.75 aligns with a swing high resistance, adding to its significance as a potential barrier to upward movement.
An intermediate support level at 51760.30 is also identified, aligning with a pullback support, providing additional reinforcement to the support structure.
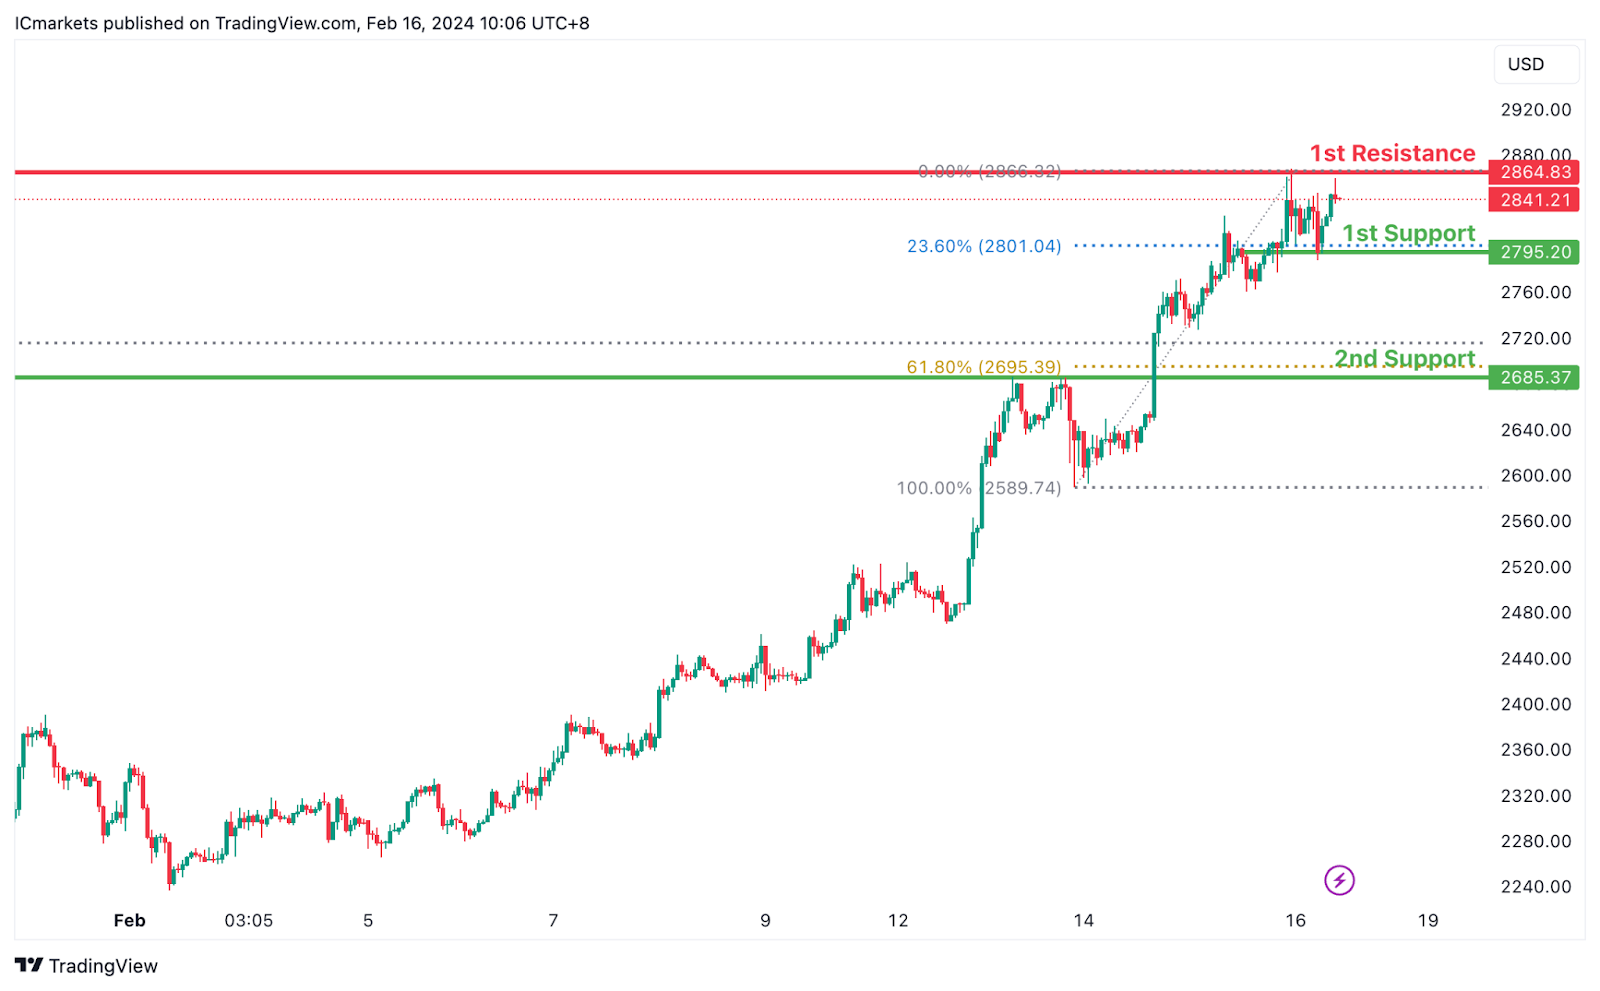
ETH/USD:
The ETH/USD chart currently shows a bullish overall momentum, indicating a prevailing upward trend. Several factors contribute to this bullish sentiment, supporting the potential for a continued upward movement in price.
The 1st support level at 2795.20 is significant as it aligns with both an overlap support and the 23.60% Fibonacci Retracement level. This convergence suggests a strong historical level where buying interest has emerged, potentially providing a solid foundation for further upward movement.
Additionally, the 2nd support level at 2685.37 corresponds to another overlap support and the 61.80% Fibonacci Retracement level, reinforcing its importance as a potential support zone. This level indicates a significant historical level where buyers have previously stepped in to support the price.
On the resistance side, the 1st resistance level at 2864.83 is identified as a point where selling pressure may increase, as it represents a swing high resistance. This level suggests a historical point where selling interest has been strong and could act as a barrier to further upward movement.
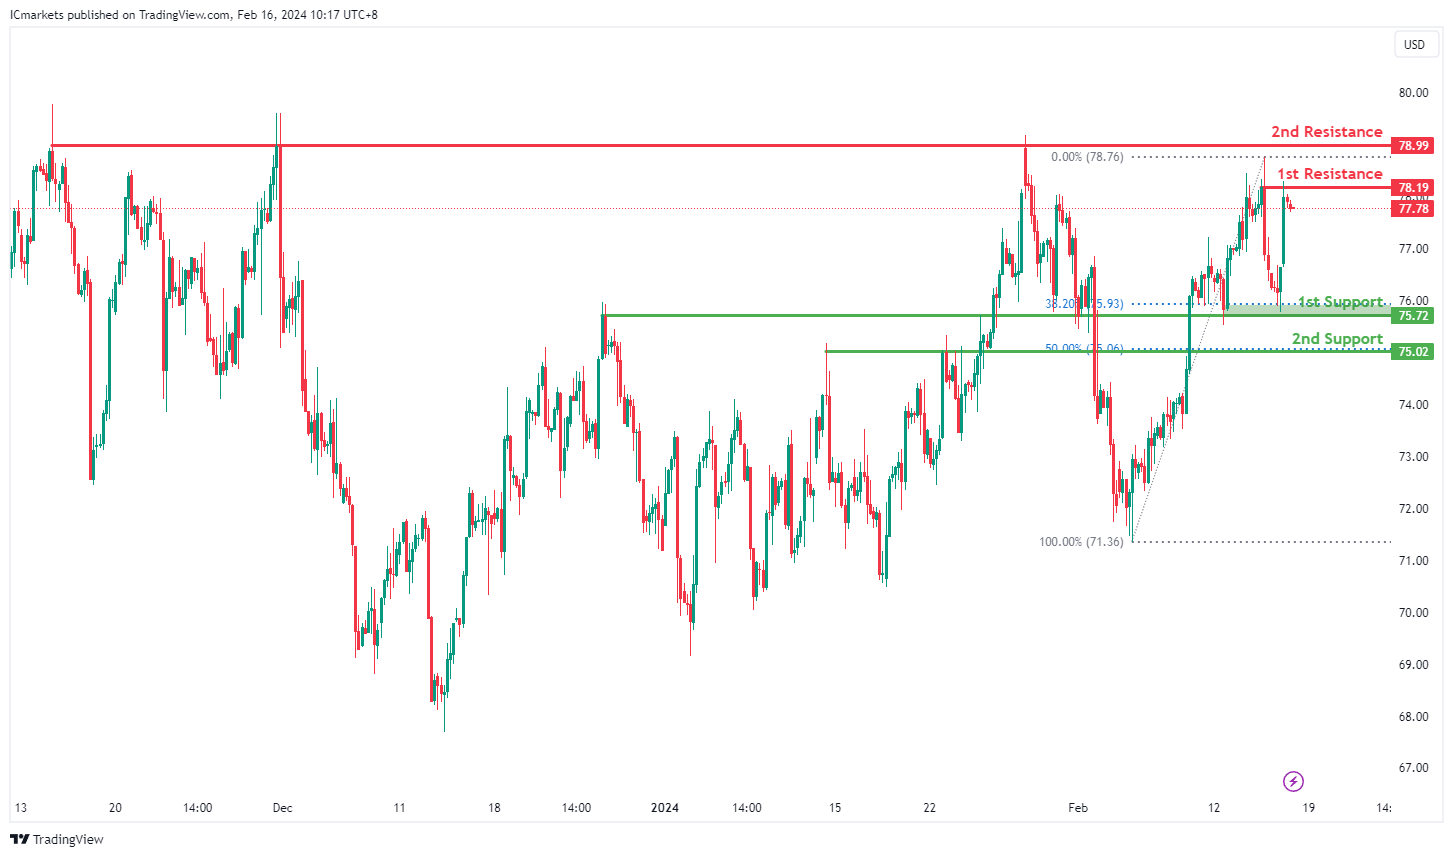
WTI/USD:
The WTI (West Texas Intermediate) chart currently exhibits an overall bullish momentum. In this context, there is a potential scenario for price to rise towards the 1st resistance.
The 1st resistance level at 78.19 is identified as a pullback resistance. Higher up, the 2nd resistance level at 78.99 is marked as a multi-swing-high resistance, further highlighting its importance as a potential resistance zone.
To the downside, the 1st support level at 75.72 is identified as an overlap support that aligns close to the 38.20% Fibonacci Retracement level. Further below, the 2nd support level at 75.02 is also noted as an overlap support that aligns with the 50.00% Fibonacci Retracement level, reinforcing its significance as a key support level.
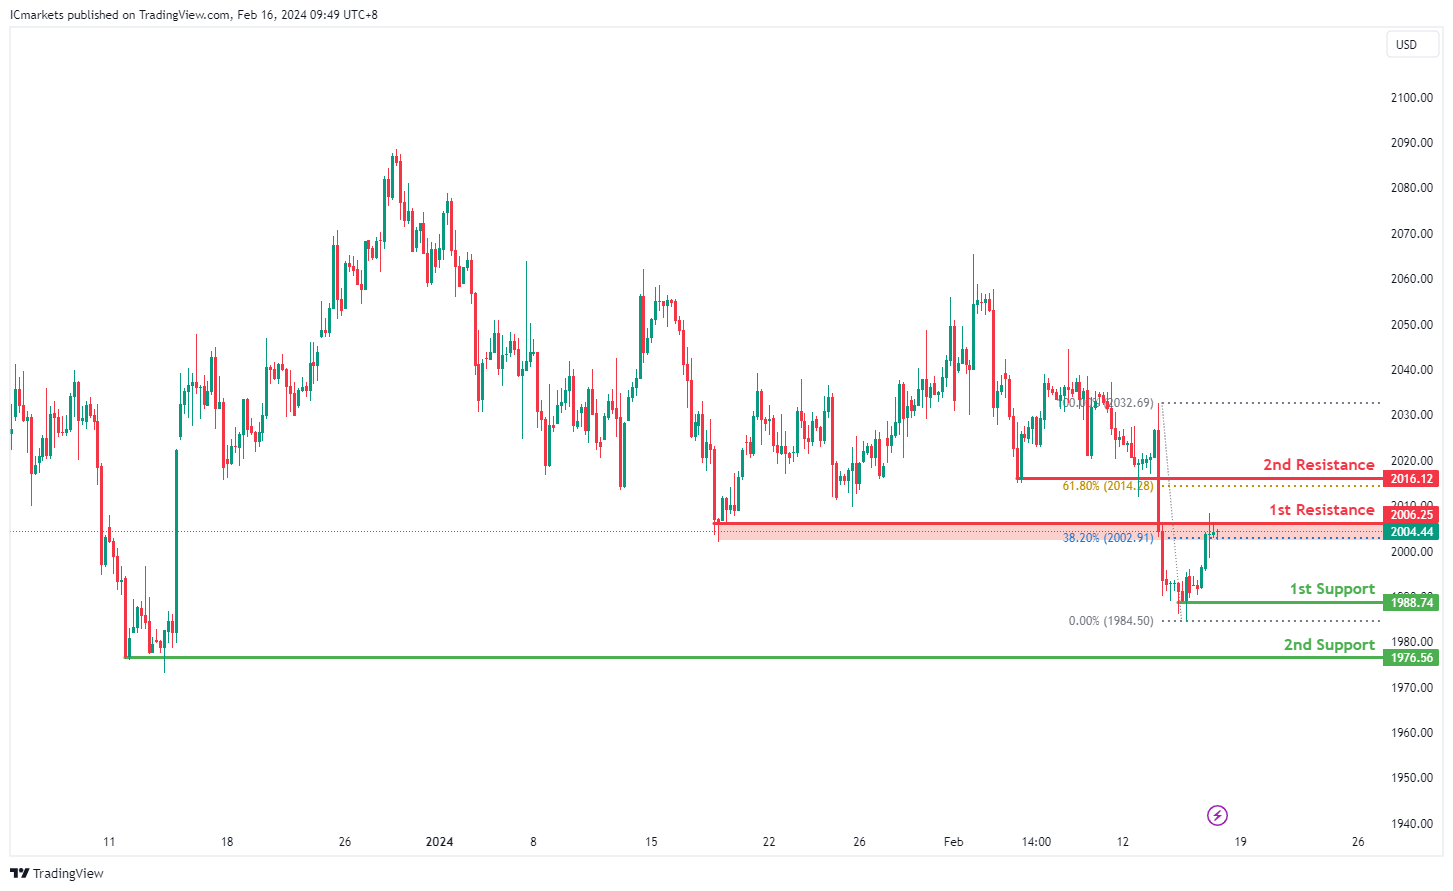
XAU/USD (GOLD):
The current momentum of XAUUSD is bearish, suggesting a potential downward movement in price.
There’s a possibility of a bearish reaction off the 1st resistance level, leading to a drop towards the 1st support level.
The 1st support level is identified at 1988.74, supported by its historical significance as a swing low, indicating potential buying interest in this area.
Additionally, the 2nd support level lies at 1976.56, which is considered a multi-swing low support, further strengthening its significance as a potential level where buyers may enter the market.
On the resistance side, the 1st resistance level stands at 2006.25, characterized as a pullback resistance, coinciding with the 38.20% Fibonacci Retracement level. This suggests a potential barrier where selling pressure may increase.
Furthermore, there is a 2nd resistance level at 2016.12, also identified as a pullback resistance, with the 61.80% Fibonacci Retracement level indicating another area where selling pressure may intensify, potentially leading to a bearish reaction.
Building Up a ‘Home-Grown’ Inflation Issue?
Issues in the home-building sector are still boosting goods inflation in Australia.
This week RBA Head of Economic Analysis Marion Kohler gave a speech on the economic outlook. Normally an RBA speech so soon after the release of the Statement on Monetary Policy will be designed to reinforce the messages in that publication, rather than present new ones. Nonetheless, one can often find useful detail or nuance that was not in the SMP.
One graph that caught my eye from Dr Kohler’s speech was Graph 3, decomposing core inflation into goods and services components for a range of countries. (The version in the SMP was six-month annualised, not the smoother year-ended measure, and excluded Australia.)
A few takeaways from this view of the data.
Electricity costs and the goods price rollover
First, core inflation measures have not fallen anywhere near as much as headline measures in most countries. Headline series are being flattered by the unwind of the previous surges in food and energy prices. Once those price falls wash out, headline inflation will converge on core rates. Depending on the pace of decline of core inflation, headline inflation could therefore pick up temporarily in some economies.
Australia is in a different situation. Because of the way our electricity market is regulated and priced, the main effect of Russia’s invasion of Ukraine on Australian retail electricity prices did not occur until the second half of 2023. The rise in businesses’ power costs has also been drawn out as supply contracts roll over. By contrast, in many countries the effect was already unwinding by then and dragging headline inflation down. This more drawn-out inflation dynamic is one of the reasons why headline inflation in Australia is still outpacing its peers.
Second, most of the decline in core inflation in advanced economies has been driven by the unwind in goods prices. During the pandemic, goods prices surged. Part of the reason was because supply chains were disrupted. Another was the shift of demand away from services to goods. People could not consume the same amount of services because many service industries were locked down. So they consumed goods instead; goods were effectively ‘other fruit’ to the disrupted services industry. Another part of the boost to demand for goods was the one-off purchase of electronics and other goods needed to support working from home.
These effects are now unwinding around the world. A general decline in demand was not required to achieve this. It was to be expected because the increase in goods prices was a response to other temporary factors, both on the supply side and on the demand side.
A ‘home-grown’ inflation issue
Third, Australia saw a larger peak contribution from goods inflation – almost 4 percentage points – than the other peer economies. At first glance this might have been interpreted as implying that Australia had a larger imbalance of supply versus demand than its peers. However, a deeper look shows this is not the case in general.
At its peak in mid-2022, nearly 2 percentage points of the contribution of goods inflation to total annual inflation was accounted for by one component – home-building costs. Part of this was because supply chain issues affected building materials as well as other commodities. Prices of many building materials are still rising in Australia, even though comparable data for some other countries are showing declines.
But there is more to it than this. ABS data on output prices for residential construction have been rising a bit faster than building materials costs in recent quarters. The price rises therefore can’t all be the passing on of recent increases in materials costs. Some of the difference might be labour costs, including from weather-related stoppages or more generalised poor productivity. Margins are presumably being rebuilt as well. This is understandable given that many builders were squeezed when rising costs collided with existing fixed-price contracts, with some becoming insolvent or otherwise leaving the industry.
Most countries do not include home-building costs in their CPI measure, but Canada does. It is a useful comparator given it, too, has seen strong population growth and rising housing prices. Population growth has been even stronger there than in Australia, exceeding 3% over 2023. The surge in rent inflation in Canada has been similar to that in Australia, peaking at around 8%.
Like Australia, Canada also saw a surge in building costs, but this peaked around the middle of 2022. Since then, the home-building component of the CPI has been declining slightly; it is now 2% below its peak. In contrast, home-building costs as measured in the Australian CPI have increased by around 7% over the same period. This is a significant gap to open up over a relatively short horizon.
An explanation for these Australia-specific developments cannot be found in price data alone. They do, however, show that the economics of construction are not compatible with meeting Australia’s home-building needs. The lingering backlog of approved but uncompleted homes also supports the view that construction industry capacity is currently the main binding constraint. Zoning reform or other interventions unrelated to the capacity and costs of construction will do nothing to address this specific issue. And while some might point to the high level of non-residential and infrastructure construction work calling on the same resources, it is noteworthy that price deflators for these sectors have increased by less than for housing construction.
Given the RBA’s focus on services price inflation, we do not expect this ‘home-grown’ inflation issue would cause it to misinterpret the underlying dynamics of supply and demand in Australia. It should, however, be front of mind in discussions about measures to expand housing supply.
Cliff Notes: Balancing the Risks
Key insights from the week that was.
In Australia, the week started with an encouraging development, the Westpac-MI Consumer Sentiment's headline index rose 6.2% to be at its highest level in over a year, albeit still almost 15% below the long-run average. A ‘trifecta’ of disposable income pressures – high inflation, elevated interest rates and a rising tax burden – have materially impacted household finances. But inflation’s ongoing deceleration towards target and the hoped-for consequence for interest rates – policy easing on the horizon – is now providing some relief.
In February alone, views on the near-term outlook for the economy and family finances have improved, up 8.8% and 2.4% respectively. ‘Time to buy a major household item’ also gained an appreciable 11.3%. However, the family finance and ‘time to buy’ indexes remain well below their long-run averages, highlighting the long recovery ahead for consumer finances and discretionary spending capacity.
While households’ views on the labour market remain sanguine, official labour market data points to a softening labour market. Overall, the January Labour Force Survey was a poor update, underlying weakness amplified by shifting seasonal patterns. The 2.5% decline in hours worked in January, following a downwardly revised 1.5% decline through H2 2023 was particularly striking. January’s outsized decline in hours worked is, at least in part, the result of more people taking holidays in January than has typically occurred through history. The decline in H2 hours points to downside risk to output growth for Q4 2023; January’s result, suggests this may persist into 2024.
With activity growth to remain below trend through 2024, a further deterioration in labour market conditions is likely, albeit only to a still-low unemployment rate of 4.5% by year-end. While abating, the pace and composition of inflation will remain a critical risk over the period as well. Chief Economist Luci Ellis’ essay this week digs into the complex dynamics underlying Australian inflation.
Before moving offshore, a quick note on business. The latest NAB business survey delivered another soft update on the state of the domestic economy in late-January. The business conditions index fell 2pts to +6, extending the downtrend in place since 2022. Unsurprisingly, business confidence remains fragile, the index registering a below-average reading of +1. The most notable development in this survey was with regards to CAPEX spending, now at a ten-year low outside the pandemic. Businesses are clearly responding to the weakness in household demand. Alongside the fading impetus around non-residential construction, this development points to a downbeat near-term outlook for total business investment.
In the US meanwhile, January’s headline CPI came in slightly above consensus at 0.3%mth, 3.1%yr. Given its high weight, growth in the shelter component contributed two-thirds of headline inflation, both in the month and over the year. Medical care services and motor vehicle insurance also saw strong gains, though comparatively small weights limited their contributions to the aggregate. Arguably each of these factors are a consequence of supply dynamics versus demand and are therefore not a material concern for the FOMC, particularly with inflation expectations in retreat. The main point to take from recent US CPI readings is that headline CPI inflation ex-shelter is now tracking below the FOMC’s 2.0%yr target on a one, three and six-month basis. By mid-year, the annual rate will likely be there too.
Retail sales subsequently undershot expectations, the headline measure down 0.8%mth and the control group, which better reflects consumer spending, 0.4% lower. Given inflation, real sales were weaker still. Part of this decline likely reflects a post-sales hangover, but more months of data are necessary before a view on the 2024 demand trend can be formed.
This week, the UK was confirmed to be in recession after GDP was estimated to have declined 0.3%qtr in Q4, the consequence of a decline in both household and government consumption. The January CPI, released earlier in the week, meanwhile grew 4.0%yr with services inflation contributing 80% of the aggregate rise. Creating additional risk for services inflation, wages grew 6.2%yr in December, only slightly below the 6.7%yr prior. Even with the UK economy in recession, these conditions make it difficult for the Bank of England to cut rates. We expect the first rate cut to come in June, but progress thereafter will be slow.
Japan also finds itself in a technical recession after GDP fell 0.1%qtr in Q4 2023 owing to declining household consumption and investment. A silver lining is the benefit Japan continues to receive from tourism, net exports partly offsetting the contraction in domestic demand. Of more concern than the technical result is that household consumption has now contracted for three consecutive quarters with services consumption, typically more affected by wages outcomes, down in Q4. This data strengthens the case for the Bank of Japan to keep policy settings where they are and to be particularly mindful of the strength of sentiment and inflation expectations, both critical to achieving 2.0%yr inflation sustainably into the medium term.