Sample Category Title
EUR/USD Daily Outlook
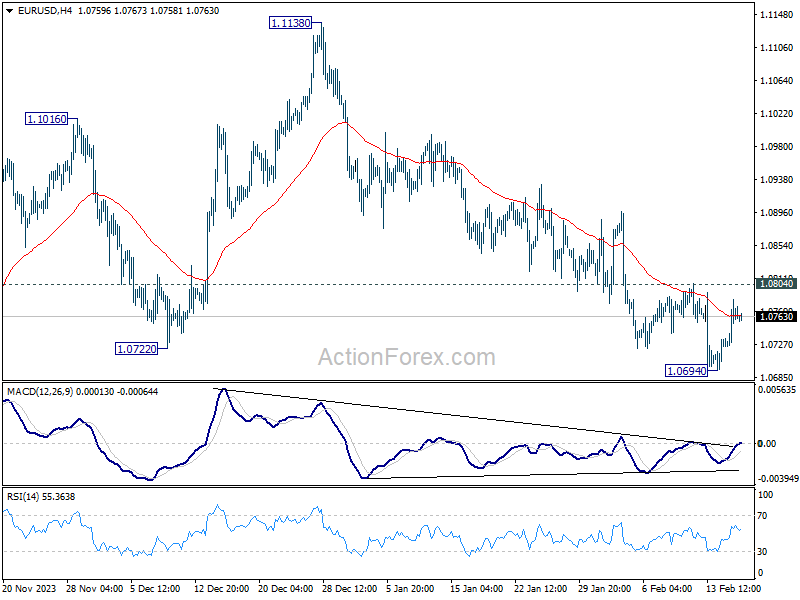
Daily Pivots: (S1) 1.0737; (P) 1.0761; (R1) 1.0797; More...
EUR/USD is extending the consolidation from 1.0693 and intraday bias remains neutral. Outlook will remain bearish as long as 1.0804 resistance holds. Below 1.0694 will resume the fall from 1.1138 to retest 1.0447 support. Nevertheless, considering bullish convergence condition in 4H MACD, above 1.0804 will turn bias to the upside for stronger rebound.
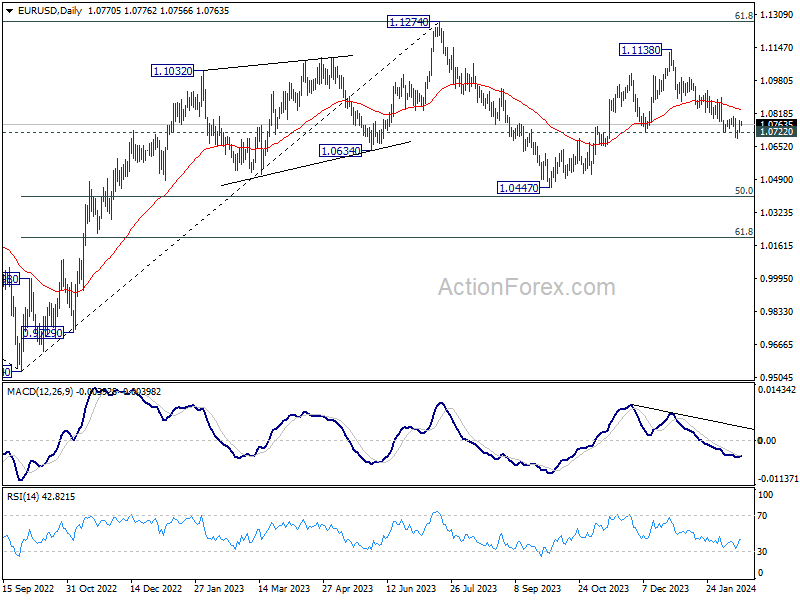
In the bigger picture, price actions from 1.1274 are viewed as a corrective pattern to rise from 0.9534 (2022 low). Rise from 1.0447 is seen as the second leg. While further rally could cannot be ruled out, upside should be limited by 1.1274 to bring the third leg of the pattern. Meanwhile, sustained break of 1.0722 support will argue that the third leg has already started for 1.0447 and possibly below.
GBP/USD Daily Outlook
Daily Pivots: (S1) 1.2561; (P) 1.2581; (R1) 1.2621; More...
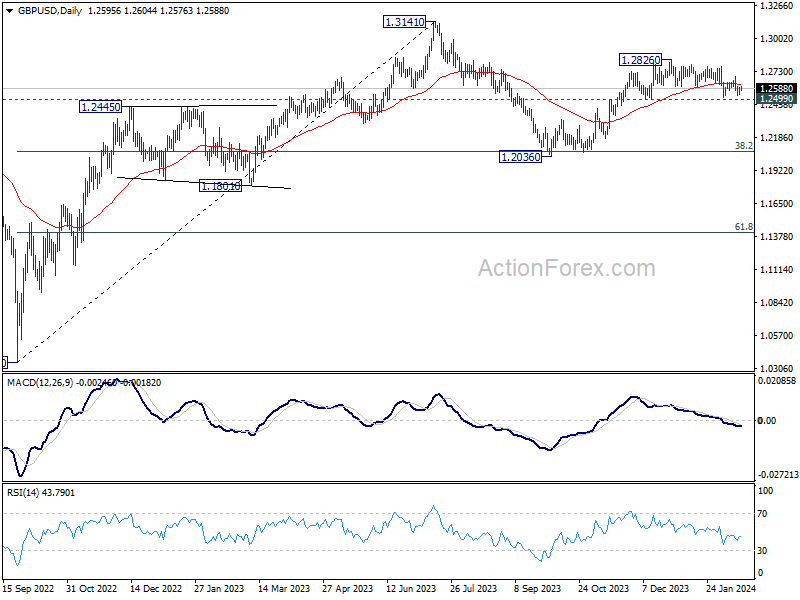
Intraday bias in GBP/USD remains in for the moment and outlook is unchanged. On the upside, break of 1.2691 resistance will indicate that correction from 1.2826 has completed. Intraday bias will be back on the upside for retesting 1.2826. Nevertheless, decisive break of 1.2499 will argue that whole rise from 1.2036 has completed and turn near term outlook bearish.
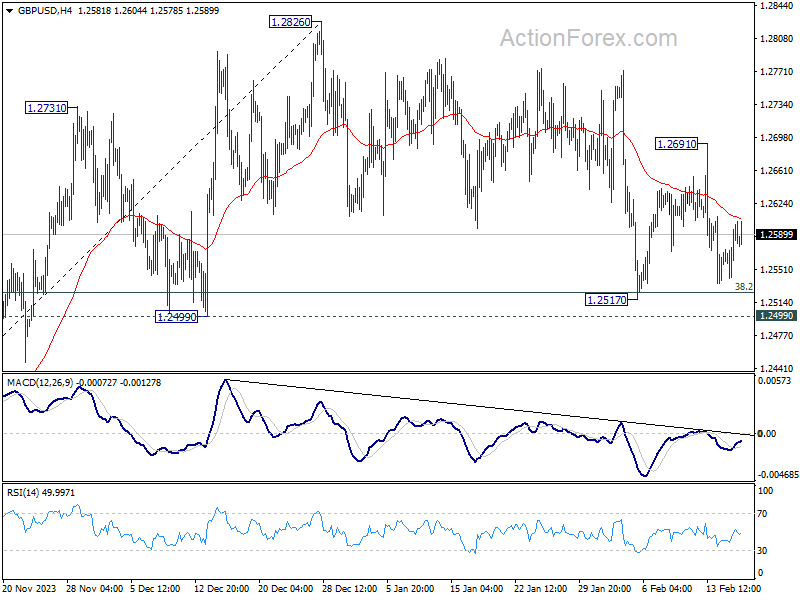
In the bigger picture, price actions from 1.3141 medium term top are seen as a corrective pattern to up trend from 1.0351 (2022 low). Rise from 1.2036 is seen as the second leg, which could be still in progress. But upside should be limited by 1.3141 to bring the third leg of the pattern. Meanwhile, break of 1.2499 support will argue that the third leg has already started for 38.2% retracement of 1.0351 (2022 low) to 1.3141 at 1.2075 again.
USD/CHF Daily Outlook
Daily Pivots: (S1) 0.8767; (P) 0.8816; (R1) 0.8850; More....
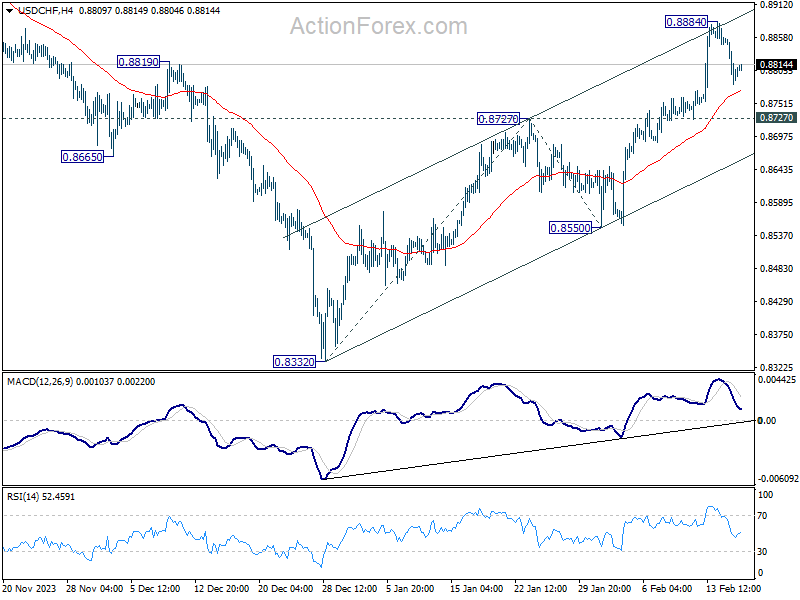
Intraday bias in USD/CHF remains neutral as consolidation continues below 0.8884. Some more consolidative trading would be seen but downside should be contained by 0.8727 resistance turned support to bring another rally. On the upside, above 0.8884 will resume the rise from 0.8332 to 100% projection of 0.8332 to 0.8727 from 0.8550 at 0.8954. Firm break there will pave the way to 161.8% projection at 0.9189. However, sustained break of 0.8727 will dampen this bullish view, and turn bias back to the downside for 0.8550 support instead.
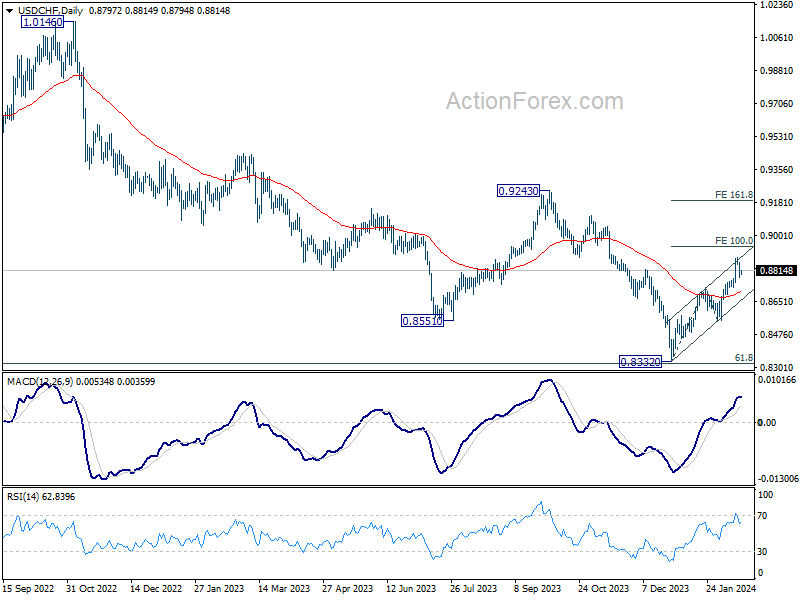
In the bigger picture, a medium term bottom should be formed at 0.8332, on bullish convergence condition in W MACD, just ahead of 0.8317 long term fibonacci support, on bullish convergence condition in W MACD. It's still early to decide if the larger down trend from 1.0146 (2022 high) is reversing. But further rise should be seen to 0.9243 resistance even as a correction.
USD/JPY Daily Outlook
Daily Pivots: (S1) 149.47; (P) 150.02; (R1) 150.50; More...
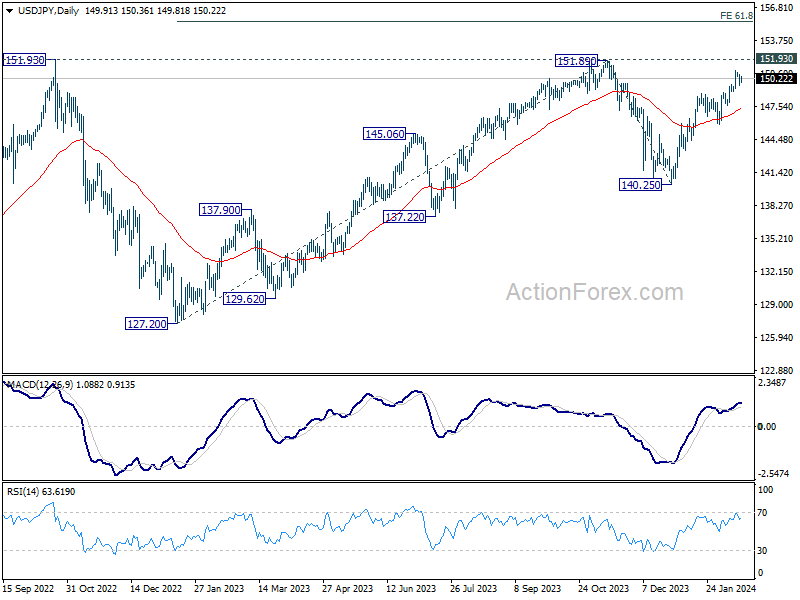
USD/JPY is extending the consolidation from 150.87 and intraday bias stays neutral. Downside of retreat should be contained by 148.79 resistance turned support to bring another rally. Above 150.87 will resume the rise from 140.25 to 151.89/93 key resistance zone. Decisive break there will confirm larger up trend resumption of 155.50 projection level next. However, firm break of 148.79 will turn bias to the downside for 145.88 support.
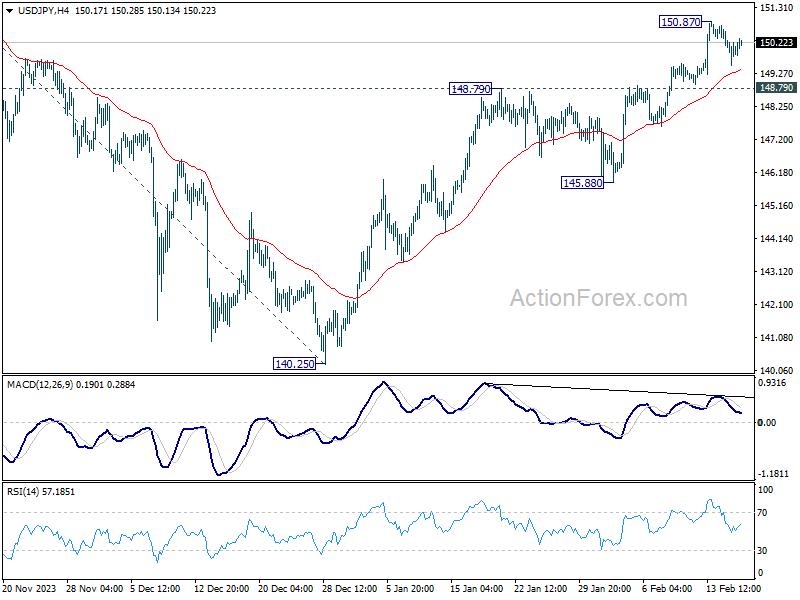
In the bigger picture, fall from 151.89 is seen as a correction to the rally from 127.20, which might have completed at 140.25 already. Firm break of 151.89/93 resistance zone will confirm up trend resumption, and next target will be 61.8% projection of 127.20 to 151.89 from 140.25 at 155.50. This will now remain the favored case as long as 140.25 support holds.
AUD/USD Daily Report
Daily Pivots: (S1) 0.6492; (P) 0.6511; (R1) 0.6544; More...
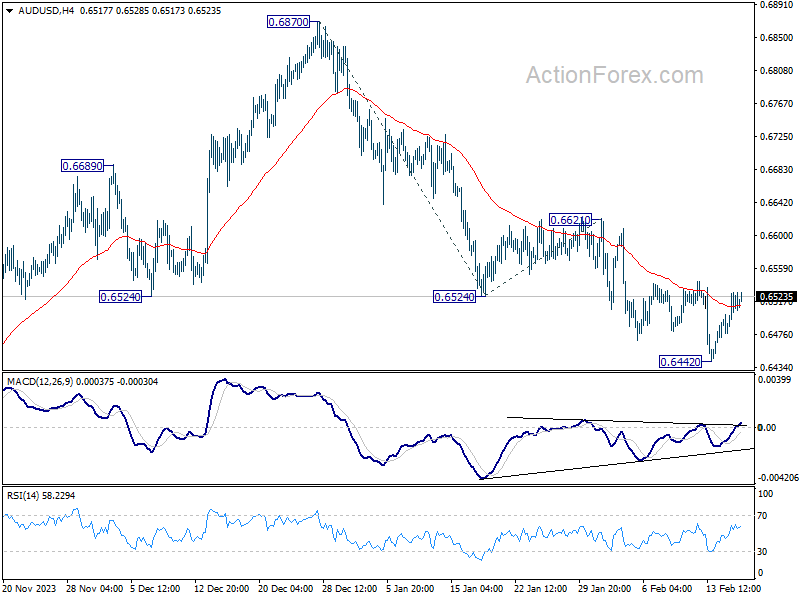
Intraday bias in AUD/USD remains neutral as consolidation from 0.6442 is still extending. Outlook will stay bearish as long as 0.6621 resistance holds. Below 0.6442 will resume the fall from 0.6870 to 61.8% projection of 0.6870 to 0.6524 from 0.6621 at 0.6407. Firm break there will target 100% projection at 0.6275, which is close to 0.6269 support.
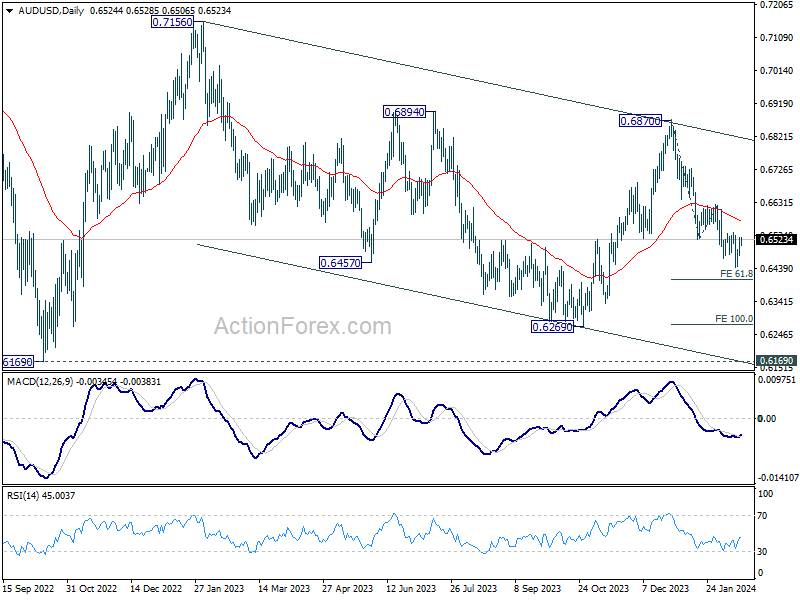
In the bigger picture, price actions from 0.6169 (2022 low) are seen as a medium term corrective pattern to the down trend from 0.8006 (2021 high). Fall from 0.7156 (2023 high) is seen as the second leg, which might still be in progress. Overall, sideway trading could continue in range of 0.6169/7156 for some more time. But as long as 0.7156 holds, an eventual downside breakout would be mildly in favor.
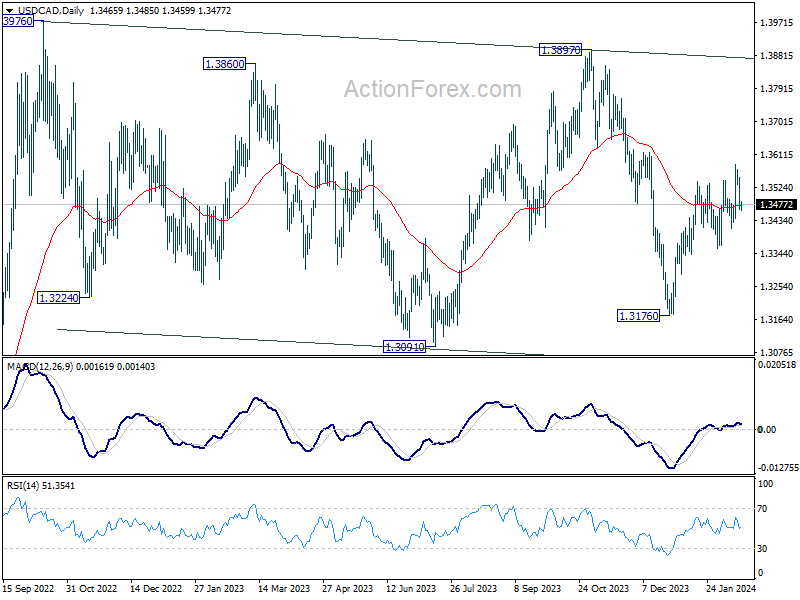
USD/CAD Daily Outlook
Daily Pivots: (S1) 1.3435; (P) 1.3494; (R1) 1.3523; More...
Intraday bias in USD/CAD is turned neutral with current retreat. Some consolidations would be seen, but further rally is expected as long as 1.3357 support holds. On the upside, break of 1.35858 will resume whole rally from 1.3176 towards 1.3897 resistance.
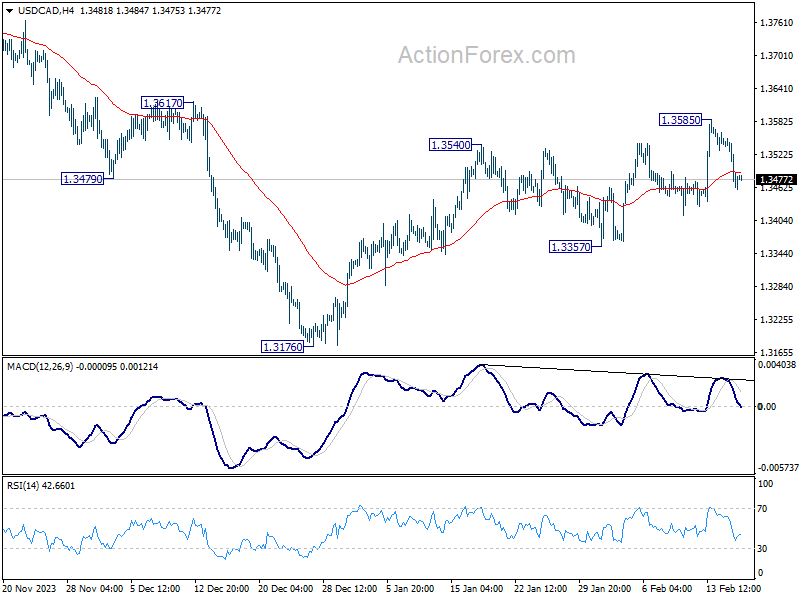
In the bigger picture, price actions from 1.3976 (2022 high) are viewed as a corrective pattern only. In case of another fall, strong support should emerge above 1.2947 resistance turned support to bring rebound. Overall, larger up trend from 1.2005 (2021 low) is still expected to resume through 1.3976 at a later stage.
GBP/USD Attempts Recovery While EUR/GBP Gains Strength
GBP/USD is attempting a fresh increase from the 1.2535 zone. EUR/GBP is gaining pace and might extend its rally above the 0.8570 zone.
Important Takeaways for GBP/USD and EUR/GBP Analysis Today
- The British Pound is attempting a recovery above the 1.2550 zone against the US Dollar.
- There is a key rising channel forming with support at 1.2570 on the hourly chart of GBP/USD at FXOpen.
- EUR/GBP started a fresh increase above the 0.8535 resistance zone.
- There is a major bullish trend line forming with support near 0.8550 on the hourly chart at FXOpen.
GBP/USD Technical Analysis
On the hourly chart of GBP/USD at FXOpen, the pair started a fresh decline from the 1.2690 zone. The British Pound traded below the 1.2600 zone against the US Dollar.
A low was formed near 1.2535 and the pair is now attempting a recovery wave. There was a break above the 23.6% Fib retracement level of the downward move from the 1.2690 swing high to the 1.2535 low. The pair settled above the 50-hour simple moving average and 1.2570.
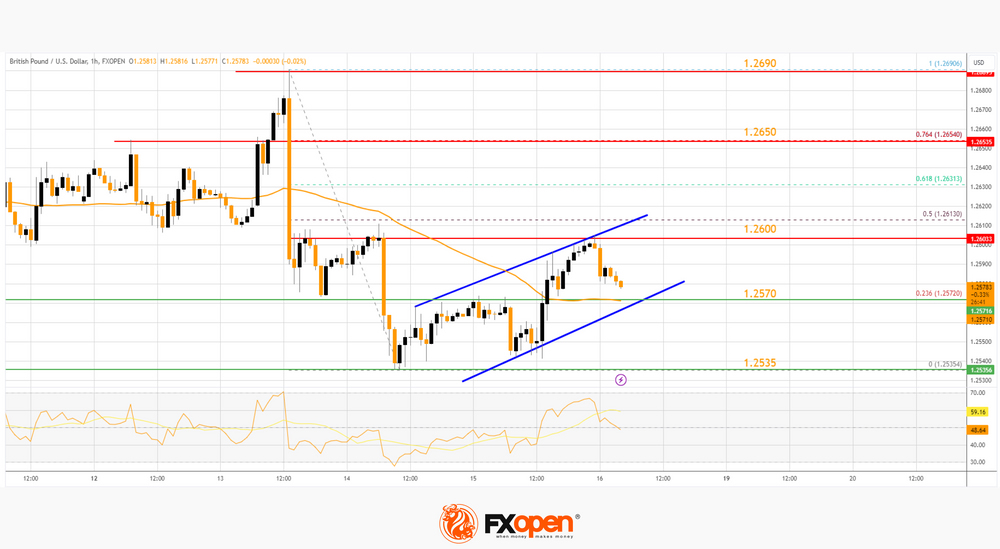
On the upside, the GBP/USD chart indicates that the pair is facing resistance near 1.2600 or the 50% Fib retracement level of the downward move from the 1.2690 swing high to the 1.2535 low.
The next major resistance is near the 1.2650 level. If the RSI moves above 60 and the pair climbs above 1.2650, there could be another rally. In the stated case, the pair could rise toward the 1.2720 level or even 1.2750.
On the downside, there is a major support forming near 1.2570 and a key rising channel. If there is a downside break below the 1.2570 support, the pair could accelerate lower. The next major support is near the 1.2535 zone, below which the pair could test 1.2500. Any more losses could lead the pair toward the 1.2450 support.
EUR/GBP Technical Analysis
On the hourly chart of EUR/GBP at FXOpen, the pair started a fresh increase from the 0.8500 zone. The Euro traded above the 0.8530 level to move into a positive zone against the British Pound.
The EUR/GBP chart suggests that the pair settled above the 50-hour simple moving average and 0.8535. It traded as high as 0.8570 before there was a downside correction. There was a move below the 23.6% Fib retracement level of the upward move from the 0.8498 swing low to the 0.8570 high.
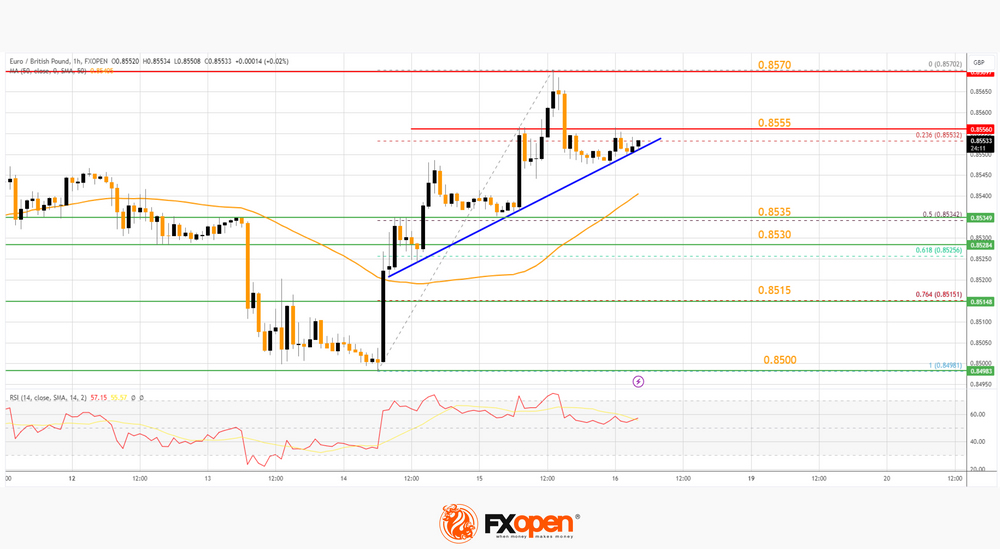
Immediate support sits near a major bullish trend line at 0.8550. The next major support is near the 50% Fib retracement level of the upward move from the 0.8498 swing low to the 0.8570 high at 0.8535.
A downside break below the 0.8535 support might call for more downsides. In the stated case, the pair could drop toward the 0.8515 support level. Any more losses might send the pair toward the 0.8500 level in the near term.
Immediate resistance is near 0.8555. The next major resistance for the bulls is near the 0.8570 zone. A close above the 0.8570 level might accelerate gains.
In the stated case, the bulls may perhaps aim for a test of 0.8620. Any more gains might send the pair toward the 0.8700 level in the coming days.
Trade over 50 forex markets 24 hours a day with FXOpen. Take advantage of low commissions, deep liquidity, and spreads from 0.0 pips. Open your FXOpen account now or learn more about trading forex with FXOpen.
This article represents the opinion of the Companies operating under the FXOpen brand only. It is not to be construed as an offer, solicitation, or recommendation with respect to products and services provided by the Companies operating under the FXOpen brand, nor is it to be considered financial advice.
Strong January UK Retail Sales Push Sterling and UK Yields Higher
Markets
US eco data were too plenty yesterday to give a clear signal for trading. Markets initially singled out disappointing US retail sales, which declined more than expected in January (-0.8% M/M vs -0.2% M/M). Sales in the control group, used as a proxy for consumption in GDP calculations, fell by 0.4% M/M. US Treasuries tried to rally on the release with the dollar spiking lower. US equity markets had a wobbly start, but soon started marching higher again. The moves on Treasury and FX markets petered out as well given that weaker retail sales were flanked by improving regional business surveys (NY & Philadelphia), accelerating import/export prices and another low figure of weekly jobless claims. US yields eventually ended around 2.5 bps lower across the curve with an underperformance of the front end of the curve (2-yr -0.4 bps). Today’s US calendar is again jampacked with housing starts, building permits, producer price inflation and University of Michigan consumer confidence. From a market point of view, PPI figures will likely trigger the instinctive reaction (like US retail sales yesterday), but the abundance of signals makes a strong directional move again rather unlikely especially with the long US weekend ahead. Markets are shut on Monday for President’s Day. Technically, we assume that breaks above key resistance levels in yield terms will be confirmed into this week’s close.
US Treasuries face some selling pressure overnight with comments by Atlanta Fed governor Bostic resonating. He warned that it will take some time to hit the 2% inflation target, even if the January CPI report from earlier this week turns out to be an aberration. Bostic is considered as a neutral FOMC member and surprised by suggesting that the room for a first rate cut could only open up in July (!). He advocates only two rate cuts this year, compared with the median Fed projections of three such moves. The December Summary of Economic Projections showed 8 out of 19 Fed members sponsoring only a maximum of two cuts this year. The January Fed meeting, Powell’s appearance in 60 Minutes, a stellar payrolls report and January CPI data forced money markets to shift focus/bets on a first move from March to June which is thus still too soon according to Bostic. Markets will be closely screening comments by Richmond Fed Barkin and SF Fed Daly later today for more such time-specific comments.
Strong January UK retail sales push sterling and UK yields higher at the start of today’s trading. Retails sales rose 3.4% M/M vs 1.5% consensus. They add some more volatility to an interesting trading week with strong labour market figures, disappointing Q4 GDP and somewhat better inflation figures. We nevertheless expect EUR/GBP 0.85 support to survive.
News & Views
“We have to spend more, we have to spend better, we have to spend European.” The president of the European Commission von der Leyen in an interview with the Financial Times called for a European approach to a currently very fragmented defense market divided on national lines. But increased geopolitical threats require Europe’s military industrial complex to be geared up in terms of size and efficiency. The EC is developing a strategy akin to the one where taxpayer cash was used for the production of Covid vaccines and joint purchases of gas. Proposals in the plan as such focus on using the budget to subsidize the sector. The interview does not touch upon tapping capital markets as a way to finance defense spending on a European level. But one can clearly see the potential of doing so in way similar to EUNextGen.
The Fed’s reverse repo facility usage fell below $500bn for the first time since mid-2021. While that level is mainly symbolical, it marks a sharp drop from the +$2250 bn peak levels seen between mid-2022 and mid-2023, when market participants stored excess cash awaiting the end of the Fed’s historical tightening cycle before investing it elsewhere. The drawdown accelerated after the US Treasury ramped up bill issuance, serving as a short-term alternative, after the suspension of the debt ceiling in June. The RRF caught extra market attention after Dallas Fed president Logan in January referred to it as a measure of excess reserves serving as important input in the discussion to slowdown the pace of quantitative tightening (currently $95bn/month).
US Stock Markets Find a Positive Narrative to Keep the Rally Going
The S&P500 rebounded past the 5000 yesterday. This time, a mixed set of manufacturing data and a drop in US retail sales – which fell the most in almost a year – were brought forward as soothing factors regarding the dovish Federal Reserve (Fed) expectations. But if retail sales had remained strong, investors would’ve been as happy to see the US economy land soft.
We are coming to a point where the economic data becomes meaningless. Whatever the data prints, the US stock markets find a positive narrative to keep the rally going. It’s, of course, blind optimism; investors are blinded by the brilliance of the rate cuts at the tunnel’s end.
Today, the US will reveal the latest producer price update. The producer price inflation is expected to have slowed in January. And if it didn’t, it doesn’t matter.
What’s more interesting is that
This week only, we learned that two of the G7 economies entered recession: Japan and the UK. Japan lost its spot of the world’s 3rd biggest economy to Germany, while Germany is in the process of losing its status as the European growth engine. GDP growth per head in the UK hints that the recession started two years ago. Growth in the euro area remains anemic, on the other hand, as the Eurozone economies struggle with rising interest rates.
But when you look at the stock markets, the Stoxx 50 index traded at an ATH even though the fourth quarter earnings misses in the region haven’t been this bad for at least 4 years, according to Bloomberg. Meanwhile the Japanese Nikkei index is closing in on a record high as well – the index is now at a spitting distance from the highest levels since 1990s despite entering recession in the second half of last year. Negative rates and the ultra-cheap yen keep stocks prices running up a mountain.
But the global stock markets are not breathing on their own at this altitude. If the central banks pull out the oxygen support, parts of the market should come down tumbling.
In the FX
The US dollar index retreated to 100-DMA and sees support at this level. The EURUSD tested its own 100-DMA resistance to the upside and sees resistance at this level. The USDJPY bulls sit timidly above the 150 level, knowing that this is probably a peak, or close to a peak before the Japanese do something to reverse the selloff. And Cable makes repeated attempts below its 200-DMA and needs the dollar bulls to make a decisive move to the upside to continue its journey to the 1.25 level. Gold is back above the $2000 per ounce, but the positive pressure in the US yields will likely weigh on the yellow metal appetite and prevent the gold diggers from aiming for new highs as the Fed doves retreat, and Bitcoin is doing just fine. Nine Bitcoin ETFs that have been trading since early January have already amassed $10bn of inflows. And it’s just the beginning.
Elsewhere, oil bulls and bears are fighting near the 200-DMA. Trend and momentum indicators are in favour of a further push toward the $80pb. OPEC’s monthly report showed this week that not all OPEC members are delivering the promised production cuts. In a separate report, the IEA said that the global oil market may be in surplus this year because supplies outside OPEC are expected to increase by 1.6mbpd; the US, Brazil, Canada and Guyana are pumping to fill in the OPEC’s production gap. On the demand side, the IEA sees global oil consumption rising only 1.2mbpd this year, half slower than last year’s increase. The bulls need China to stand up and walk. Otherwise, the road will be bumpier above the 200-DMA.
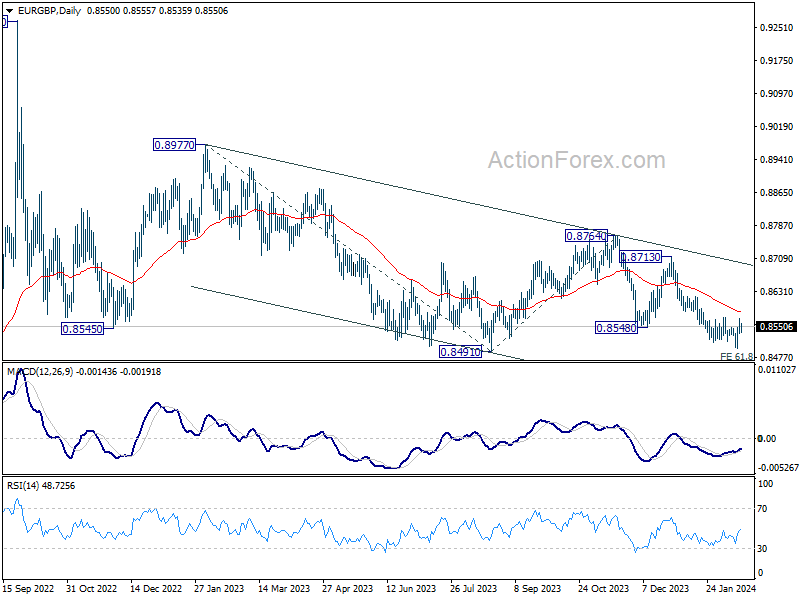
EUR/GBP Daily Outlook
Daily Pivots: (S1) 0.8534; (P) 0.8552; (R1) 0.8568; More...
Intraday bias in EUR/GBP remains neutral for the moment. On the downside, break of 0.8497 will resume extend recent fall to 0.8464 projection level. Nevertheless, considering bullish convergence condition in 4H MACD, sustained break of 0.8571 will confirm short term bottoming, and turn bias back to the upside for stronger rebound.
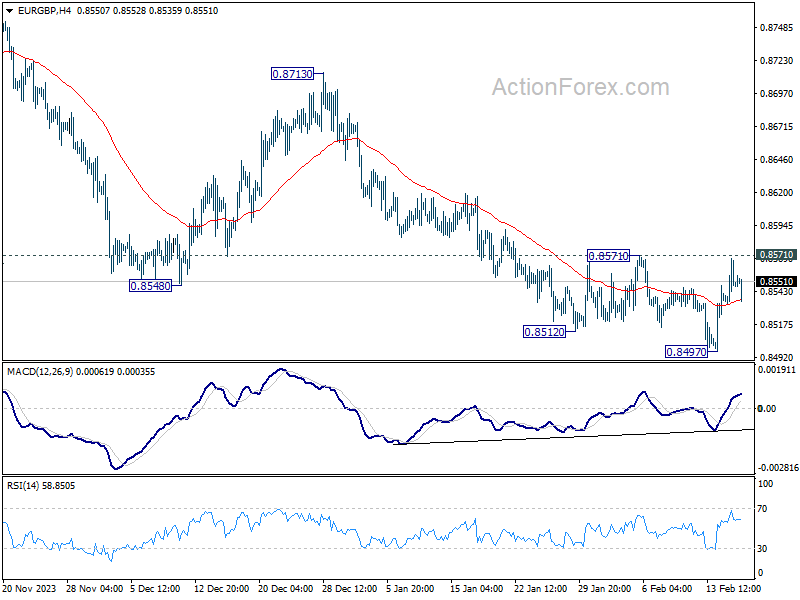
In the bigger picture, fall from 0.8764 is seen as another leg in the whole down trend from 0.9267 (2022 high). Outlook will stay bearish as long as 0.8713 resistance holds. Break of 0.8491 will target 61.8% projection of 0.8977 to 0.8491 from 0.8764 at 0.8464.