
Sample Category Title
EURUSD – Repeated Probe Through Pivotal Supports Adds to Negative Near-term Bias
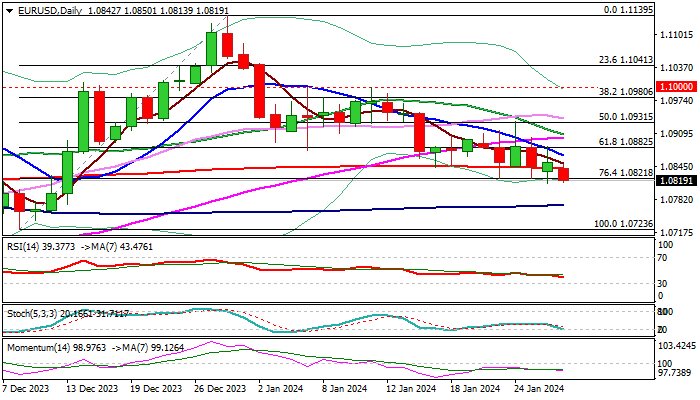
Bearish pressure rises on break below 200DMA (1.0841) and probe through 1.0821 Fibo support (76.4% retracement of 1.0723/1.1139 upleg), as fresh bears also violate the floor of four-day congestion.
Firm break lower to signal continuation of short-term downtrend from 1.1139 (Dec 28 peak) and expose targets at 1.0771 / 56 (100DMA / daily cloud base) and 1.0723/12 (Dec 8 higher low / Fibo 61.8% of 1.0448/1.1139 ascend).
Near-term bearish bias is reinforced by negative momentum and daily MA’s in bearish setup, though close below 1.0821 pivot is required to keep bears in play.
Res: 1.0841; 1.0867; 1.0882; 1.0905
Sup: 1.0812; 1.0771; 1.0756; 1.0723
Bitcoin – Recovery Faces Increased Headwinds at Key Resistance Zone
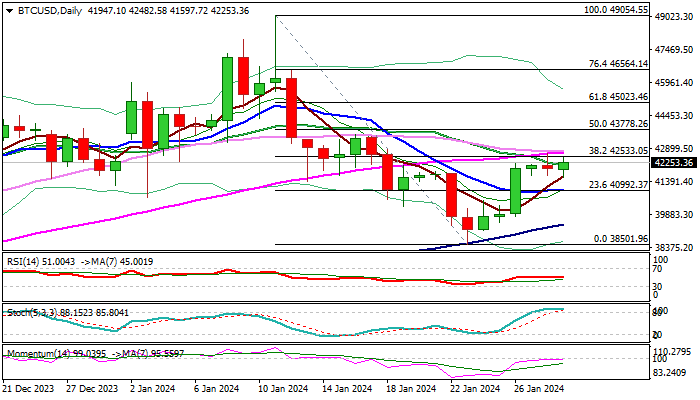
Narrow sideways mode extends into third consecutive day after recovery from two-month low (38501 of Jan 23) showed signs of stall at key resistance zone (42500).
The price action is on track to form the third straight daily Doji candle which points to strong indecision and contributes to signals that corrective phase might be over.
Daily studies remain bearishly aligned as 14-d momentum is still in negative territory, stochastic turned south in overbought zone, though MA’s are in mixed setup.
However, more evidence is needed to signal fresh direction, with dip and close below 10DMA (41036) to generate reversal signal and shift focus to the downside foe renewed probe through key supports at 40000/39000 zone.
Alternatively, sustained break of 42500/42700 zone would signal bullish continuation, which will be confirmed on lift and close above daily cloud top (43173).
Res: 42533; 42754; 43173; 43778
Sup: 41597; 40992; 40000; 39392
AUD/USD Eyes Retail Sales
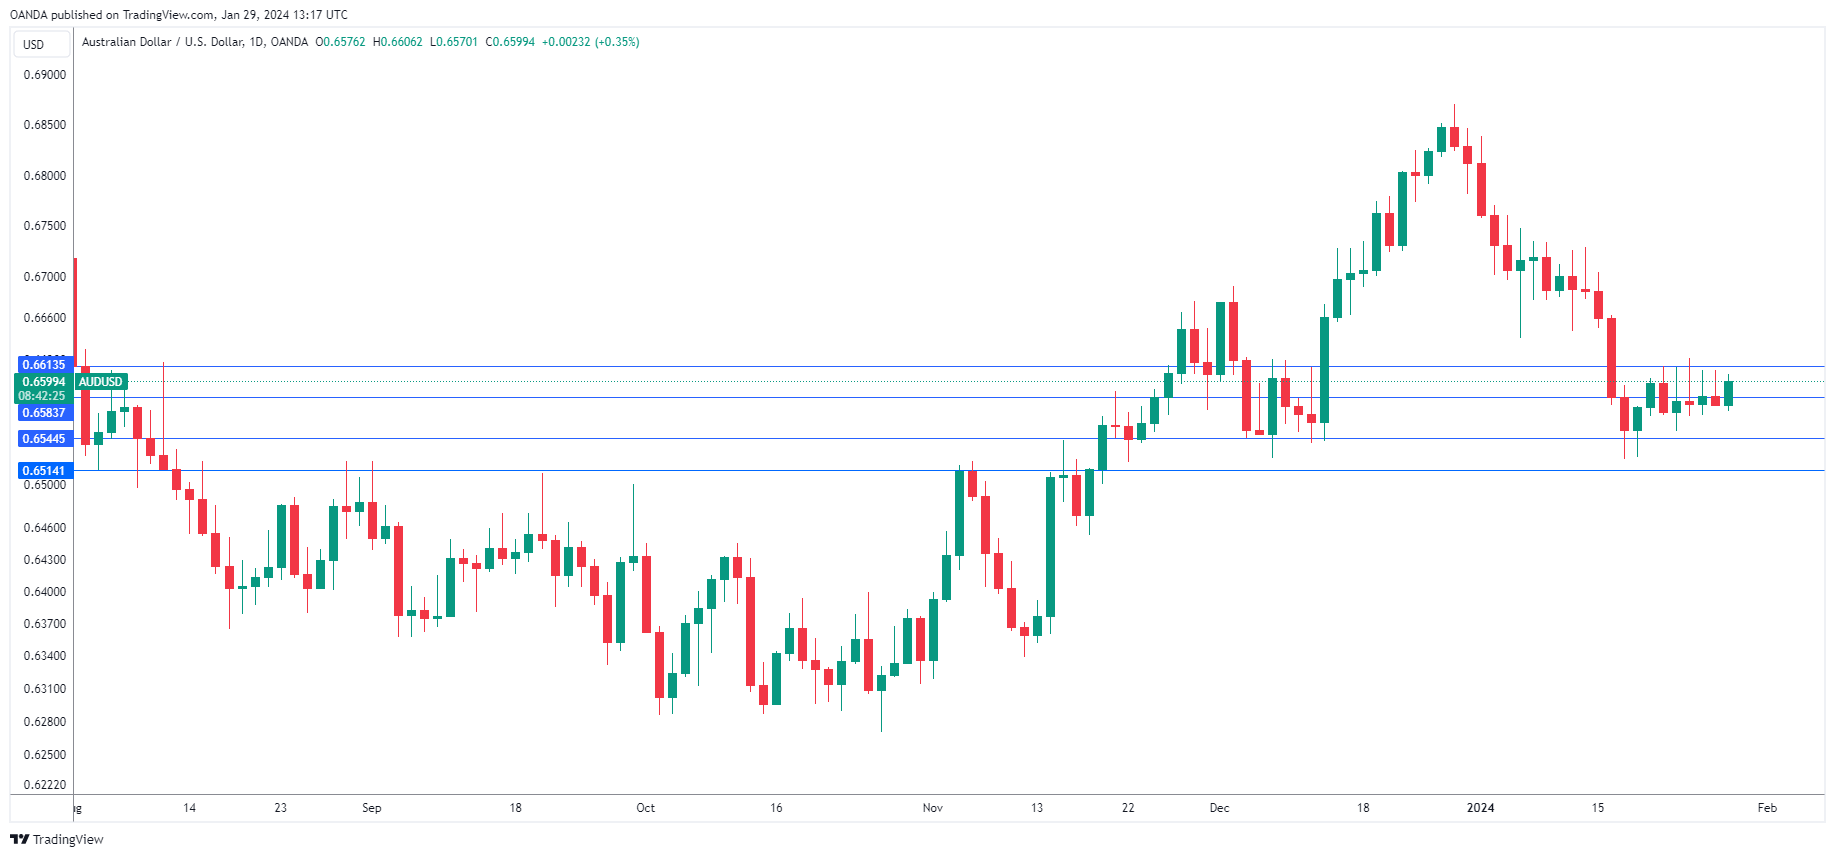
The Australian dollar is in positive territory on Monday after an uneventful week. In the European session, AUD/USD is trading at 0.6603, up o.41%.
Australian retail sales expected to downturn
The markets are braced for a soft retail sales report on Tuesday, with December’s consensus estimate standing at -1.0%. The November report sparkled with a 2% gain, the strongest level since November 2021. The strong gain was driven by Black Friday sales and other discounts and likely came at the expense of the December reading with consumers doing their Christmas shopping early. There could be a surprise to the upside in the retail sales report if consumers took advantage of Boxing Day sales in late December.
The Reserve Bank of Australia meets next on February 6 and has repeatedly said that upcoming rate decisions will be data-dependent. This makes Wednesday’s quarterly inflation report a critical release that will have a significant impact on the central bank’s rate path.
In the US, inflation continues to ease while economic growth remains solid, which is the recipe that the Fed hopes will continue. The US economy expanded by 3.3% in the fourth quarter, blowing past the consensus estimate of 2.0%. On Friday, the Fed’s preferred inflation gauge, the PCE Price Index, rose 0.2% m/m in December, compared to 0.1% in November. On an annual basis, the index remained steady at 2.6%. The Core PCE Index eased to 2.9%, down from 3.2% in November.
The Fed is in no rush to raise rates, and market fever over a March cut have fallen dramatically. The markets have slashed the odds of a quarter-point cut in March to 48%, down sharply from 72% a month ago, according to CME’s FedWatch tool.
AUD/USD Technical
- AUD/USD is testing resistance at 0.6583. There is weak resistance at 0.6613
- There is support at 0.6544 and 0.6514
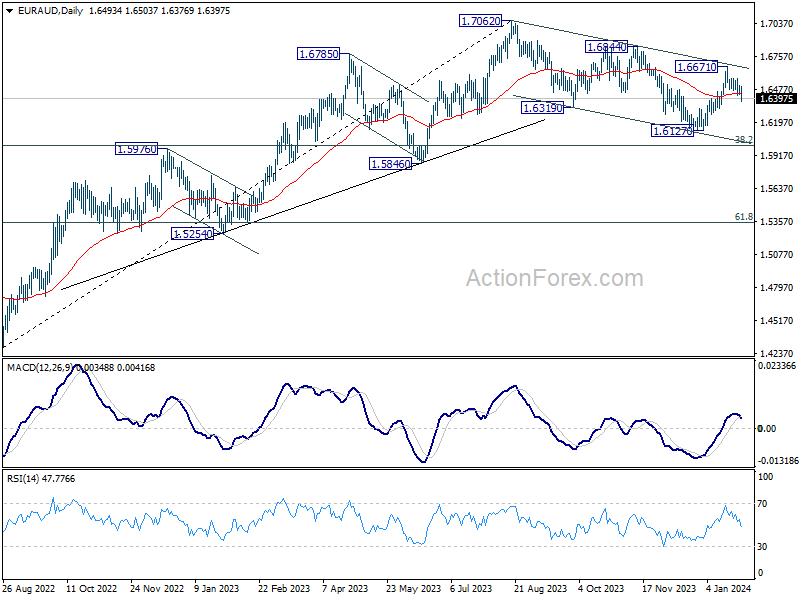
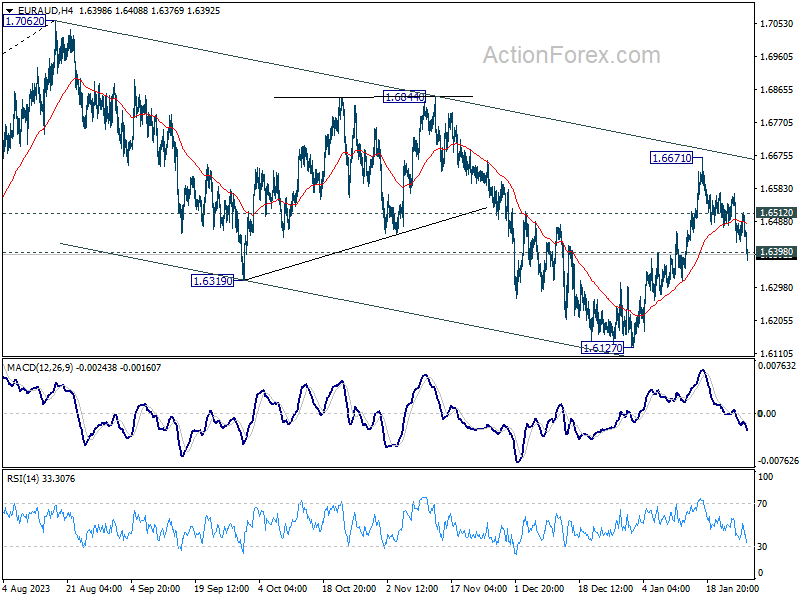
EUR/AUD Mid-Day Outlook
Daily Pivots: (S1) 1.6454; (P) 1.6484; (R1) 1.6536; More...
EUR/AUD's break of 1.6398 minor support argues that rebound from 1.6127 has completed at 1.6671, after rejection by falling channel resistance. Corrective pattern from 1.7062 is possibly still extending, and has just started another leg. Intraday bias is back on the downside for retesting 1.6127 low. On the upside, though, above 1.6512 will flip bias back to the upside for 1.6671 instead.
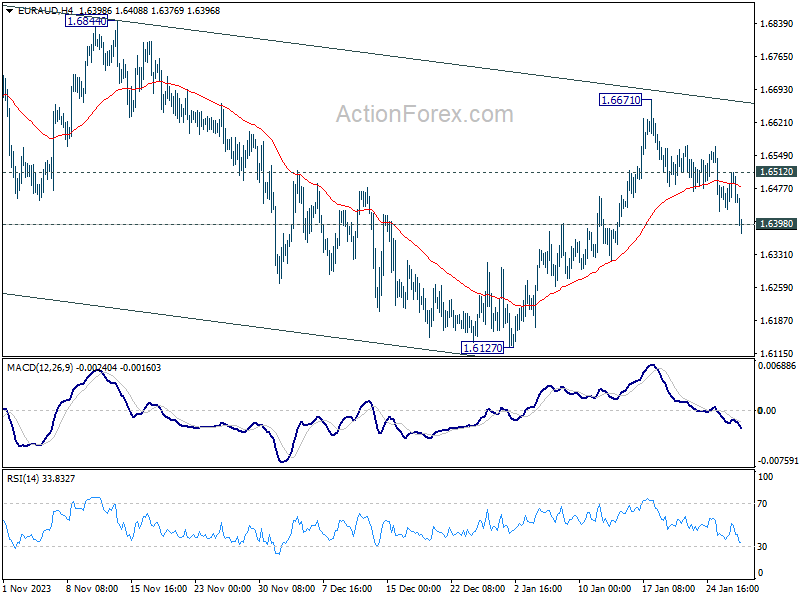
In the bigger picture, fall from 1.7062 medium term top is seen as correction to the up trend from 1.4281 (2022 low). Break of 1.6844 resistance will argue that this up trend is ready to resume through 1.7062 high. In case of another fall, strong support should be seen around 1.5846 and 38.2% retracement of 1.4281 to 1.7062 at 1.6000 to bring rebound.
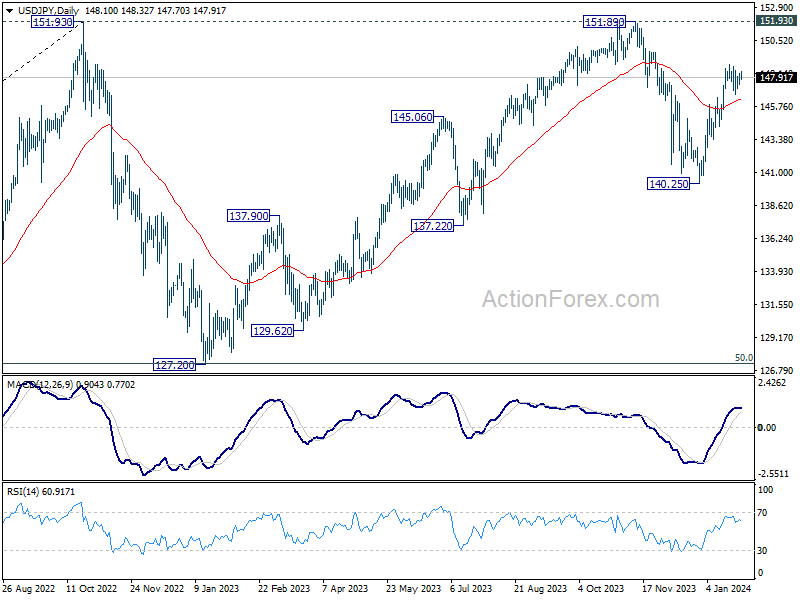
USD/JPY Mid-Day Outlook
Daily Pivots: (S1) 147.65; (P) 147.93; (R1) 148.45; More...
Range trading continues in USD/JPY and intraday bias remains neutral. With 145.97 resistance turned support intact, further rally is in favor. As noted before, corrective fall from 151.89 should have completed at 140.25 already. Break of 148.79 will resume the rise from there for retesting 151.89/93 key resistance zone.
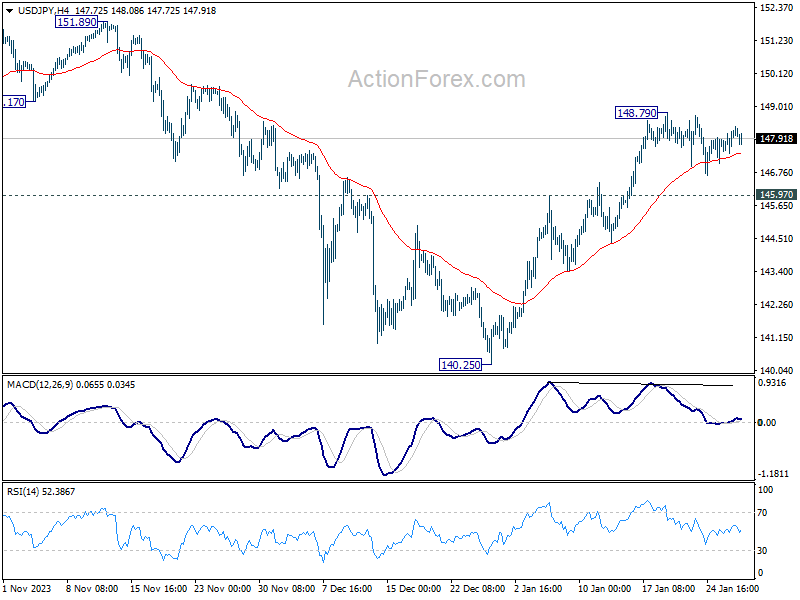
In the bigger picture, stronger than expected rebound from 140.25 dampened the original bearish review. Strong support from 55 W EMA (now at 142.33) is also a medium term bullish sign. Fall from 151.89 could be a correction to rise from 127.20 only. Decisive break of 151.89/93 will confirm resumption of long term up trend. This will now be the favored case as long as 140.25 support holds.
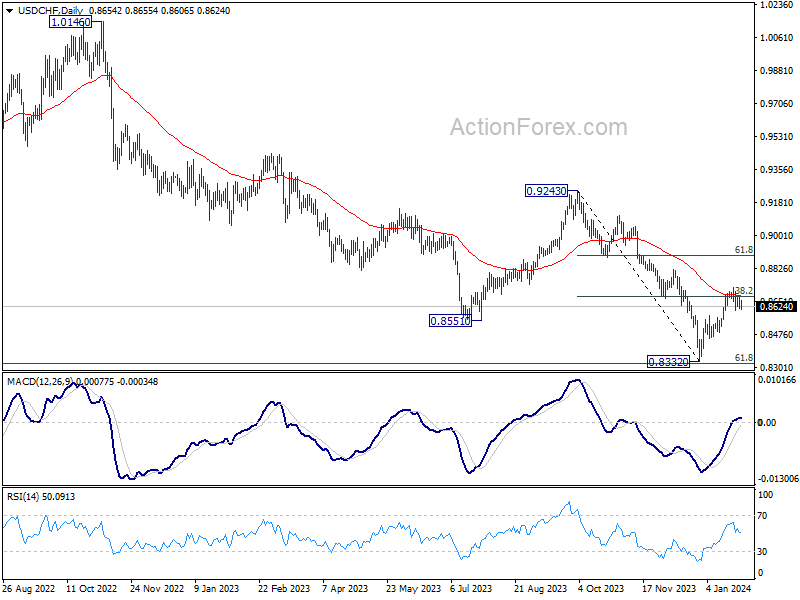
USD/CHF Mid-Day Outlook
Daily Pivots: (S1) 0.8610; (P) 0.8647; (R1) 0.8678; More....
USD/CHF is still bounded in tight range and intraday bias stays neutral. On the downside, below 0.8605 will resume the pull back from 0.8727 to 0.8487 support. Break there will argue that rebound from 0.8332 has completed, and bring retest of this low. On the upside, firm break of 0.8727 will resume the rebound to 61.8% retracement of 0.9243 to 0.8332 at 0.8995 instead.
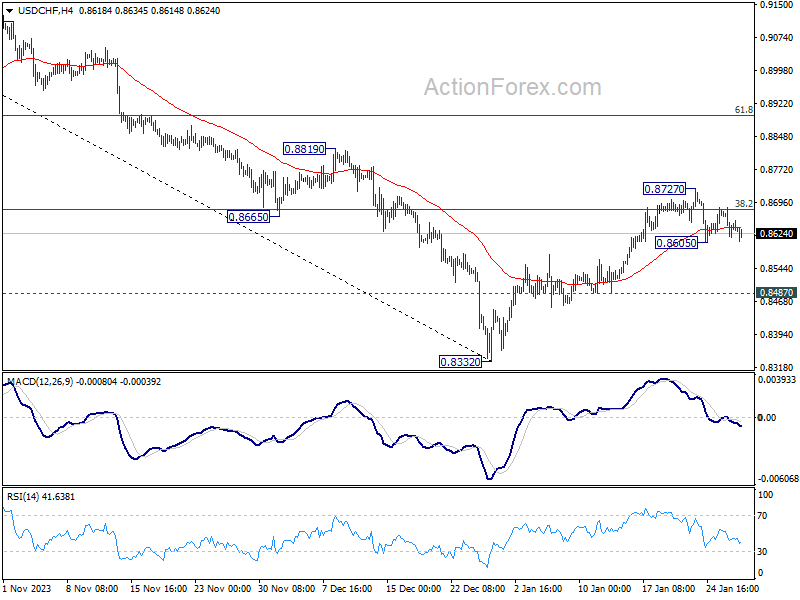
In the bigger picture, while rebound from 0.8332 could be strong, there is no clear sign of medium term bottoming yet. This rebound is tentatively seen as a corrective move for now. Also, outlook will stay bearish as long as 0.9243 resistance holds. Larger down trend from 1.0146 (2022 high) should resume through 0.8332 low at a later stage.
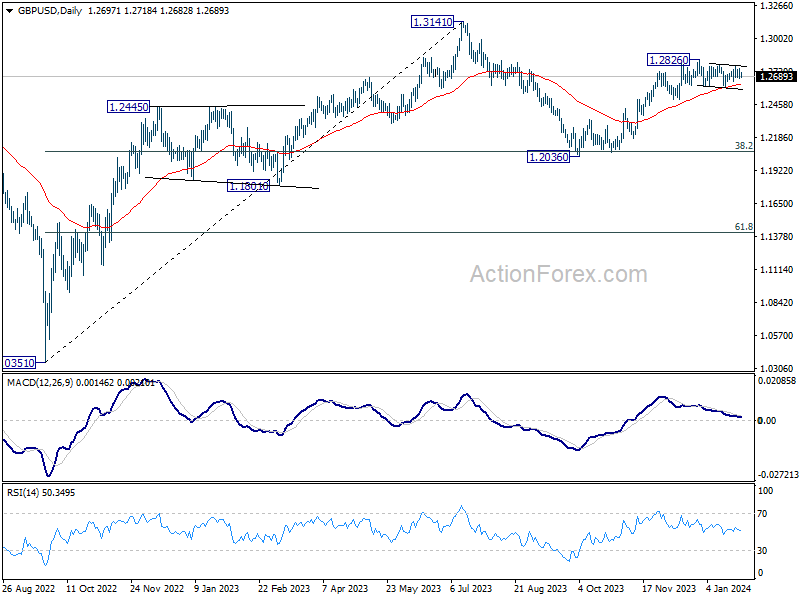
GBP/USD Mid-Day Outlook
Daily Pivots: (S1) 1.2666; (P) 1.2712; (R1) 1.2748; More...
No change in GBP/USD's outlook as consolidation from 1.2826 is still extending. Another fall cannot be ruled out, but downside should be contained above 1.2499 support to bring rebound. On the upside, firm break of 1.2784 resistance will suggest that consolidation pattern has completed. Further rise should be seen through 1.2826 to resume the rally from 1.2036. Next target will be 1.3141 high.
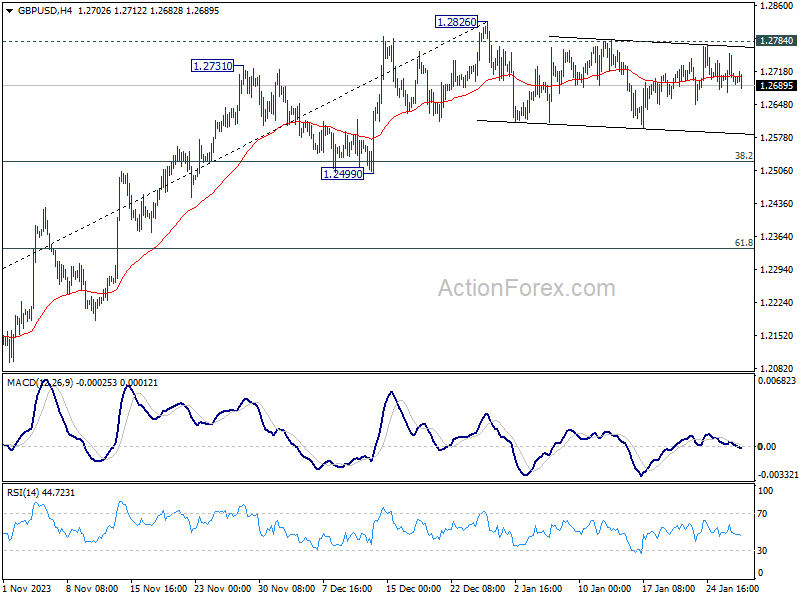
In the bigger picture, price actions from 1.3141 medium term top are seen as a corrective pattern to up trend from 1.0351 (2022 low). Rise from 1.2036 is seen as the second leg that's in progress. Upside should be limited by 1.3141 to bring the third leg of the pattern. Meanwhile, break of 1.2499 support will argue that the third leg has already started for 38.2% retracement of 1.0351 (2022 low) to 1.3141 at 1.2075 again.
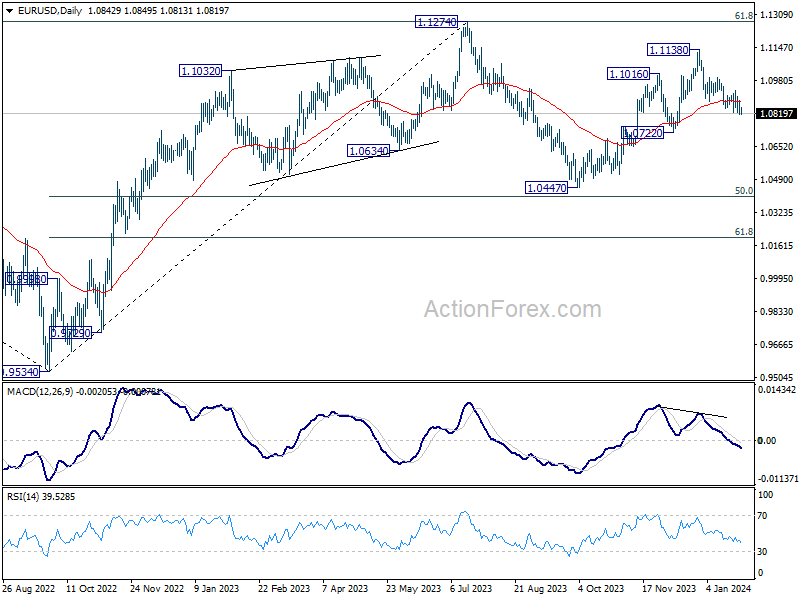
EUR/USD Mid-Day Outlook
Daily Pivots: (S1) 1.0816; (P) 1.0851; (R1) 1.0889; More...
EUR/USD is staying above 1.0812 temporary low and intraday bias remains neutral for now. Further decline is mildly in favor as long as 1.0931 resistance holds. On the downside, break of 1.0812 will resume the fall from 1.1138 to 1.0722 support. On the upside, above 1.0931 will turn bias to the upside for stronger rebound towards 1.1138 resistance.
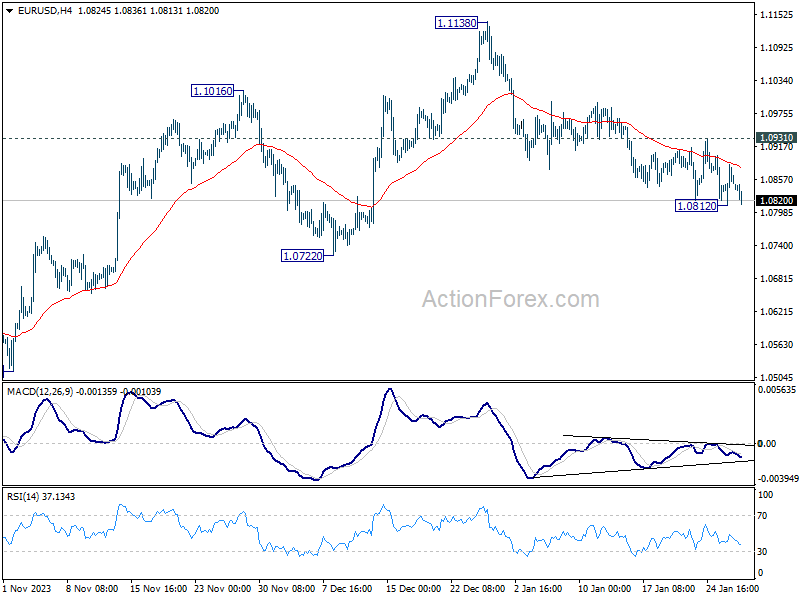
In the bigger picture, price actions from 1.1274 are viewed as a corrective pattern to rise from 0.9534 (2022 low). Rise from 1.0447 is seen as the second leg. While further rally could cannot be ruled out, upside should be limited by 1.1274 to bring the third leg of the pattern. Meanwhile, sustained break of 1.0722 support will argue that the third leg has already started for 1.0447 and below.
Euro Weakens on Prospects of Early ECB Rate Cut
Euro weakens broadly today amid signals from ECB officials that a rate cut cycle could commence in June, or even earlier in April. This bearish sentiment towards the common currency heightens the significance of upcoming Eurozone economic data releases, with GDP figures tomorrow and CPI data on Thursday poised to play crucial roles in shaping market expectations. Particularly, any negative surprises in growth data could intensify market bets on ECB's loosening of policy to counteract what is likely an ongoing recession in Eurozone.
Concurrently, Euro's selloff is exerting some downward pressure on both Sterling and Swiss Franc. Meanwhile, Dollar also faces weakness, partly due to a sharp drop in US 10-year yield. Despite this, the greenback remains within ranges, with its directional breakout hinging on Fed's upcoming rate decision and the barrage of significant economic data due this week.
Technically, EUR/AUD's decline today argues that rebound from 1.6127 might have already completed at 1.6671, ahead of falling channel resistance. Deeper fall is now in favor as long as 1.6512 minor resistance holds. Current decline is part of the corrective pattern from 1.7062 high, and would target 1.6127 support again next.
In Europe, at the time of writing, FTSE is up 0.08%. DAX is down -0.55%. CAC is down -0.12%. UK 10-year yield is down -0.0385 at -4.105. Germany 10-year yield is down -0.054 at 2.251. Earlier in Asia, Nikkei rose 0.77%. Hong Kong HSI rose 0.78%. China Shanghai SSE fell -0.92%. Singapore Strait Times fell -0.61%. Japan 10-year JGB yield rose 0.0054 to 0.725.
ECB's de Guindos: No fixed calendar for rate cuts
ECB Vice President Luis de Guindos expressed a cautiously optimistic view on the trajectory of inflation in Eurozone. But he also emphasized that the central bank is data-dependent regarding cutting interest rates, rather than time-dependent.
"There has been good news regarding the evolution of inflation, and that — sooner or later — will end up being reflected in the monetary policy," he told Spain's RNE radio.
However, he was clear about ECB's stance being firmly grounded in data-driven decision-making. Guindos emphasized the absence of a fixed timetable for policy changes, stating, "We are going to be dependent on the data, we don't have any kind of calendar, it will depend on the evolution of inflation."
ECB's Centeno endorses early, gradual interest rate cuts
ECB Governing Council member Mario Centeno advocates to start cutting interest rates "sooner and more gradually", as there are a lot of evidence that inflation is falling sustainably towards 2% target. He also argued that ECB doesn't need to wait for May wage data before acting.
"We can react later and more strongly, or sooner and more gradually. I am completely in favour of gradualism scenarios, because we have to give economic agents time to adapt to our decisions," he said in a Reuters interview.
This perspective underscores his preference for a steady, sustainable reduction in interest rates, proposing 25 basis-point steps as "a good metric".
Centeno's stance also diverges from some ECB policymakers who propose waiting for Q1 wage data in May, to assess the potential second round effects on inflation. He argues that ECB's decisions should not be exclusively hinged on wage data. "Data-dependent is not wage-data dependent...we don't need to wait for May wage data to get an idea about the inflation trajectory," Centeno remarked.
ECB's Kazimir: June is the more probable timing for first rate cut
ECB Governing Council member Peter Kazimir indicated in a blog post that June is the "more probable" timing for the first rate cut. But he emphasized that the timing is "secondary" to the decision itself, and he remains open on this issue.
"The next move will be a cut, and it is within our reach," he asserted, adding, "I am confident that the exact timing, whether in April or June, is secondary to the decision's impact."
"The latter seems more probable, but I will not jump to premature conclusions about the timing," he added.
New Zealand's goods exports down -8.7% yoy in Dec, imports fall -13% yoy
The New Zealand economy had a significant downturn in international trade during December, with goods exports dropping by -8.7% yoy, amounting to a decrease of NZD 568B, resulting in exports totaling NZD 5.9B. Concurrently, goods imports saw a more pronounced fall of -13%yoy, which translates to a reduction of NZD 896m, culminating in imports of NZD 6.3B. This overall downturn in trade activities led to a monthly trade deficit of NZD 323m, which, while substantial, was less severe than the anticipated deficit of NZD 975m.
A notable aspect of this trade activity is the geographical distribution of these declines. Among New Zealand's key trading partners, China marked the most significant decrease in exports, with a reduction of NZD 295m, indicating a -16% drop. This was followed by declines in exports to EU (-20% drop, NZD 75m), Japan (-17% drop, NZD 54m), US (-4.6% drop, NZD 38m), and Australia (-0.8% drop, NZD 6m).
On the import side, US led the fall with a dramatic -40% reduction, amounting to NZD 390m less in imports. Other significant decreases in imports were observed from China (-12% drop, NZD 185m), the European Union (-14% drop, NZD 152m), and Australia (-9.8% drop, NZD 79m). However, South Korea bucked this trend with a striking 113% increase in imports to New Zealand, totaling an additional NZD 356m.
EUR/USD Mid-Day Outlook
Daily Pivots: (S1) 1.0816; (P) 1.0851; (R1) 1.0889; More...
EUR/USD is staying above 1.0812 temporary low and intraday bias remains neutral for now. Further decline is mildly in favor as long as 1.0931 resistance holds. On the downside, break of 1.0812 will resume the fall from 1.1138 to 1.0722 support. On the upside, above 1.0931 will turn bias to the upside for stronger rebound towards 1.1138 resistance.
In the bigger picture, price actions from 1.1274 are viewed as a corrective pattern to rise from 0.9534 (2022 low). Rise from 1.0447 is seen as the second leg. While further rally could cannot be ruled out, upside should be limited by 1.1274 to bring the third leg of the pattern. Meanwhile, sustained break of 1.0722 support will argue that the third leg has already started for 1.0447 and below.
Economic Indicators Update
| GMT | Ccy | Events | Actual | Forecast | Previous | Revised |
|---|---|---|---|---|---|---|
| 21:45 | NZD | Trade Balance (NZD) Dec | -323M | -975M | -1234M | -1250M |
XAUUSD: Consolidated with Bearish Outlook Below 2040
Bullish Scenario: Consider buying above 2028.50 with TP1: 2033, TP2: 2036, and TP3: 3039 on extension. It is recommended to set a stop loss (S.L.) below 2024.5 or at least 1% of the account capital**.
Bearish Scenario: Look for sales below 2024 with TP1: 2000, TP2: 2016, and upon breakout TP3: 2013. It is advisable to place a stop loss above 2026 or at least 1% of the account capital**. A trailing stop can be used.
Fundamental Environment
Gold prices experienced a brief uptick due to escalating geopolitical tensions. Recent conflicts, such as the drone attack on US bases near Jordan, have increased demand for gold as a haven asset. Additionally, economic factors like the moderate increase in US Core Personal Consumption Expenditures (PCE) data have influenced inflation expectations, further supporting gold's position. This week, gold market volatility could escalate with the Federal Reserve's interest rate decision, expected to remain steady in the 5.25-5.50% range. However, investors will watch for any new guidance on interest rates, which could influence gold's future direction. Additionally, the ISM Manufacturing PMI and Nonfarm Payrolls (NFP) report for December could also play a significant role in determining gold's short-term trajectory.
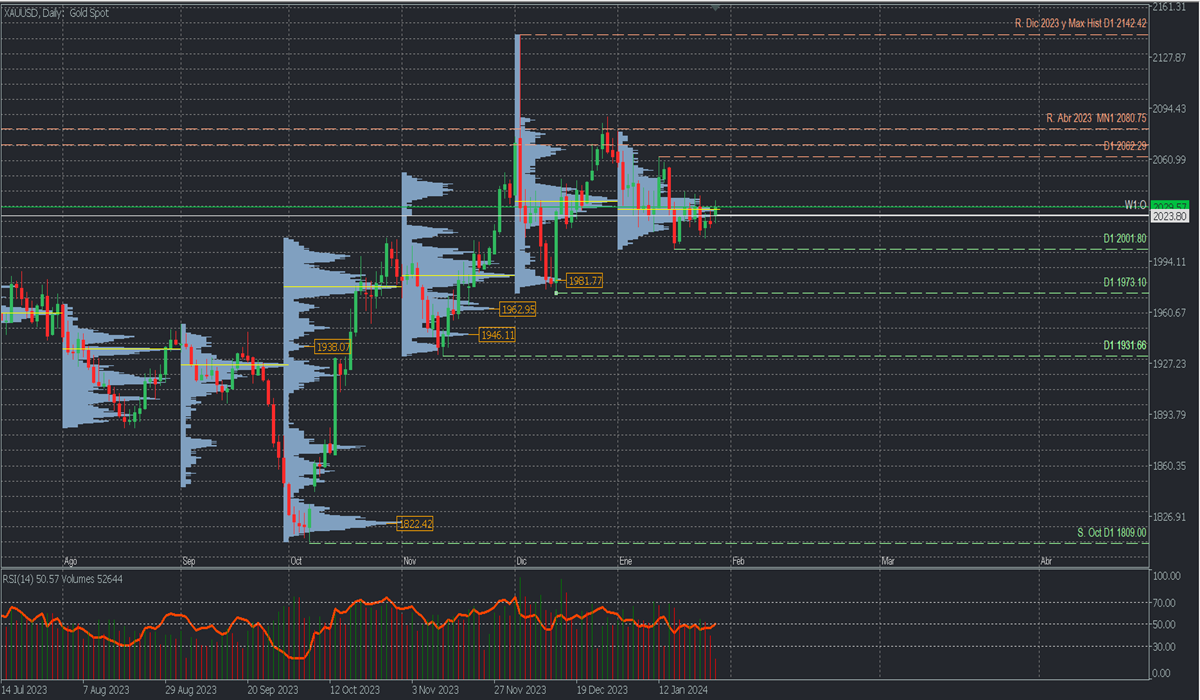
Daily Chart Analysis: Volume Profile and Structure
After a week of consolidation, a high-volume node formation around 2028 suggests a distribution process may be preparing for a new decline towards 2000 and 1980 in the short term, with a potential break below December support at 1973.10, implying a reversal of the current bullish trend. On the other hand, a decisive breakthrough of January's volume concentration around 2028 leaves open the possibility of a recovery towards 2050 and 2060.
RSI below 50 and declining vertical volume after the last three days of ascent, suggest a bearish scenario in the short term. It's always important to remember that any surprising event, altering geopolitics and market risk sentiment can change technical outlooks in just one day, depending on circumstances.
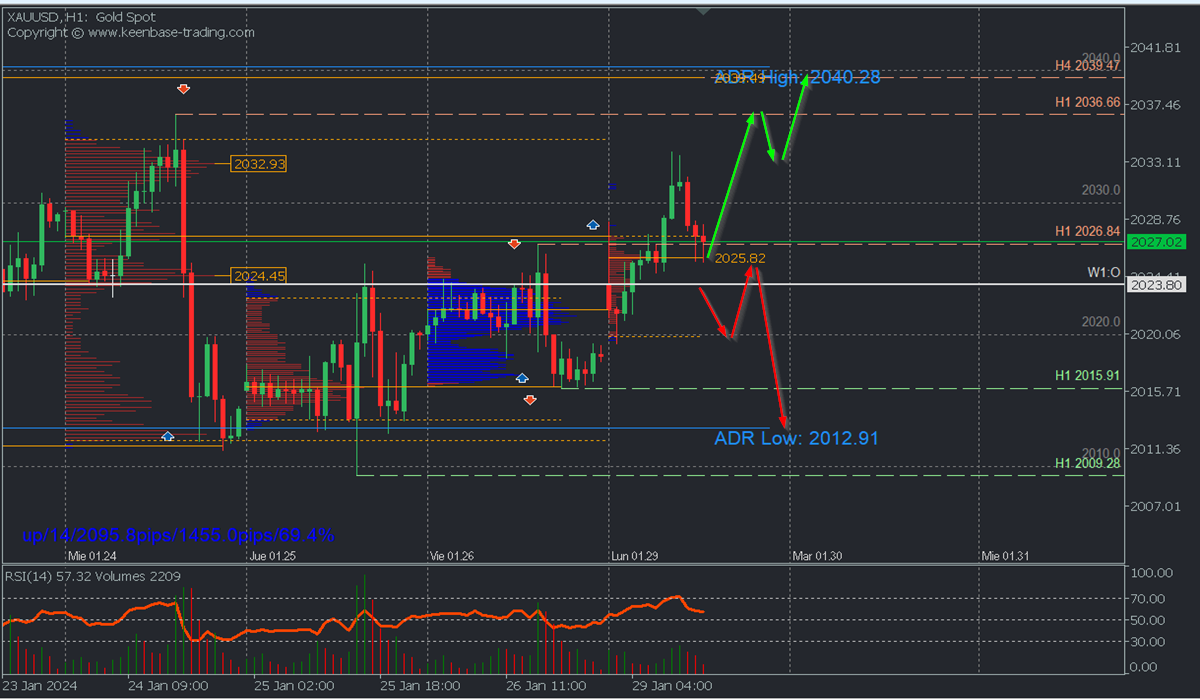
H1 Chart Scenario
The pair is still retracing upwards within the bearish expansion range from Wednesday, January 24, reacting to the high volume node around 2033 and respecting resistance at 2036.66. This rise extends after the Asian opening, leaving a point of control (POC) at 2025.82, a buy zone expected to be defended by bulls in the coming hours, with a rally towards resistances at 2036.66 and 2040 only if it manages to surpass today's Asian/European peak at 2033.87.
On the other hand, a tepid bullish reaction and a strong breakout of the early sessions' POC at 2025.82 will lead to a decline towards the week's opening and the round level 2000, confirming the coverage of the opening gap and challenging the last relevant support at 2015.91, whose confirmed breakout with a second lower low will signal a bearish reversal for the yellow metal.
*Uncovered POC: POC = Point of Control: It is the level or zone where the highest volume concentration occurred. If there was previously a bearish move from it, it is considered a sell zone and forms a resistance area. On the contrary, if there was previously a bullish impulse, it is considered a buy zone, usually located at lows, thus forming support zones.
**Consider this risk management suggestion**Risk management should be based on capital and trading volume. A maximum risk of 1% of the capital is recommended. Risk management indicators like Easy Order are suggested.