Sample Category Title
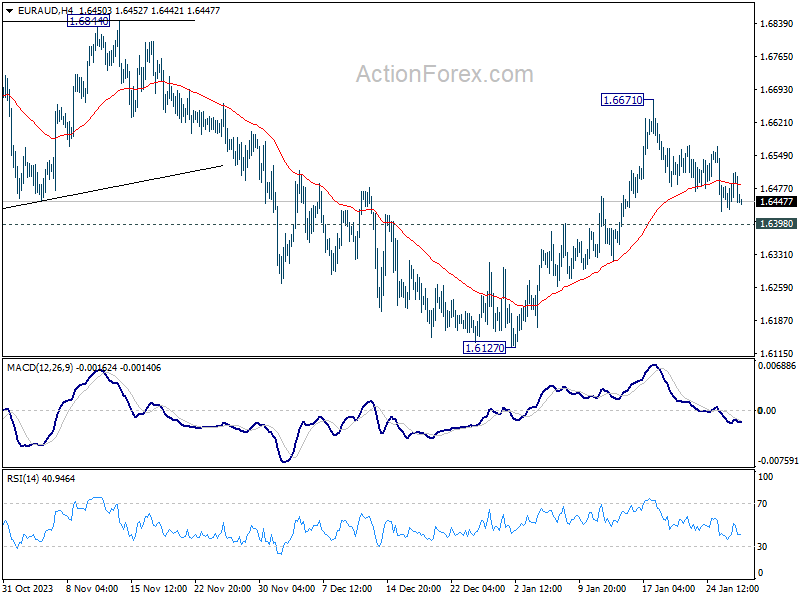
EUR/AUD Daily Outlook
Daily Pivots: (S1) 1.6454; (P) 1.6484; (R1) 1.6536; More...
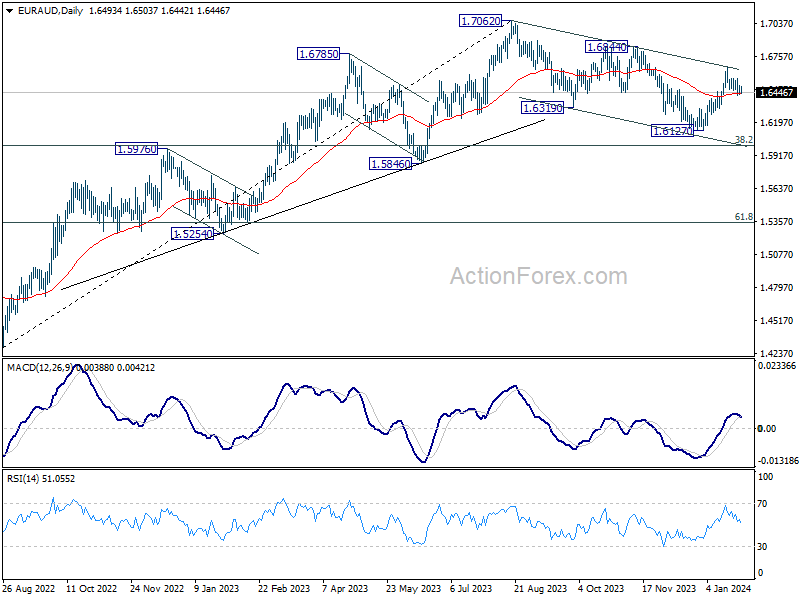
Intraday bias in EUR/AUD remains neutral at this point. Further rally is expected as long as 1.6398 support holds. Corrective fall from 1.7062 should have completed with three waves down to 1.6127 already. Above 1.6671 will target 1.6844 resistance to confirm this bullish case. However, break of 1.6398 will dampen this view and bring retest of 1.6127 low instead.
In the bigger picture, fall from 1.7062 medium term top is seen as correction to the up trend from 1.4281 (2022 low). Break of 1.6844 resistance will argue that this up trend is ready to resume through 1.7062 high. In case of another fall, strong support should be seen around 1.5846 and 38.2% retracement of 1.4281 to 1.7062 at 1.6000 to bring rebound.
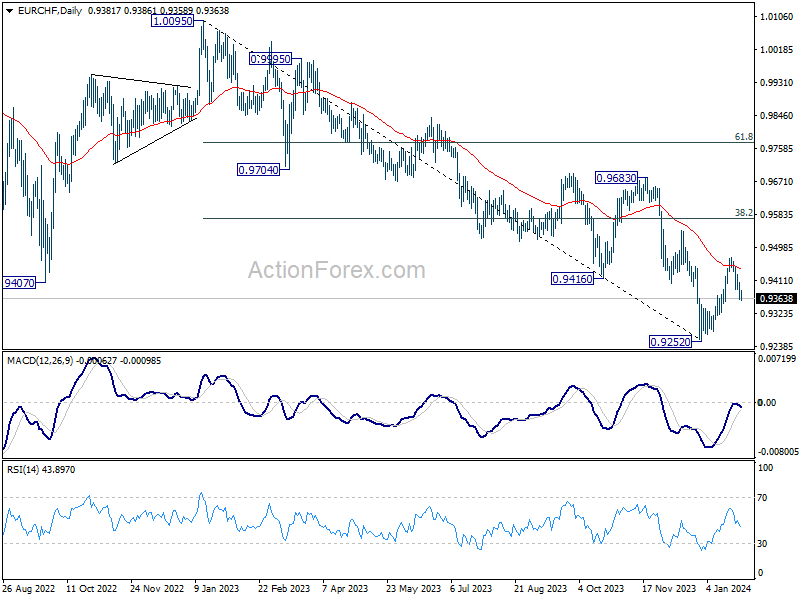
EUR/CHF Daily Outlook
Daily Pivots: (S1) 0.9358; (P) 0.9382; (R1) 0.9402; More...
Intraday bias in EUR/CHF stays mildly on the downside at this point. Deeper pull back could be seen but downside should be contained above 0.9252 low to bring rebound. On the upside, above 0.9425 minor resistance will turn bias back to the upside. Further break of 0.9471 will resume the rebound from 0.9252 to 38.2% retracement of 1.0095 to 0.9252 at 0.9574.
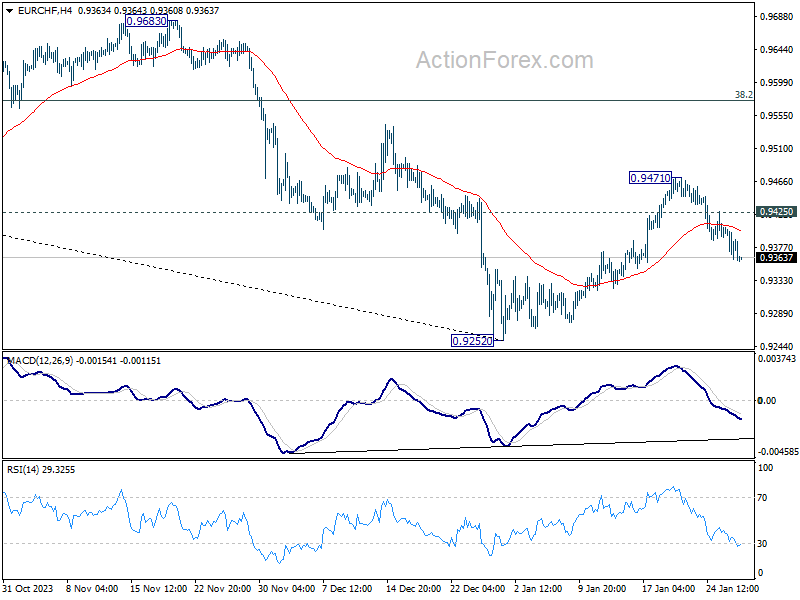
In the bigger picture, medium term outlook remains bearish as long as 0.9683 resistance holds. Current fall from 1.2004 (2018 high) is part of the multi-decade down trend. Another decline is in favor after rebound from 0.9252 completes. However, firm break of 0.9683, and sustained trading above 55 W EMA (now at 0.9638) will argue that EUR/CHF is already in a medium term rally, even as a corrective move.
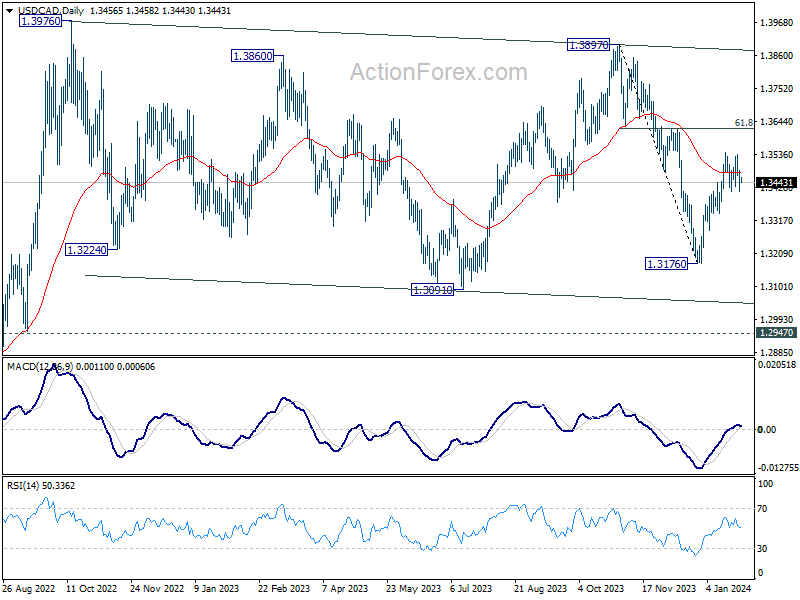
USD/CAD Daily Outlook
Daily Pivots: (S1) 1.3417; (P) 1.3450; (R1) 1.3486; More...
Intraday bias in USD/CAD remains neutral for consolidations below 1.3540. Further rally is in favor as long as 1.3414 support holds. Fall from 1.3897 should have completed at 1.3716. Break of 1.3540 will target 1.3617 cluster resistance (61.8% retracement of 1.3897 to 1.3176 at 1.3622). Decisive break there will pave the way to 1.3897/3976 key resistance zone. However, firm break of 1.3414 will dampen this view and turn bias back to the downside.
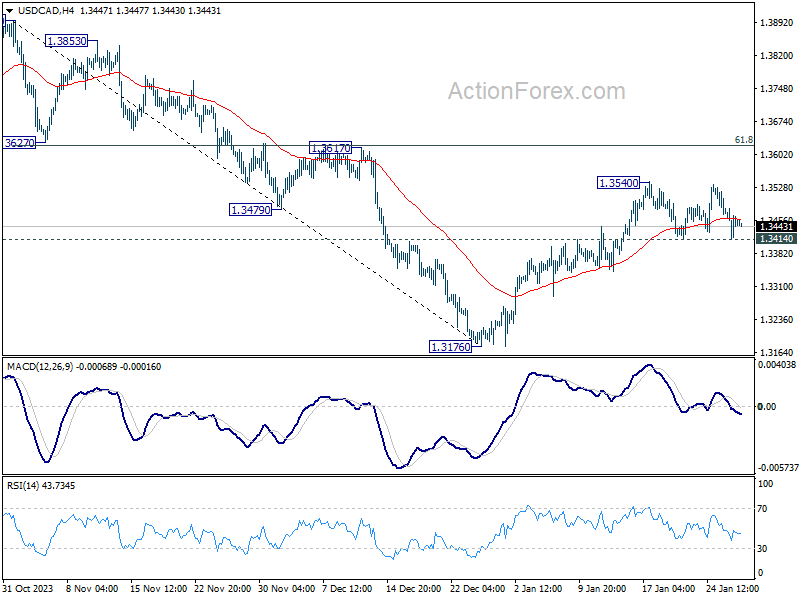
In the bigger picture, price actions from 1.3976 (2022 high) are viewed as a corrective pattern only. In case of another fall, strong support should emerge above 1.2947 resistance turned support to bring rebound. Overall, larger up trend from 1.2005 (2021 low) is still expected to resume through 1.3976 at a later stage.
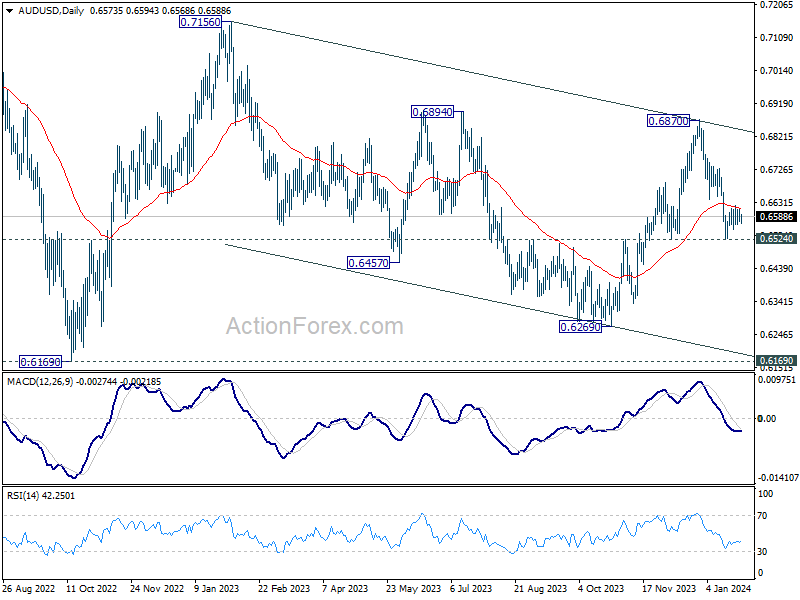
AUD/USD Daily Report
Daily Pivots: (S1) 0.6563; (P) 0.6586; (R1) 0.6599; More...
Intraday bias in AUD/USD remains neutral for the moment, as consolidation continues above 0.6524. Further fall is expected with 0.6639 minor resistance intact. On the downside, firm break of 0.6524 support will argue that whole rebound from 0.6269 has completed, and bring deeper fall to this support. On the upside, break of 0.6639 will turn bias back to the upside for stronger rebound instead.
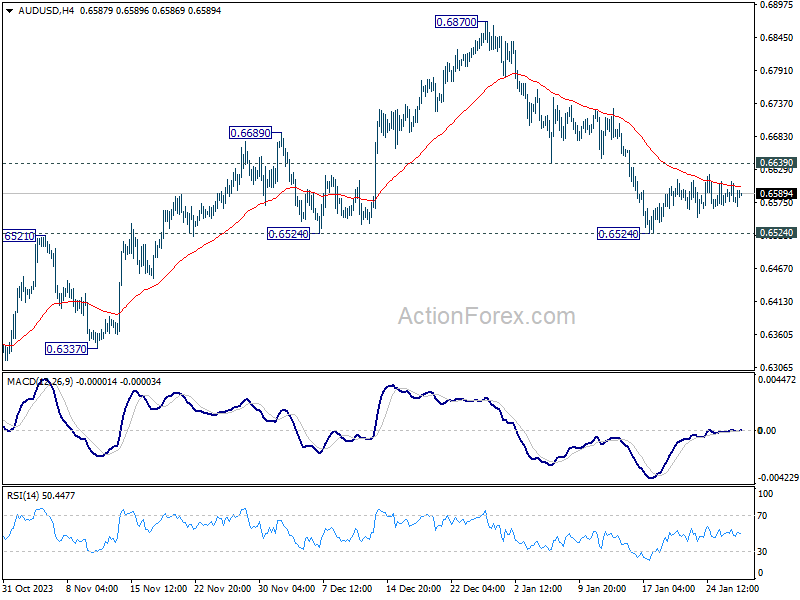
In the bigger picture, price actions from 0.6169 (2022 low) are seen as a medium term corrective pattern to the down trend from 0.8006 (2021 high). Sideway trading could continue in range of 0.6169/7156 for some more time. But as long as 0.7156 holds, an eventual downside breakout would be mildly in favor.
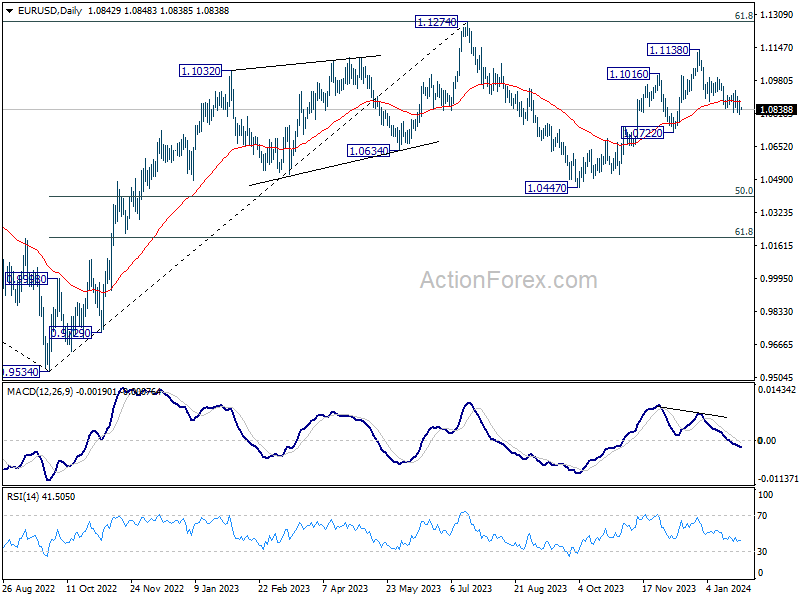
EUR/USD Daily Outlook
Daily Pivots: (S1) 1.0816; (P) 1.0851; (R1) 1.0889; More...
Intraday bias in EUR/USD remains neutral and more consolidations could be seen above 1.0812. Further decline is mildly in favor as long as 1.0931 resistance holds. On the downside, break of 1.0812 will resume the fall from 1.1138 to 1.0722 support. On the upside, above 1.0931 will turn bias to the upside for stronger rebound towards 1.1138 resistance.
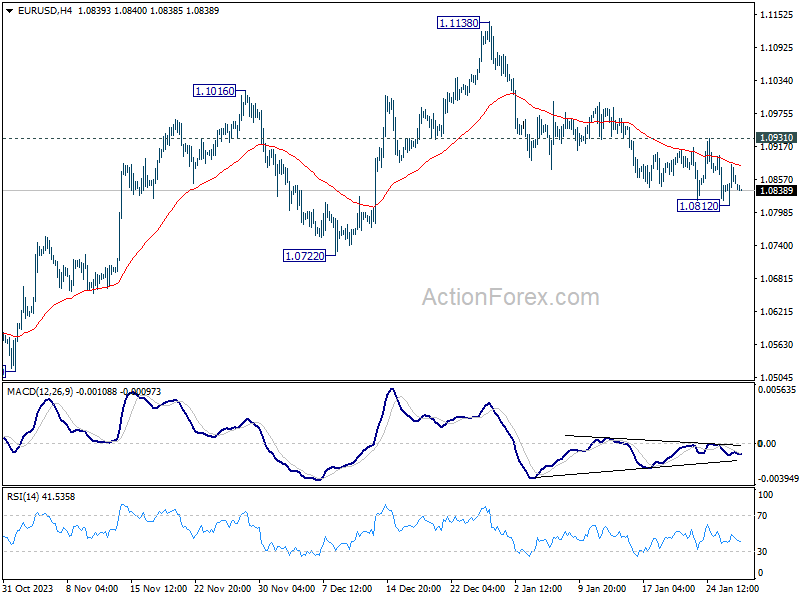
In the bigger picture, price actions from 1.1274 are viewed as a corrective pattern to rise from 0.9534 (2022 low). Rise from 1.0447 is seen as the second leg. While further rally could cannot be ruled out, upside should be limited by 1.1274 to bring the third leg of the pattern. Meanwhile, sustained break of 1.0722 support will argue that the third leg has already started for 1.0447 and below.
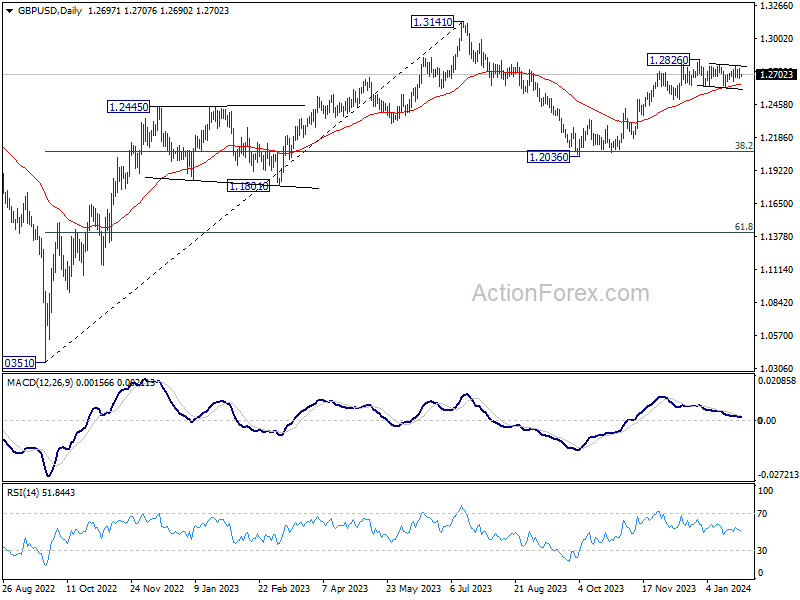
GBP/USD Daily Outlook
Daily Pivots: (S1) 1.2666; (P) 1.2712; (R1) 1.2748; More...
Intraday bias in GBP/USD remains neutral at this point. Consolidation from 1.2826 could extend further and another fall cannot be ruled out. But downside should be contained above 1.2499 support to bring rebound. On the upside, firm break of 1.2784 resistance will suggest that consolidation pattern has completed. Further rise should be seen through 1.2826 to resume the rally from 1.2036. Next target will be 1.3141 high.
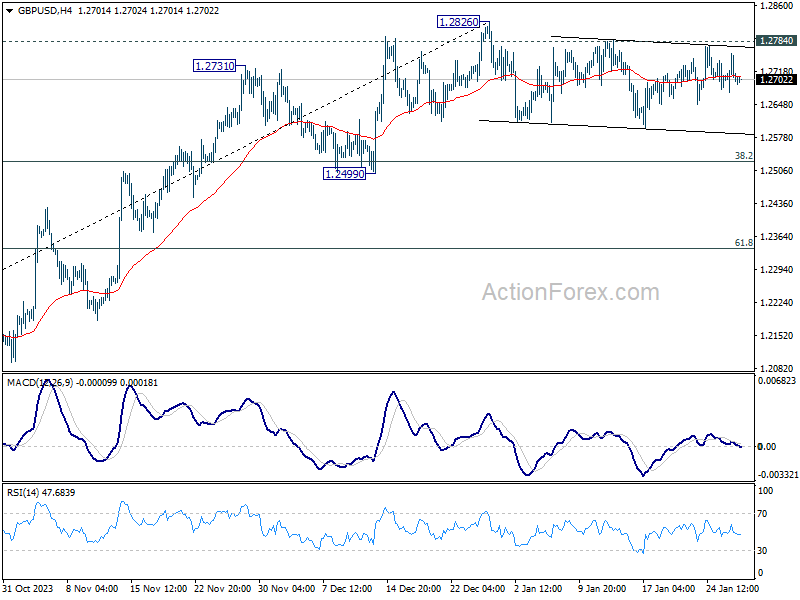
In the bigger picture, price actions from 1.3141 medium term top are seen as a corrective pattern to up trend from 1.0351 (2022 low). Rise from 1.2036 is seen as the second leg that's in progress. Upside should be limited by 1.3141 to bring the third leg of the pattern. Meanwhile, break of 1.2499 support will argue that the third leg has already started for 38.2% retracement of 1.0351 (2022 low) to 1.3141 at 1.2075 again.
USD/CHF Daily Outlook
Daily Pivots: (S1) 0.8610; (P) 0.8647; (R1) 0.8678; More....
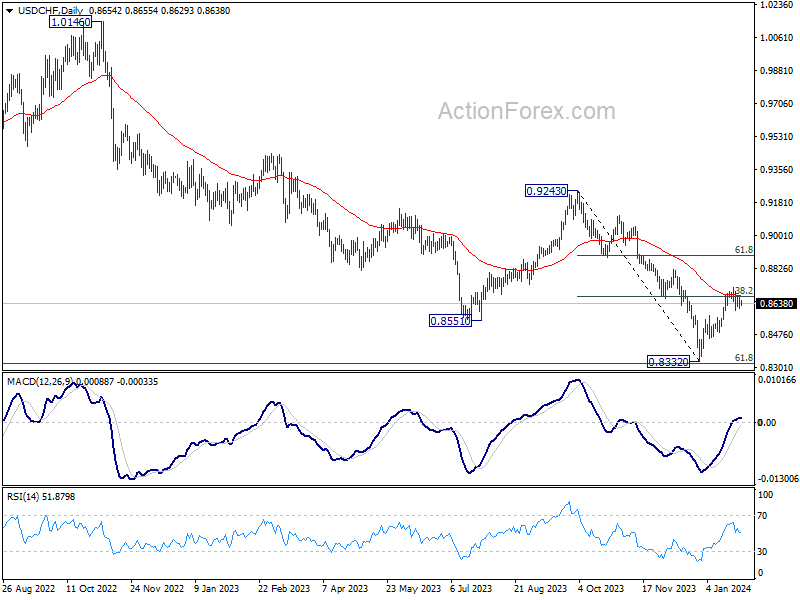
Intraday bias in USD/CHF remains neutral as consolidation continues below 0.8727. On the downside, below 0.8605 will resume the pull back from 0.8727 to 0.8487 support. Break there will argue that rebound from 0.8332 has completed, and bring retest of this low. On the upside, firm break of 0.8727 will resume the rebound to 61.8% retracement of 0.9243 to 0.8332 at 0.8995 instead.
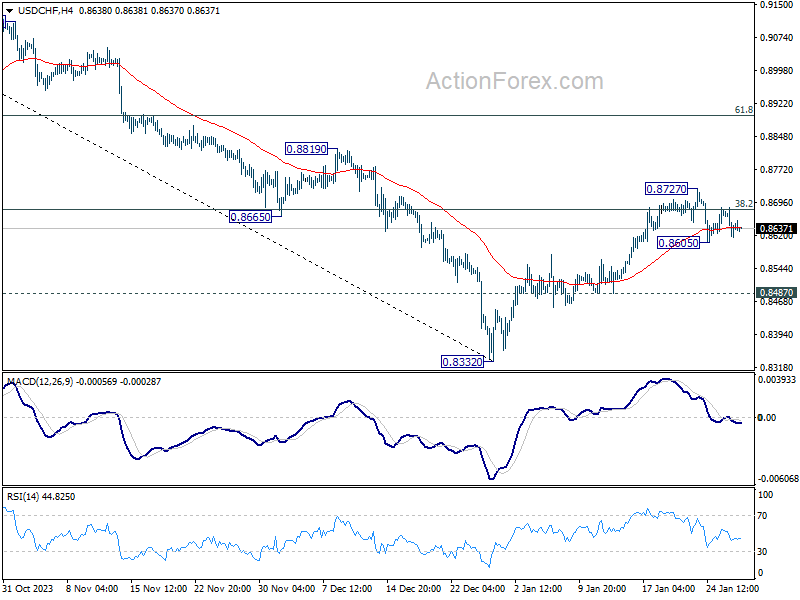
In the bigger picture, while rebound from 0.8332 could be strong, there is no clear sign of medium term bottoming yet. This rebound is tentatively seen as a corrective move for now. Also, outlook will stay bearish as long as 0.9243 resistance holds. Larger down trend from 1.0146 (2022 high) should resume through 0.8332 low at a later stage.
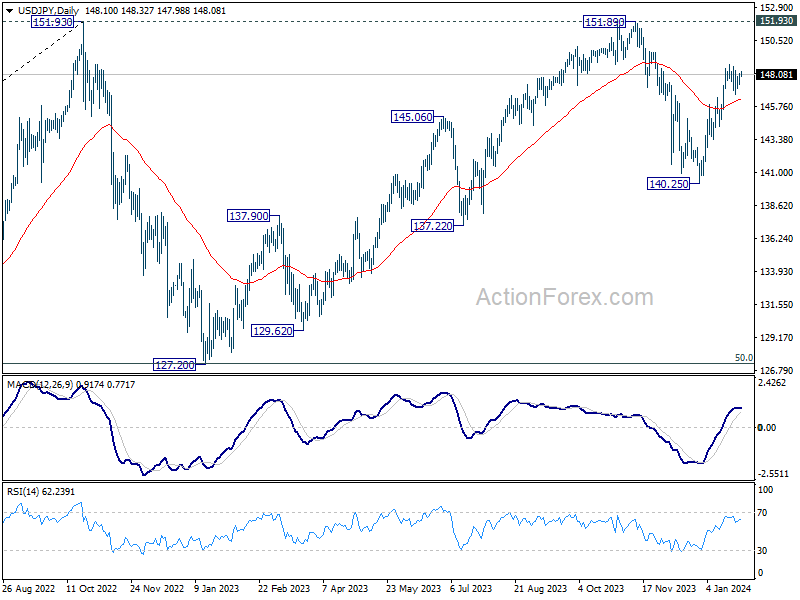
USD/JPY Daily Outlook
Daily Pivots: (S1) 147.65; (P) 147.93; (R1) 148.45; More...
Intraday bias in USD/JPY remains neutral for the moment, as consolidation continues below 148.79. With 145.97 resistance turned support intact, further rally is in favor. As noted before, corrective fall from 151.89 should have completed at 140.25 already. Break of 148.79 will resume the rise from there for retesting 151.89/93 key resistance zone.
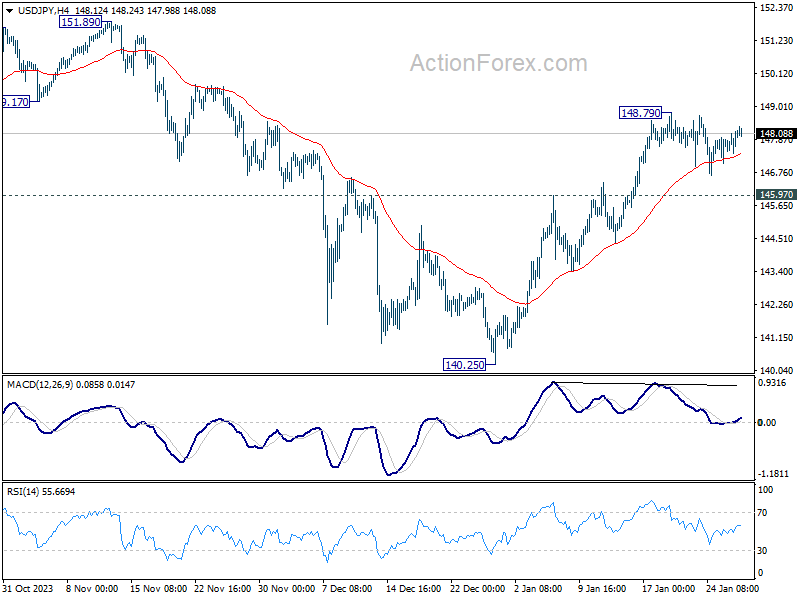
In the bigger picture, stronger than expected rebound from 140.25 dampened the original bearish review. Strong support from 55 W EMA (now at 142.33) is also a medium term bullish sign. Fall from 151.89 could be a correction to rise from 127.20 only. Decisive break of 151.89/93 will confirm resumption of long term up trend. This will now be the favored case as long as 140.25 support holds.
Forex Markets in Slow Motion: Anticipation Builds for Fed, BoE and Crucial Economic Data
Tentative risk-on sentiment is perceptible in Asian session, as Japan's Nikkei rallied with energy shares lifted by rally in oil prices. Concurrently, stock markets Hong Kong are continuing their near-term rebound, reflecting cautious optimism in the region. Nevertheless, this momentum has not translated into significant activity in the forex markets, which are showing a slow start to the week. Australian and New Zealand Dollars are seeing mild gains, while Dollar, Euro, and Sterling are softening.
Trading activity is expected to remain subdued for the remainder of the day, considering the lack of significant economic data releases scheduled. However, the coming week promises to be exceedingly eventful, with Fed and BoE rate decisions, alongside a flurry of high-impact economic data including US Non-Farm Payrolls and Eurozone GDP and CPI figures. These events are poised to inject significant volatility and potentially redefine market trends.
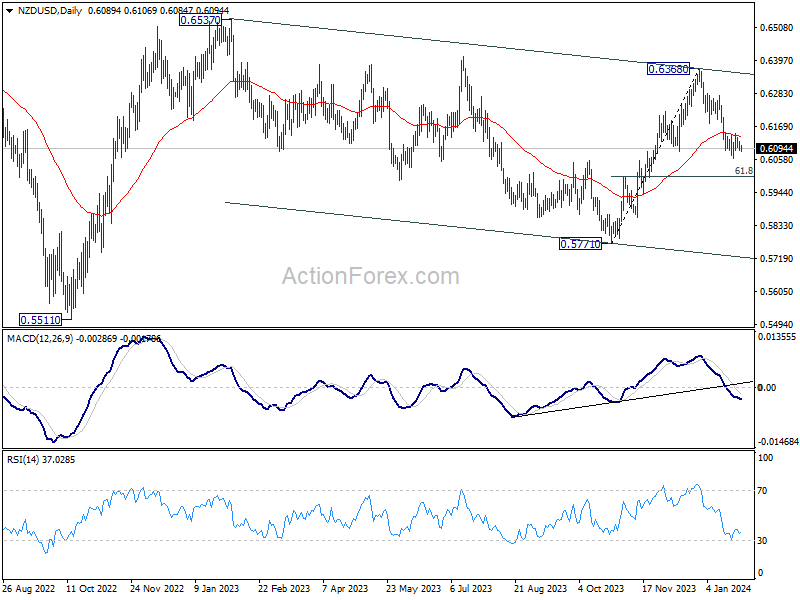
NZD/USD weakened slightly after data from New Zealand showed sharp contraction in both exports and imports. Technically, for now, further decline is expected for 61.8% retracement of 0.5771 to 0.6368 at 0.5999. Decisive break there will solidify the case that corrective pattern from 0.6537 has already started the third leg. Deeper fall would then be seen to 0.5771 support and possibly below. Nevertheless, sustained trading above 55 D EMA (now at 0.6137) will neutralize the bearish view and bring stronger rebound instead.
In Asia, at the time of writing, Nikkei is up 0.80%. Hong Kong HSI is up 0.65%. China Shanghai SSE is down -0.29%. Singapore Strait Times is down -0.04%. Japan 10-year JGB yield is up 0.0089 at 0.729.
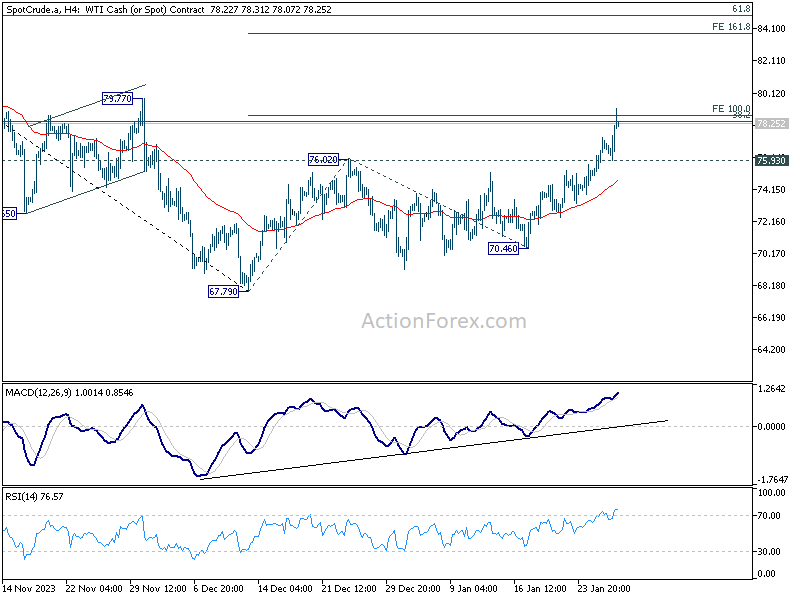
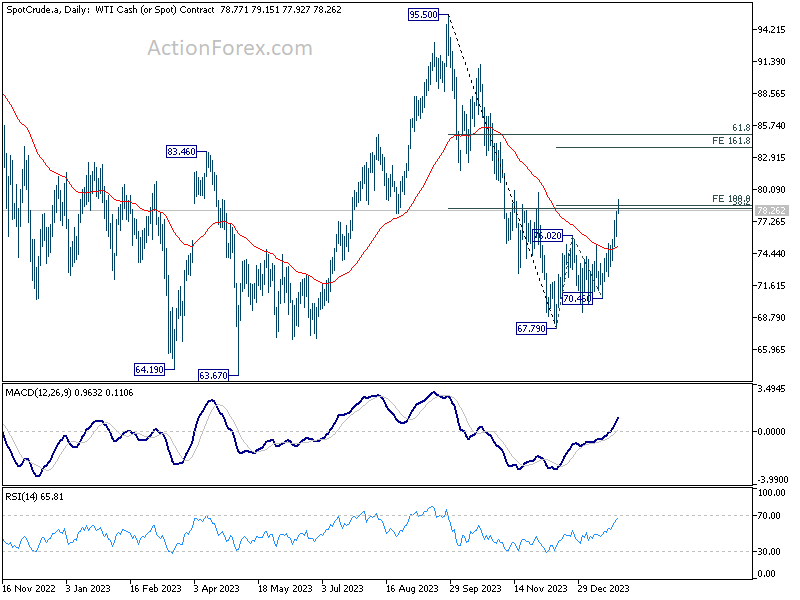
WTI oil edges closer to 80 following escalation in Middle East and US troop fatalities
Notable rally is seen in oil markets as the week commences, with WTI crude oil marching towards 80 handle. This rise is largely driven by escalating tensions in the Middle East. Over the past weekend, a drone strike in Jordan, which has been linked to Iran, resulted in death of three US troops and injuries to as many as 34. Adding to regional instability, ongoing aggressive maritime attacks by Yemen's Houthi rebels in the Red Sea continue to disrupt traffic and heighten geopolitical tensions.
Technically, WTI is now pressing an important near term cluster resistance at 38.2% retracement of 95.50 to 67.79 at 78.37, and 100% projection of 67.79 to 76.02 from 70.46 at 78.69. Sustained break of this level will solidify the case that fall from 95.50 has completed at 67.79.
In this bullish scenario, rise from 67.79 is at least a correction to fall from 95.50, with prospect of being the third leg of the pattern from 63.67 low. In either case, next target will be 161.8% projection at 83.77.
Nevertheless, rejection by 78.37/69, followed by 75.93 will argue that rebound from 67.79 has completed already, and keep near term outlook neutral at best.
New Zealand's goods exports down -8.7% yoy in Dec, imports fall -13% yoy
The New Zealand economy had a significant downturn in international trade during December, with goods exports dropping by -8.7% yoy, amounting to a decrease of NZD 568B, resulting in exports totaling NZD 5.9B. Concurrently, goods imports saw a more pronounced fall of -13%yoy, which translates to a reduction of NZD 896m, culminating in imports of NZD 6.3B. This overall downturn in trade activities led to a monthly trade deficit of NZD 323m, which, while substantial, was less severe than the anticipated deficit of NZD 975m.
A notable aspect of this trade activity is the geographical distribution of these declines. Among New Zealand's key trading partners, China marked the most significant decrease in exports, with a reduction of NZD 295m, indicating a -16% drop. This was followed by declines in exports to EU (-20% drop, NZD 75m), Japan (-17% drop, NZD 54m), US (-4.6% drop, NZD 38m), and Australia (-0.8% drop, NZD 6m).
On the import side, US led the fall with a dramatic -40% reduction, amounting to NZD 390m less in imports. Other significant decreases in imports were observed from China (-12% drop, NZD 185m), the European Union (-14% drop, NZD 152m), and Australia (-9.8% drop, NZD 79m). However, South Korea bucked this trend with a striking 113% increase in imports to New Zealand, totaling an additional NZD 356m.
ECB's Knot: Wage growth a missing piece in cooling inflation to target
ECB Governing Council member Klaas Knot expressed confidence in inflation reverting to 2% target in 2025, but pointed out a crucial element that remains uncertain: the alignment of wage growth with this lower inflation expectation.
In an interview with the Dutch TV program Buitenhof on Sunday, Knot noted he "credible prospect" of it returning to the 2% target in 2025. However, "the only piece that's missing is the conviction that wage growth will adapt to that lower inflation".
Knot highlighted the current disparity between wage growth, at 5%, and the desirable rate of around 2.5% for sustainable price stability. He stressed that a gradual shift to this lower wage growth rate is essential for ECB to consider lowering interest rates.
He also anticipated "a couple of years" where wage growth may exceed inflation, "allowing a restoration of purchasing power," However, he assured that this scenario would not hinder the trajectory towards the 2% inflation target.
Nevertheless, he suggested that this scenario wouldn't necessarily impede the achievement of 2% inflation target. He argued that there's sufficient leeway in profit margins to accommodate these higher salaries without triggering a significant secondary surge in prices. However, Knot cautioned that this is a "narrow path," requiring careful navigation.
A week of high stakes
This upcoming week is set to be exceptionally active in the financial world, with a multitude of high-profile events scheduled. Central to focus is FOMC rate decision while US ISM and Non-Farm payrolls are Equally significant. BoE is also in the spotlight, as it prepares to unveil a new set of economic projections. For the Eurozone, GDP and CPI flash data are set to be pivotal for the timing of ECB rate cut. Additionally, Australia CPI, Canada's GDP, BoJ Summary of Opinions, and China's PMIs are also on the radar, each carrying the potential to impact market dynamics in their respective regions.
Expectations are set for Fed to maintain the interest rate at 5.25%-5.50%. The critical question at the forefront is when Fed will initiate interest rate cuts this year and the pace at which they will proceed.
If Fed adheres to the projections outlined in its December dot plot, which suggested three rate cuts of 25 basis points each throughout the year, the most likely timing for the initial reduction appears to be June. However, market dynamics, as reflected in fed fund futures, suggest a nearly 90% probability of the first cut occurring as early as May, indicating a more aggressive stance by traders, albeit slightly tempered recently.
Chair Jerome Powell is unlikely to provide explicit guidance on these speculations during the upcoming FOMC meeting and press conference. This restraint may render the event less impactful than anticipated.
Instead, the market's attention might pivot towards key economic indicators like US consumer confidence, ISM manufacturing index, and Non-Farm Payrolls report. Resurgence in the manufacturing sector, coupled with persistently tight job market and robust wage growth, could potentially influence Fed's decision, leading them to delay rate cuts to ensure continuous progress in disinflation.
BoE is set to hold its course and keep interest rate unchanged at 5.25%. Tightening bias could be dropped finally. However, after stronger than expected December inflation data, it's unlikely for the central bank to openly commit to a pathway of policy loosening, not yet.
A key aspect of the BoE meeting will be the unveiling of the latest set of quarterly economic projections. These projections will offer valuable insights into the bank's view around inflation and growth. Market participants will closely scrutinize these projections for clues about the timing and scale of future rate cuts. Additionally, the vote split among policymakers could emerge as a significant wild card, and inject volatility into the market.
For Eurozone, the spotlight is on GDP and CPI flash data, providing insights on understanding the effectiveness of the transmission of monetary policy and their influence on growth and inflation. Market participants could be particularly attuned to any downside surprises in these data releases. A weaker-than-expected GDP or CPI figure could tilt market sentiment towards a more dovish stance, intensify discussions bets that ECB will pull ahead its first rate cut.
Australia's Q4 CPI data is also a potential market move. This data is anticipated to show continued moderation in inflation in Australia, but the central question remains: Will this be a sufficient catalyst for RBA to shift away from tightening bias at the meeting on February 6? Additionally, Aussie is also poised for volatility in response to China's latest PMI data.
Here are some highlights for the week:
- Monday: New Zealand trade balance.
- Tuesday: Japan unemployment rate; Australia retail sales; France consumer spending, GDP; Swiss Trade balance, KOF economic barometer; Italy GDP; Germany GDP; UK M4 money supply, mortgage approvals; Eurozone GDP; US house price index, consumer confidence.
- Wednesday: BoJ summary of opinions, Japan industrial production, retail sales, consumer confidence, housing starts; New Zealand ANZ business confidence; Australia CPI; China PMIs; Germany import prices, reail sales, CPI flash, unemployment; Swiss retail sales, Credit Suisse economic expectations; US ADP employment, employment cost index, Chicago PMI, Fed rate decisions.
- Thursday: Australia building approvals, import prices, NAB business confidence; Japan PMI manufacturing final; China Caixi PMI manufacturing; Swiss PMI manufacturing; Eurozone PMI manufacturing final, CPI flash, unemployment rate; UK PMI manufacturing final, BoE rate decision; US jobless claims, non-farm productivity, ISM manufacturing, construction spending.
- Friday: New Zealand building permits; Australia PPI; France industrial production; US non-farm payrolls, factory orders.
USD/JPY Daily Outlook
Daily Pivots: (S1) 147.65; (P) 147.93; (R1) 148.45; More...
Intraday bias in USD/JPY remains neutral for the moment, as consolidation continues below 148.79. With 145.97 resistance turned support intact, further rally is in favor. As noted before, corrective fall from 151.89 should have completed at 140.25 already. Break of 148.79 will resume the rise from there for retesting 151.89/93 key resistance zone.
In the bigger picture, stronger than expected rebound from 140.25 dampened the original bearish review. Strong support from 55 W EMA (now at 142.33) is also a medium term bullish sign. Fall from 151.89 could be a correction to rise from 127.20 only. Decisive break of 151.89/93 will confirm resumption of long term up trend. This will now be the favored case as long as 140.25 support holds.
Economic Indicators Update
| GMT | Ccy | Events | Actual | Forecast | Previous | Revised |
|---|---|---|---|---|---|---|
| 21:45 | NZD | Trade Balance (NZD) Dec | -323M | -975M | -1234M | -1250M |
Technical Outlook and Review
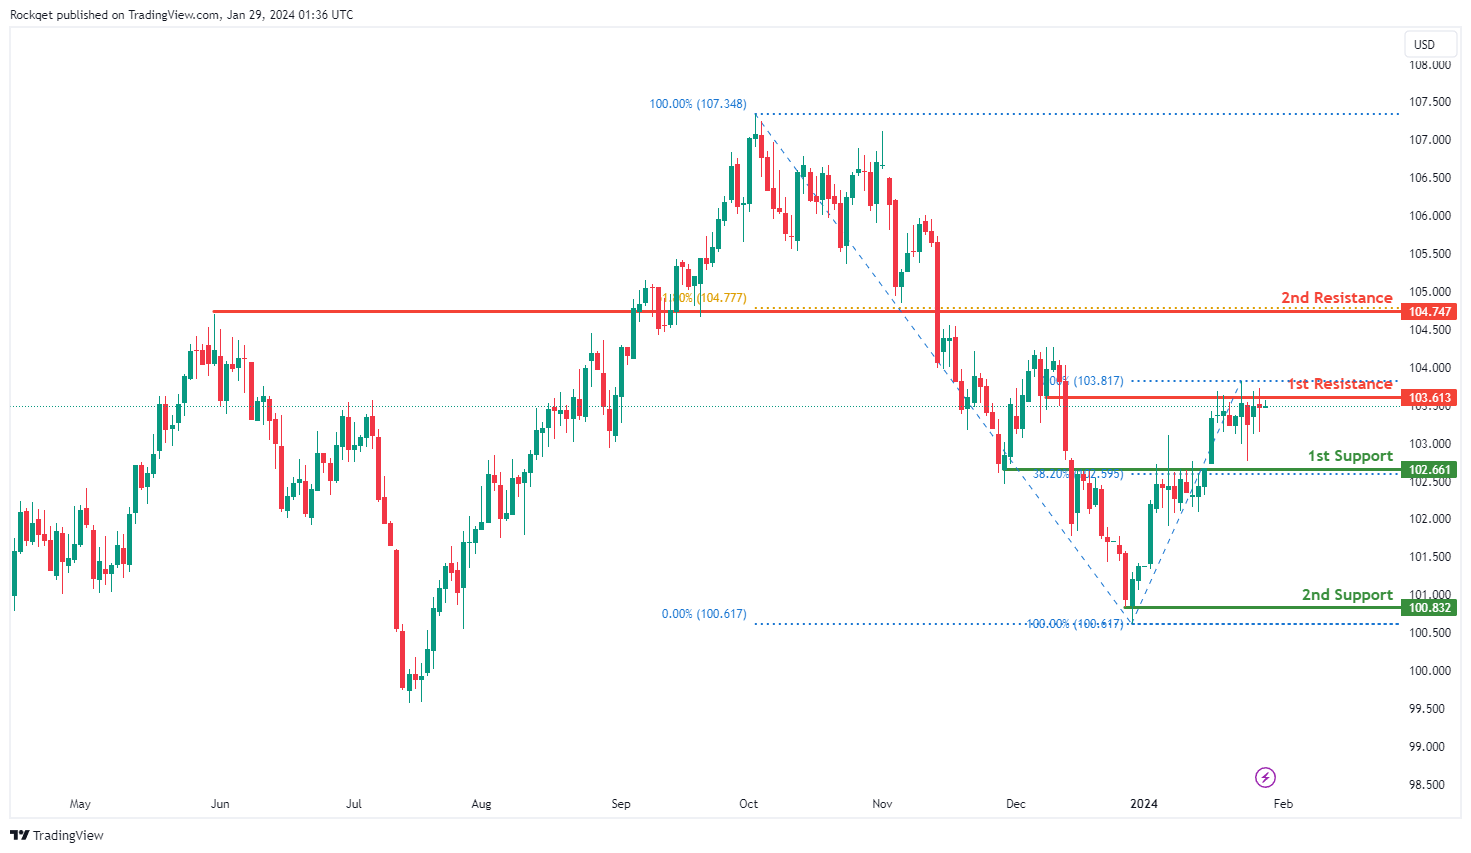
DXY:
The DXY (US Dollar Currency Index) chart currently exhibits a bullish overall momentum, indicating strength in the US Dollar. According to your analysis, there is potential for a bullish breakout through the 1st resistance level and a subsequent rise towards the 2nd resistance level.
The 1st support level at 102.66 is considered significant for several reasons. It represents an overlap support, indicating that this price level has historically acted as both support and resistance. Additionally, it coincides with the 38.20% Fibonacci Retracement level, suggesting that this level corresponds to a previous significant low point on the chart, and the Fibonacci confluence adds to its importance as a potential support level.
The 2nd support level at 100.83 is identified as a swing low support, reinforcing its significance as a level where price has previously found support during a bullish move.
On the resistance side, the 1st resistance level at 103.61 is recognized as an overlap resistance, indicating that this price level has historically served as both support and resistance. This suggests that it may act as a potential barrier for further upward price movement.
The 2nd resistance level at 104.74 is categorized as a pullback resistance and coincides with the 61.80% Fibonacci Retracement level. This reinforces its importance as a potential resistance point during price pullbacks.
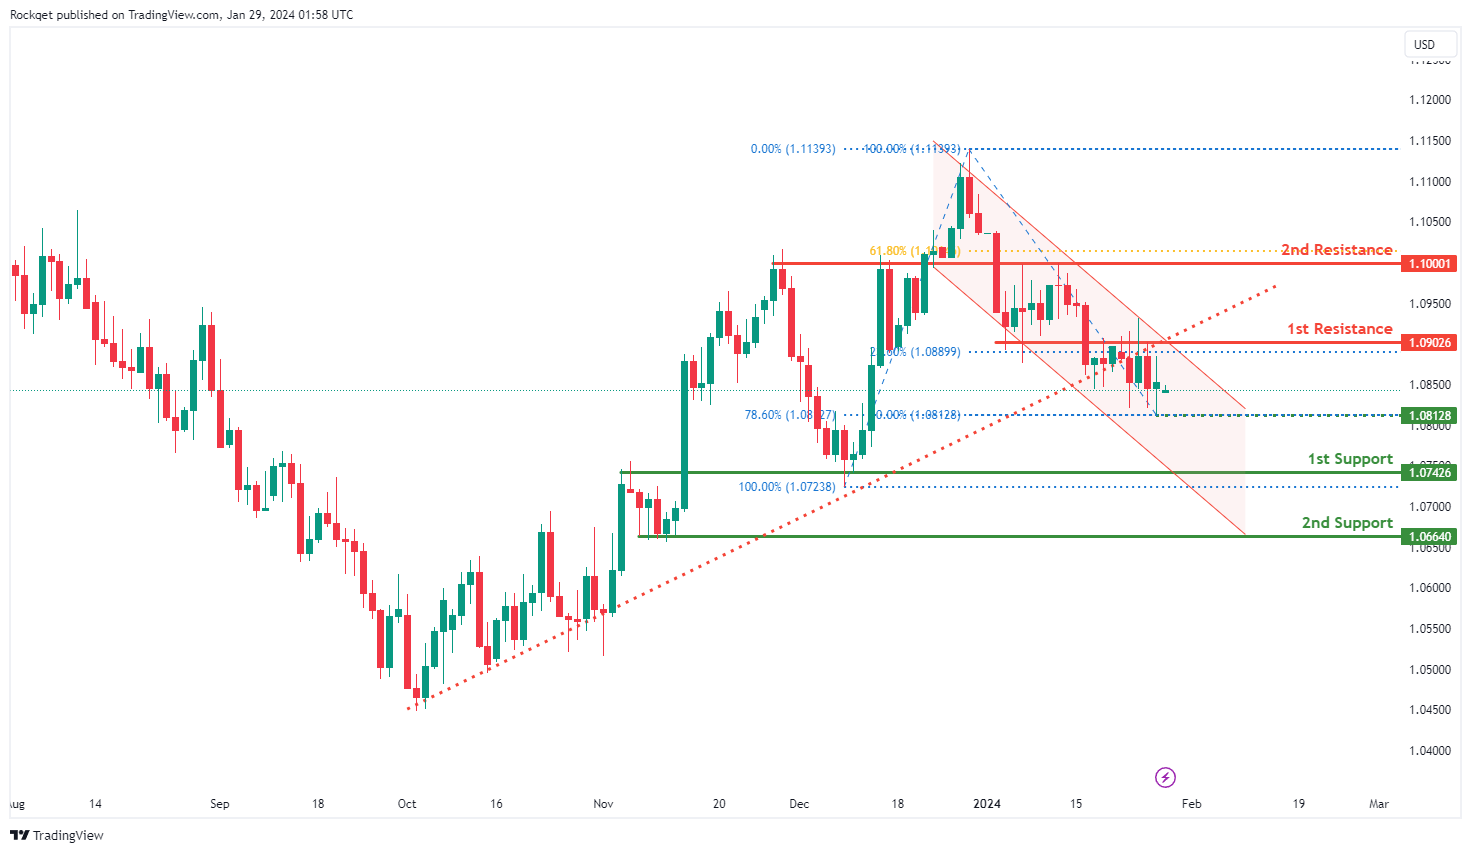
EUR/USD:
The EUR/USD trading pair is currently in a bearish descending channel, which is contributing to the overall bearish momentum on the chart. Your analysis suggests that there is potential for a bearish continuation in the price towards the 1st support level.
The 1st support level at 1.0742 is considered significant for several reasons. It represents an overlap support, indicating that this price level has historically acted as both support and resistance. This suggests that it may serve as a strong area where price could potentially find support during a bearish move.
The 2nd support level at 1.0664 is identified as a multi-swing low support, reinforcing its significance as a level where price has previously found support during a bearish trend.
On the resistance side, the 1st resistance level at 1.0902 is recognized as an overlap resistance, indicating that this price level has historically served as both support and resistance. Additionally, it coincides with the 23.60% Fibonacci Retracement level, adding to its importance as a potential barrier for upward price movement.
The 2nd resistance level at 1.1000 is categorized as an overlap resistance and coincides with the 61.80% Fibonacci Retracement level, further reinforcing its significance as a potential resistance point.
There is also an intermediate support level at 1.0812, characterized as a swing low support and coinciding with the 78.60% Fibonacci Retracement level. This intermediate support level adds an additional layer of support during the bearish move.
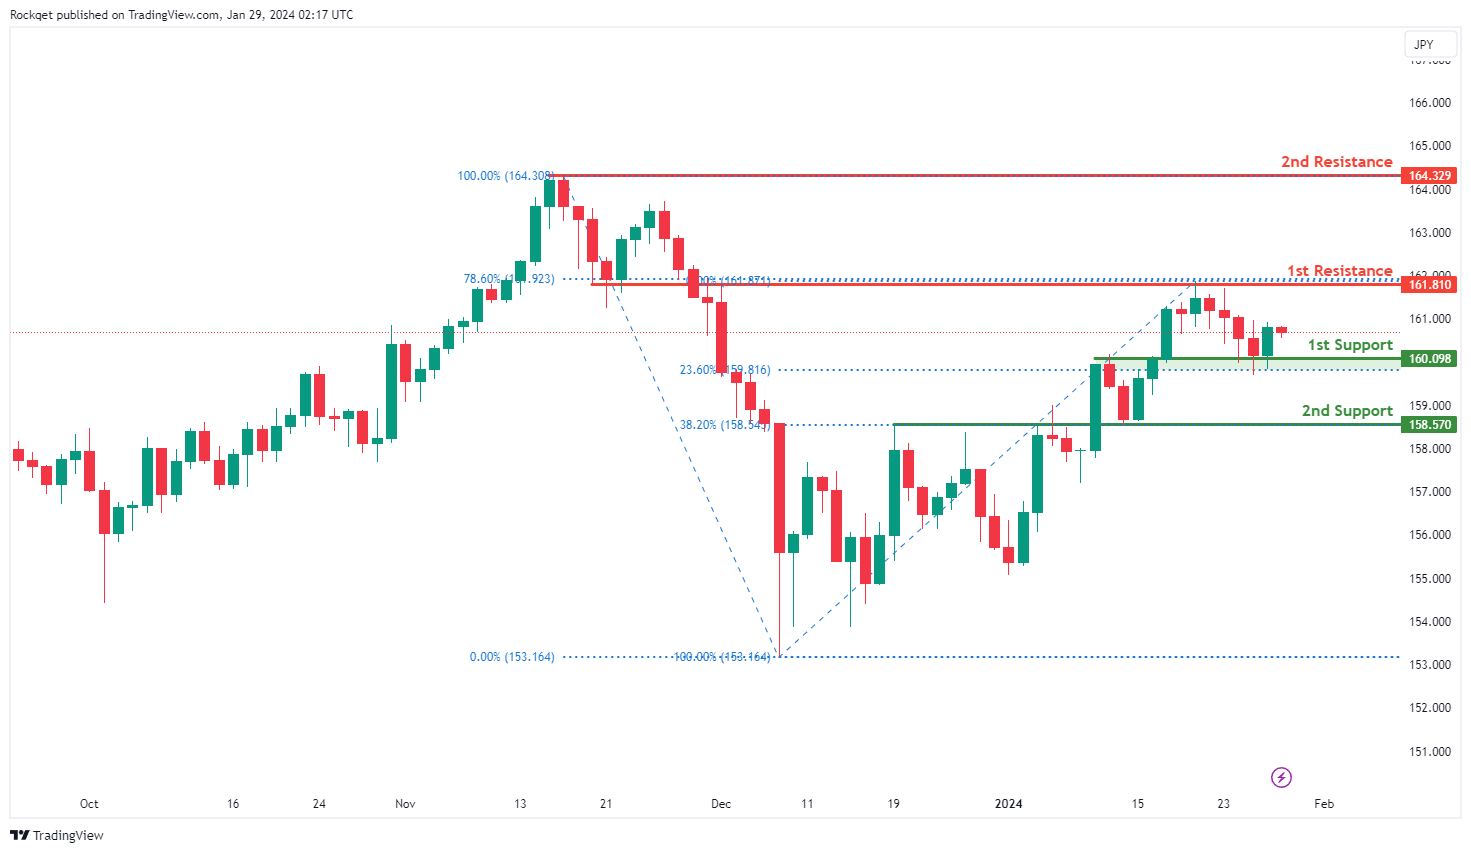
EUR/JPY:
The EUR/JPY (Euro/Japanese Yen) chart currently has a bullish overall momentum, and your analysis suggests the potential for a bullish continuation towards the 1st resistance level.
The 1st support level at 160.090 is considered significant for several reasons. It is identified as an overlap support, indicating that this price level has historically acted as both support and resistance. Additionally, it coincides with the 23.60% Fibonacci Retracement level, suggesting that this level corresponds to a previous significant price level, and the Fibonacci confluence adds to its importance as a potential support level.
The 2nd support level at 158.570 is also identified as an overlap support and coincides with the 38.20% Fibonacci Retracement level, further reinforcing its significance as a potential support zone.
On the resistance side, the 1st resistance level at 161.810 is characterized as an overlap resistance and aligns with the 78.60% Fibonacci Retracement level. This indicates that it may serve as a potential barrier for further upward price movement.
The 2nd resistance level at 164.320 is categorized as a swing high resistance, suggesting that it represents a historical point where the price has encountered resistance.
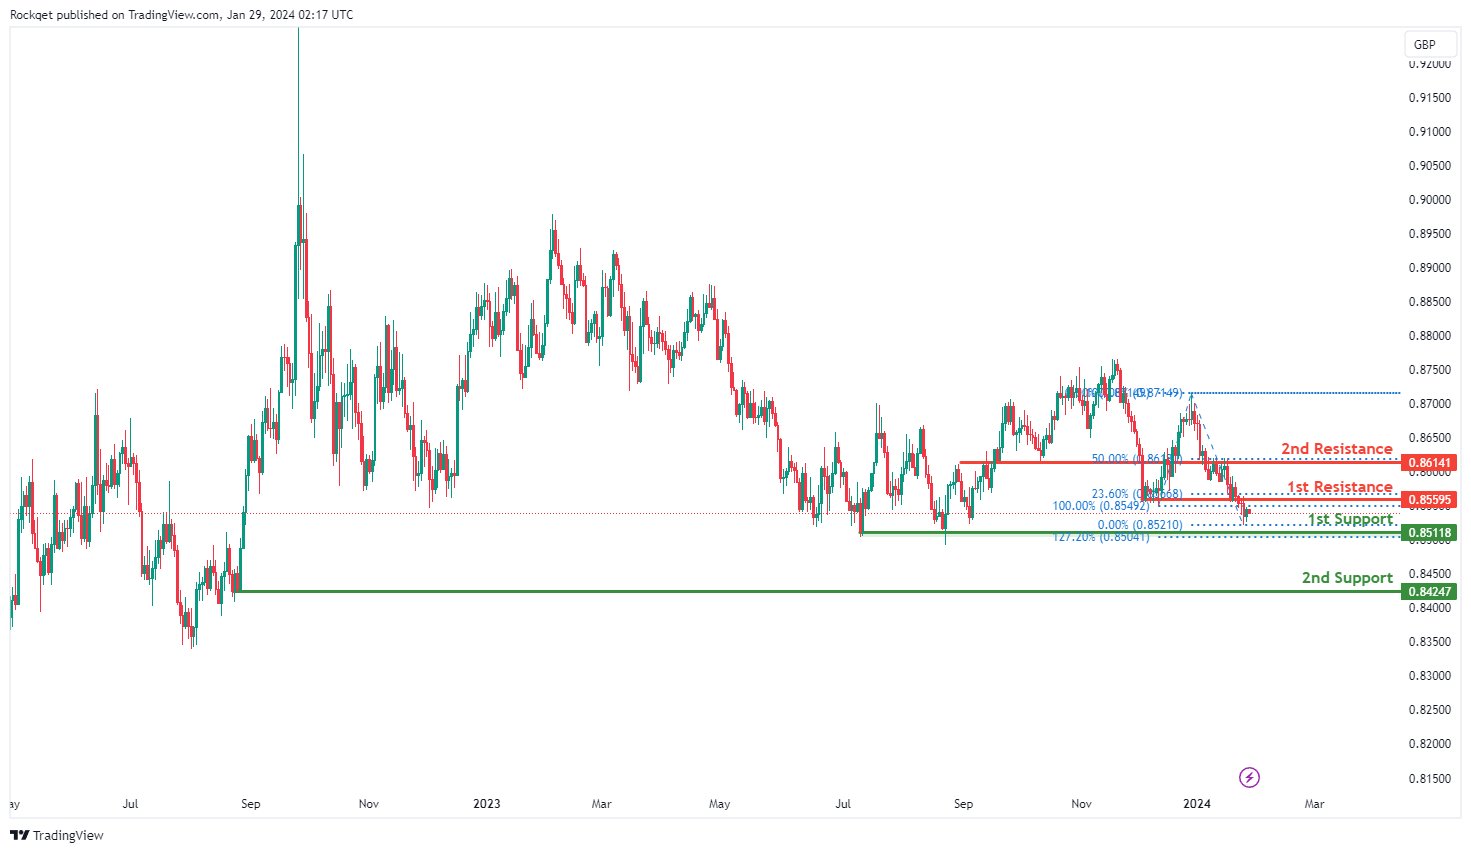
EUR/GBP:
The EUR/GBP (Euro/British Pound) chart currently has a bearish overall momentum, and your analysis suggests the potential for a short-term rise towards the 1st resistance level followed by a reversal off it and a drop towards the 1st support level.
The 1st support level at 0.85110 is considered significant for several reasons. It is identified as a multi-swing low support and also corresponds to a Fibonacci Extension level, adding to its importance as a potential support zone.
The 2nd support level at 0.84240 is identified as a swing low support, indicating its historical significance as a level where the price has found support during bearish movements.
On the resistance side, the 1st resistance level at 0.85590 is characterized as an overlap resistance and aligns with the 23.60% Fibonacci Retracement level. This suggests that it may serve as a potential barrier for further upward price movement.
The 2nd resistance level at 0.86140 is also categorized as an overlap resistance and coincides with the 50% Fibonacci Retracement level, further highlighting its importance as a potential resistance point.
GBP/USD:
The GBP/USD trading pair currently has a bearish overall momentum, and this is attributed to the fact that the price has broken below the lower channel line, indicating the continuation of the prior bearish trend. Your analysis suggests that there is potential for a bearish continuation in the price towards the 1st support level.
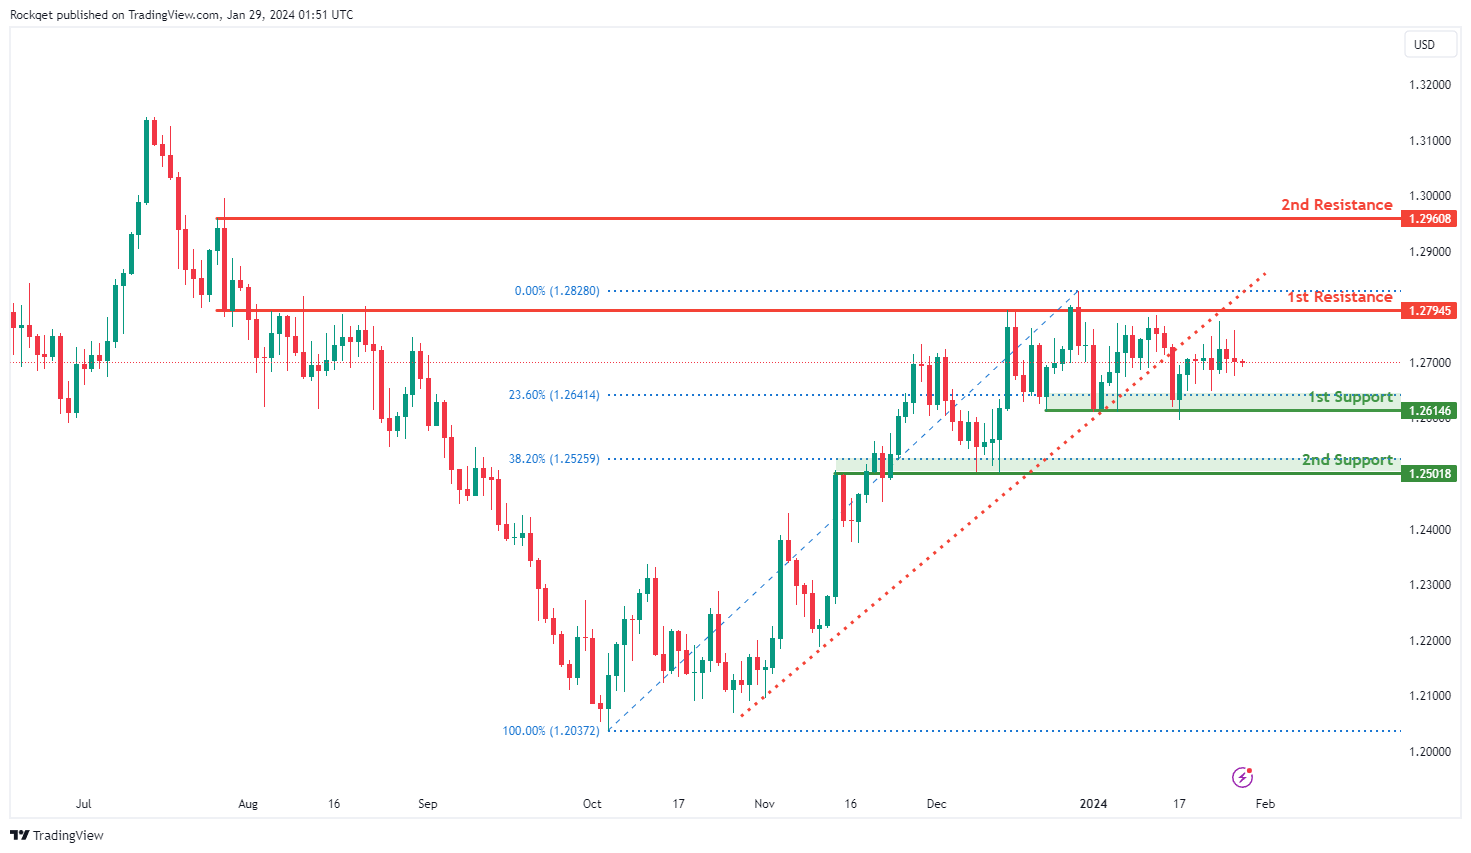
The 1st support level at 1.2614 is considered significant for several reasons. It represents a multi-swing low support, indicating that this price level has historically acted as a significant low point on the chart. Additionally, it coincides with the 23.60% Fibonacci Retracement level, adding to its importance as a potential support level.
The 2nd support level at 1.2501 is identified as an overlap support and also aligns with the 38.20% Fibonacci Retracement level, further reinforcing its significance as a support zone.
On the resistance side, the 1st resistance level at 1.2794 is recognized as an overlap resistance, indicating that this price level has historically served as both support and resistance. This makes it a potential barrier where selling pressure could emerge.
The 2nd resistance level at 1.2960 is categorized as a swing high resistance, suggesting that it represents a historical point where the price has encountered resistance.
GBP/JPY:
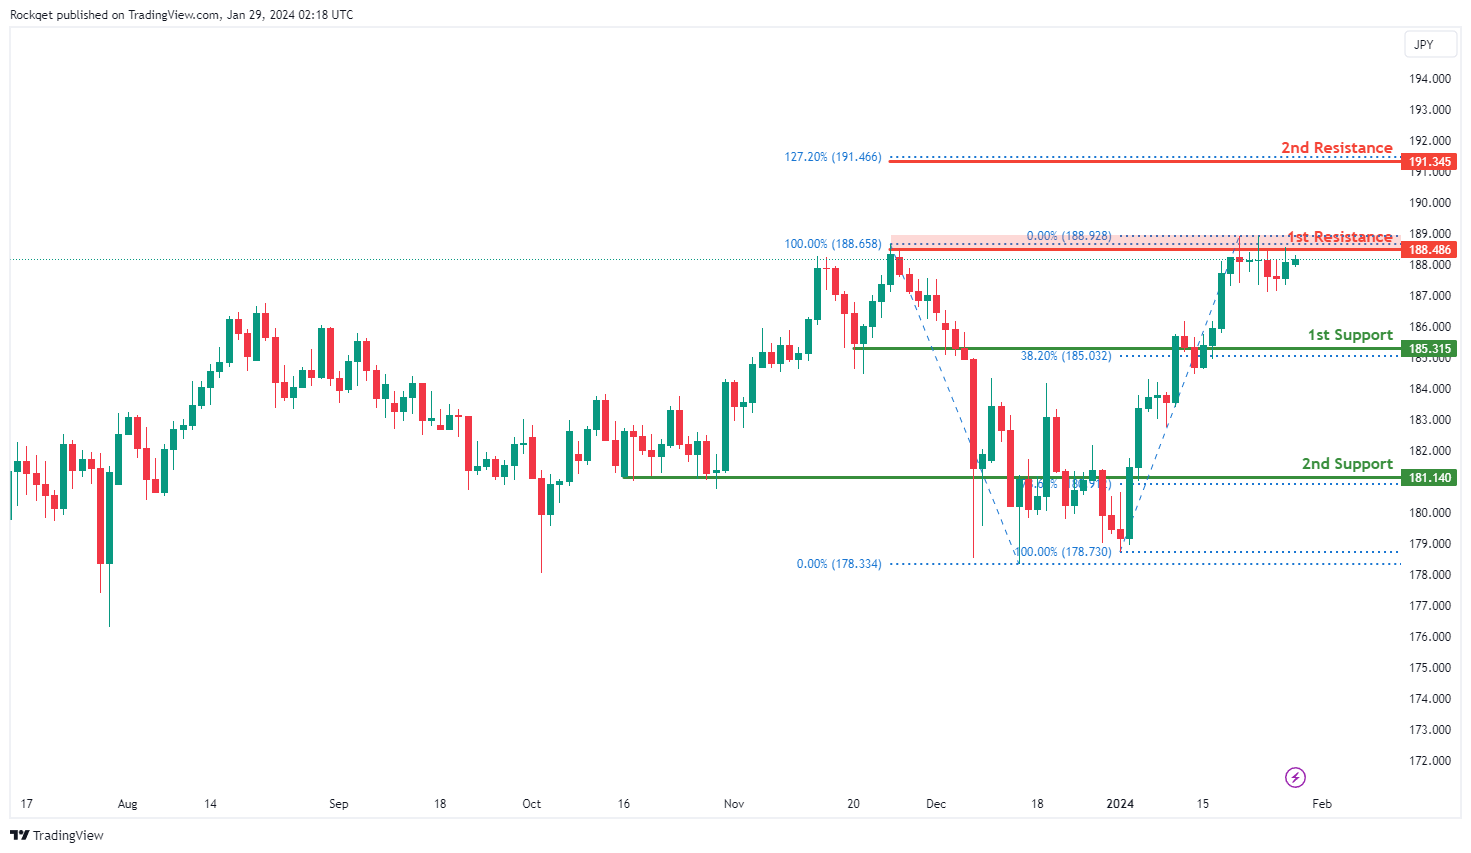
The GBP/JPY (British Pound/Japanese Yen) chart currently exhibits a bearish overall momentum, and your analysis suggests the potential for a bearish reaction off the 1st resistance level followed by a drop towards the 1st support level.
The 1st support level at 185.310 is considered significant for several reasons. It is identified as a pullback support and coincides with the 38.20% Fibonacci Retracement level, indicating that this level corresponds to a previous significant price level. The Fibonacci confluence adds to its importance as a potential support zone.
The 2nd support level at 181.140 is also identified as a pullback support and aligns with the 78.60% Fibonacci Retracement level, further reinforcing its significance as a potential support zone.
On the resistance side, the 1st resistance level at 188.480 is characterized as multi-swing high resistance, suggesting that it represents a historical point where the price has encountered resistance.
The 2nd resistance level at 191.340 is categorized as the 127.20% Fibonacci Extension, indicating an extended potential resistance level beyond the typical Fibonacci retracement levels.
USD/CHF:
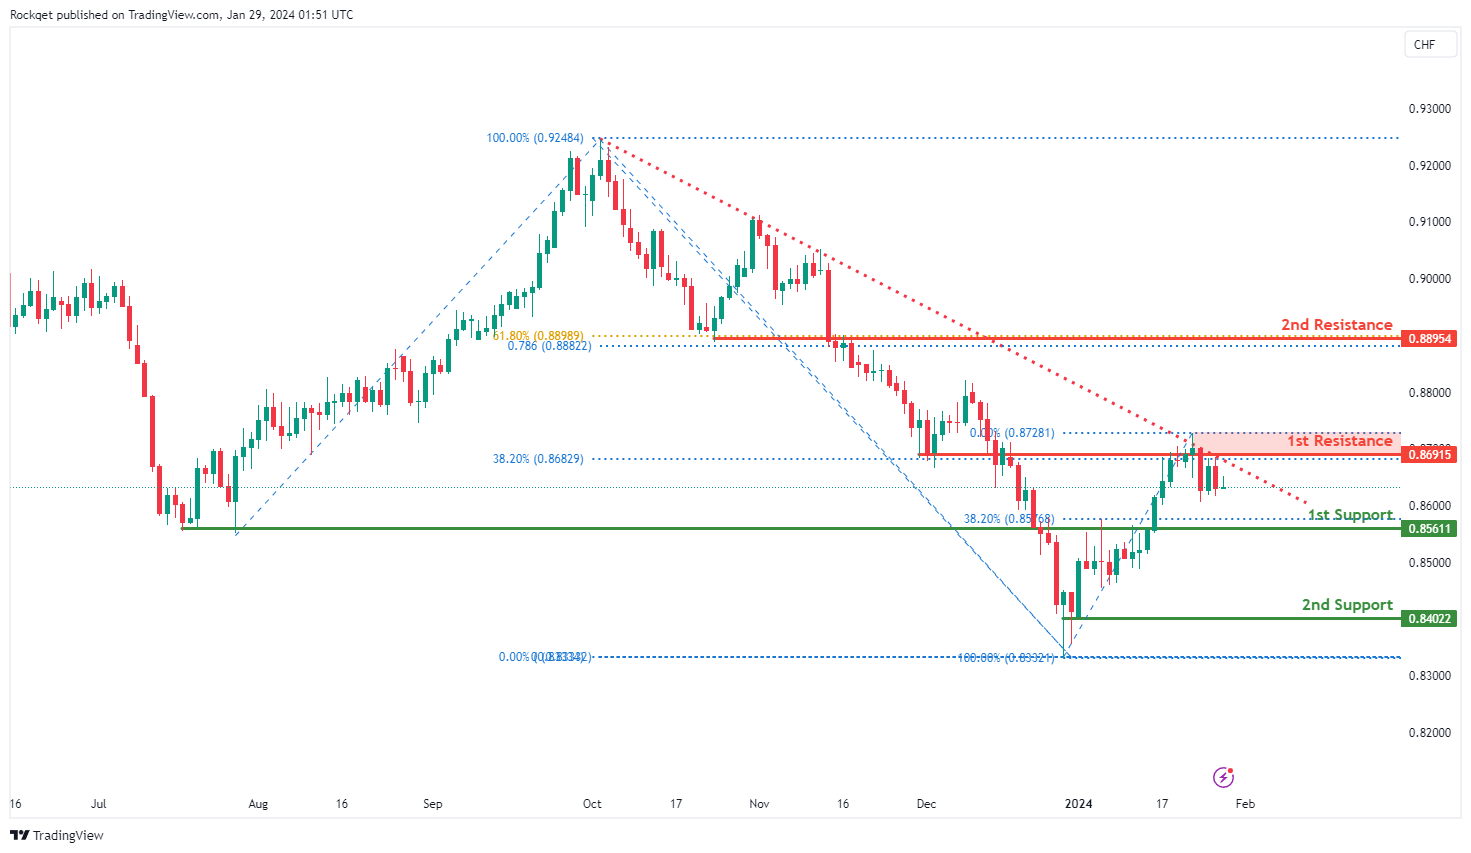
The USD/CHF trading pair currently exhibits a bearish overall momentum, and this momentum is supported by the fact that the price is below a major descending trendline, suggesting that bearish momentum is likely to continue. Your analysis suggests that there is potential for a bearish continuation in the price towards the 1st support level.
The 1st support level at 0.8561 is considered significant for several reasons. It is identified as a pullback support, indicating that this level might act as a support zone during price pullbacks within the bearish trend.
The 2nd support level at 0.8402 is recognized as a swing low support, emphasizing its significance as a level where price has previously found support during a bearish move.
On the resistance side, the 1st resistance level at 0.8691 is characterized as an overlap resistance and also coincides with the 38.20% Fibonacci Retracement level. This suggests that it may serve as a potential barrier for further upward price movement.
The 2nd resistance level at 0.8895 is categorized as an overlap resistance, and it coincides with both the 61.80% Fibonacci Retracement and the 78.60% Fibonacci Projection levels. This confluence of Fibonacci levels adds to its importance as a potential resistance point, indicating Fibonacci confluence.
USD/JPY:
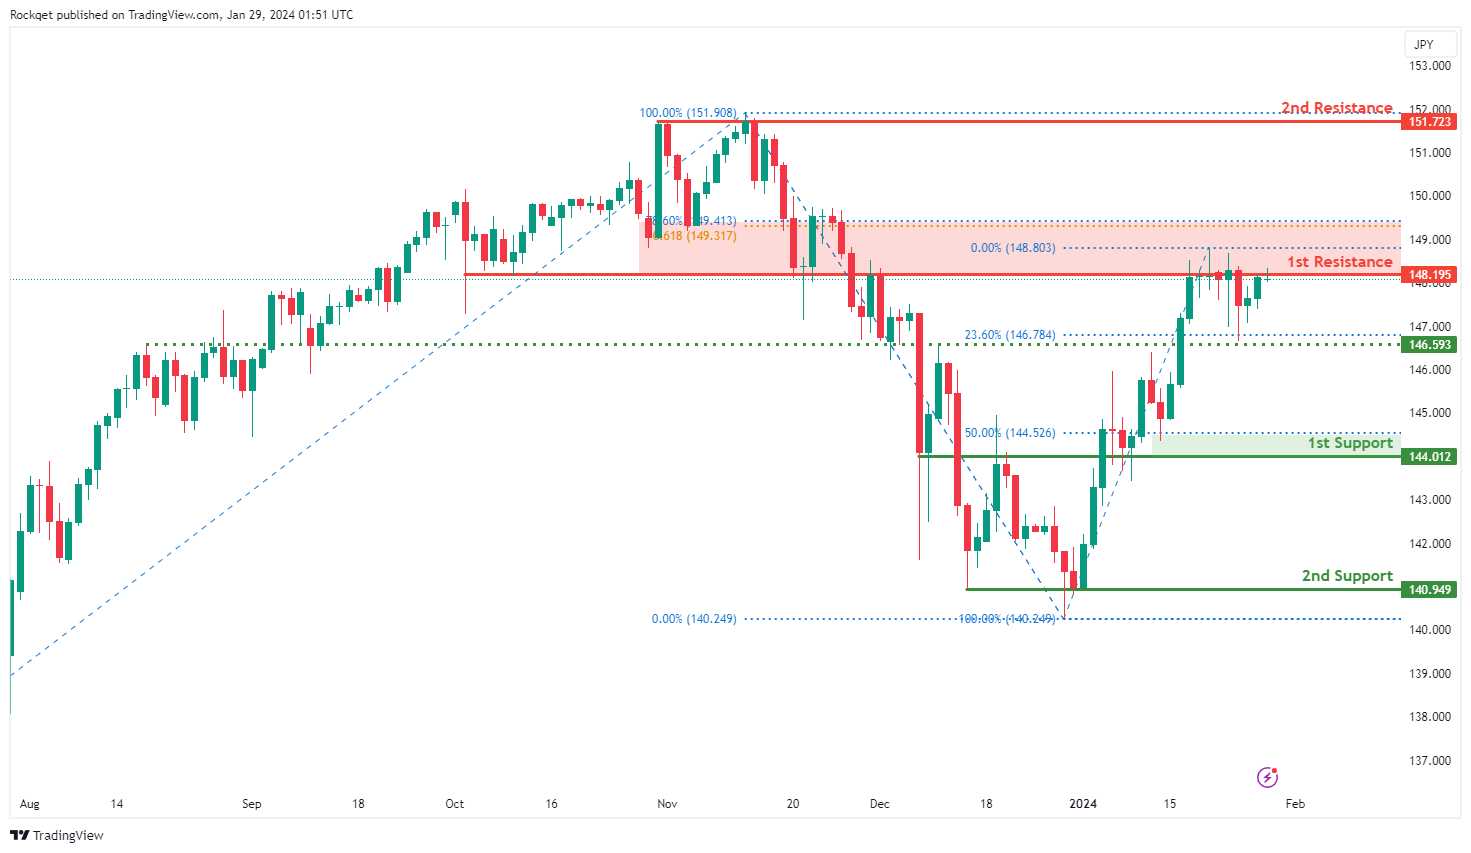
The USD/JPY trading pair currently has a bearish overall momentum. According to your analysis, there is potential for a bearish reaction off the 1st resistance level, followed by a drop towards the 1st support level.
The 1st support level at 144.01 is considered significant for several reasons. It represents an overlap support, indicating that this price level has historically acted as both support and resistance. Additionally, it coincides with the 50% Fibonacci Retracement level, suggesting that this level corresponds to a previous significant low point on the chart, and the Fibonacci confluence adds to its importance as a potential support level.
The 2nd support level at 140.94 is identified as a multi-swing low support, reinforcing its significance as a level where price has previously found support during a bearish move.
On the resistance side, the 1st resistance level at 148.19 is recognized as an overlap resistance, indicating that this price level has historically served as both support and resistance. This makes it a potential barrier where selling pressure could emerge.
The 2nd resistance level at 151.72 is categorized as a multi-swing high resistance, suggesting that it represents a historical point where the price has encountered resistance.
Additionally, there is an intermediate support level at 146.59, characterized as an overlap support, which coincides with the 23.60% Fibonacci Retracement level. This intermediate support level adds an additional layer of support during the bearish move.
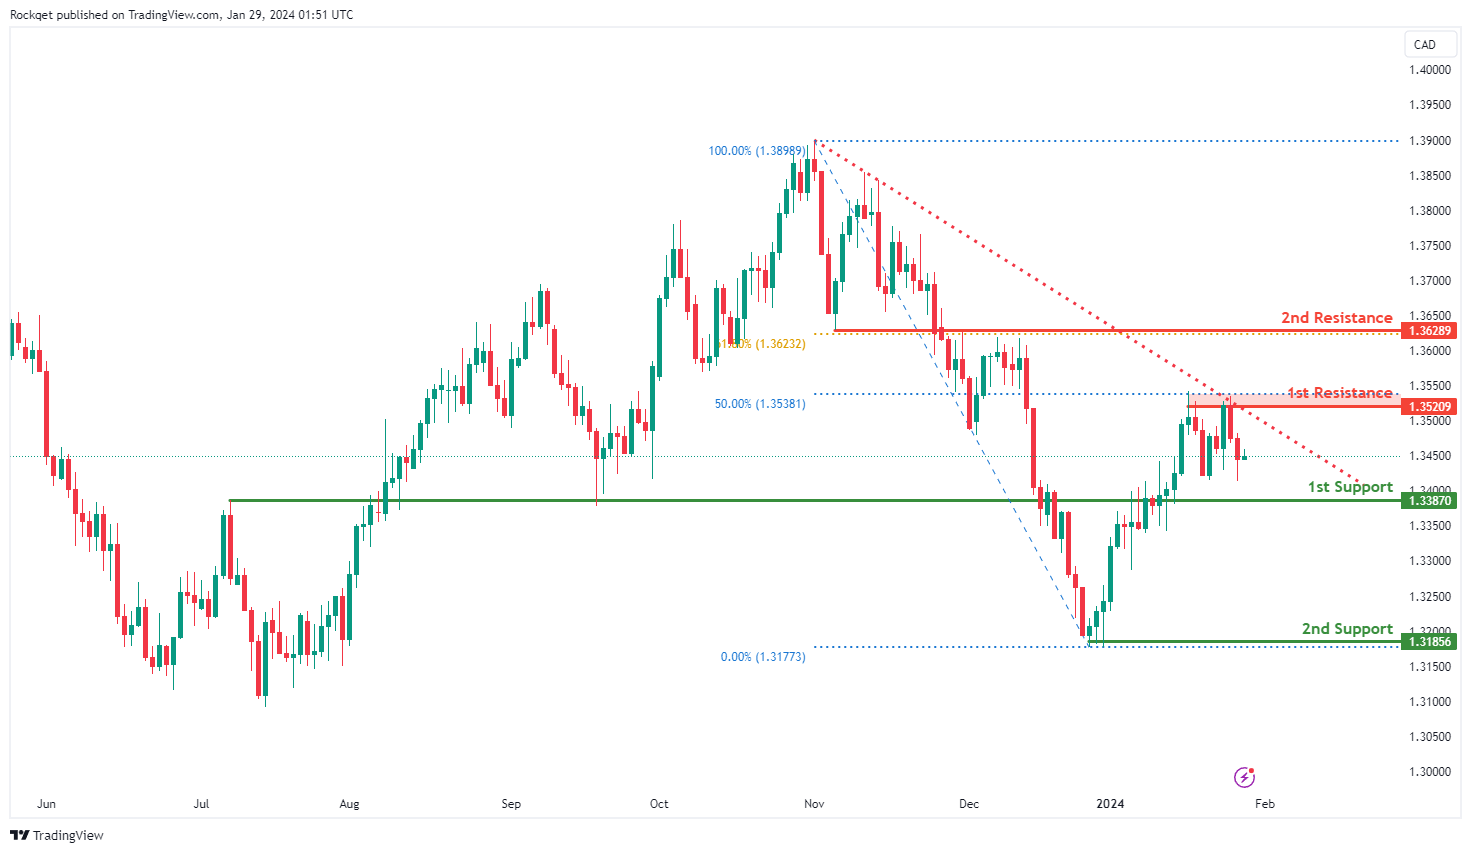
USD/CAD:
The USD/CAD chart currently exhibits a neutral bias. In this context, there is a potential scenario for price to fluctuate between the 1st support and the 1st resistance.
The 1st support level at 1.3387 is identified as an overlap support. Further below, the 2nd support level at 1.3185 is marked as a swing-low support, further reinforcing its importance as a key support level.
To the upside, the 1st resistance level at 1.3520 is identified as a pullback resistance that aligns close to the 50.00% Fibonacci Retracement level. Higher up, the 2nd resistance level at 1.3628 is noted as an overlap resistance that aligns with the 61.80% Fibonacci Retracement level, further reinforcing its significance as a potential resistance zone.
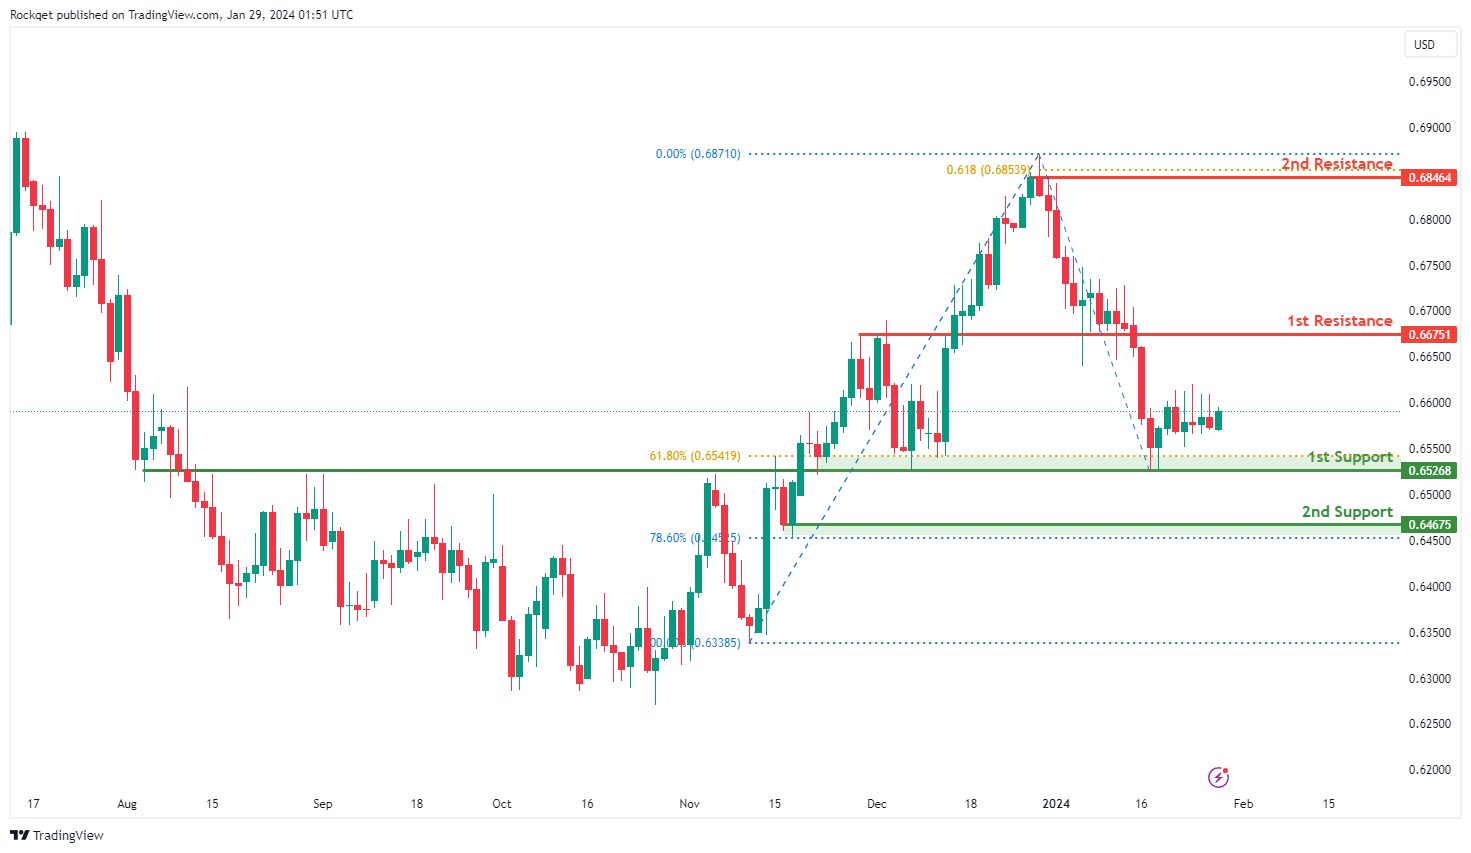
AUD/USD:
The AUD/USD chart currently exhibits a neutral bias. In this context, there is a potential scenario for price to fluctuate between the 1st support and the 1st resistance.
The 1st resistance level at 0.6675 is identified as a pullback resistance. Higher up, the 2nd resistance level at 0.6846 is noted as a swing-high resistance that aligns with the 61.80% Fibonacci Projection level, suggesting a potential barrier against further upside movement.
To the downside, the 1st support level at 0.6526 is identified as an overlap support that aligns close to the 61.80% Fibonacci Retracement level. Further below, the 2nd support level at 0.6467 is marked as a pullback support that aligns close to the 78.60% Fibonacci Retracement level, further reinforcing its importance as a key support level.
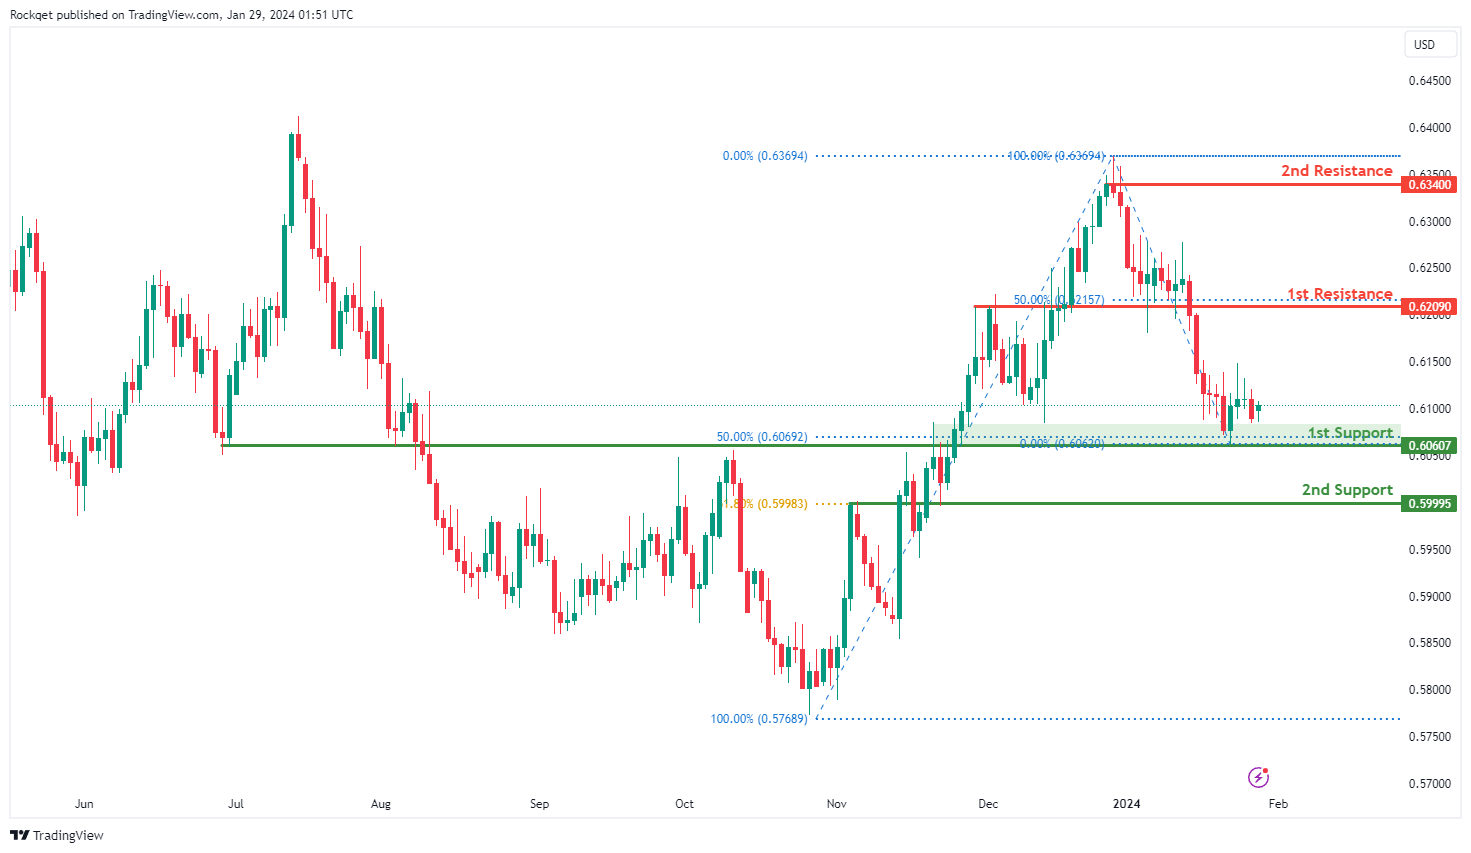
NZD/USD
The NZD/USD chart currently exhibits a neutral bias. In this context, there is a potential scenario for price to fluctuate between the 1st support and the 1st resistance.
The 1st support level at 0.6060 is identified as an overlap support that aligns close to the 50.00% Fibonacci Retracement level. Further below, the 2nd support level at 0.5999 is also identified as an overlap support that coincides with the 61.80% Fibonacci Retracement level, further reinforcing its significance as a potential support zone.
On the resistance side, the 1st resistance level at 0.6209 is characterized as an overlap resistance that aligns with the 50.00% Fibonacci Retracement level. Higher up, the 2nd resistance level at 0.6340 is categorized as a swing-high resistance, suggesting a potential barrier against further upside movement.
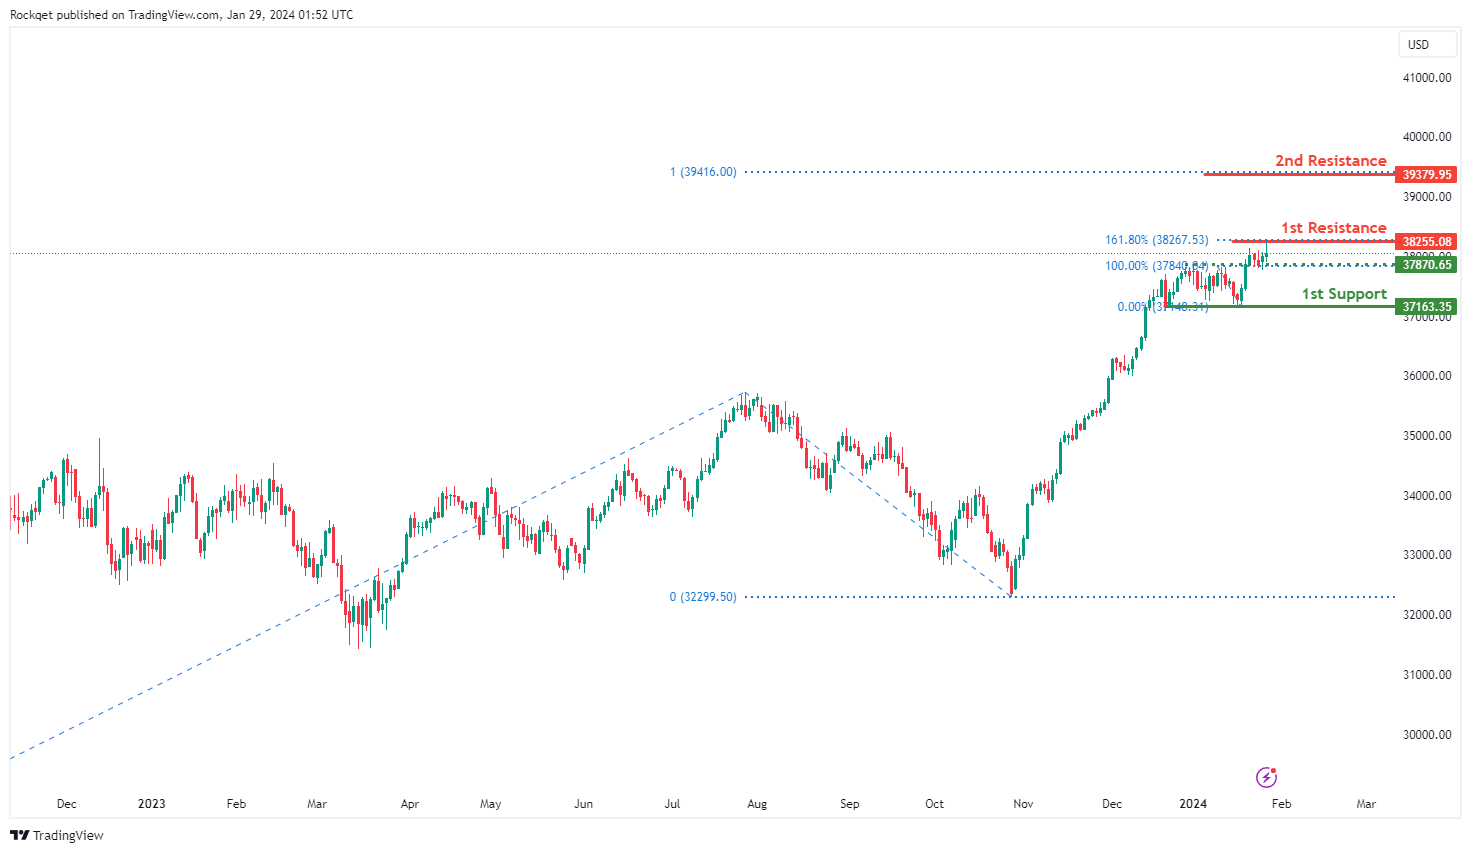
DJ30:
The DJ30 (Dow Jones Industrial Average) chart currently exhibits a neutral bias, indicating a lack of a clear trend direction. In this context, there is a potential scenario for price to fluctuate between the 1st support and the 1st resistance levels.
The intermediate support level at 37,870.65 is identified as an overlap support. Further below, the 1st support level at 37,163.35 is recognized as a pullback support, providing additional reinforcement to the potential support zone.
On the resistance side, the 1st resistance level at 38,255.08 is highlighted as a level where a pullback resistance that aligns with the 161.80% Fibonacci Extension level. Higher up, the 2nd resistance level at 39,379.95 is identified as a level that aligns with the 100.00% Fibonacci Projection level, reinforcing its potential as a key resistance level.
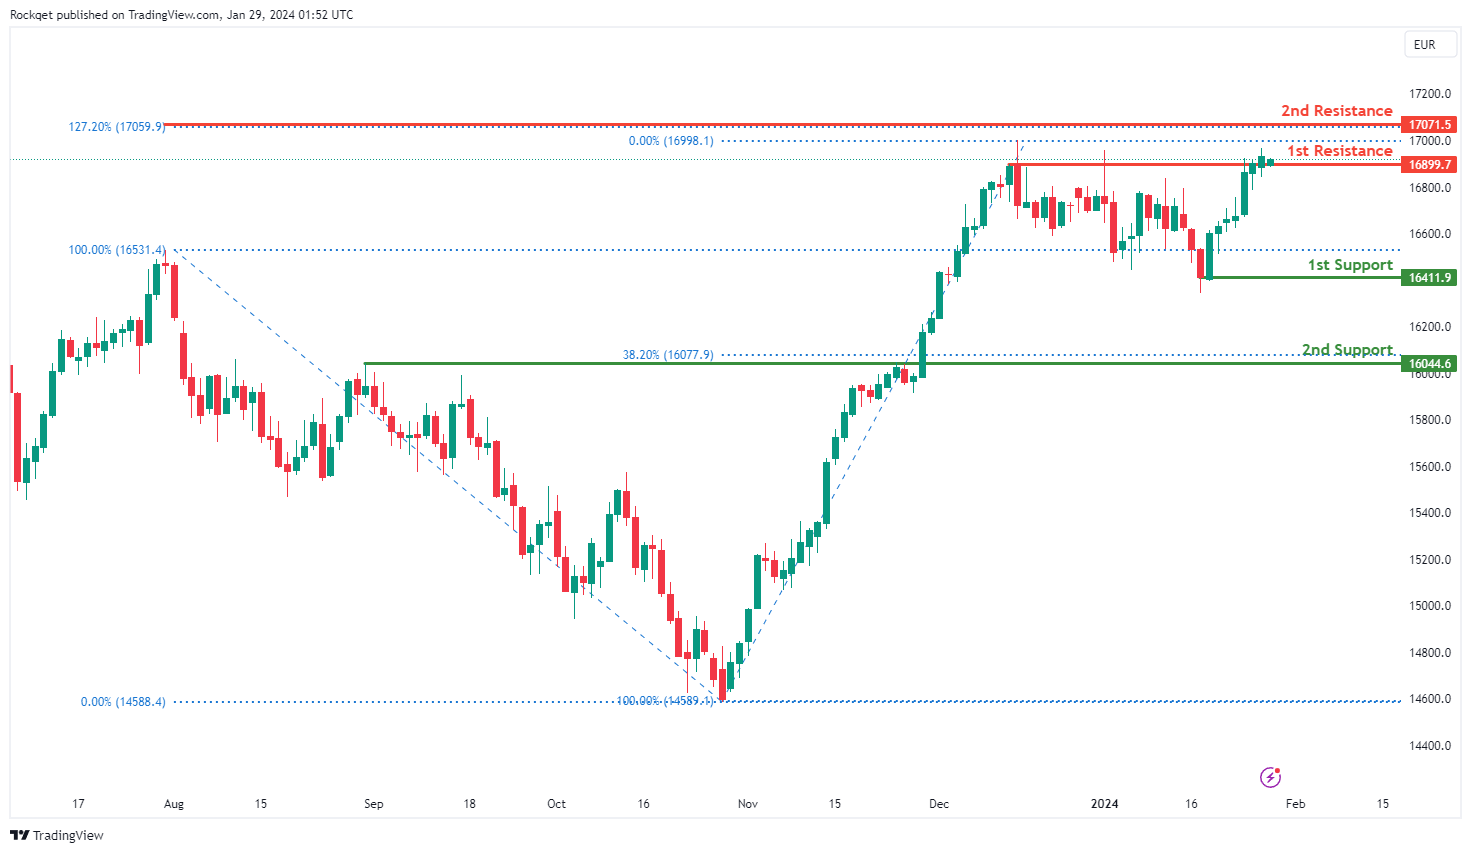
GER40:
The GER40 (DAX) chart currently exhibits an overall bullish momentum, indicating a prevailing upward trend. In this context, there is a potential scenario for price break above the 1st resistance and make a bullish move towards the 2nd resistance.
The 1st resistance at 16,899.70 is highlighted as a swing-high resistance. Higher up, the 2nd resistance level at 17,071.50 is noted as a level that aligns with the 127.20% Fibonacci Extension level, indicating a potential barrier against further upward movement.
On the support side, the 1st support level at 16,411.90 is identified as a pullback support. Further below, the 2nd support level at 16,044.60 is also recognized as a pullback support that coincides with the 38.20% Fibonacci Retracement level, further reinforcing its importance as a key support zone.
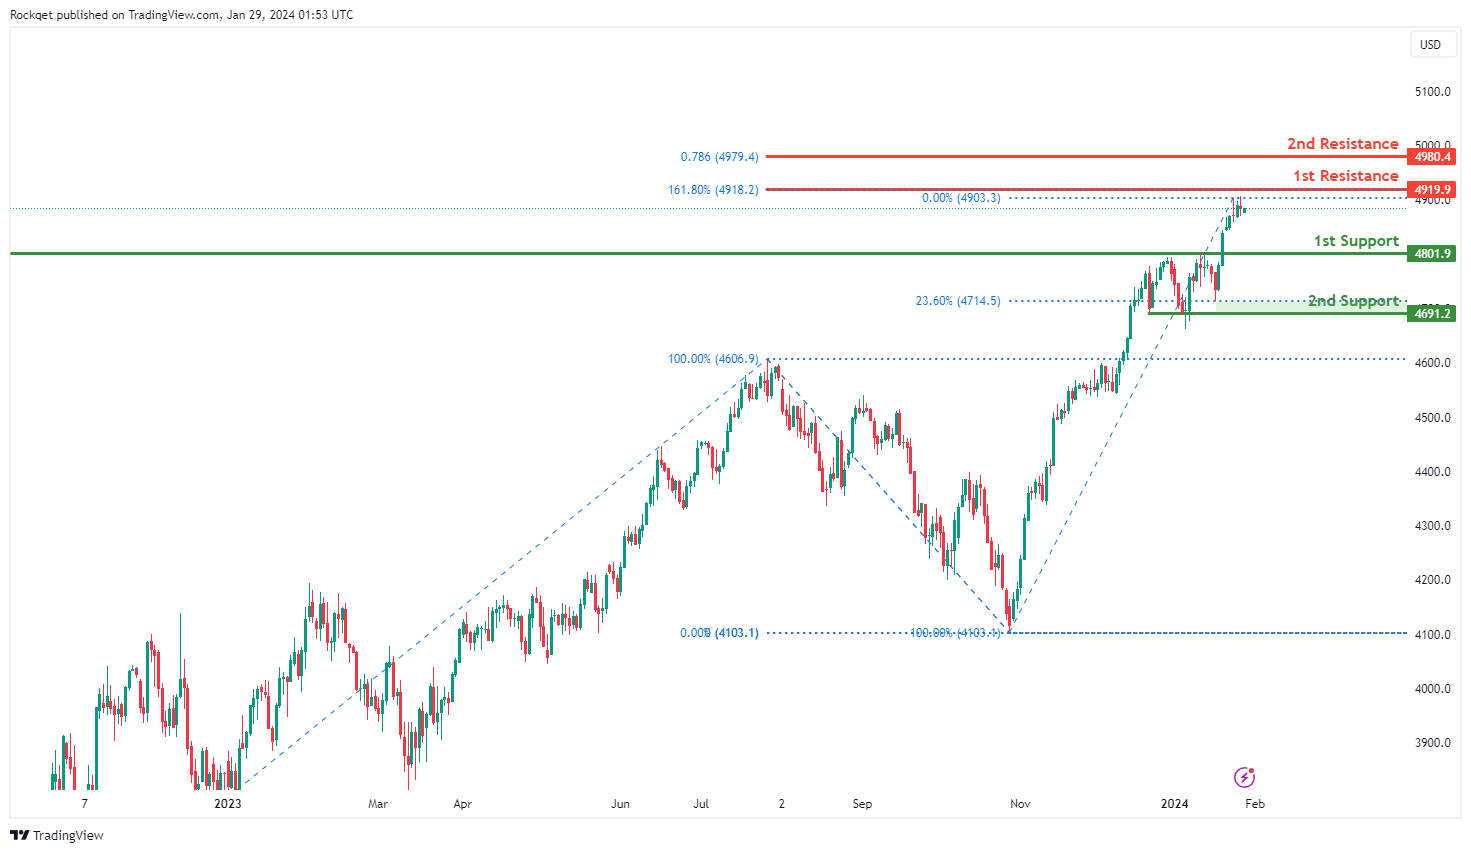
US500:
The US500 (S&P 500) chart currently exhibits an overall bullish momentum, indicating a prevailing upward trend. In this context, there is a potential scenario for price to make a bullish upward movement towards the 1st resistance.
The 1st resistance level at 4,919.90 is identified as a level that aligns with the 161.80% Fibonacci Extensions level. Additionally, the 2nd resistance level at 4,980.40 is acknowledged as a level that aligns with the 78.60% Fibonacci Projection level, suggesting a key barrier against further upward movement.
On the support side, the 1st support level at 4,801.90 is identified as a pullback support. Further below, the 2nd support level at 4,691.20 is also recognized as a pullback support that aligns close to the 23.60% Fibonacci Retracement level, providing additional strength to this potential support zone.
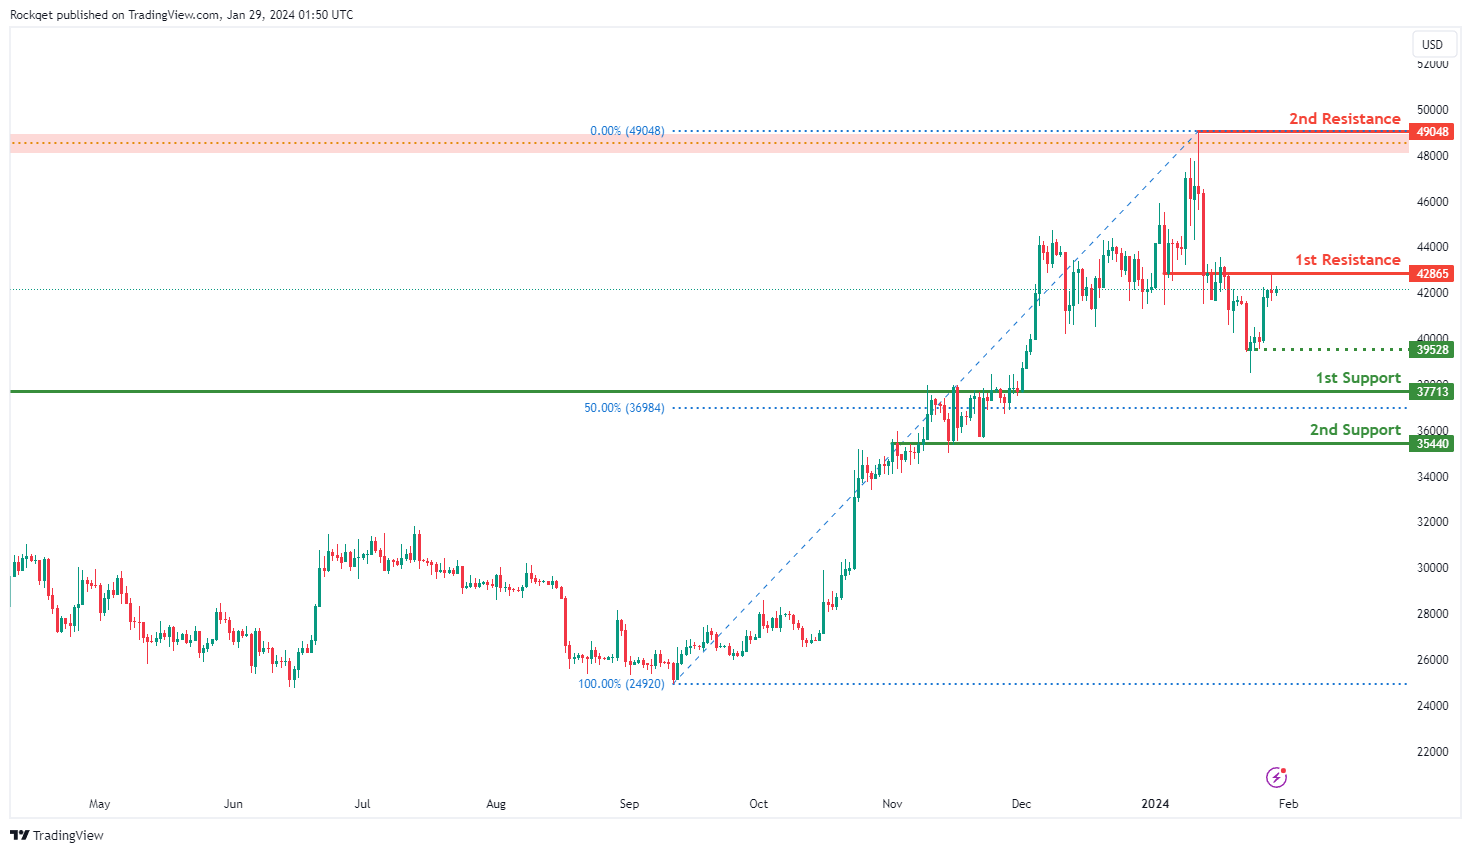
BTC/USD:
The BTC/USD (Bitcoin/US Dollar) chart currently has a bearish overall momentum, and your analysis suggests the potential for a bearish reaction off the 1st resistance level followed by a drop towards the 1st support level.
The 1st support level at 37,713 is considered significant as it is identified as a pullback support. This level represents a potential area where buying interest may emerge, providing temporary support for the price of Bitcoin.
The 2nd support level at 35,440 is identified as an overlap support and coincides with the 50% Fibonacci Retracement level. This suggests that it is a price level with historical significance, and the Fibonacci confluence adds to its importance as a potential support zone.
On the resistance side, the 1st resistance level at 42,865 is characterized as an overlap resistance, indicating that it has historically acted as both support and resistance.
The 2nd resistance level at 49,048 is categorized as a swing high resistance, suggesting that it represents a historical point where the price has encountered significant resistance.
Intermediate support at 39,528 is also mentioned as a multi-swing low support, indicating its historical significance.
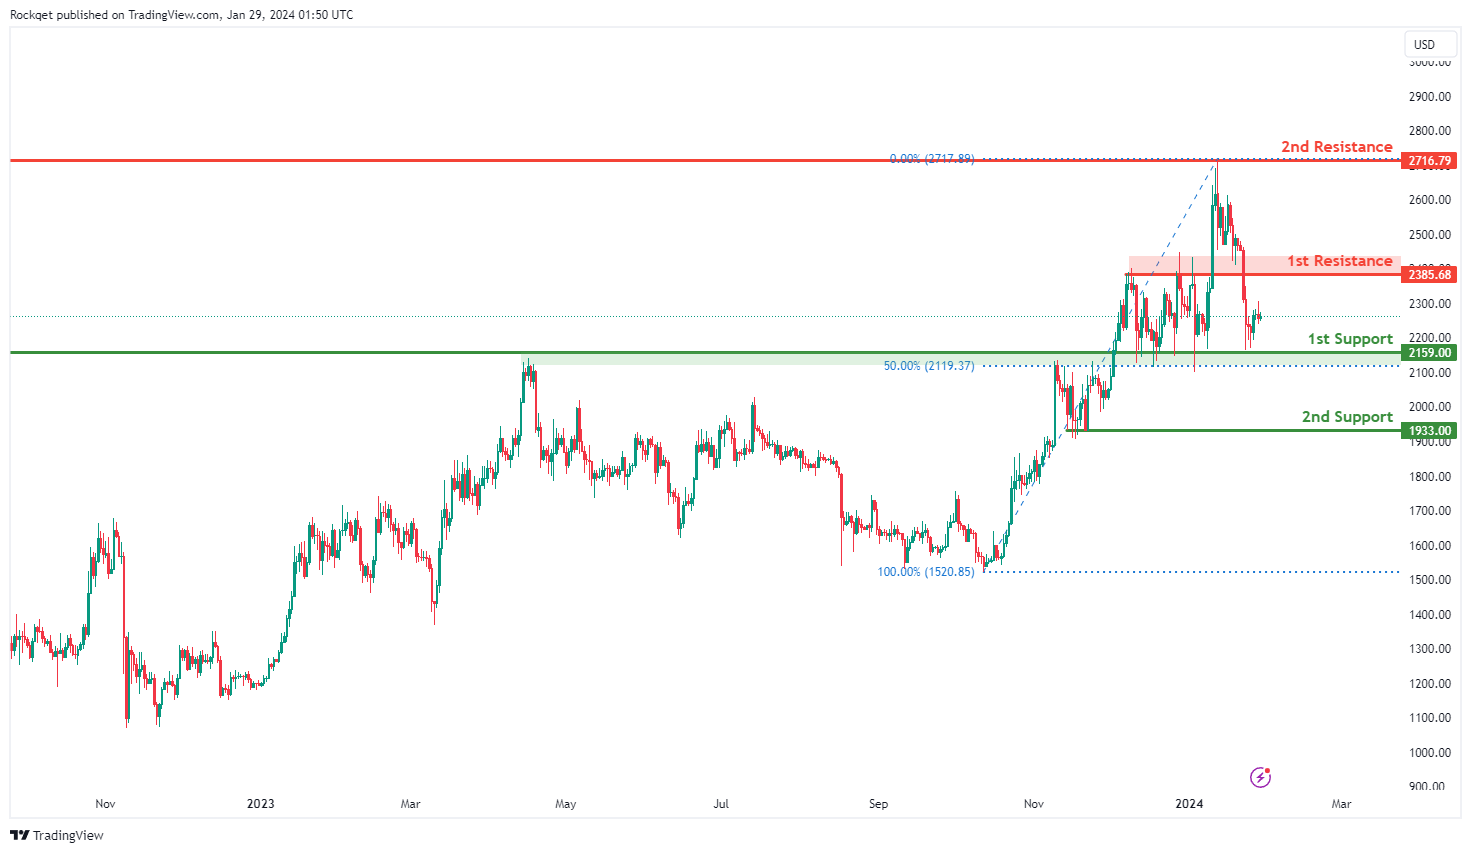
ETH/USD:
The ETH/USD (Ethereum/US Dollar) chart currently exhibits a bullish overall momentum, and your analysis suggests the potential for a bullish continuation towards the 1st resistance level.
The 1st support level at 2,159.00 is considered significant as it is identified as an overlap support and coincides with the 50% Fibonacci Retracement level. This level represents a potential area where buying interest may emerge, providing temporary support for the price of Ethereum. The Fibonacci confluence adds to its importance as a potential support zone.
The 2nd support level at 1,933.00 is identified as a multi-swing low support, indicating its historical significance as a support level.
On the resistance side, the 1st resistance level at 2,385.68 is characterized as a pullback resistance, suggesting that it represents a historical point where the price has encountered resistance.
The 2nd resistance level at 2,716.79 is categorized as a swing high resistance, indicating that it represents a historical point where the price has encountered significant resistance.
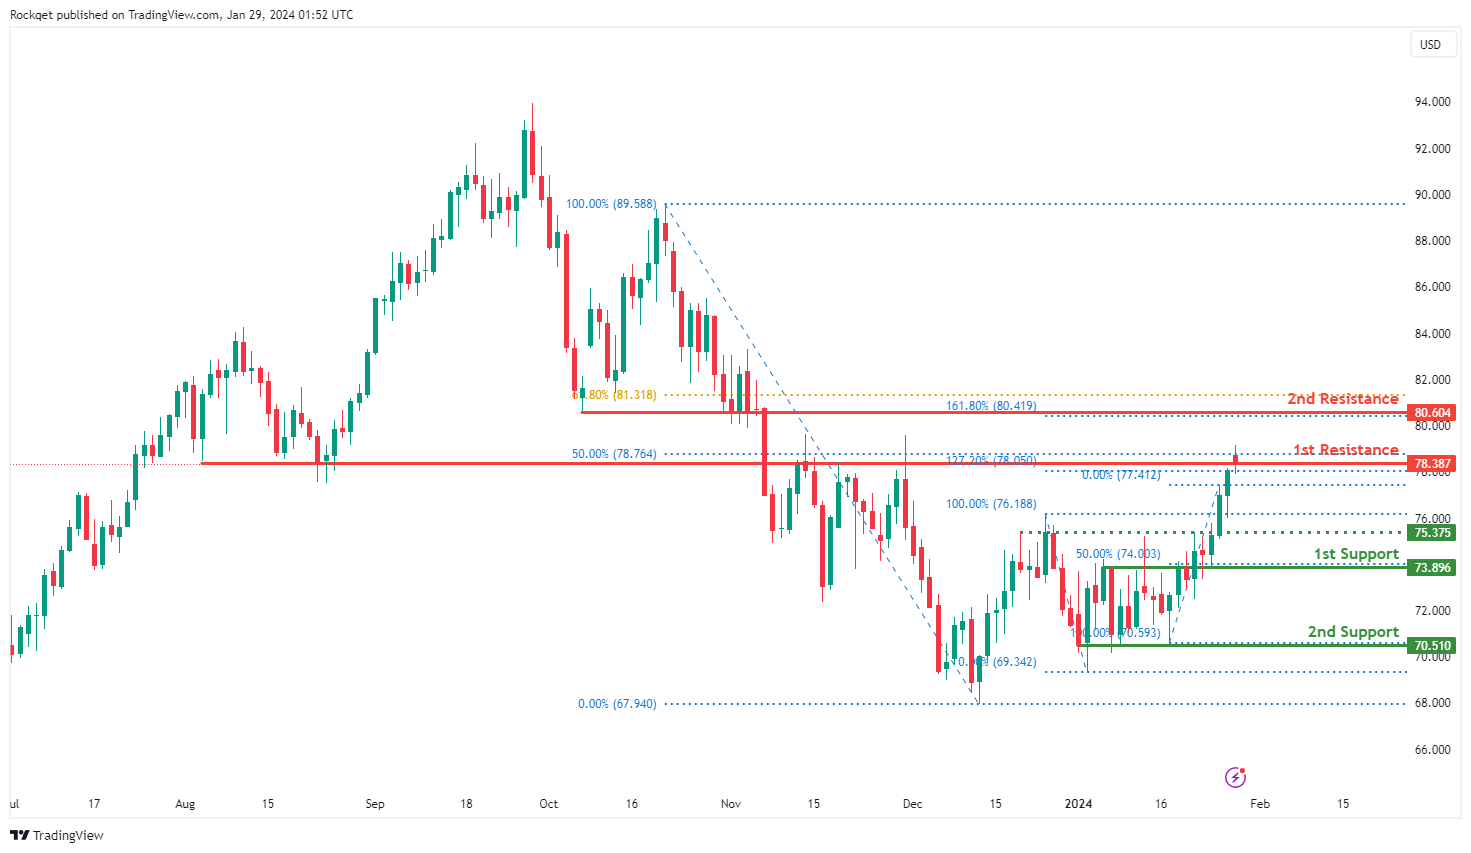
WTI/USD:
The WTI (West Texas Intermediate) chart currently exhibits an overall bullish momentum. In this context, there is potential for the price to make a bearish reaction off the 1st resistance in the short term before resuming the uptrend.
The intermediate support level at 75.37 is noted as a pullback support while the 1st support level at 73.89 is identified as an overlap support that coincides with the 50.00% Fibonacci Retracement level. Further below, the 2nd support level at 70.51 is identified as a pullback support, reinforcing its significance as a level where the price has previously found support during a bullish move.
On the resistance side, the 1st resistance level at 78.38 is characterized as an overlap resistance that coincides with a confluence of Fibonacci levels i.e. the 50.00% Retracement and the 127.20% Extension levels. Higher up, the 2nd resistance level at 80.60 is categorized as a pullback resistance that aligns close to the 61.80% Fibonacci Retracement level, further highlighting its importance as a potential resistance point.
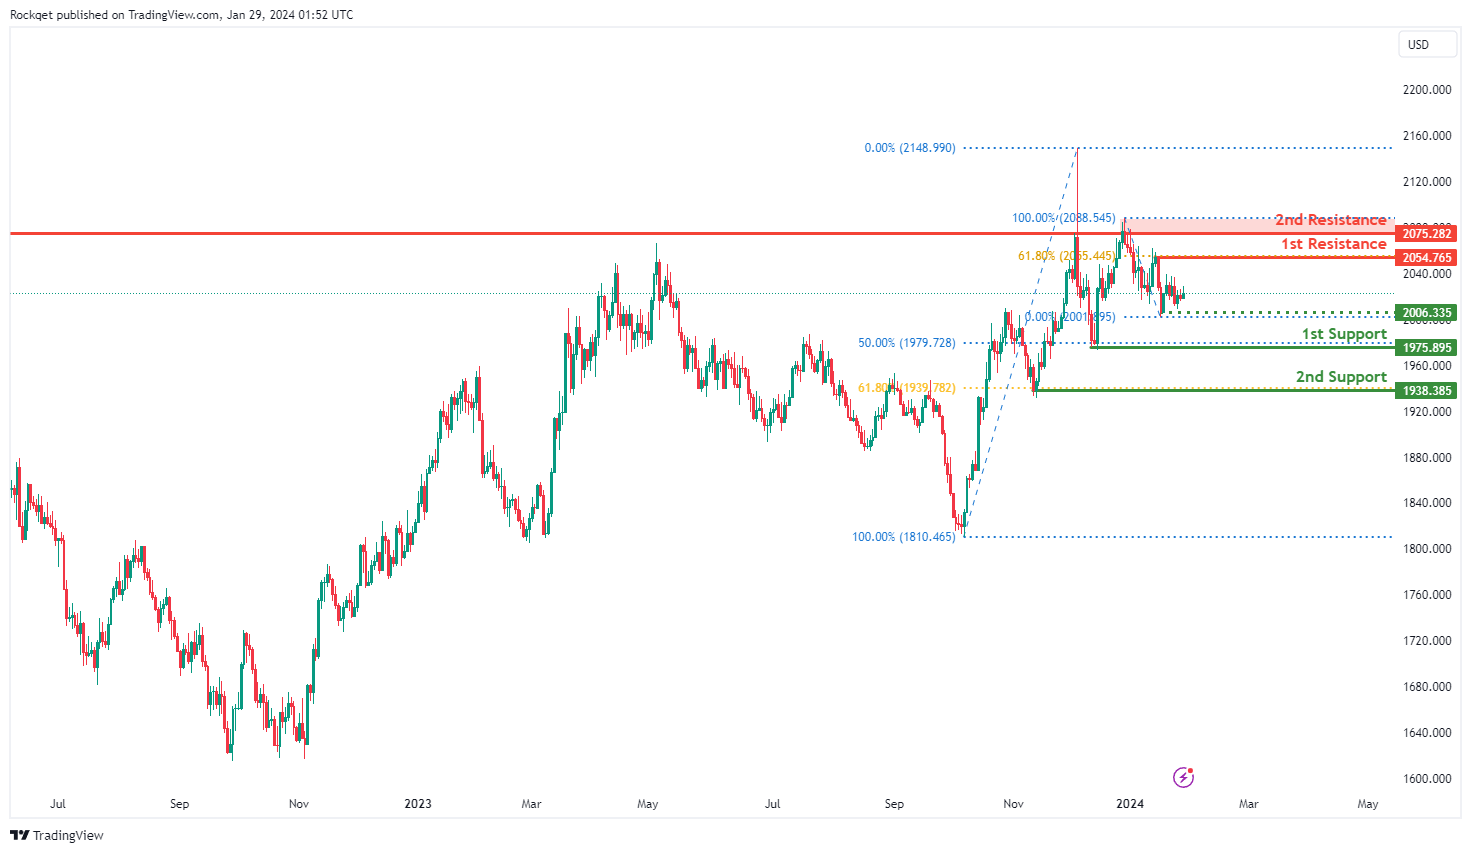
XAU/USD (GOLD):
The XAU/USD (Gold/US Dollar) chart currently has a bearish overall momentum. According to your analysis, there is potential for a bearish continuation in the price towards the 1st support level.
The 1st support level at 1975.89 is considered significant for several reasons. It is identified as a swing low support, indicating that this price level has historically acted as a significant low point on the chart. Additionally, it coincides with the 50% Fibonacci Retracement level, suggesting that this level corresponds to a previous significant low point on the chart, and the Fibonacci confluence adds to its importance as a potential support level.
The 2nd support level at 1938.38 is also identified as a swing low support and coincides with the 61.80% Fibonacci Retracement level, further reinforcing its significance as a potential support zone during a bearish move.
On the resistance side, the 1st resistance level at 2054.76 is characterized as a swing high resistance and coincides with the 61.80% Fibonacci Retracement level. This suggests that it may serve as a potential barrier for further upward price movement.
The 2nd resistance level at 2075.28 is also categorized as a swing high resistance, emphasizing its historical significance as a level where the price has encountered resistance.
Additionally, there is an intermediate support level at 2006.33, identified as a swing low support, which adds an additional layer of support during the bearish move.