Sample Category Title
EUR/USD At Risk of Fresh Lows Below 1.0800
Key Highlights
- EUR/USD is struggling to start a recovery wave above 1.0920.
- A major bearish trend line is forming with resistance near 1.0900 on the 4-hour chart.
- GBP/USD is struggling to recover above the 1.2760 resistance zone.
- Crude oil prices climbed higher above the $76.50 resistance.
EUR/USD Technical Analysis
The Euro attempted a minor increase above the 1.0900 zone against the US Dollar. However, EUR/USD failed to settle above the 1.0920 resistance and started another decline.
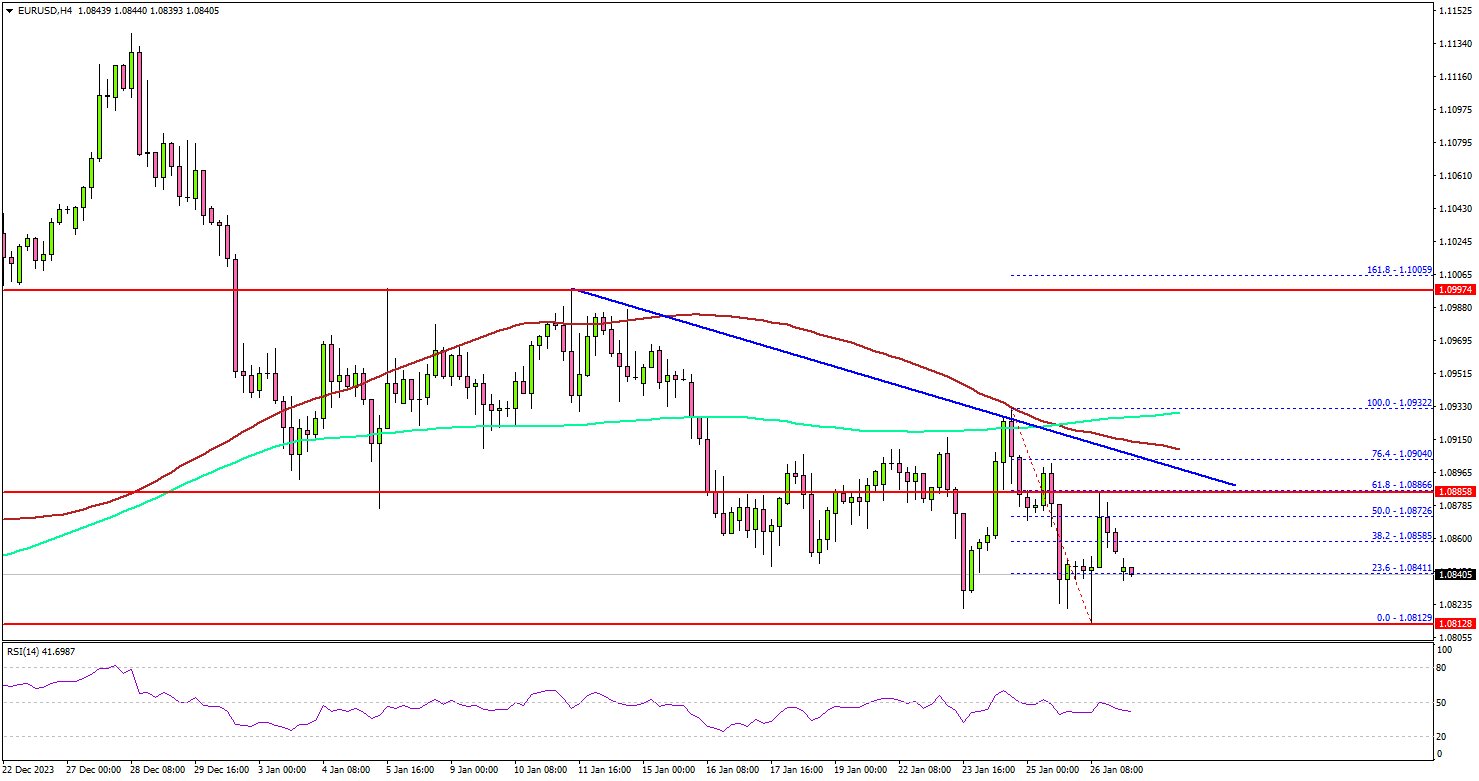
Looking at the 4-hour chart, the pair remained in a bearish zone below 1.0920, the 100 simple moving average (red, 4 hours), and the 200 simple moving average (green, 4 hours).
The bulls are now protecting the 1.0815 support zone. If there is a downside break below the 1.0815 level, the pair could even dive below 1.0800. The next major support is 1.0765. Any more losses might call for a drop toward the 1.0720 support.
On the upside, the pair is facing resistance near the 1.0900 level. There is also a major bearish trend line forming with resistance near 1.0900 on the same chart.
The next key resistance is near the 1.0920 level or the 100 simple moving average (red, 4 hours). A close above the 1.0920 zone could open the doors for more upsides. The next stop for the bulls might be 1.0980. Any more gains might send EUR/USD toward the 1.1050 level.
Looking at GBP/USD, the pair is stuck below the 1.2760 resistance and might witness another decline in the near term.
Economic Releases
- Dallas Fed Manufacturing Business Index for Jan 2023 – Forecast -9.0 versus -9.3 previous.
WTI oil edges closer to 80 following escalation in Middle East and US troop fatalities
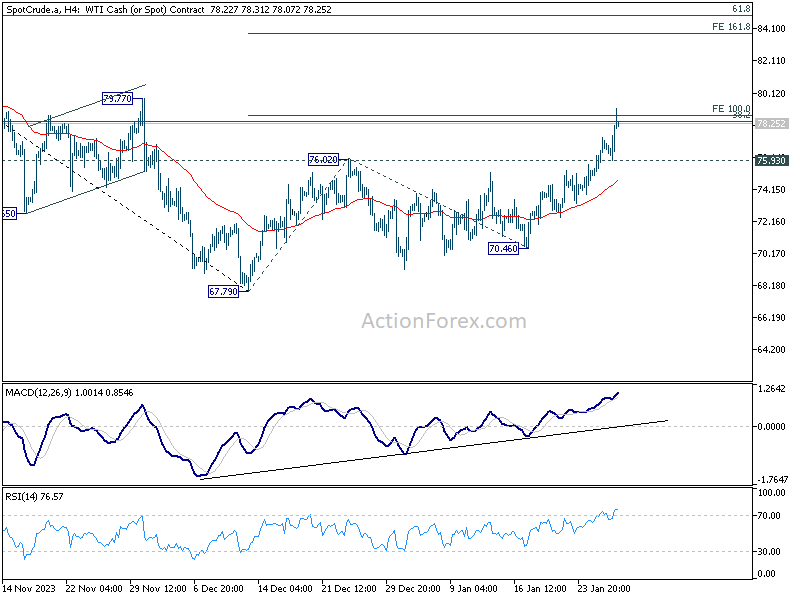
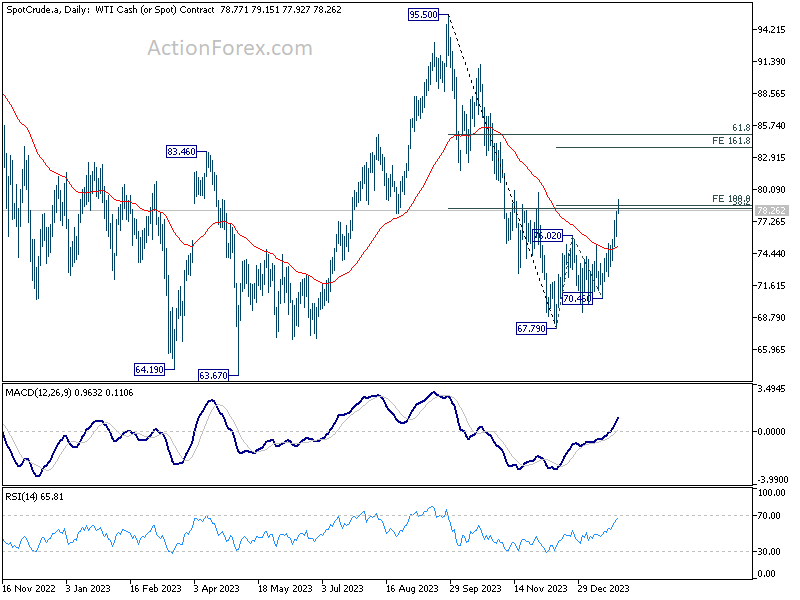
Notable rally is seen in oil markets as the week commences, with WTI crude oil marching towards 80 handle. This rise is largely driven by escalating tensions in the Middle East. Over the past weekend, a drone strike in Jordan, which has been linked to Iran, resulted in death of three US troops and injuries to as many as 34. Adding to regional instability, ongoing aggressive maritime attacks by Yemen's Houthi rebels in the Red Sea continue to disrupt traffic and heighten geopolitical tensions.
Technically, WTI is now pressing an important near term cluster resistance at 38.2% retracement of 95.50 to 67.79 at 78.37, and 100% projection of 67.79 to 76.02 from 70.46 at 78.69. Sustained break of this level will solidify the case that fall from 95.50 has completed at 67.79.
In this bullish scenario, rise from 67.79 is at least a correction to fall from 95.50, with prospect of being the third leg of the pattern from 63.67 low. In either case, next target will be 161.8% projection at 83.77.
Nevertheless, rejection by 78.37/69, followed by 75.93 will argue that rebound from 67.79 has completed already, and keep near term outlook neutral at best.
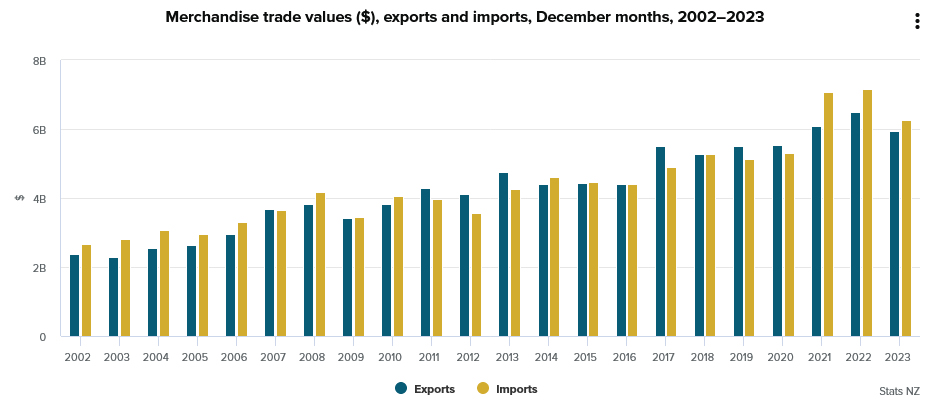
New Zealand’s goods exports down -8.7% yoy in Dec, imports fall -13% yoy
The New Zealand economy had a significant downturn in international trade during December, with goods exports dropping by -8.7% yoy, amounting to a decrease of NZD 568B, resulting in exports totaling NZD 5.9B. Concurrently, goods imports saw a more pronounced fall of -13%yoy, which translates to a reduction of NZD 896m, culminating in imports of NZD 6.3B. This overall downturn in trade activities led to a monthly trade deficit of NZD 323m, which, while substantial, was less severe than the anticipated deficit of NZD 975m.
A notable aspect of this trade activity is the geographical distribution of these declines. Among New Zealand's key trading partners, China marked the most significant decrease in exports, with a reduction of NZD 295m, indicating a -16% drop. This was followed by declines in exports to EU (-20% drop, NZD 75m), Japan (-17% drop, NZD 54m), US (-4.6% drop, NZD 38m), and Australia (-0.8% drop, NZD 6m).
On the import side, US led the fall with a dramatic -40% reduction, amounting to NZD 390m less in imports. Other significant decreases in imports were observed from China (-12% drop, NZD 185m), the European Union (-14% drop, NZD 152m), and Australia (-9.8% drop, NZD 79m). However, South Korea bucked this trend with a striking 113% increase in imports to New Zealand, totaling an additional NZD 356m.
ECB’s Knot: Wage growth a missing piece in cooling inflation to target
ECB Governing Council member Klaas Knot expressed confidence in inflation reverting to 2% target in 2025, but pointed out a crucial element that remains uncertain: the alignment of wage growth with this lower inflation expectation.
In an interview with the Dutch TV program Buitenhof on Sunday, Knot noted he "credible prospect" of it returning to the 2% target in 2025. However, "the only piece that's missing is the conviction that wage growth will adapt to that lower inflation".
Knot highlighted the current disparity between wage growth, at 5%, and the desirable rate of around 2.5% for sustainable price stability. He stressed that a gradual shift to this lower wage growth rate is essential for ECB to consider lowering interest rates.
He also anticipated "a couple of years" where wage growth may exceed inflation, "allowing a restoration of purchasing power," However, he assured that this scenario would not hinder the trajectory towards the 2% inflation target.
Nevertheless, he suggested that this scenario wouldn't necessarily impede the achievement of 2% inflation target. He argued that there's sufficient leeway in profit margins to accommodate these higher salaries without triggering a significant secondary surge in prices. However, Knot cautioned that this is a "narrow path," requiring careful navigation.
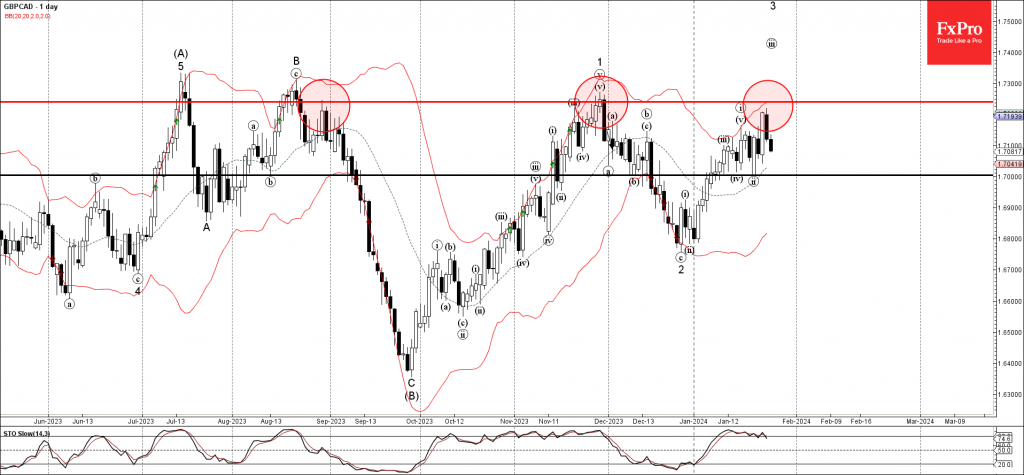
GBPCAD Wave Analysis
- GBPCAD reversed from major resistance level 1.7240
- Likely to fall to support level 1.7000
GBPCAD currency pair recently reversed down from the major resistance level 1.7240 (which has been reversing the price from the end of August).
The downward reversal from the resistance level 1.7240 created eth daily candlesticks reversal pattern Dark Cloud Cover.
Given the strength of the resistance level 1.7240, GBPCAD can be expected to fall further to the next support level 1.7000 (low of the previous correction ii).
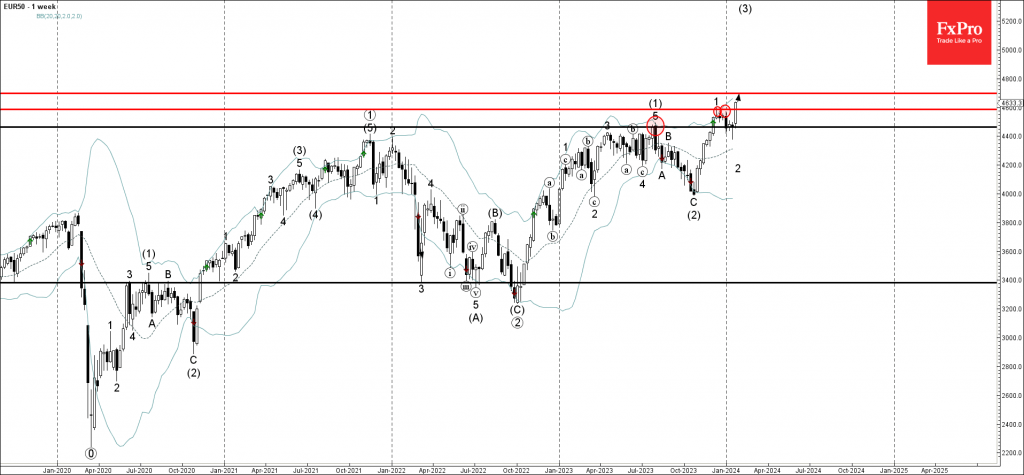
EUR50 index Wave Analysis
- EUR50 index under bullish pressure
- Likely to rise to resistance level 4700.00
EUR50 index is under the bullish pressure now after the price broke above the resistance level 4585.00 (which stopped the previous impulse wave 1 at the end of last year).
The breakout of the resistance level 4585.00 follows the earlier upward reversal from the 4465.00 (former major resistance from 2023, acting as support after it was broken recently).
Given the clear weekly and the daily uptrend, EUR50 index can be expected to rise further to the next resistance level 4700.00.
Forex and Cryptocurrencies Forecast
EUR/USD: US Economy Delivers Surprises
The two most significant events last week occurred on Thursday, January 25. On this day, the European Central Bank (ECB) held a meeting, and preliminary GDP data for the US for Q4 2023 was published.
As expected, the ECB left the key interest rate unchanged at 4.50%. The regulator also maintained other critical parameters of its monetary policy. At the press conference following the meeting, ECB President Christine Lagarde refrained from commenting on potential timelines for rate cuts. She reiterated her previous statements, noting that the ECB Governing Council members believe it is premature to discuss policy easing. However, Lagarde highlighted that wage growth is already declining and added that they anticipate further inflation reduction throughout 2024.
Overall, the first event passed without surprises, unlike the second. The preliminary GDP data for Q4 2023 released by the US Bureau of Economic Analysis showed the expected slowdown in American economic growth compared to the extremely high rates of Q3 (4.9%), reaching 3.3% on an annual basis. However, this was significantly above the market consensus forecast, which anticipated a more substantial slowdown to 2.0%. Thus, it turned out that for the entire year of 2023, the country's economy grew by 2.5% (compared to 1.9% in 2022). The data confirmed the national economy's resilience to the most significant interest rate hike cycle since the 1980s – instead of the expected slowdown, it continues to grow at rates above the historical trend (1.8%).
These impressive results were a surprise for market participants. They look particularly 'stellar' compared to the performance of other currency zones. For instance, Japan's GDP continues to crawl back to pre-COVID-19 pandemic levels, and the Eurozone's GDP seems to have been in a state of stagnation for some time. This benefits the dollar, as a stable economy allows the Federal Reserve to delay the start of monetary policy easing and maintain restrictive measures for a while longer. According to CME futures quotes, the probability of an interest rate cut in March is currently 47%, almost half of what was expected a month ago (88%). Many experts believe the Fed will start gradually reducing the cost of federal fund loans no earlier than May or June, waiting for signs confirming the sustainability of the inflation slowdown.
The US Bureau of Labor Statistics also reported on January 25 that the number of initial unemployment claims for the week ending January 20 rose to 214K, exceeding the previous week's figures and forecasts of 200K. Despite the slight increase, the actual value still represents one of the lowest levels since the end of last year.
As mentioned earlier, the economic situation in the Eurozone appears significantly worse, exacerbated by Russia's military actions in Ukraine and the downturn of China's economy, an important partner for Europe. Against this backdrop, the ECB may become the most hasty among the G10 central banks to start reducing interest rates. Such a step would exert strong pressure on the common European currency, placing the euro at a disadvantage in the Carry-trade segment. Additionally, the advantages of the dollar as a safe-haven currency should not be overlooked.
The dollar index DXY found strong support at the 100.00 level at the end of last year, rebounded upwards, and has been consolidating around 103.00 for the past week, seemingly 'sticking' to its 200-day moving average. Market participants are awaiting the Federal Open Market Committee (FOMC) meeting of the US Federal Reserve, scheduled for Wednesday, January 31, amidst strong GDP data and convincing evidence of disinflation. It is likely that, as with the ECB, the interest rate will remain at the current level (5.50%). Moreover, Federal Reserve Chair Jerome Powell's remarks, similar to the ECB's, are expected to be cautious regarding the timelines for rate cuts. However, his more favourable tone regarding inflation reduction may be enough to restore market confidence in the beginning of monetary policy easing as early as March. In this case, DXY could resume its movement towards 100.00. Otherwise, a renewal of the December peak of 104.28 seems quite plausible.
Data on personal consumption expenditures in the US were released at the very end of the workweek, on Friday, January 26. The Core Personal Consumption Expenditures (PCE) Price Index showed a monthly increase from 0.1% to 0.2%, which fully matched forecasts. Year-on-year, the index stood at 2.9%, lower than both the previous value (3.2%) and the forecast (3.0%).
These figures did not significantly impact the exchange rates, and EUR/USD closed the week at 1.0854. Currently, the majority of experts predict the strengthening of the US dollar in the near future. Among them, 80% voted for the dollar's appreciation, 0% sided with the euro, and the remaining 20% held a neutral position. However, in the monthly perspective, the balance of power between bullish (red), bearish (green), and neutral (grey) is evenly distributed: a third for each. Oscillator readings on the D1 timeframe confirm the analysts' forecast: 100% of them are coloured red (15% indicating oversold conditions). Among trend indicators, the balance of power is 65% in favour of the reds and 35% for the greens. The nearest support levels for the pair are located in the zones 1.0800-1.0820, followed by 1.0725-1.0740, 1.0620-1.0640, 1.0500-1.0515, and 1.0450. The bulls will encounter resistance in the areas of 1.0905-1.0925, 1.0985-1.1015, 1.1110-1.1140, 1.1230-1.1275, 1.1350, and 1.1475.
In the upcoming week, in addition to the aforementioned FOMC meeting and subsequent press conference, we are expecting the release of Q4 GDP data for Germany and the Eurozone on Tuesday, January 30. On Wednesday, we will see the retail sales volumes and the Consumer Price Index (CPI) in Germany, as well as the state of employment in the US private sector from ADP. On Thursday, February 1, inflation data (CPI) for the Eurozone and business activity in the US manufacturing sector (PMI) will be published. Additionally, on February 1 and 2, we will traditionally receive a wealth of statistics from the US labor market, including the unemployment rate and the number of new jobs created outside of the agricultural sector (Non-Farm Payrolls, NFP).
GBP/USD: Inflation Continues to Bolster the Pound
The retail sales report released on January 19 in the United Kingdom turned out to be disappointing. Retail sales volumes in December decreased by -3.2% following a 1.4% increase in the previous month, while analysts had expected a -0.5% drop. Year-on-year, this indicator declined by -2.4% after increasing by 0.2% a month earlier (forecast was -1.1%). Sales excluding fuel dropped by -3.3% month-on-month and -2.1% year-on-year, against expert forecasts of -0.6% and -1.3%, respectively.
However, despite this, GBP/USD not only maintains its position within the six-week lateral channel of 1.2600-1.2800 but is even seeking to consolidate in its upper half. Analysts believe that the British currency continues to be supported by expectations that the Bank of England (BoE) will likely be among the last to lower rates this year.
It's worth recalling that the December inflation data showed the Consumer Price Index (CPI) in the United Kingdom rose month-on-month from -0.2% to 0.4% (consensus forecast was 0.2%), and year-on-year reached 4.0% (compared to the previous value of 3.9% and expectations of 3.8%). The core CPI figure remained at the previous level of 5.1% year-on-year. Following the release of this report, which showed rising inflation, UK Prime Minister Rishi Sunak quickly sought to reassure the markets. He stated that the government's economic plan remains sound and continues to work, having reduced inflation from 11% to 4%. However, despite the Prime Minister's optimistic statement, many market participants are now more convinced that the Bank of England will delay the start of easing its monetary policy until the end of the year. "Concerns that the disinflation process may stall have probably increased," Commerzbank economists wrote at the time. "And the market will likely bet that the Bank of England will respond accordingly and, therefore, be more cautious about the timing of the first interest rate cut."
The British currency was also bolstered by preliminary data on business activity in the country, released on Wednesday, January 24. The Manufacturing PMI rose from 46.2 to 47.3, against a forecast of 46.7. Furthermore, the Services PMI and the Composite PMI firmly established themselves in the growth zone (above 50 points). The Services PMI increased from 53.4 to 53.8 (forecast was 53.2), and the Composite PMI went up from 52.1 to 52.5 (forecast was 52.2). From these figures, the market inferred that the country's economy could withstand high interest rates for an extended period.
GBP/USD concluded the previous week at a level of 1.2701. Regarding the analysts' forecasts for the coming days, the sentiment is similar to that for EUR/USD: 70% voted for the pair's decline, only 10% were in favor of its rise, and 20% preferred to remain neutral. The outlook for the monthly and longer-term horizon is more ambiguous. Among the trend indicators on the D1 timeframe, in contrast to the specialists' opinions, there's a clear preference for the British currency: 80% indicate a rise in the pair, while 20% suggest a decline. Among oscillators, 35% are in favour of the pound, 10% for the dollar, and the remaining 55% maintain a neutral stance. Should the pair move southward, support levels and zones at 1.2595-1.2610, 1.2500-1.2515, 1.2450, 1.2330, 1.2210, 1.2070-1.2085 await it. In case of an upward movement, the pair will encounter resistance at levels 1.2750-1.2765, 1.2785-1.2820, 1.2940, 1.3000, and 1.3140-1.3150.
In addition to the FOMC meeting of the US Federal Reserve, we will also have a meeting of the Bank of England in the upcoming week. It is scheduled for Thursday, February 1st, and according to forecasts, the BoE is also expected to keep the borrowing rate at the current level of 5.25%. Besides this, no other significant events related to the economy of the United Kingdom are anticipated in the near future.
USD/JPY: Does the Drift Towards 150.00 Continue?
The Consumer Price Index (CPI) in the Tokyo region unexpectedly dropped from 2.4% to 1.6% in January, and the figure excluding food and energy prices decreased from 3.5% to 3.1%. Such a significant weakening of inflationary pressure could lead the Bank of Japan (BoJ) to refrain from tightening monetary policy in the foreseeable future.
This forecast is also supported by the monthly economic report of the Japanese government, published on Thursday, January 25. The report states that the consequences of the strong earthquake on the Noto Peninsula in central Honshu, Japan's main island, could reduce the national GDP by 0.5%. These estimates increase the likelihood that the Bank of Japan will maintain its ultra-loose monetary policy at least until mid-2024. Consequently, any speculation about an interest rate hike in April can be disregarded.
The minutes from the Bank of Japan's December meeting reinforce this outlook. It was noted that the Board members agreed that "it is necessary to patiently maintain an accommodative policy." Many members (another quote) "stated that it is necessary to confirm a positive wage-inflation cycle to consider the issue of phasing out negative rates and YCC." "Several members said they do not see the risk of the Central Bank falling behind schedule and can wait for developments at the annual wage negotiations this spring." And so on in the same vein.
Economists at MUFG Bank in Japan believe that the current situation does not hinder the selling of the yen. "Given our view on the strengthening of the US dollar in the near term and the more significant-than-expected drop in inflation data [in Japan]," they write, "we may see an increase in the appetite for Carry-trade positions funded by the yen, which will contribute to the further rise of USD/JPY." MUFG strategists opine that the pair will continue its drift northward, towards 150.00. However, as it approaches this level, the threat of currency interventions by Japanese financial authorities is expected to gradually increase.
In the interest of fairness, it should be noted that there are still those who believe in an imminent shift by the BoJ to a tighter policy. For instance, specialists at the Dutch Rabobank still adhere to a forecast suggesting the regulator could raise rates as early as April. "However," the bank's experts write, "everything will depend on strong wage data from the spring negotiations and evidence of changes in corporate behaviour regarding wages and pricing." "Our forecast, which sees USD/JPY ending the year at 135.00, assumes that the Bank of Japan will raise rates this year," continue the Rabobank economists. However, they add that there is still a possibility of disappointment in the pace of rate hikes.
USD/JPY recorded its peak for the past week at 148.69, finishing slightly lower at 148.11. In the near-term outlook, 30% of experts anticipate further strengthening of the dollar, 30% side with the yen, and 40% hold a neutral position. Regarding the trend indicators and oscillators on the D1 timeframe, all 100% point north, though 10% of them are in the overbought zone. The nearest support level is located in the 146.65-146.85 zone, followed by 146.00, 145.30, 143.40-143.65, 142.20, 141.50, and 140.25-140.60. Resistance levels are positioned at 148.55-148.80, 149.85-150.00, 150.80, and 151.70-151.90.
No significant events related to the Japanese economy are anticipated in the upcoming week.
CRYPTOCURRENCIES: Why Bitcoin Fell
On January 10, the U.S. Securities and Exchange Commission (SEC) approved a batch of all 11 applications from investment companies to launch spot exchange-traded funds (ETFs) based on bitcoin. Against this backdrop, the quotations of the main cryptocurrency momentarily spiked to $47,787, a level last seen in the spring of 2022. However, instead of the expected growth, bitcoin then tumbled and recorded a local minimum of $38,540 on January 23. Thus, in just 12 days, the cryptocurrency lost nearly 20% of its value. According to several specialists, this is a classic case of the "buy the rumour, sell the news" scenario. Initially, there was a significant bull rally fueled by speculations about the launch of bitcoin-based ETFs. Now that these funds are operational, market participants have begun actively taking profits.
However, there are other reasons for the decline, reflected in specific figures. The capital inflow into BTC-ETFs, many of which were launched by major Wall Street players like BlackRock, turned out to be smaller than expected. It appears that investors have become disillusioned with cryptocurrency. According to CoinShares, the 10 new funds had gathered $4.7 billion by the end of Tuesday. Meanwhile, $3.4 billion flowed out of the Grayscale trust, which was considered the world's largest bitcoin holder and has now also been transformed into a BTC-ETF. Logic suggests that a significant portion of the funds likely just shifted from Grayscale investors to the 10 new funds with lower fees. If this is the case, then the net new investment inflow is just $1.3 billion. Moreover, in recent days, this has turned into a net outflow of $25 million.
It's also important to note that since the approval of BTC-ETFs, along with short-term speculators and Grayscale investors, the sell-off has been influenced by the bankruptcy manager of the FTX crypto exchange and especially by miners. Together, they have unloaded $20 billion worth of coins on the market, a large portion of which belongs to the miners. They are particularly concerned about the increasing computational difficulty and the halving in April, which will force many of them out of business. As a result, since January 10, miners have sent a record 355,000 BTC worth $15 billion to crypto exchanges, the highest in six years. In these circumstances, the demand for a spot bitcoin ETF of $4.7 billion (or realistically $1.3 billion) seems modest and unable to compensate for the resulting outflow of funds. Hence, we are witnessing such a significant drop in the price of the main digital asset.
Along with bitcoin, major altcoins, including Ethereum (ETH), Solana (SOL), Cardano (ADA), Avalanche (AVAX), Dogecoin (DOGE), Binance Coin (BNB), and others, also incurred losses. Analysts believe that the improvement in the stock markets has also exerted additional pressure on cryptocurrencies – over the last three weeks, both American and European indices have shown growth.
Peter Schiff, the president of Euro Pacific Capital, did not miss the opportunity to gloat over the buyers of bitcoin ETF shares. He believes that the approval of these funds does not create new demand for cryptocurrency. According to the financier, those investors who previously bought cryptocurrency on the spot market or invested in shares of mining companies and Coinbase are now merely shifting their investments to ETFs. "Shuffling deck chairs won't save the ship from sinking," predicted this advocate of physical gold.
Schiff thinks that the fate of investors in the spot product will be similar to those who invested in the futures ETF BITO, launched in the fall of 2021. Currently, shares of this fund are trading at a 50% discount, implying that bitcoin is also expected to fall to around $25,000. Since January 10, 2024, the share price of BTC-ETFs has already fallen by 20% or more from their peak. The shares of FBTC suffered the most, decreasing in value by 32% in two weeks. "I think VanEck should change the ticker of its ETF from HODL to GTFO [from 'hold' to 'get the heck out']," Schiff sarcastically commented on the situation.
Caroline Mauron, head of OrBit Markets, told Bloomberg that if bitcoin fails to firmly establish itself above $40,000 soon, it could trigger a massive liquidation of positions in the futures market, accompanied by a panic outflow of capital from the crypto sphere.
An analyst using the pseudonym Ali illustrated the price patterns of the last two cycles and, like Caroline Mauron, suggested a further decline in the coin's value. The expert noted that in previous rallies, bitcoin followed a consistent pattern: first reaching the 78.6% Fibonacci level and then correcting to 50%. Thus, according to this model, a drop in the BTC/USD pair to $32,700 (50%) is not ruled out.
Trader Mikeystrades also allowed for a drop to $31,000 and advised against opening long positions. "Save your money until the market begins to demonstrate bullish strength and follows the flow of orders," the expert recommended.
A crypto trader known as EliZ predicted a fall in the bitcoin price to $30,000. "I expect a bearish distribution over the next two to three months, but the second half of 2024 will be truly bullish. These stops are necessary to keep the market in a healthy state," he stated.
Michael Van De Poppe, founder of MN Trading, holds a different view. He emphasized that bitcoin has already collected liquidity and is approaching a local bottom. "Buy at the lows. Bitcoin below $40,000 is an opportunity," the analyst urged. Yann Allemann, co-founder of Glassnode, believes that a bullish rally in the bitcoin market will start in the first half of 2024, with the coin's value increasing to $120,000 by early July. This forecast is based on the dynamics of the asset's value changes in the past after the appearance of a bullish flag pattern on the chart.
Indeed, negative scenarios should not be ignored. However, it's important to consider that current pressures are largely due to temporary factors, while long-term trends continue to favor digital gold. For instance, since the fall of 2021, there has been an increase in the proportion of coins that have remained inactive for over a year. This indicator is now showing a record 70%. An increasing number of people are trusting bitcoin as a tool for inflation protection and savings. The number of cryptocurrency users has reached over half a billion people, about 6% of the Earth's population. According to recent data, the number of Ethereum holders has grown from 89 million to 124 million, while the number of bitcoin owners by the end of the year increased from 222 million to 296 million people.
There is also growing acceptance of this new type of asset among large capital representatives. Last week, Morgan Stanley published a document titled "Digital (De)Dollarization?", authored by the investment bank's COO Andrew Peel. According to the author, there is a clear shift towards reducing dependency on the dollar, simultaneously fuelling interest in digital currencies such as bitcoins, stablecoins, and CBDCs. Peel writes that the recent surge in interest in these assets could significantly alter the currency landscape. According to a recent Sygnum Bank survey, over 80% of institutional investors believe that cryptocurrencies already play an important role in the global financial industry.
As of the evening of January 26, when this review was written, BTC/USD is trading around $42,000. The total market capitalization of the crypto market stands at $1.61 trillion, down from $1.64 trillion a week ago. The Bitcoin Fear & Greed Index remains in the Neutral zone at 49 points, slightly down from 51 a week earlier.
A Week of Contrasts: US Resilience, Hawkish BoJ, ECB Cut Speculations, China’s Reversal
The past week in the financial markets was a blend of the anticipated and the unforeseen, creating a cloud of indecision among traders. Central bank decisions by ECB, BoC, and BoJ unfolded largely as anticipated. But BoJ's slightly hawkish communication provided a temporary lift to Yen. Despite ECB President's cautious stance, traders continued to bet heavily on an imminent ECB rate cut, pressuring Euro.
In US, surprisingly robust economic data sent mixed signals, presenting a conundrum for investors torn between celebrating the economy's resilience and fretting over potential delays in Fed's rate cut cycle.
The most unexpected twist from China, with sudden intervention to revive its faltering stock markets. This move, however, did not significantly bolster the Australian and New Zealand Dollars as one might have expected.
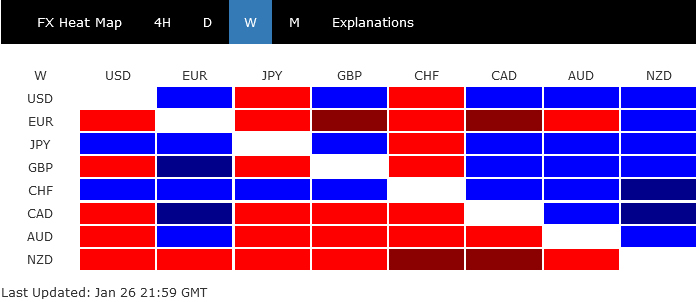
By the week's end, Swiss Franc emerged as the strongest currency, largely due to renewed bets against Euro in anticipation of ECB rate cuts. Yen followed as the second strongest, with Dollar also showing strength. Conversely, New Zealand Dollar lagged as the weakest, trailed by Euro and Australian Dollar. Canadian Dollar also leaned towards the weaker side, while Sterling was mixed.
Yet, it's crucial to underscore that the majority of major pairs and crosses concluded the week within the bounds of the previous week's range, suggesting that the market predominantly remained in a consolidation phase amidst these various developments.
ECB, BoC, BoJ maintained status quo with varied market reactions
Last week, three major central banks – ECB, BoC and BoJ – unanimously decided to keep their monetary policies unchanged, a move that was largely anticipated by market observers. However, the reaction in the forex markets has varied, reflecting different interpretations of each bank's communication and future policy directions.
ECB's cautious tone against premature rate cut speculation was met with skepticism by traders, who are increasingly betting on an early rate cut, thereby exerting downward pressure on the Euro. Contrary to ECB, BoJ provided a slightly hawkish surprise, which has contributed to a brief lift in Yen. Canadian Dollar showcased resilience, buoyed by market expectations that the BoC is likely to initiate rate cuts later than ECB.
Despite ECB President Christine Lagarde's efforts to temper expectations for early interest rate cuts, market traders appear to be unmoved. The likelihood of an ECB rate cut as soon as April is now being priced in at around an 80% chance, indicating a strong market sentiment that diverges significantly from Lagarde's cautionary stance.
Traders' aggressive positioning for an April rate cut comes even as some economists continue to advocate for a more conservative forecast, suggesting that June could be a more probable timeline for ECB's first rate move. However, the anticipation for April meeting is palpable, as it's increasingly perceived as a "live" session.
This growing anticipation hinges on the possibility of ECB needing to downgrade its inflation projections downwards, if inflation data consistently come in lower than expectations.
BoC has marked a notable shift in its monetary policy approach by dropping its tightening bias, as indicated by Governor Tiff Macklem's recent remarks. He stated that no further tightening would be necessary, provided their economic forecasts align with expectations.
However, it's important to note that this doesn't necessarily signal imminent rate cuts. Opinions among market analysts and economists remains divided regarding the timing of the BoC's first rate reduction. While June is currently viewed as the most probable month for the initiation of rate cuts, the situation remains fluid.
A critical factor that could accelerate BoC's decision to lower rates is the performance of growth data. Should this data come in weaker than expected, it might compel the central bank to move ahead with rate cuts earlier than currently anticipated.
BoJ's meeting was marked by a slight hawkish surprise from Governor Kazuo Ueda, even though he refrained from providing any explicit clues about exit from negative interest rates within the year.
At the post-meeting press conference, Ueda acknowledged the gradually increasing likelihood of Japan achieving a sustainable 2% inflation target, specifically noting the consistent rise in service prices as an indicator of this trend. He also mentioned BoJ need not delay its decision for examining this year's wage negotiations in full. At the same time, the cautious tone regarding the danger of premature exit was dropped.
Reactions in swap markets was immediate and significant. Probability of a 10 bps rate hike by BoJ in April has surged to over 70%, a substantial increase from 40% chance estimated just last week.
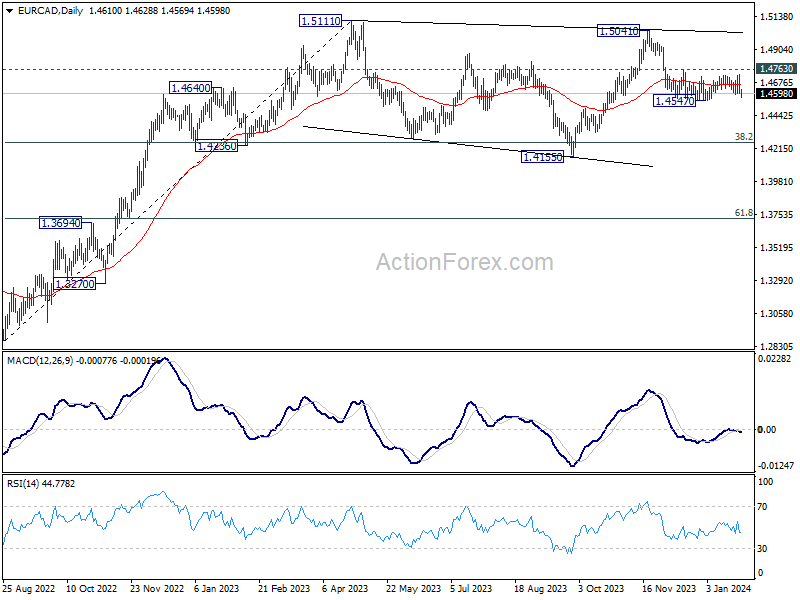
Looking at the performance of their crosses, EUR/CAD dipped mildly to end the week, but stayed above 1.4547 support. With 1.4763 resistance intact, fall from 1.5041 is still in favor to continued. Break of 1.4547 will resume the decline, which is seen as the third leg of the consolidation pattern from 1.5111. Next target will be 38.2% retracement of 1.2867 to 1.5111 at 1.4254.
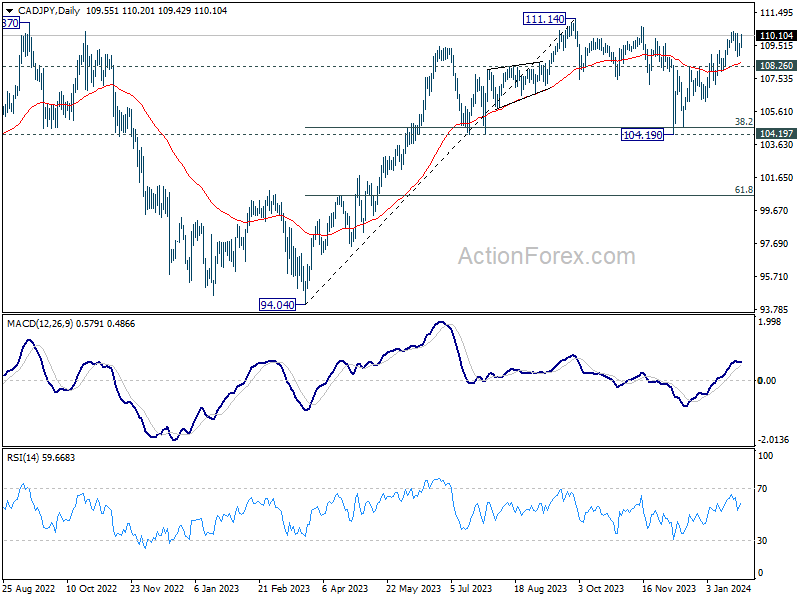
CAD/JPY rebounded strongly after brief dip to 108.87. Rise from 104.19 is still expected to continue to retest 111.14 high. However, it should be noted that the structure of this rise is currently more corrective looking than impulsive. Thus, it could just be the second leg of the consolidation pattern from 111.14. Rejection by 111.14, followed by sustained break of108.26 support, will start the third leg back to 104.19 cluster support (38.2% retracement of 94.04 to 111.14 at 104.60).
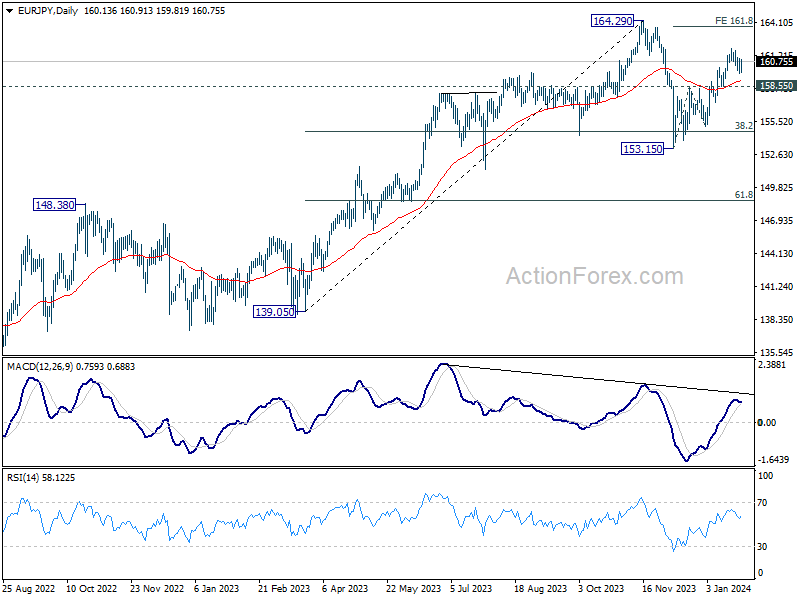
While EUR/JPY extended the retreat from 161.84, it's holding above 158.55 resistance turned support so far. Further rise is in favor towards 164.29 resistance. But similar to CAD/JPY's outlook, the rise from 153.15 could be the second leg of the consolidation pattern from 164.29 only. Rejection by this high, followed by break of 158.55 support, will start the third leg to 153.15 support.
China's stock market rebounded on PBoC's RRR cut and rumored state intervention
There was significant turnaround for Chinese and Hong Kong stock markets during the week. Both Shanghai SSE and HSI, which had been on a downward trajectory for much of this year, staged a significant rebound. This turnaround can be attributed to a series of surprise moves aimed at bolstering market confidence.
PBoC announced to cut reserve requirement ratio by 50bps, a decision that is expected to inject nearly USD 140B in long-term capital into the economy. This move has been interpreted as a direct effort by the central bank to support market liquidity and confidence.
In the background, Bloomberg reported that the Chinese authorities are considering instructing state-owned enterprises to invest funds from their offshore accounts in purchasing shares. The reported sum amounts to as much as USD 282B, a substantial intervention aimed at stabilizing the stock markets.
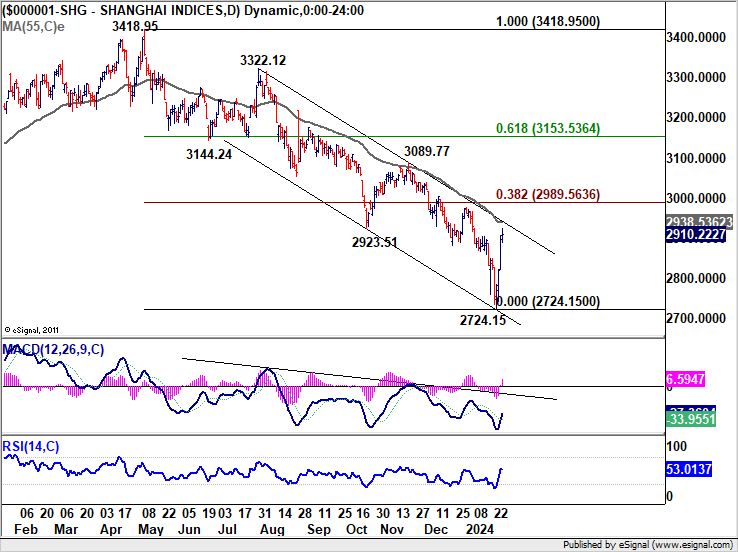
Shanghai SSE staged a strong rebound to close at 2910.22, after initial dive to 2724.15. Technically, this suggests that downtrend from 3418.95 might have concluded with a five-wave decline. The focus now shifts to 3000 psychological level, which is close to 38.2% retracement of 3418.95 to 2724.15 at 2989.56
The key resistance near 3000 will be critical to watch. Rejection at this level would maintain medium-term bearishness, leading to another fall through 2724.15 later on. Conversely, firm break of 3000 should bring stronger rally to 3089.77 resistance, or further to 61.8% retracement at 3151.53, even as a corrective move.
A tug-of-war between economic resilience and Fed cut uncertainties
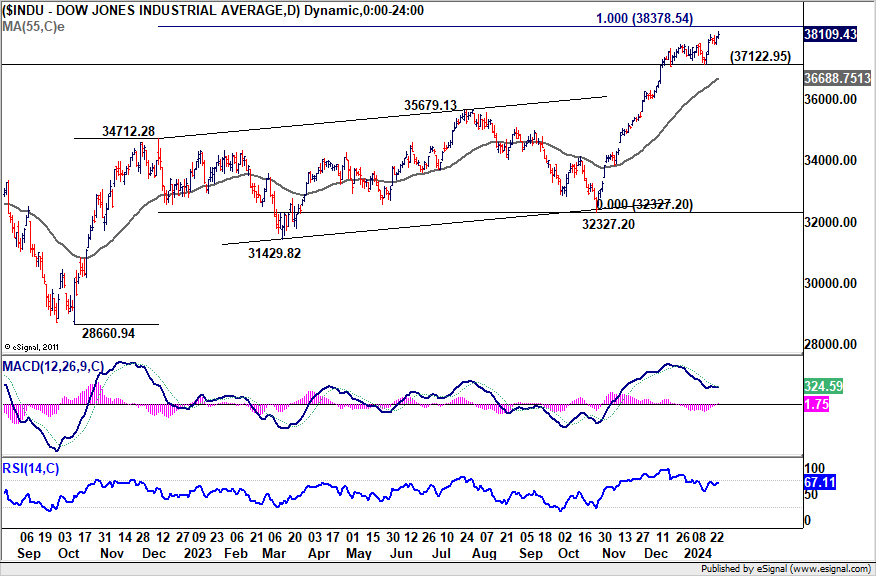
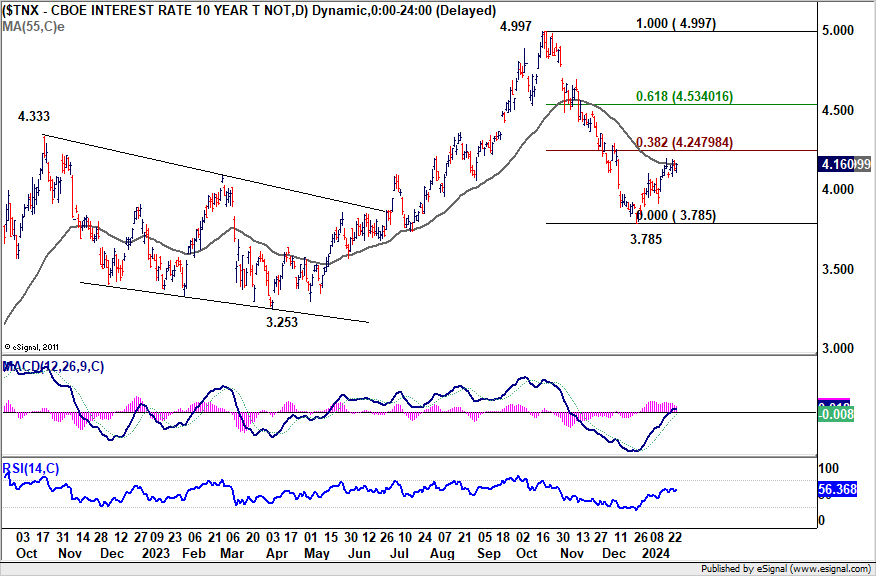
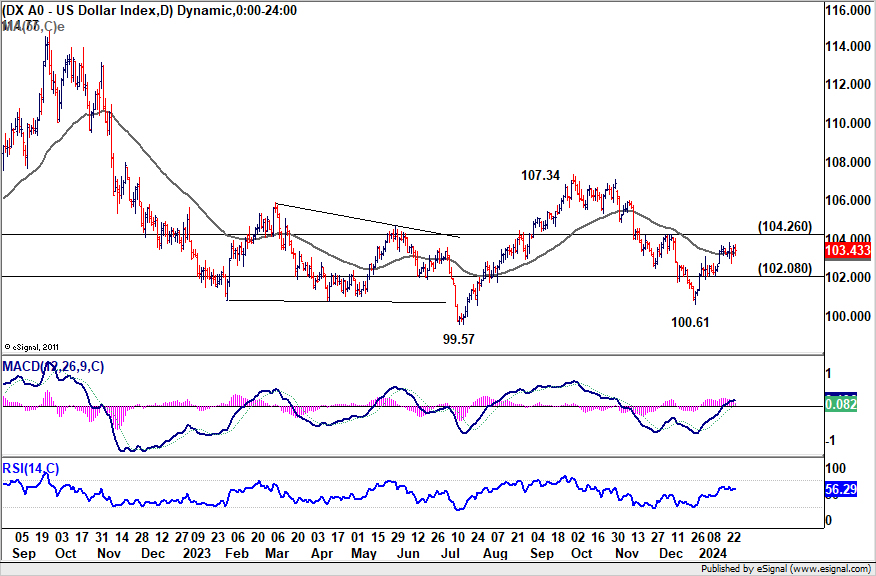
The current state of US financial markets reflects a dynamic tug-of-war or encouraging signs of economic resilience and cautious on delayed Fed rate cuts. On one hand, DOW continues its up trend, hitting yet another record high, signaling robust market confidence. However, this ascent is accompanied by signs of waning momentum, suggesting that investors are cautiously weighing their options. This cautious sentiment extends to 10-year yield and Dollar index, both of which have been fluctuating within a tight range.
The ambiguity in the market's direction is further evidenced by the fluctuating predictions regarding a March Fed rate cut, flip-flopping around 50% likelihood as indicated by fed fund futures. The robustness of the US economy, especially in the consumer sector, suggests a challenging "last mile" to lowering core inflation to Fed's 2% target. This economic resilience could prompt Fed to maintain a vigilant stance, potentially delaying any rate cuts.
The possibility of a pullback in the stock market and a shift in risk sentiment looms if market participants start doubting the imminence of Fed rate cut, even delayed to Q2. Such a scenario could bolster Dollar, as investors recalibrate their expectations in light of the prevailing economic conditions and Fed's policy outlook.
Technically, DOW continued to lose upside momentum as seen in D MACD. While further rally could still be seen, 100% projection of 28660.94 to 34712.28 from 32327.20 at 38378.54 might give strong resistance to trigger a correction. Break of 37122.95 will start the correction phase for 55 D EMA (now at 36688.75) and below.
10-year yield struggled in tight range around 55 EMA (now at 4.160). Strong resistance is still expected from 38.2% retracement of 4.997 to 3.785 at 4.247 to complete the rebound from 3.785. Firm break of 4% handle will indicate the rebound is over, and bring retest of 3.785 low.
Dollar index also struggled in tight range around 55 D EMA (now at 103.28). At this point, the favored case is still that rise from 100.61 is the third leg of the consolidation pattern from 99.57. Break of 104.26 resistance will strength this bullish case and target 107.334 next. However, break of 102.08 will argue that the rebound is over and bring another fall to 100.61, and possibly below.
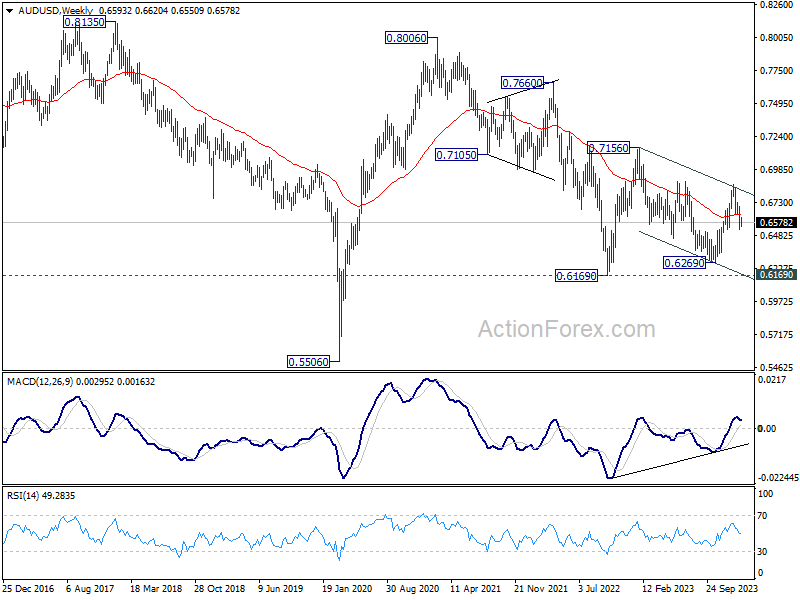
AUD/USD Weekly Report
AUD/USD stayed in consolidation above 0.6524 last week and outlook is unchanged. Initial bias remains neutral this week and further fall is expected. On the downside, firm break of 0.6524 support will argue that whole rebound from 0.6269 has completed, and bring deeper fall to this support. On the upside, break of 0.6639 will turn bias back to the upside for stronger rebound.
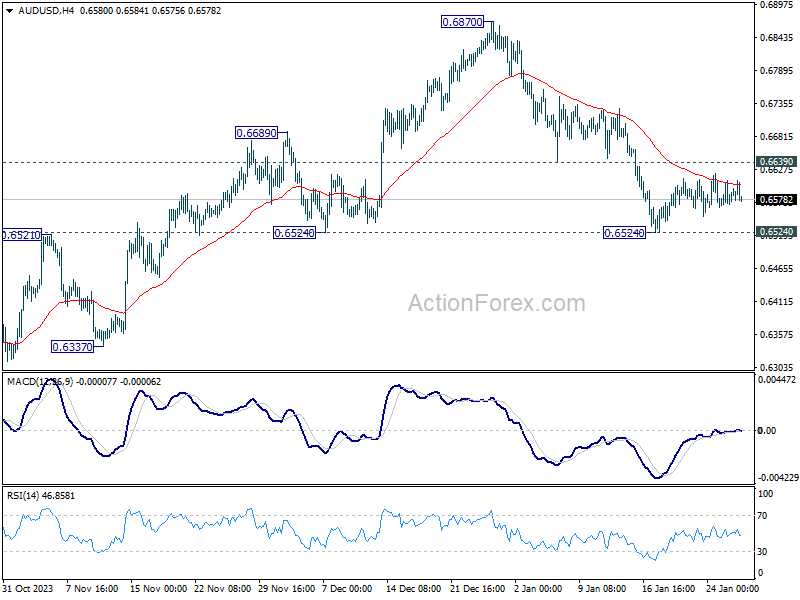
In the bigger picture, price actions from 0.6169 (2022 low) are seen as a medium term corrective pattern to the down trend from 0.8006 (2021 high). Sideway trading could continue in range of 0.6169/7156 for some more time. But as long as 0.7156 holds, an eventual downside breakout would be mildly in favor.
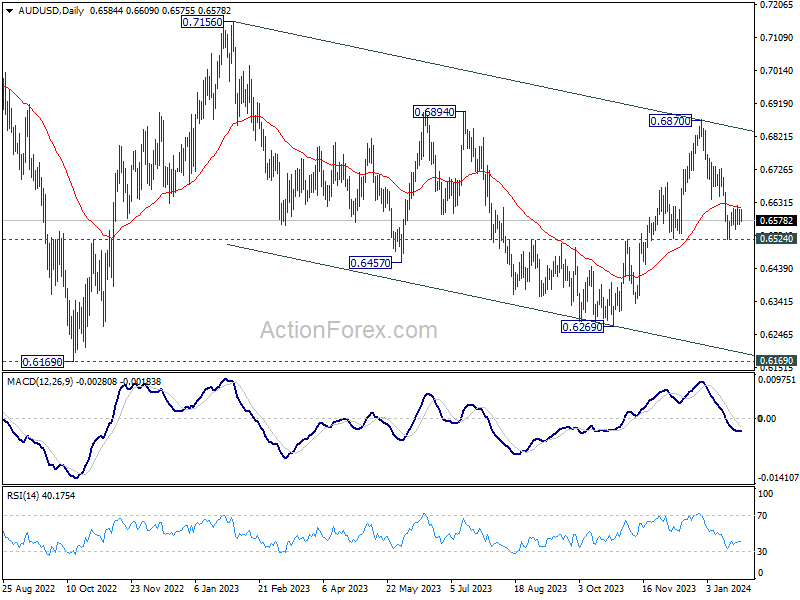
In the long term picture, the down trend from 1.1079 (2011 high) should have completed at 0.5506 (2020 low) already. It's unsure yet whether price actions from 0.5506 are developing into a corrective pattern, or trend reversal. But in either case, fall from 0.8006 is seen the second leg of the pattern. Hence, in case of deeper decline, downside strong support should emerge above 0.5506 to bring reversal.

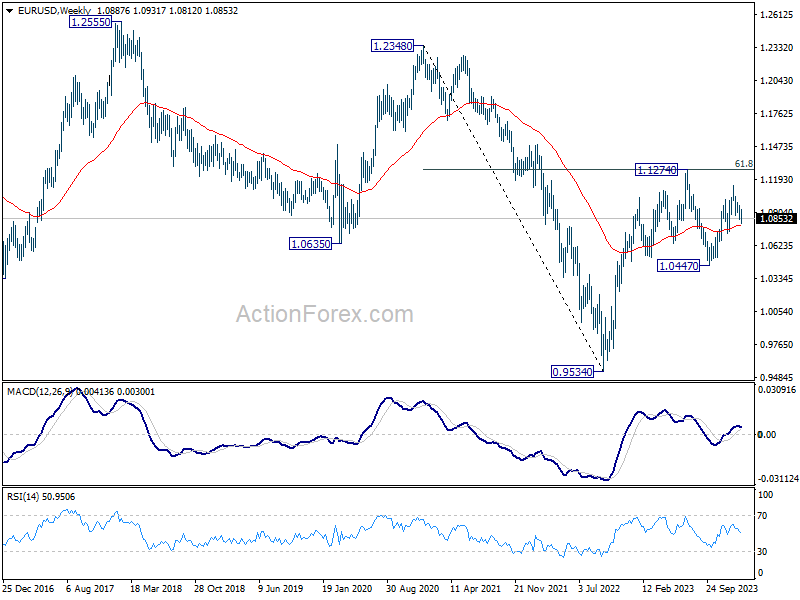
EUR/USD Weekly Outlook
EUR/USD edged lower to 1.0812 last week but quickly recovered. Initial bias remains neutral this week first. Further decline is mildly in favor as long as 1.0931 resistance holds. On the downside, break of 1.0812 will resume the fall from 1.1138 to 1.0722 support. On the upside, above 1.0931 will turn bias to the upside for stronger rebound towards 1.1138 resistance.
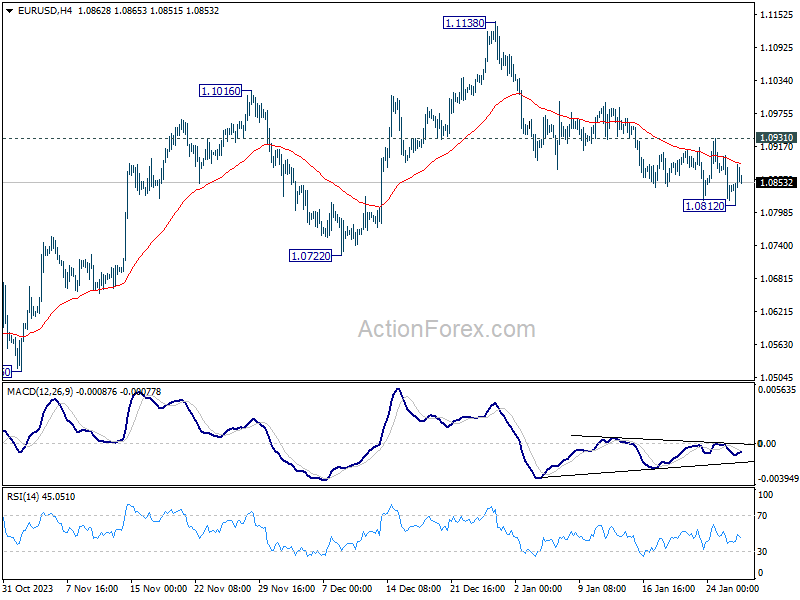
In the bigger picture, price actions from 1.1274 are viewed as a corrective pattern to rise from 0.9534 (2022 low). Rise from 1.0447 is seen as the second leg. While further rally could cannot be ruled out, upside should be limited by 1.1274 to bring the third leg of the pattern. Meanwhile, sustained break of 1.0722 support will argue that the third leg has already started for 1.0447 and below.
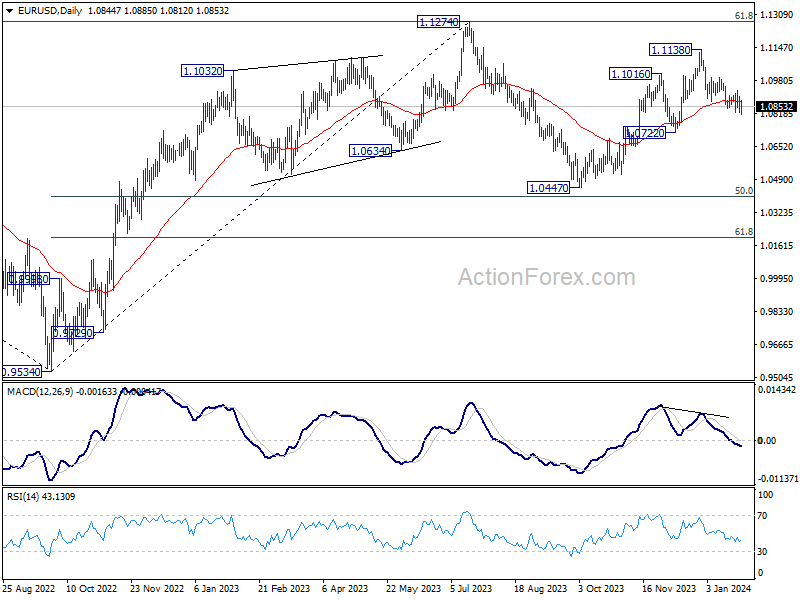
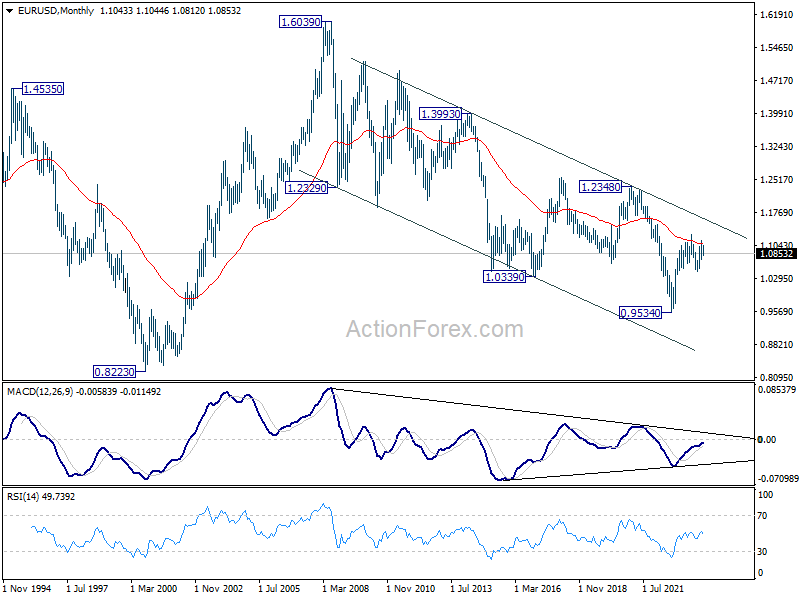
In the long term picture, a long term bottom is in place at 0.9534 on bullish convergence condition in M MACD. It's still early to call for bullish trend reversal with the pair staying inside falling channel in the monthly chart. Nevertheless, sustained trading above 55 M EMA (now at 1.1078) and break of 1.1274 resistance will raise the chance of reversal and target 1.2348 resistance for confirmation.