
Sample Category Title
Euro Drifting Ahead of German CPI
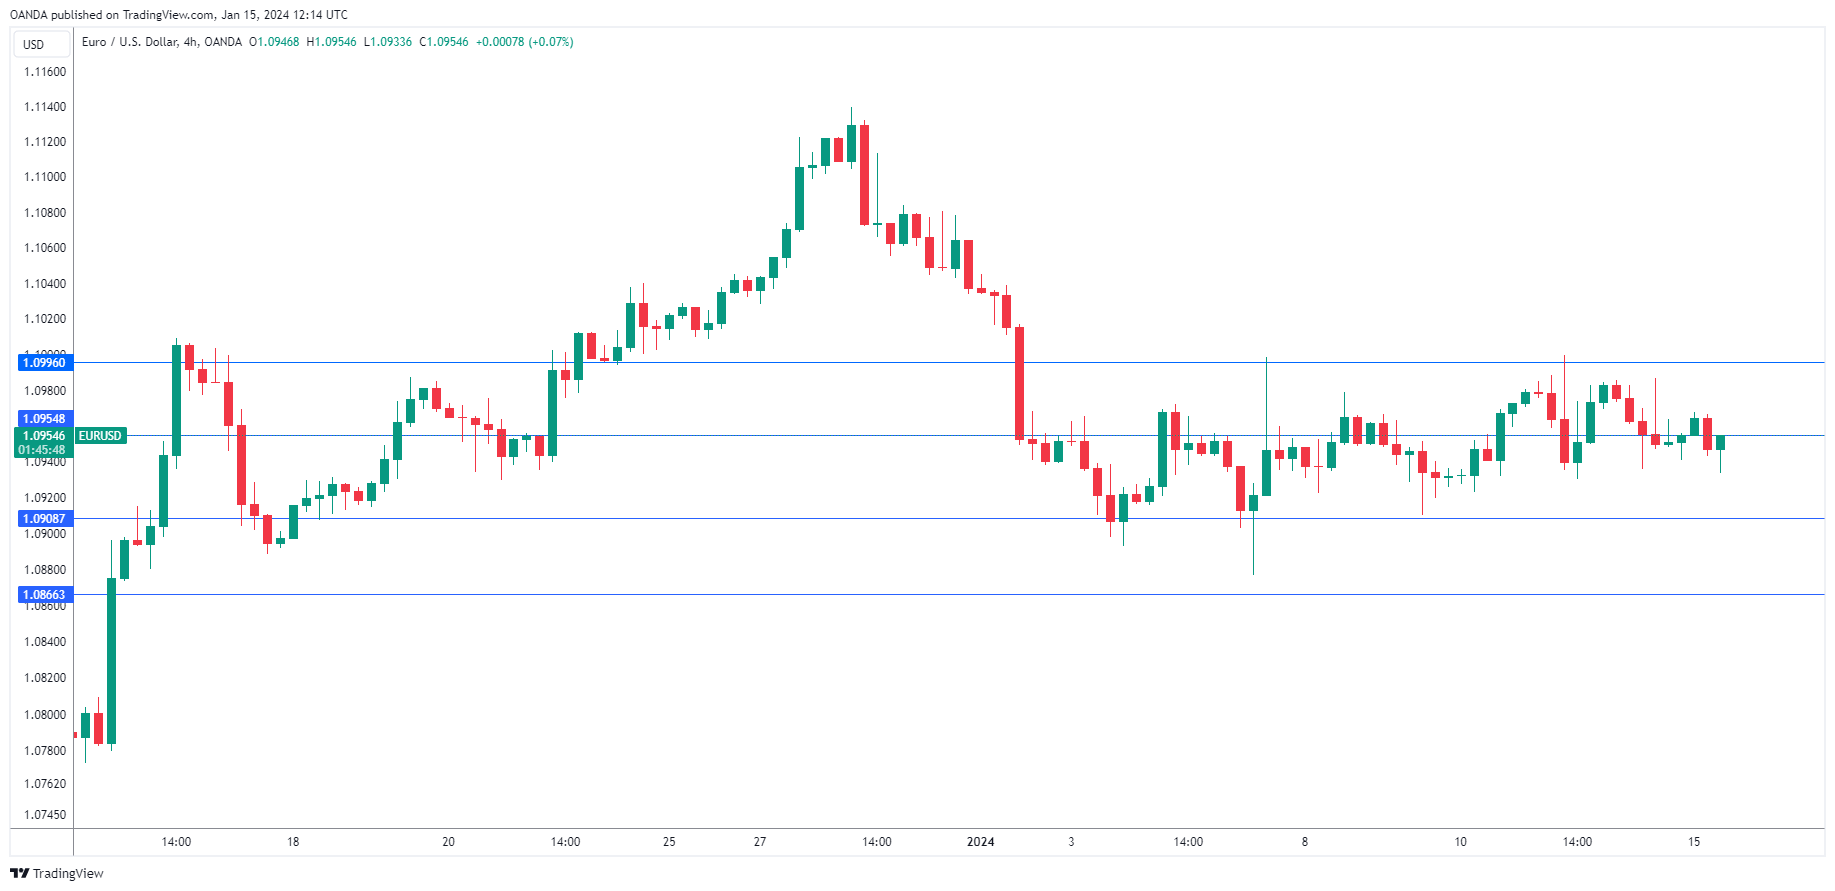
The euro is showing limited movement on Monday. In the European session, EUR/USD is trading at 1.0948, down 0.02%.
German inflation is on the rise
Germany’s inflation rate climbed to 3.7% y/y in December, up from 3.2% in November, which was a two-year low. We’ll get the final estimate on Tuesday. The main contributor to the upswing was a base effect due to a one-time government subsidy for energy expenses in December 2022. The subsidy cooled inflation in December 2022 and resulted in the upswing in December 2023. Core inflation, which excludes energy and food prices, rose 4.5% y/y in the preliminary estimate, down sharply from 5.5% in November. The eurozone releases final CPI for November on Wednesday.
ECB policy makers can point to impressive progress in the battle to bring down inflation. In November, CPI fell to 2.4%, down sharply from 2.9% in October. A year ago, inflation was running at a clip of 10.1%. With inflation closing in on the 2% target, the burning question is the timing of rate cuts. The markets have priced in a first rate cut as early as March but the ECB, unlike the Federal Reserve, isn’t jumping on the rate-cut bandwagon just yet.
ECB Chief Economist Philip Lane said on Friday that lowering rates would not be high on the ECB’s agenda until the ECB was convinced that “we are firmly on our way back to 2% inflation”. This stance echoed comments from ECB President Lagarde a day earlier. Lane had a warning for the markets, saying that cutting rates too fast could trigger higher inflation. The markets have priced in at least 150 basis points in cuts and expect the first cut in March.
EUR/USD Technical
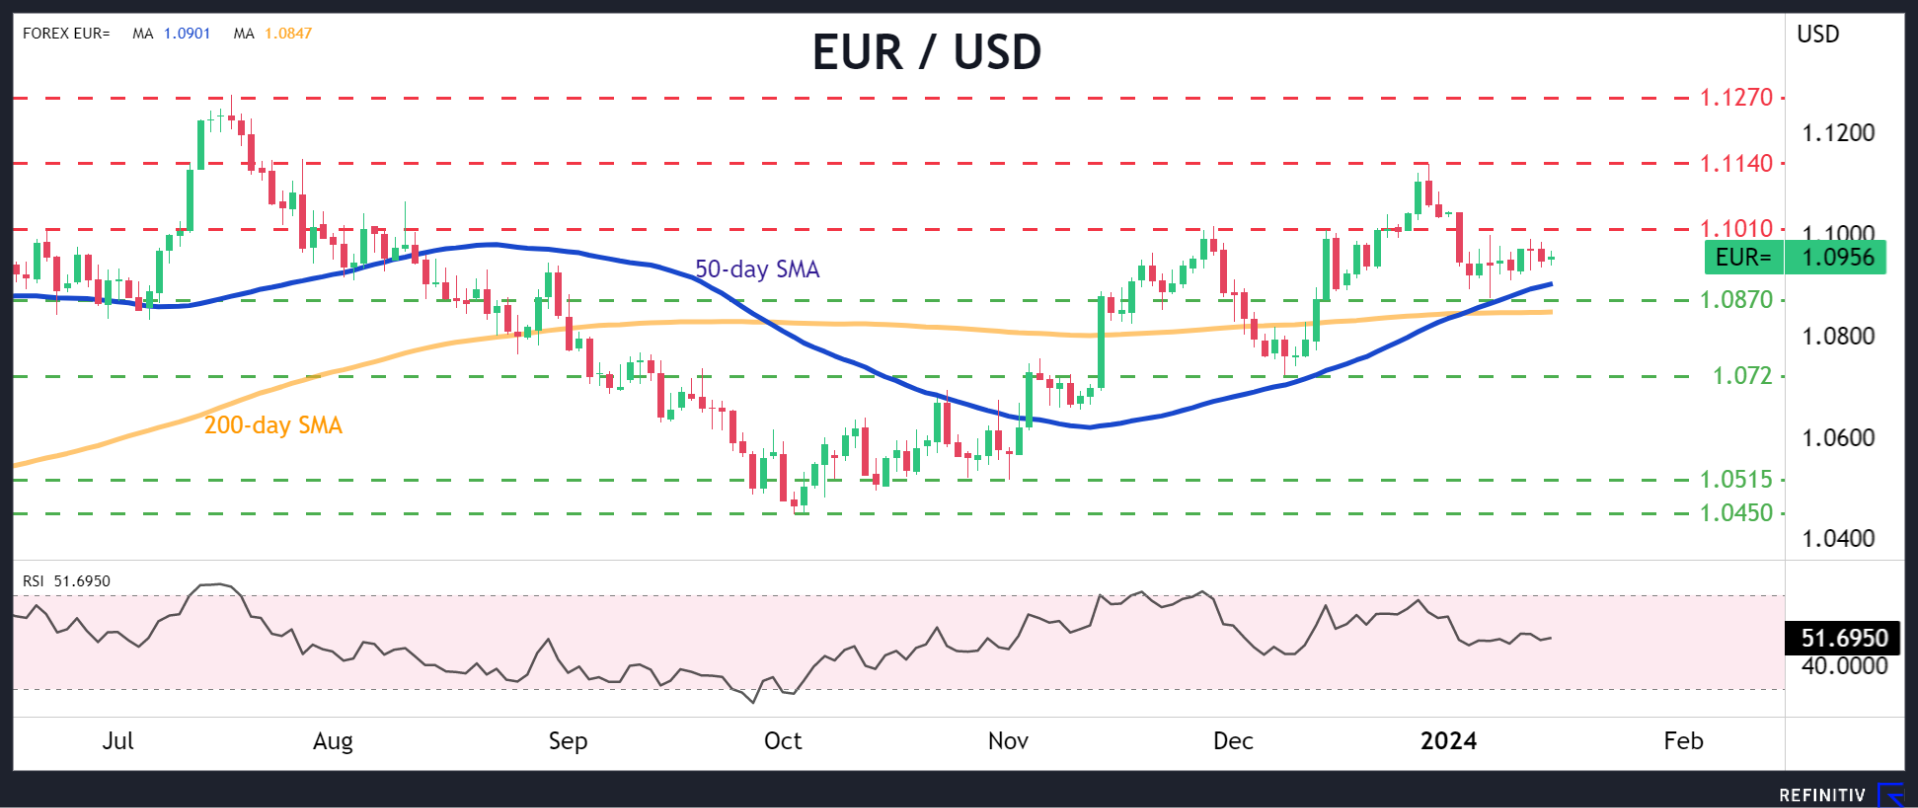
- EUR/USD is putting pressure at resistance at 1.0954. Above, there is resistance at 1.0996
- 1.0908 and 1.0866 are the next support levels
ECB’s Holzmann cautions against premature rate cuts amid uncertainty
During the World Economic Forum in Davos, ECB Governing Council member Robert Holzmann expressed skepticism about the possibility of rate cuts in the near term. He told CNBC, "I cannot imagine that we'll talk about cuts yet, because we should not talk about it."
His asserted, "Everything we have seen in recent weeks points in the opposite direction, so I may even foresee no cut at all this year."
"Unless we see a clear decline towards 2%, we won't be able to make any announcement at all when we're going to cut," he explained.
Holzmann also highlighted the potential for structural changes in the economy, which could have longer-term implications for pricing. He mentioned, "Prices on a day-to-day basis may increase, but it may also risk to change the way we do business." This comment points to the possibility of enduring economic shifts that could affect pricing dynamics and, consequently, ECB's monetary policy decisions.
ECB’s Nagel signals caution, rate cuts possible after summer break
In an interview with Bloomberg TV, ECB Governing Council member and Bundesbank President Joachim Nagel hinted at the possibility of delaying interest rate cuts until after the summer, stating, "Maybe we can wait for the summer break." However, he was cautious not to delve into speculation, emphasizing, "I don't want to speculate." He also empahsized, "it's too early to talk about cuts."
Further elaborating on the current market expectations, Nagel addressed the speculations of six 25 basis points rate cuts by ECB this year. He noted, "The markets from time to time are optimistic. Sometimes they are overly optimistic." This acknowledgment highlights a divergence between market expectations and the ECB's internal assessments. Nagel's observation, "I have a different view," underscores a more cautious and less aggressive approach towards monetary easing.
Dollar Index: Firmer Tone Keeps in Play Hopes for Test of Near-Term Range Top
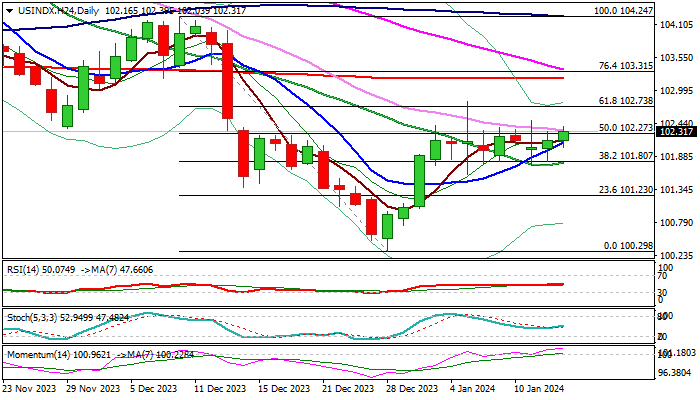
The dollar index keeps positive tone in holiday-thinned Monday’s trading and attempting again through pivotal Fibo barrier at 102.27 (50% retracement of 104.27/100.29 bear-leg), where the action failed several times recently.
Sustained break here to improve near-term picture and shift focus to the upside for potential attack at key barriers at 102.74/84 (recent range top / double-Fibo barrier) violation of which to signal continuation of recovery leg from 100.30 (Dec 28 low).
Positive momentum on daily chart and converging daily Tenkan / Kijun-sen, in attempt to form a bull-cross, underpin near-term action, though risk of extended sideways mode would persist as long as the price remains within the range.
Holding above rising 10DMA (102.12) is a minimum requirement to keep near-term bias positive.
Res: 102.50; 102.74; 102.84; 103.21.
Sup: 102.12; 101.75; 101.60; 101.23.
Bitcoin Tests the Strength of an Uptrend
Market picture
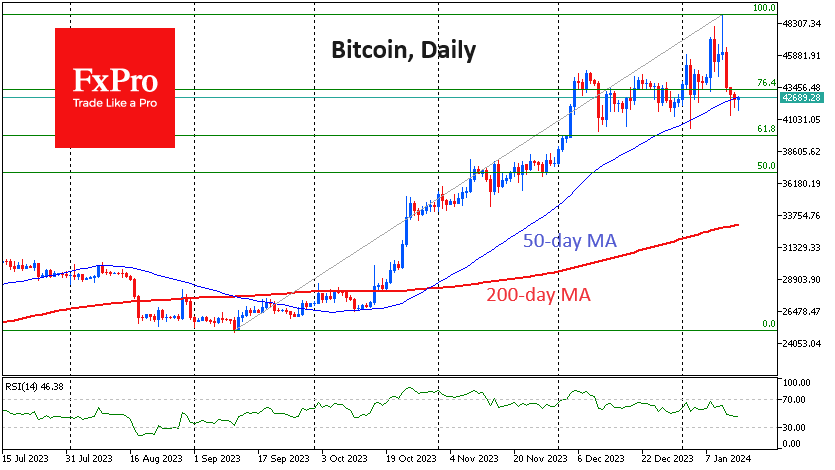
Last week saw the launch of 11 spot bitcoin ETFs in the US. On Thursday, the first day of trading, the total volume traded in these ETFs was $4.6 billion, and the price of bitcoin reached a multi-month high near $49000.
The “sell the facts” pattern was already evident on Friday and continued throughout the weekend. On Saturday, the price fell to $41350, but apart from impulsive drawdowns, the price has spent most of its time around $42600. The 50-day moving average is close to this level, and the bulls are clearly trying to keep the price above this important trend indicator, which has been in place since October.
A corrective pullback in bitcoin to $39-40K would be within the bounds of typical corrections. A drop to an important round level may increase the medium-term attractiveness of the first cryptocurrency.
News background
Several applications for Ethereum spot ETFs are pending with the SEC. However, JPMorgan doesn’t expect such funds to appear in the near future. For that to happen, the SEC would have to recognise ETH as a commodity (like bitcoin) – but the regulator has repeatedly said it considers all cryptocurrencies except BTC to be securities.
Ethereum developers have proposed changes to the ERC-4337 specification to reduce the price of gas for smart account transactions. The main changes in the document concern the structure of smart account transactions.
Cryptocurrency company Ripple Labs has completely abandoned plans for an IPO and is buying back 6% of its shares from employees and early investors for a total of around $285 million.
In a bullish scenario, bitcoin could rise to $1.5 million by 2030, said Katie Wood, CEO of ARK Invest. Even in a bearish scenario, the digital gold exchange rate would rise to $258,500. A conservative estimate suggests a rise to $682,800. Fundstrat previously predicted that BTC would reach $500,000 within the next five years.
Eurozone goods exports fell -4.7% yoy in Nov, imports down -16.7% yoy
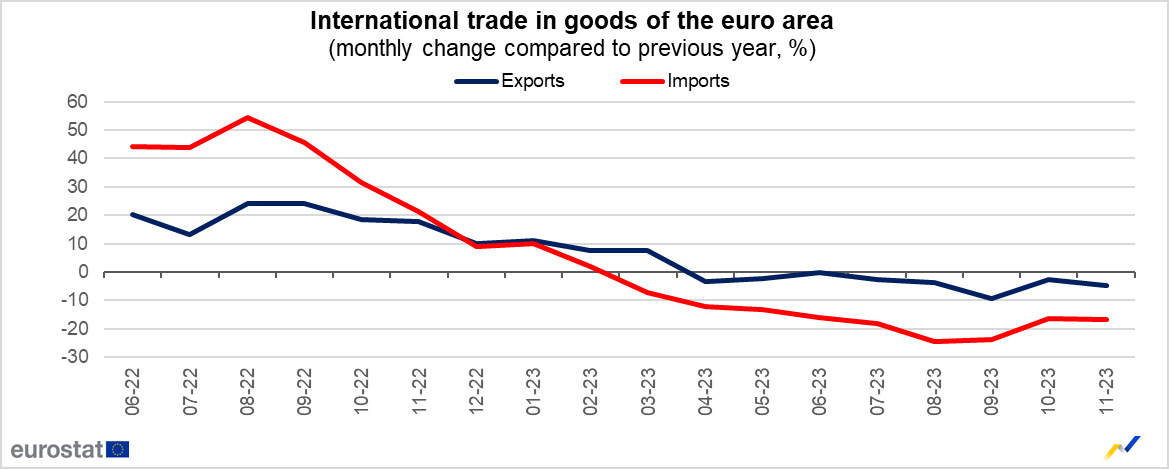
Eurozone goods exports to the rest of the world fell -4.7% yoy to EUR 252.5B in November. Goods imports fell -16.7% yoy. A EUR 20.3B goods trade surplus was recorded. Intra-Eurozone trade fell -9.4% yoy to EUR 227.2B.
In seasonally adjusted term, goods exports rose 1.0% mom to EUR 236.8B. Imports fell -0.6% mom to EUR 222.1B. Trade surplus widened from prior month's EUR 11.1B to EUR 14.8B, above expectation of EUR 11.2B.
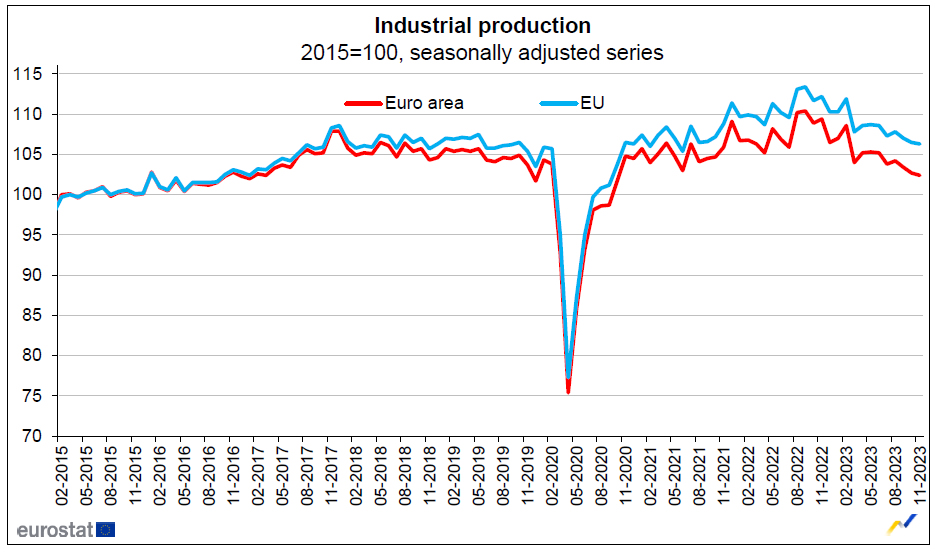
Eurozone industrial production down -0.3% mom in Nov, EU down -0.2% mom
Eurozone industrial production fell -0.3% mom in November, match expectations. Industrial production fell by -2.0% mom for durable consumer goods, by -0.8% mom for capital goods and by -0.6% mom for intermediate goods, while production grew by 0.9% mom for energy and by 1.2% mom for non-durable consumer goods.
EU industrial production fell -0.2% mom. Among Member States for which data are available, the largest monthly decreases were registered in Greece (-4.1%), Slovakia (-4.0%) and Belgium (-3.8%). The highest increases were observed in Denmark (+9.1%), Slovenia (+3.7%) and Portugal (+3.4%).
Dollar Stalls, Turns to US Retail Sales for Direction
- US retail sales expected to have risen again in December
- Strong dataset could dampen speculation of rapid Fed rate cuts
- Data due at 13:30 GMT Wednesday, crucial for dollar's path
Waiting for Fed rate cuts
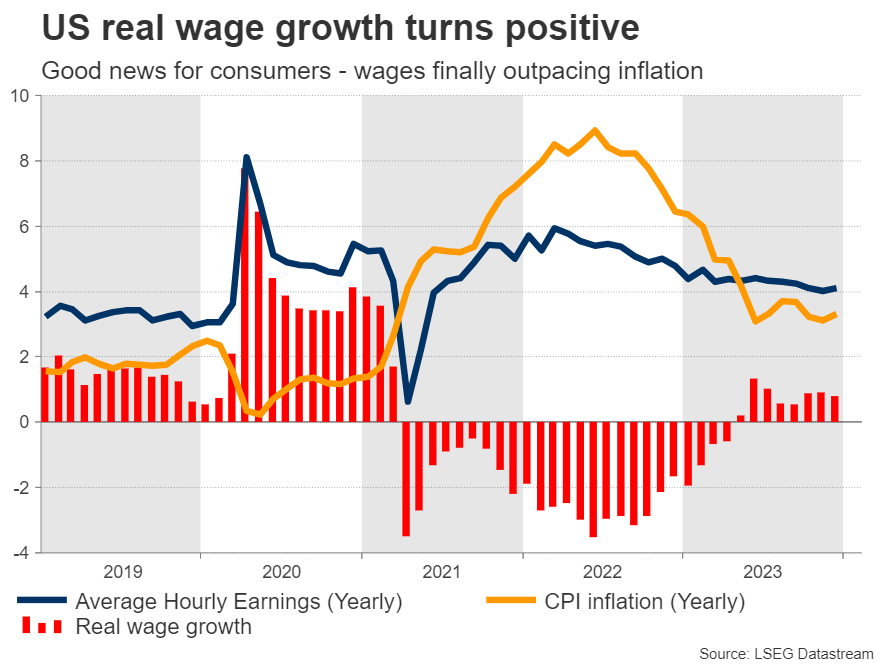
The US economy put in a stellar performance last year. Real economic growth remained around 3%, fueled by resilient consumer spending, a tight labor market, and an enormous government deficit.
Meanwhile, inflation has declined at a steady pace, with some help from falling energy prices. That's great news for American consumers, who are finally seeing their wages rise faster than prices. In other words, real income growth has finally turned positive.
With inflation cooling, markets have become increasingly confident that the Federal Reserve will soon begin to cut interest rates. The implied probability for a rate cut in March currently stands at 70%, while for the entire year, investors expect more than six rate cuts in total.
As such, the upcoming data releases will be crucial as they will either validate this narrative or push against it, driving the US dollar accordingly. Strong economic data generally dampen speculation for rate cuts and boost the dollar. The opposite is true as well.
Did retail sales jump during the holidays?
The most important release of the week will come on Wednesday with the latest edition of retail sales, which are considered a proxy for consumption. Forecasts suggest that both headline and core retail sales rose in December, by 0.3% and 0.2% respectively, in monthly terms.
It therefore appears that the holiday shopping season was a successful one, something corroborated by monthly credit card spending data released by Mastercard as well as the newly-released CNBC/NRF retail sales monitor, which attempts to track official retail sales.
This tracker pointed to a monthly retail sales increase of 0.44% in December, which is above the consensus forecast of 0.3% that economists have penciled in. As such, the risks seem tilted towards a positive surprise in this dataset, rather than a disappointment.
Coming on top of a hotter-than-expected inflation report last week, another upside surprise in retail sales could help dampen speculation about imminent Fed rate cuts and by extension, help the dollar regain some momentum.
Looking at the euro/dollar chart, the 1.0870 zone could provide initial support to any declines. On the flipside, a disappointment in this dataset could send the pair higher, perhaps towards the 1.1010 region.
What's next for the USD?
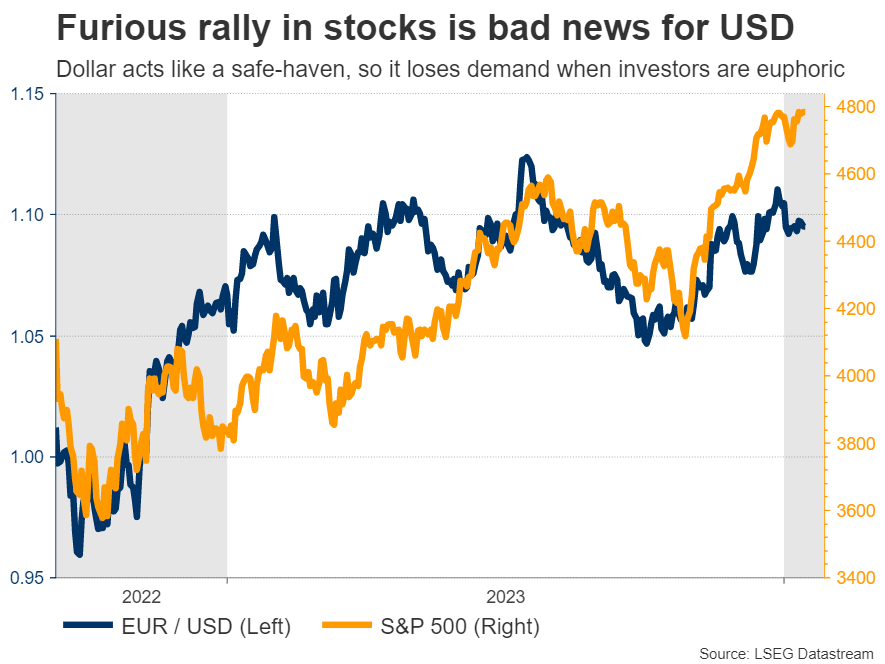
In the FX market, the dollar has struggled in recent months as the market priced in heavier rate cuts by the Federal Reserve for this year. The huge rally in the stock market was another reason for the dollar's underperformance, as the cheerful sentiment diminished demand for safe haven assets.
Now, the question is whether this trend will continue or reverse moving forward. In this sense, there is some scope for the dollar to stage a comeback in the coming months. The US economy is still in good shape, which makes the market pricing for more than six Fed rate cuts this year appear excessive.
If incoming data remains resilient, leading traders to unwind some of those rate-cut bets, the dollar could benefit. Similarly, the outlook for the euro area economy is rather dark, making it difficult for the euro to sustain any advances.
In this sense, the upside risks surrounding the dollar seem to outweigh the downside risks, although the evolution of global risk appetite in the markets and geopolitical events will also play a crucial role.
GBP/USD Eyes UK Wage Growth
- UK wage growth expected to drop to 6.8%
- UK GDP rises 0.3%, but risk of recession remains
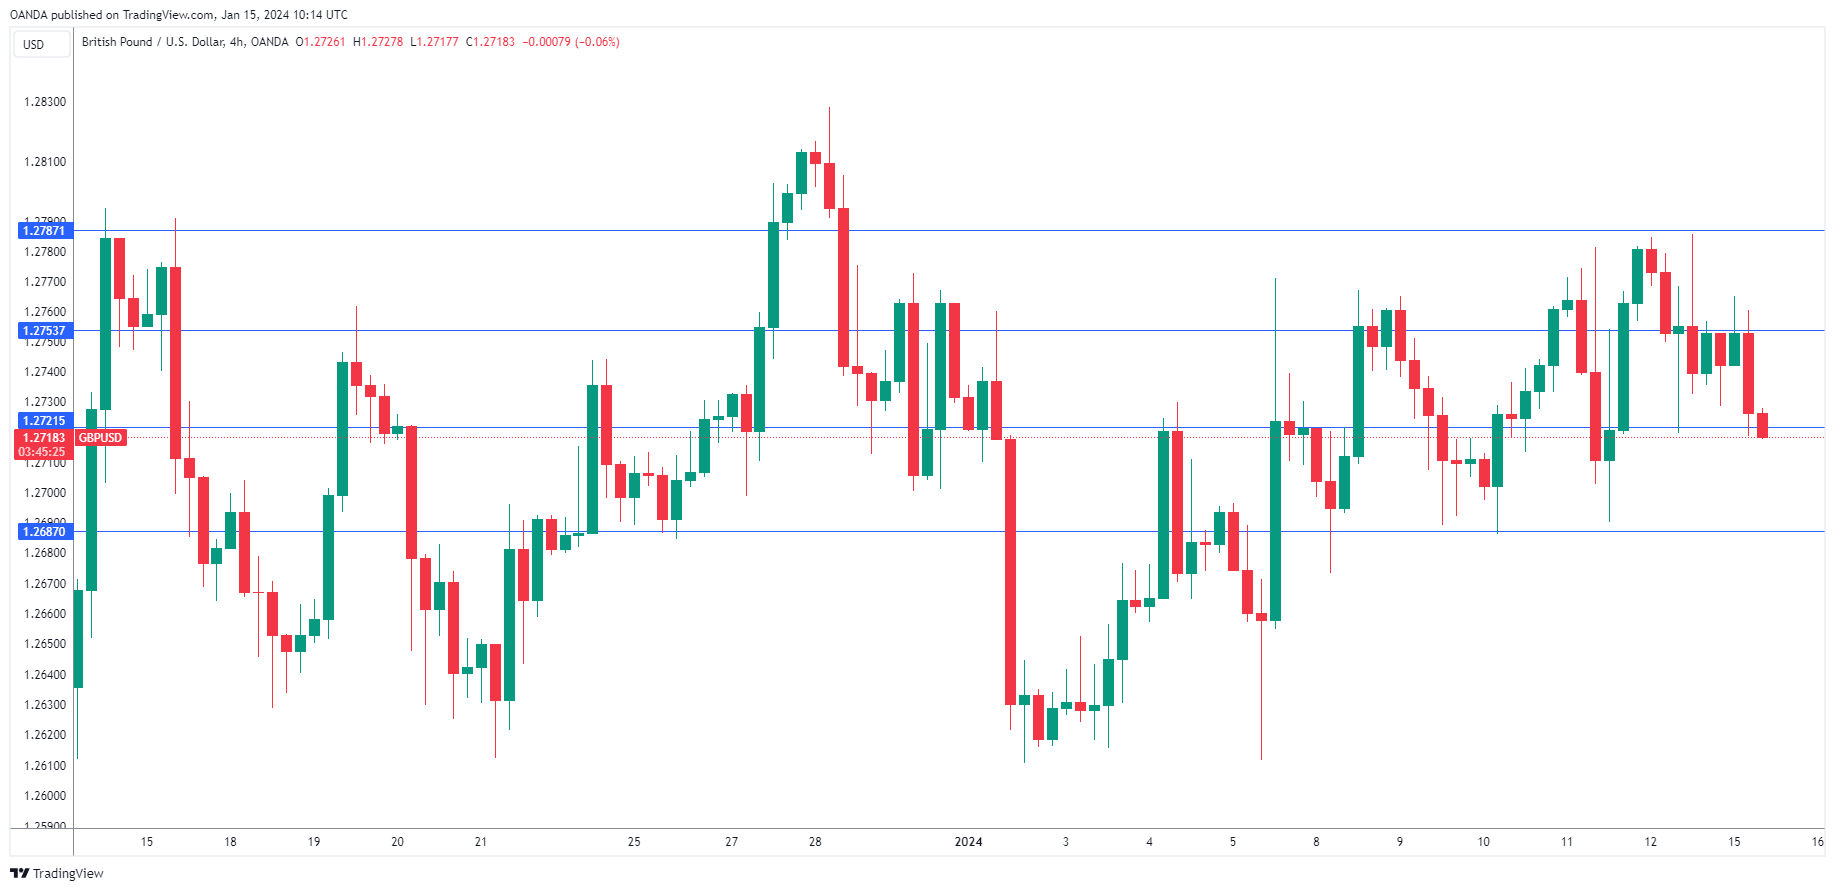
The British pound has started the week with slight losses. In the European session, GBP/USD is trading at 1.2725, down 0.21%.
Wage growth expected to continue falling
The UK will release employment data on Tuesday and the spotlight will be on wage growth. Over the past few months, wages have been falling and the Bank of England would like to see that trend continue as wages have been driving inflation. Average earnings including bonuses dropped to 7.2% in the three months to September, down from 7.7% in the previous release. The market estimate stands at 6.8% for the three months to October.
The UK economy is in trouble, although there was some good news on Friday, as November GDP rebounded with a gain of 0.3% m/m after a 0.3% decline in October. Retail sales drove the gain as shoppers took advantage of Black Friday sales late in November. Still, the probability of a recession, which is defined as two consecutive quarters of negative growth, remains high. The economy declined by 0.1% in the third quarter and a fourth quarter of negative growth would mean that the economy is technically in a recession. Even if a recession is avoided, the economy has flatlined and isn’t showing any growth.
The lack of economic growth puts the Bank of England in a dilemma. The central bank has sharply raised interest rates in order to curb high inflation and significant progress has been made. A year ago, inflation was in double digits, galloping at a 10.1% clip. Inflation has fallen to 3.9%, which is still double the 2% target. Governor Bailey has pushed back against rate cuts and insisted that the BoE would maintain a ‘higher for lower’ rate path, but lowering rates would increase economic activity and lessen the likelihood of a recession. The BoE has maintained the cash rate at 5.25% three straight times and meets next on February 1.
GBP/USD Technical
- GBP/USD is testing support at 1.2721. Below, there is support at 1.2687
- There is resistance at 1.2753 and 1.2787
BTC/USD Price and “Three Black Crows” Pattern
On January 11, the highly publicized Bitcoin ETF began trading after it was officially approved by the SEC. On this day, the price of Bitcoin exceeded USD 48,800, as shown by the chart. Bloomberg writes that new US spot funds achieved net inflows of USD 819 million in the first two days of trading.
However, from the high on January 11, a dizzying fall began, and already at the low on January 12, Bitcoin was worth less than USD 41,800. This dynamic may illustrate the “buy the rumors, sell the facts” strategy, which we wrote about on January 3 when predicting the price of Bitcoin in 2024.
News of the ETF's approval sent the ATR above 1,100 on the 4-hour chart, the last time it did so was in mid-June 2022. The market was overly active, and what is important is that three bearish candles (marked with an arrow) summed up this activity. They can be interpreted as the three black crows pattern.
According to statistics from Tim Bulkowski, this pattern works in 78% of cases and means a trend change from bullish to bearish. According to CandleScanner statistics for 20 years, collected on the S&P 500 index market, the pattern turned out to be false only in 18.6% of cases out of 543 occurrences.
Does this mean that the statistics will work on the Bitcoin price chart?
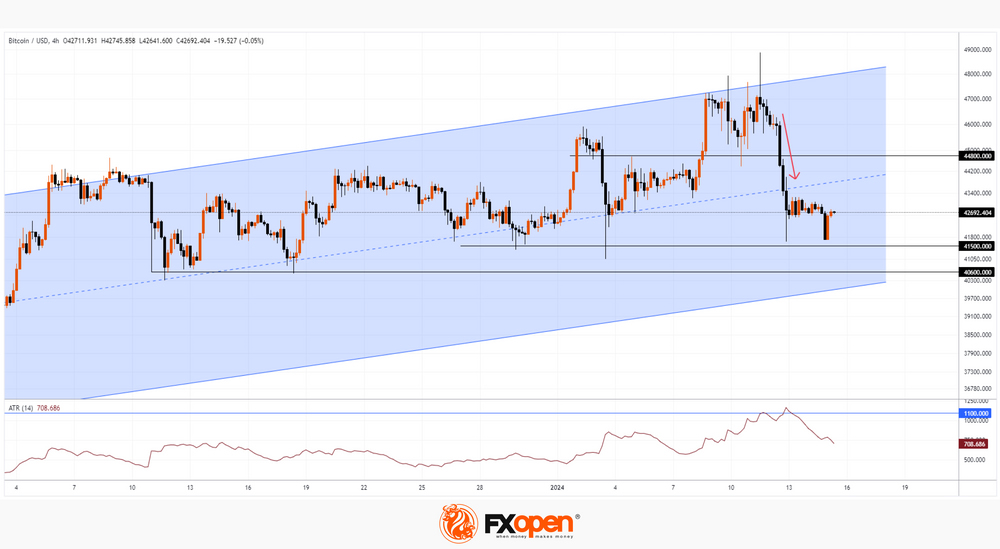
So far, the price is still within the bullish trend (shown as a channel).
The nearest support levels: 41,500, 40,600, the lower border of the channel.
The nearest resistance levels: 44,800, the median line of the channel.
Let’s assume that the beginning of the week will show a continued influx of capital into the Bitcoin ETF. At the same time, it is possible that the price will form a rebound from one of the support lines. But what if these investors also fall into the trap that those who bought Bitcoin on January 11-12 are now in? Then we may witness a breakdown of the lower border of the blue channel, which will confirm the importance of the three black crows pattern.
This article represents the opinion of the Companies operating under the FXOpen brand only. It is not to be construed as an offer, solicitation, or recommendation with respect to products and services provided by the Companies operating under the FXOpen brand, nor is it to be considered financial advice.