Sample Category Title
EUR/USD Daily Outlook
Daily Pivots: (S1) 1.0929; (P) 1.0958; (R1) 1.0980; More...
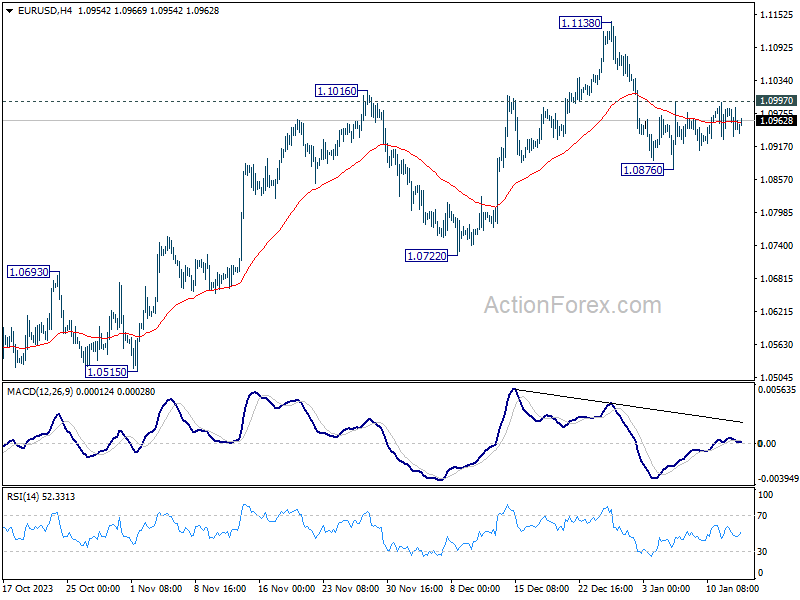
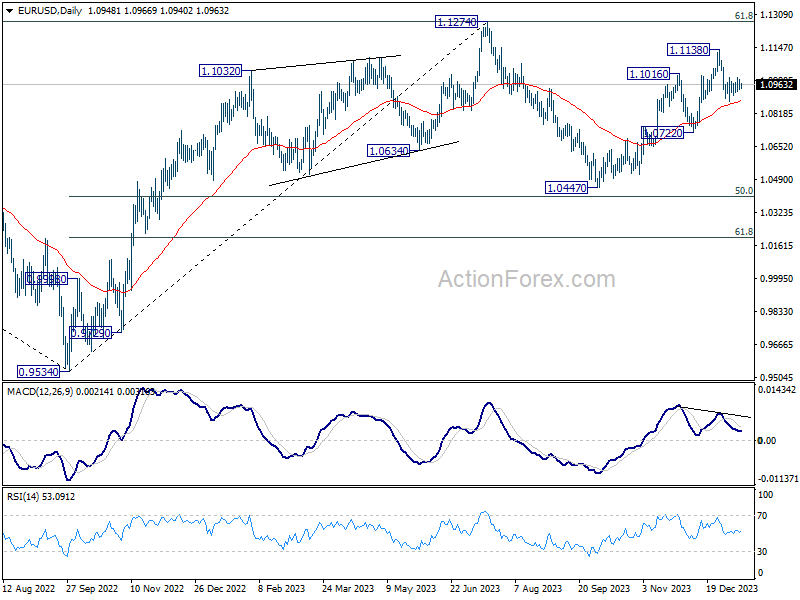
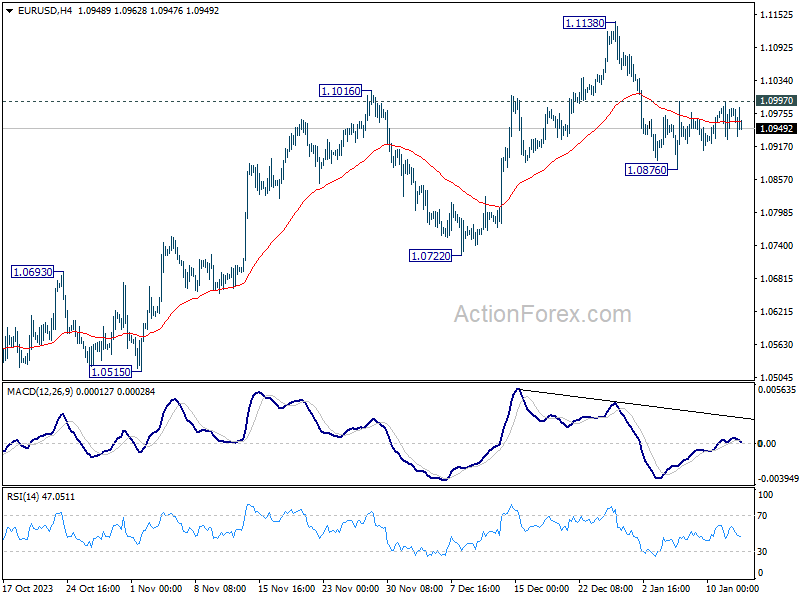
EUR/USD is still bounded in range trading and intraday bias remains neutral. Further fall is in favor as long as 1.0997 minor resistance intact. Break of 1.0876 will resume the fall from 1.1138 to 1.0722 support next. Nevertheless, firm break of 1.0997 will turn bias back to the upside for retesting 1.1138 high instead.
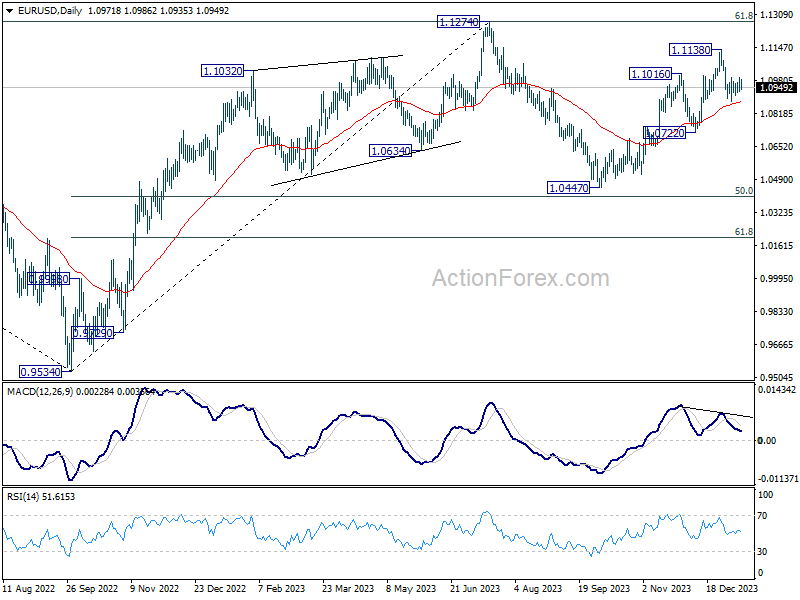
In the bigger picture, price actions from 1.1274 are viewed as a corrective pattern to rise from 0.9534 (2022 low). Rise from 1.0447 is seen as the second leg. While further rally could cannot be ruled out, upside should be limited by 1.1274 to bring the third leg of the pattern. Meanwhile, sustained break of 1.0722 support will argue that the third leg has already started for 1.0447 and below.
Technical Outlook and Review
DXY:
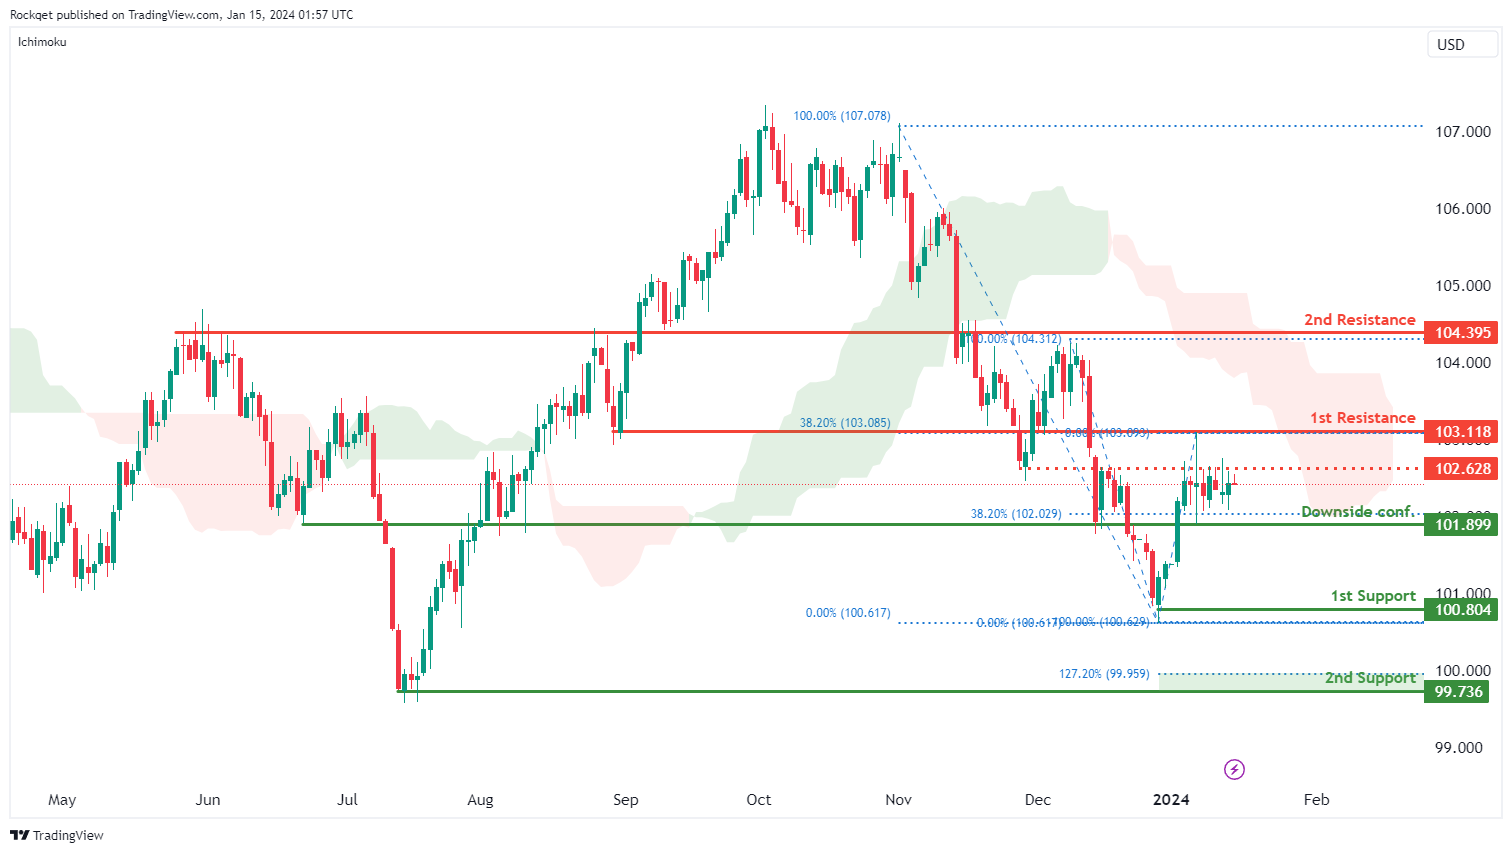
The DXY (US Dollar Index) chart currently exhibits a bearish overall momentum, indicating weakness in the US Dollar. This bearish momentum is further supported by the fact that the price is below the bearish Ichimoku cloud, which is a significant technical indicator.
There is a potential for a bearish continuation towards the 1st support level, which is located at 100.80. This level is identified as a swing low support, and it may serve as a key area where buying interest could emerge, temporarily supporting the US Dollar.
Additionally, there is a 2nd support at 100.73, categorized as an overlap support. This reinforces its significance as a potential support zone, further adding to its importance.
On the resistance side, the 1st resistance at 103.11 is marked as an overlap resistance and aligns with the 38.20% Fibonacci Retracement level. Fibonacci retracement levels are often closely watched by traders, making this resistance level noteworthy.
The 2nd resistance at 104.39 is also categorized as an overlap resistance, potentially acting as a barrier to any further upward price movement.
An intermediate resistance level at 102.62 is identified as an overlap resistance, contributing to the potential significance of this price point.
EUR/USD:
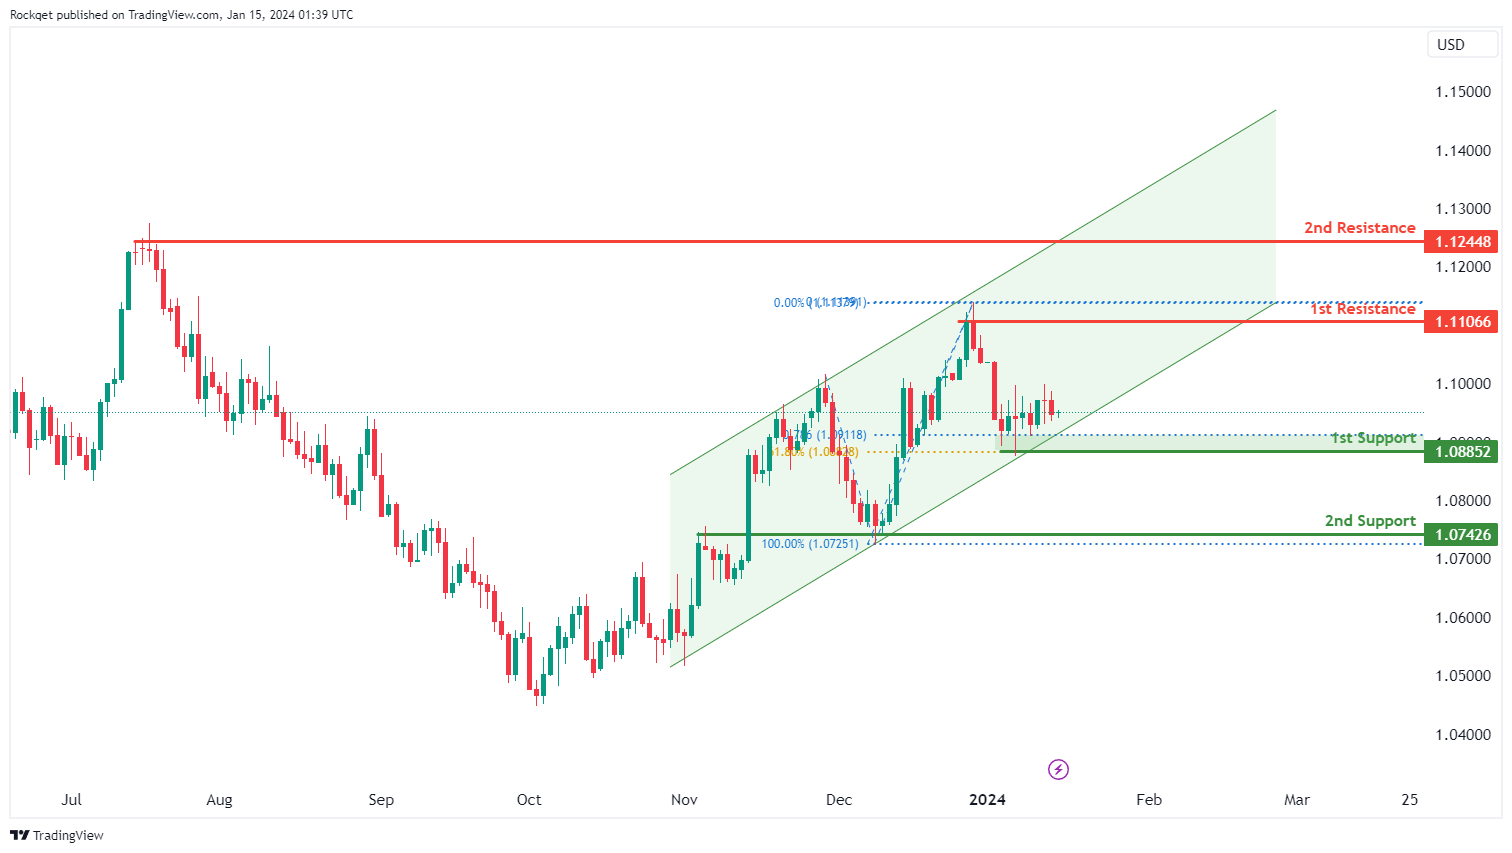
The EUR/USD chart currently has a bullish overall momentum, indicating strength in the Euro relative to the US Dollar. This momentum is supported by the fact that price is within a bullish ascending channel, which is a pattern often associated with upward price movement.
There’s a potential for a bullish continuation towards the 1st resistance level, which is at 1.1106. This level is identified as a swing high resistance, and swing highs often act as points of reversal or resistance in price movement.
The 1st support at 1.0885 is significant for several reasons. It is a swing low support, indicating a level where buying interest may emerge. Additionally, it aligns with the 61.80% Fibonacci Retracement level, adding to its significance. Fibonacci retracement levels are commonly used by traders to identify potential support and resistance areas.
There is also a 2nd support at 1.0742, categorized as an overlap support. This level further reinforces its significance as a potential support area.
On the resistance side, the 2nd resistance at 1.1244 is identified as multi-swing high resistance. These levels often present challenges for further upward price movement.
EUR/JPY:
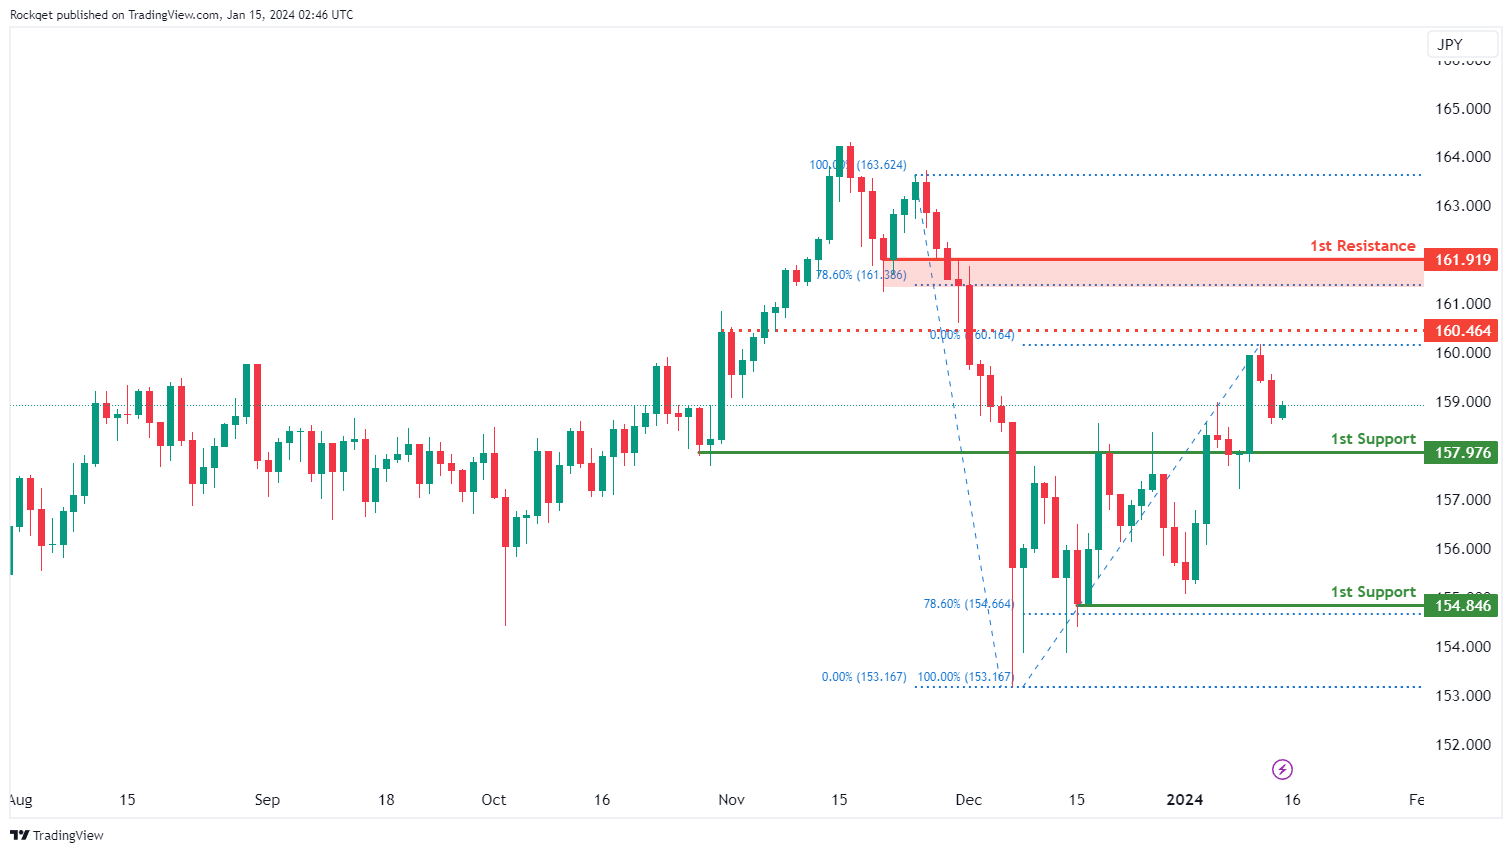
The EUR/JPY chart currently exhibits a bullish overall momentum, indicating strength in the Euro relative to the Japanese Yen. This bullish momentum is supported by the potential for a bullish continuation towards the 1st resistance level.
The 1st support at 157.97 is identified as an overlap support, suggesting a potential area where buying interest may emerge and provide temporary support for EUR/JPY.
The 2nd support at 154.84 is categorized as a swing low support, further reinforcing its significance as a potential support zone.
On the resistance side, 1st resistance at 161.91 is marked as a pullback resistance and aligns with the 78.60% Fibonacci Retracement level. This level suggests a potential area where selling pressure or resistance may be encountered, adding to its significance.
Intermediate resistance at 160.46 is also categorized as a pullback resistance, reinforcing the potential resistance zone.
EUR/GBP:
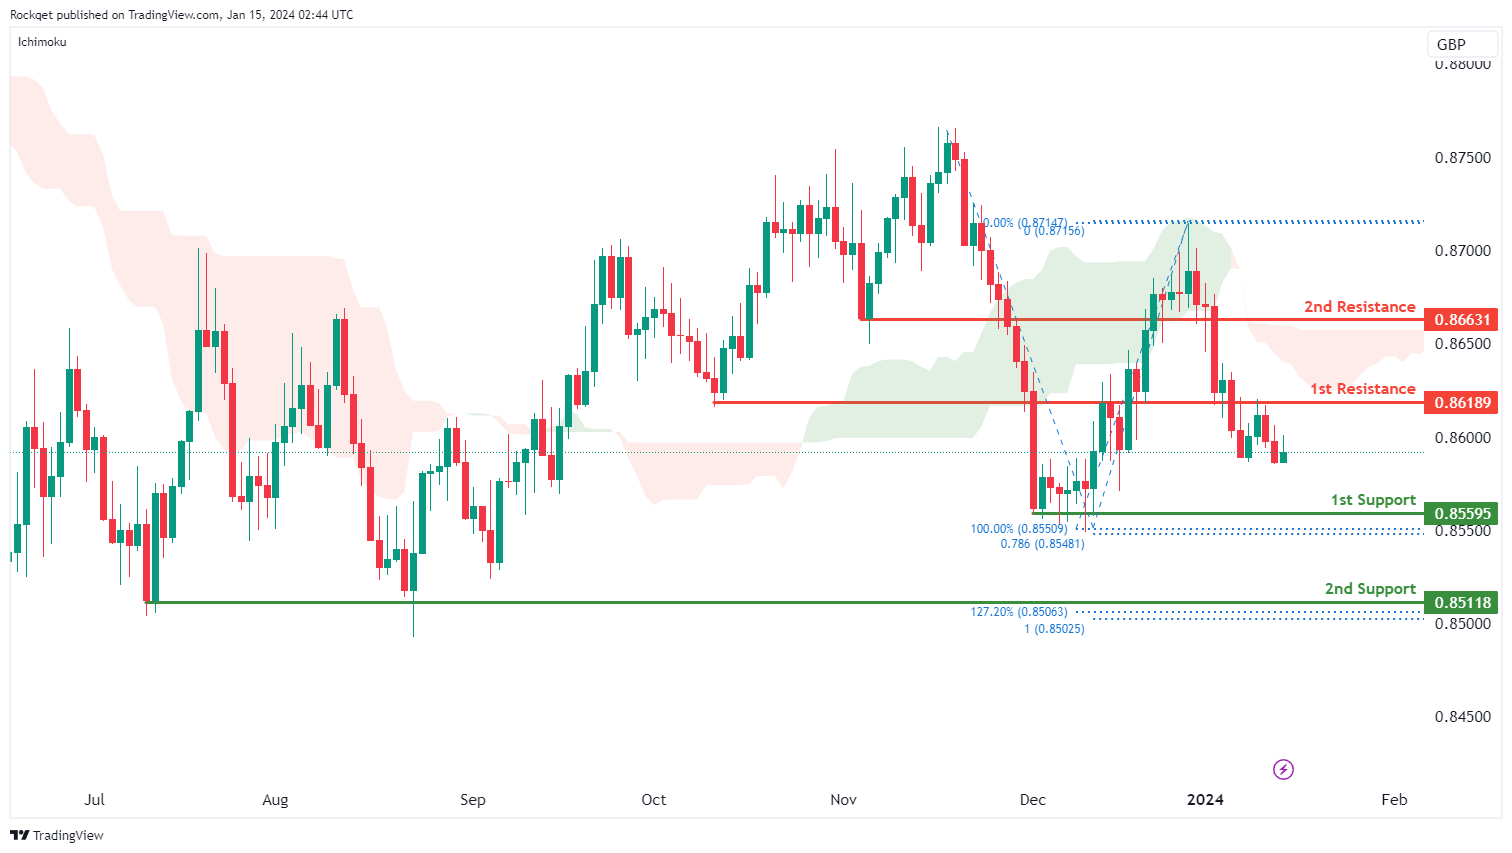
The EUR/GBP chart currently exhibits a bearish overall momentum, indicating weakness in the Euro relative to the British Pound. This bearish momentum is supported by the fact that the price is below the bearish Ichimoku cloud, signifying a potentially bearish trend continuation.
The 1st support at 0.8559 is identified as multi-swing low support, and it aligns with the 78.60% Fibonacci Projection level. This level suggests a potential area where buying interest may emerge, providing temporary support for EUR/GBP.
Additionally, the 2nd support at 0.8511 is categorized as multi-swing low support, and it reinforces its significance with the presence of the 127.20% Fibonacci Extension and 100% Fibonacci Projection, indicating Fibonacci confluence.
On the resistance side, 1st resistance at 0.8618 is marked as an overlap resistance, and it could act as a barrier for any potential upward price movement.
2nd resistance at 0.8663 is categorized as pullback resistance, further strengthening its role as a potential resistance level.
GBP/USD:
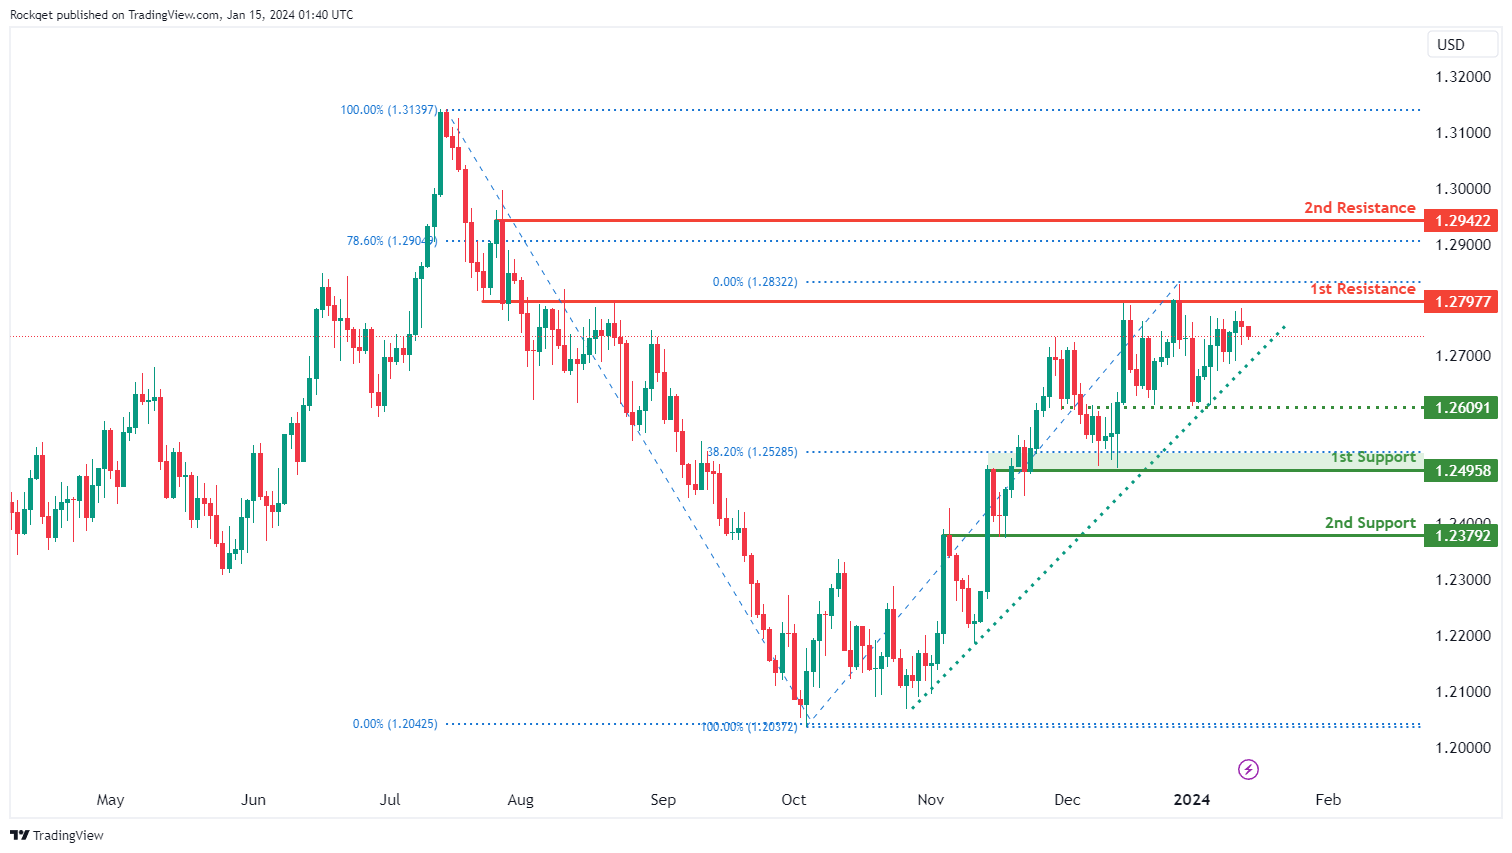
The GBP/USD chart currently exhibits a bullish overall momentum, indicating strength in the British Pound relative to the US Dollar. This momentum is supported by the fact that price is within a bullish ascending channel, a pattern often associated with upward price movement.
There’s a potential for a bullish continuation towards the 1st resistance level at 1.2797. This level is identified as an overlap resistance, suggesting it has acted as a significant price barrier in the past.
The 1st support at 1.2495 is considered a strong support level for several reasons. It is an overlap support, meaning it aligns with previous price levels where buying interest emerged. Additionally, it coincides with the 38.20% Fibonacci Retracement level, adding to its significance. Fibonacci retracement levels are commonly used by traders to identify potential support and resistance zones.
There is also a 2nd support at 1.2379, categorized as an overlap support, which further reinforces its significance as a potential support area.
On the resistance side, the 2nd resistance at 1.2942 is identified as a swing high resistance. Swing highs are often points of reversal or resistance in price movement. Additionally, this level aligns with the 78.60% Fibonacci Retracement, indicating potential Fibonacci confluence.
GBP/JPY:
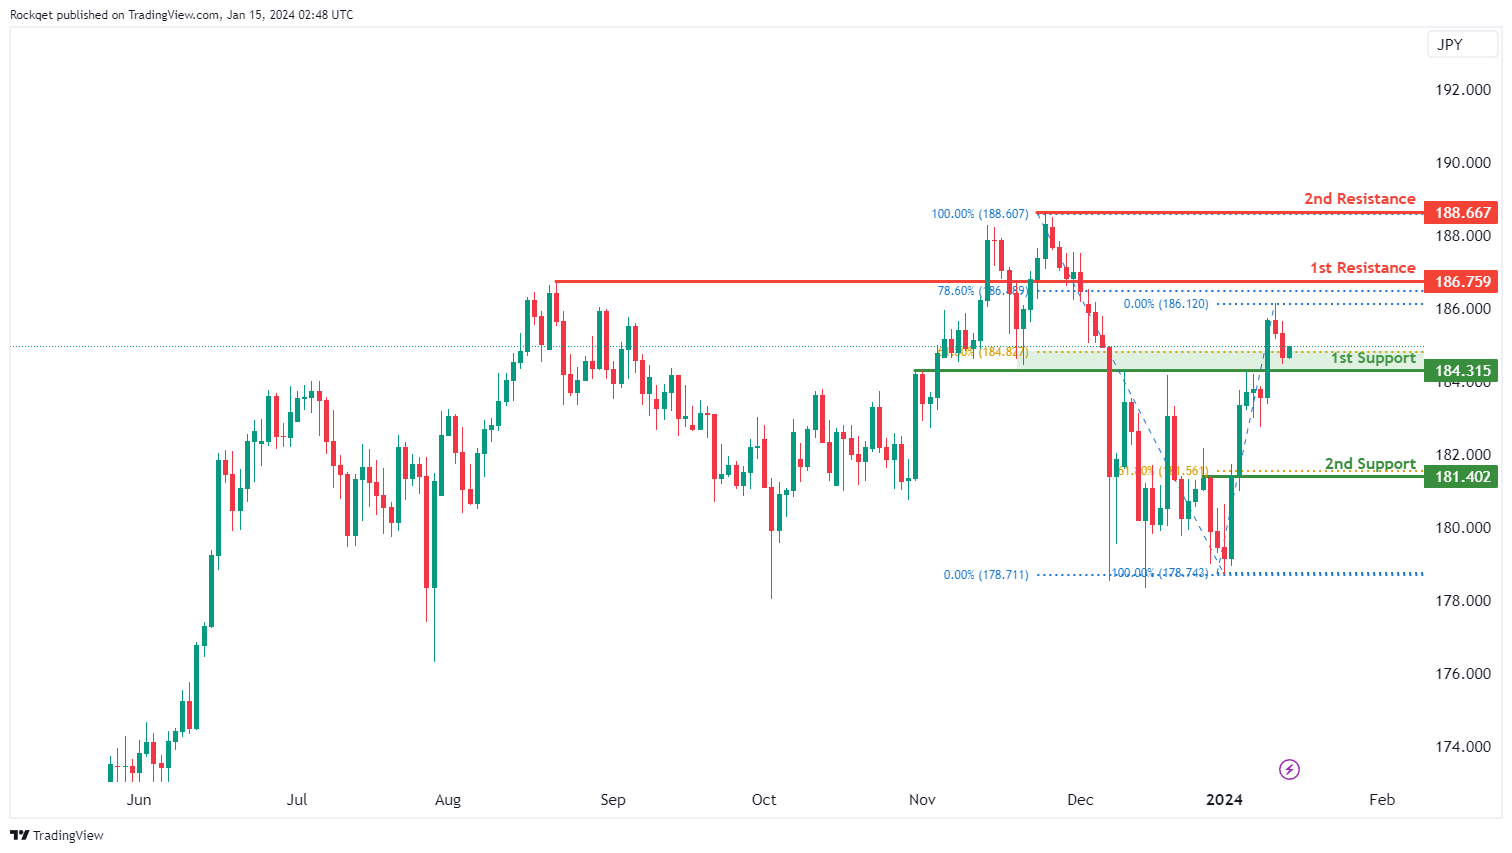
The GBP/JPY chart currently exhibits a bullish bias, indicating strength in the British Pound against the Japanese Yen. This bullish sentiment is supported by the fact that the price has the potential to rebound from the 1st support level and make its way towards the 1st resistance level.
The 1st support at 184.31 is considered a reliable support level as it aligns with the concept of a pullback support, coinciding with the 61.80% Fibonacci Retracement. This level suggests the possibility of a temporary zone where buying interest may emerge, providing a brief period of support for GBP/JPY.
Additionally, the 2nd support at 181.40 shares the characteristics of a pullback support and further strengthens its significance by aligning with the 61.80% Fibonacci Retracement.
On the resistance side, the 1st resistance level at 186.75 is identified as a pullback resistance, closely associated with the 78.60% Fibonacci Retracement. This level could potentially act as a substantial barrier to any potential upward price movement.
Furthermore, the 2nd resistance level at 188.66 is categorized as a swing high resistance, highlighting its potential role as a significant hurdle for GBP/JPY in the future.”
USD/CHF:
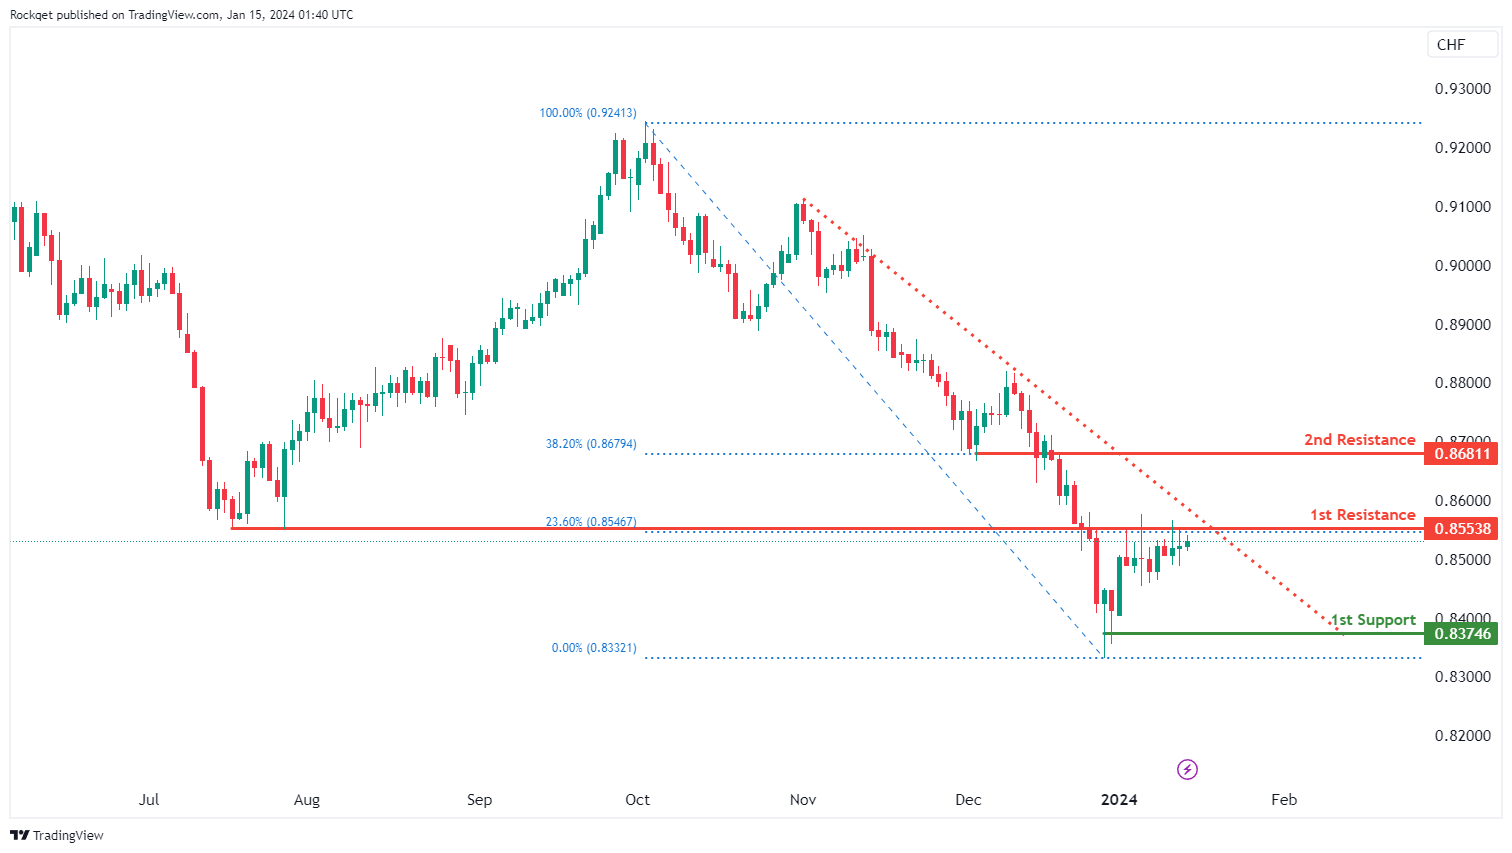
The USD/CHF chart currently has a bearish overall momentum, indicating weakness in the US Dollar relative to the Swiss Franc. This bearish momentum is supported by the fact that price is below a major descending trend line, suggesting that further bearish pressure may be on the horizon.
In the short term, there’s potential for a rise towards the 1st resistance level at 0.8553. This level is identified as an overlap resistance and aligns with the 23.60% Fibonacci Retracement, indicating potential resistance based on both historical price action and Fibonacci analysis.
The 2nd resistance at 0.8681 is categorized as a pullback resistance, further reinforcing its significance as a potential barrier for the price. This level coincides with the 38.20% Fibonacci Retracement, adding to its importance as a potential reversal point.
On the support side, the 1st support at 0.8374 is considered a strong support level as it is a swing low support. Swing lows often act as areas where buying interest can emerge, providing temporary support for the currency pair.
USD/JPY:
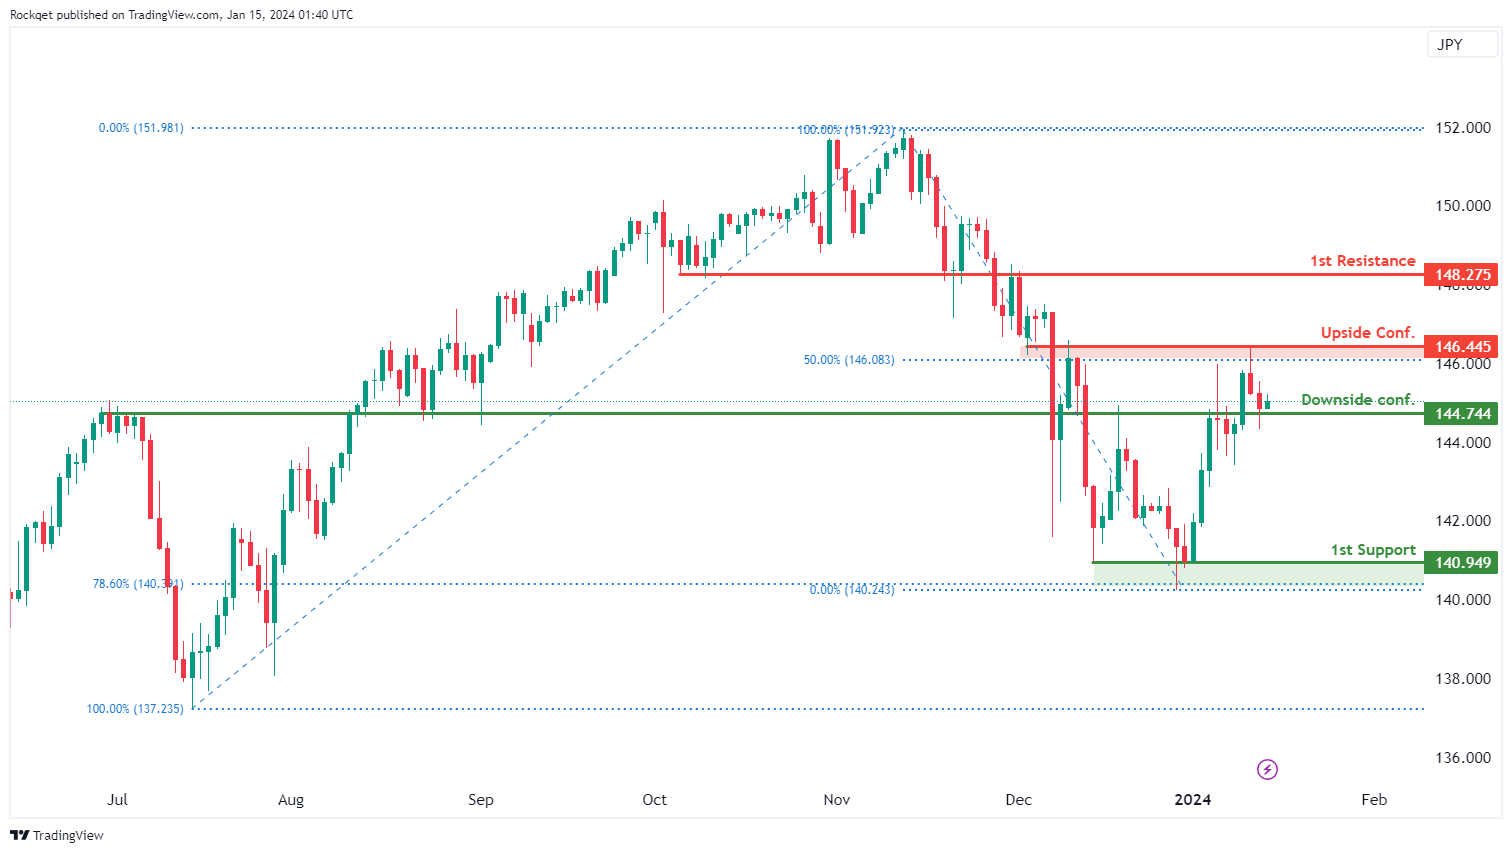
The USD/JPY chart currently exhibits a bearish overall momentum, suggesting weakness in the US Dollar relative to the Japanese Yen. This bearish momentum indicates the potential for a continuation of the downtrend.
The 1st support at 140.94 is significant as it is a multi-swing low support. This level has historically acted as a point where buying interest has emerged, making it a potential area for a temporary pause or reversal in the downtrend.
For downside confirmation, the level at 144.74 is identified as an overlap support. This level aligns with historical price action, adding to its significance as a potential support area.
On the upside, the level at 146.44 is categorized as an overlap resistance. This level also coincides with the 50% Fibonacci Retracement level, indicating potential resistance based on both historical price action and Fibonacci analysis.
The 1st resistance at 148.27 is marked as an overlap resistance, suggesting it could act as a barrier for any potential upward movement.
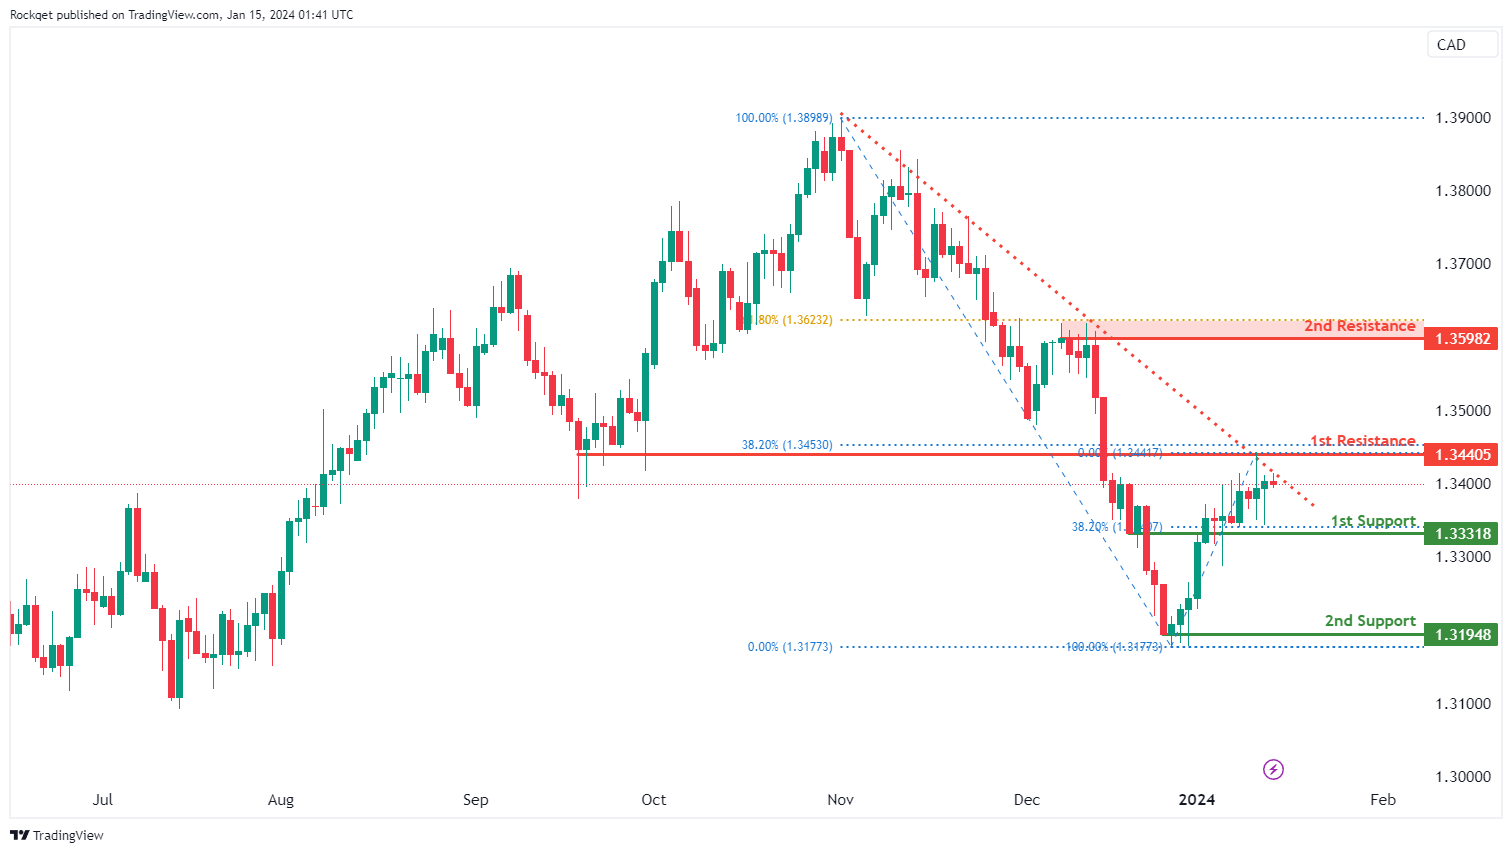
USD/CAD:
The USD/CAD chart currently shows a bearish overall momentum, indicating a downward trend in the US Dollar relative to the Canadian Dollar. This bearish momentum is supported by the fact that price is within a bearish descending channel, suggesting a potential for further downside movement.
Price could potentially make a bearish continuation towards the 1st support level, which is identified at 1.3331. This level is significant as it coincides with an overlap support and the 38.20% Fibonacci Retracement level, indicating a potential area where buying interest may emerge and provide temporary support for USD/CAD.
The 2nd support at 1.3194 is categorized as a multi-swing low support, further reinforcing its significance as a potential support zone in the bearish scenario.
On the resistance side, 1st resistance at 1.3440 is marked as an overlap resistance and aligns with the 38.20% Fibonacci Retracement level. This level suggests a potential area where selling pressure or resistance may be encountered.
2nd resistance at 1.3598 is identified as an overlap resistance and coincides with the 61.80% Fibonacci Retracement level, adding to its importance as a potential barrier for the price.
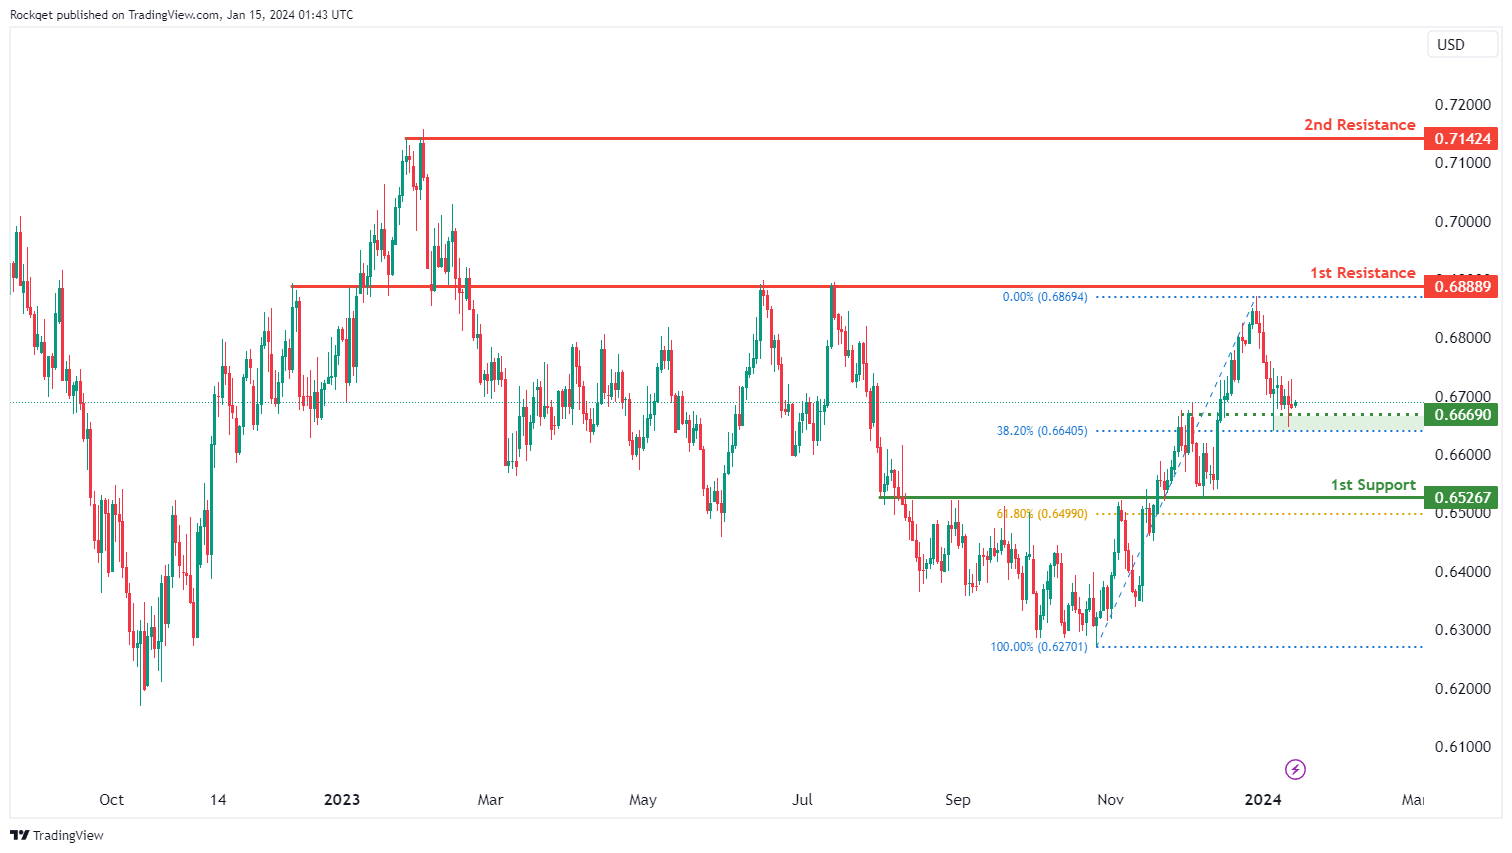
AUD/USD:
The AUD/USD chart currently exhibits a bearish overall momentum, indicating a downward trend in the Australian Dollar relative to the US Dollar. This bearish momentum suggests the potential for a bearish continuation towards the 1st support level.
Intermediate support at 0.6669 is identified as an overlap support and coincides with the 38.20% Fibonacci Retracement level. This level holds significance as it indicates a potential area where buying interest may emerge, providing temporary support for AUD/USD.
1st support at 0.6526 is marked as an overlap support and aligns with the 61.80% Fibonacci Retracement level, further reinforcing its importance as a potential support zone.
On the resistance side, 1st resistance at 0.6888 is categorized as an overlap resistance, suggesting a potential area where selling pressure or resistance may be encountered.
2nd resistance at 0.7142 is identified as a swing high resistance, indicating a significant level where price reversals or strong resistance might occur.
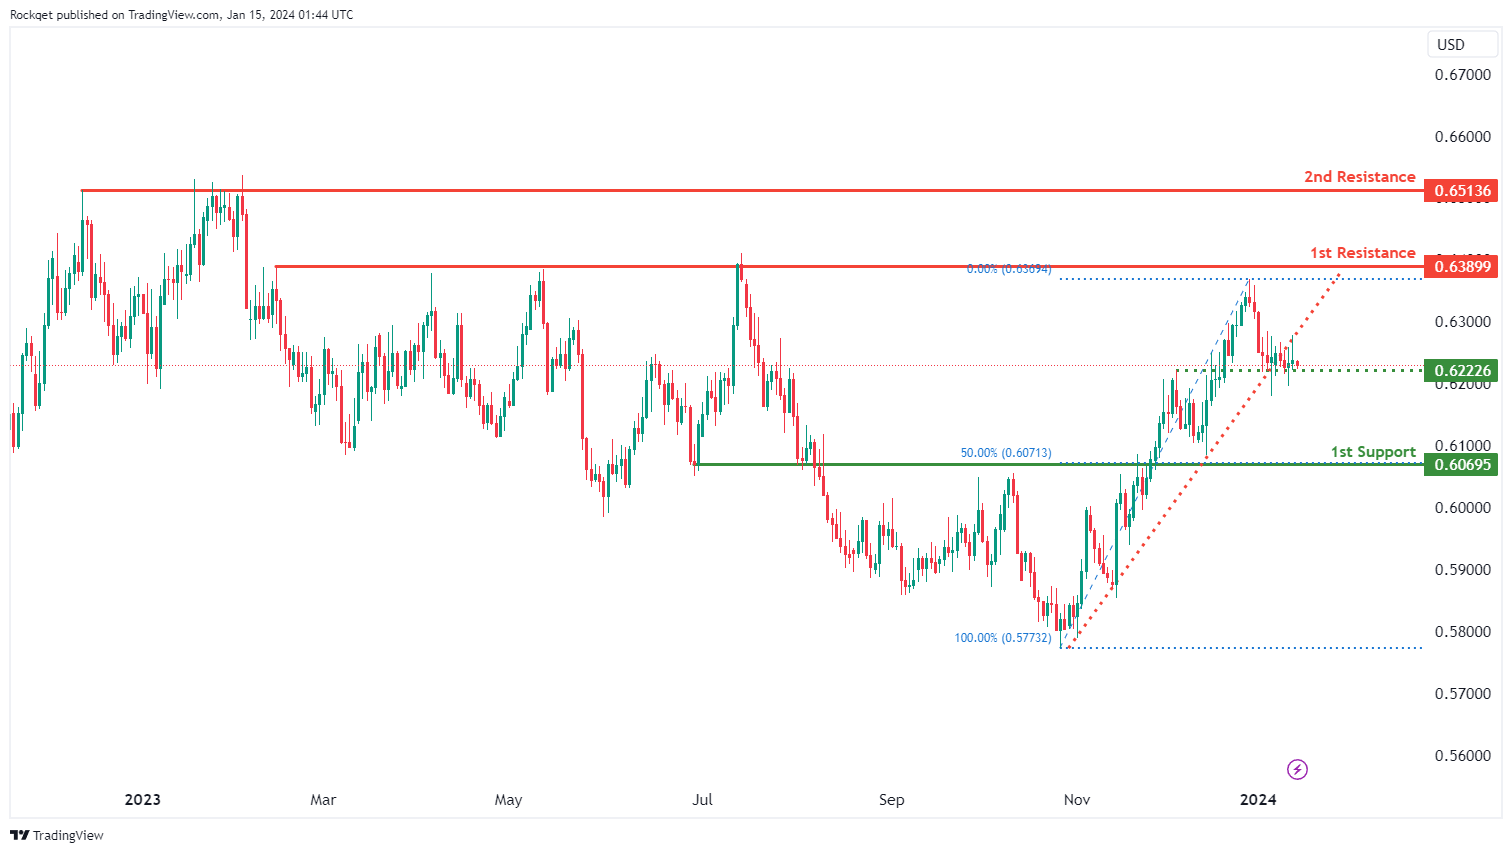
NZD/USD
The NZD/USD chart currently exhibits a bearish overall momentum, indicating a downward trend in the New Zealand Dollar relative to the US Dollar. This bearish momentum is driven by the fact that the price has broken below an ascending support line, triggering the potential for a bearish move.
Intermediate support at 0.6222 is considered significant as it has acted as a multi-swing low support in the past. Traders may look to this level for potential buying interest and temporary support.
1st support at 0.6069 is marked as an overlap support and coincides with the 50% Fibonacci Retracement level. It holds significance as it suggests a potential area where buying pressure may emerge.
On the resistance side, 1st resistance at 0.6389 is identified as a multi-swing high resistance, indicating the potential for price reversals or resistance at this level.
2nd resistance at 0.6513 is also categorized as a multi-swing high resistance, further reinforcing the potential resistance zone for the price.
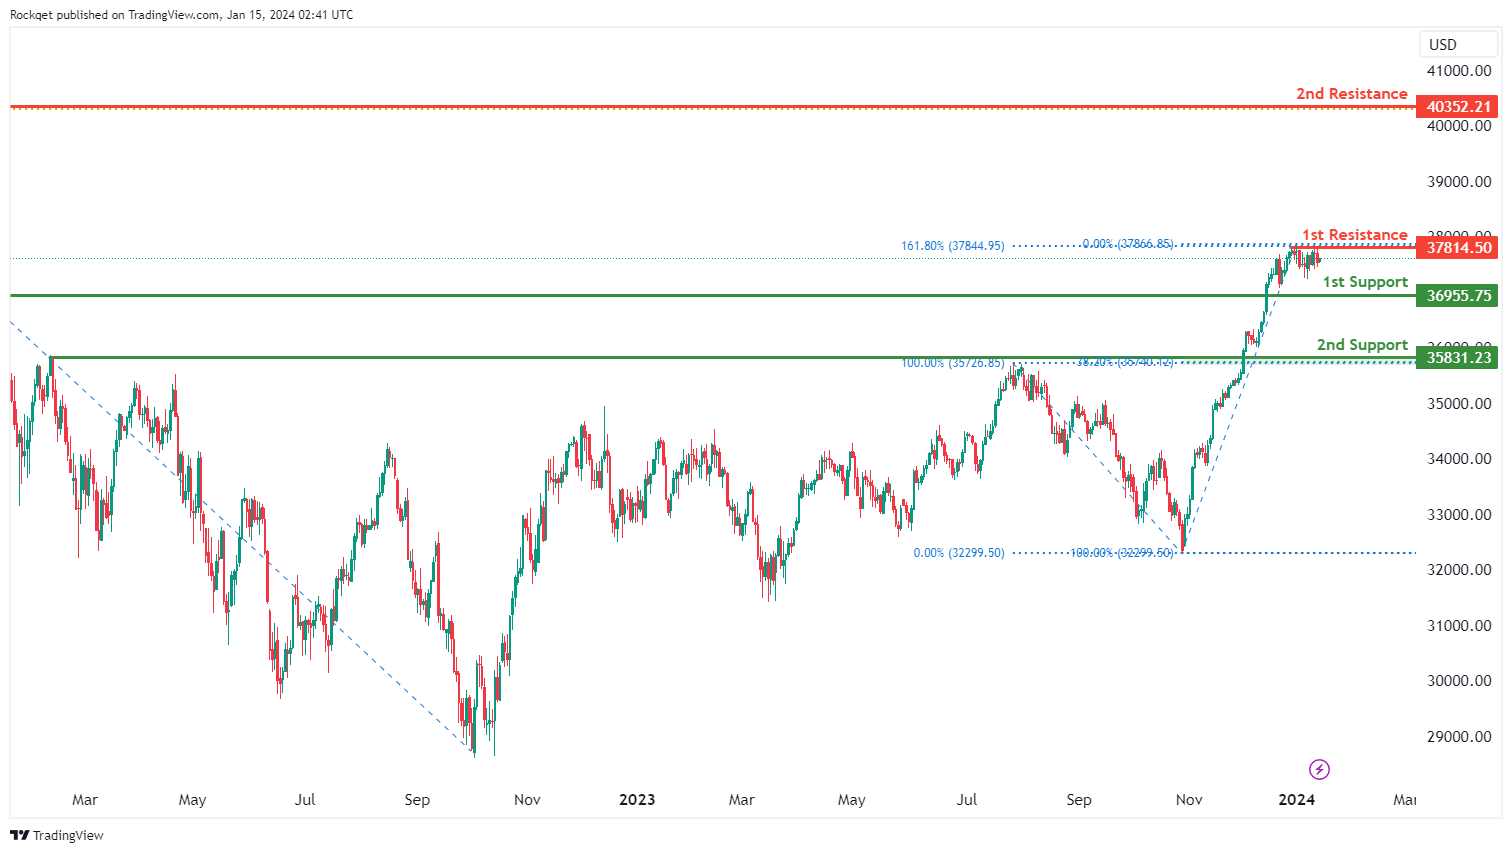
DJ30:
The DJ30 chart currently displays an overall bullish momentum. In this context, there is a potential The DJ30 chart currently exhibits a neutral overall momentum, indicating a lack of a clear bullish or bearish bias in the market. Given this neutral stance, it is expected that the price may fluctuate within a range defined by the 1st support and 1st resistance levels.
The 1st support level is identified at 36955.75, and it is considered a notable support level due to its characteristics as a pullback support. This level suggests a potential area where buyers may step in, offering support to the DJ30.
Similarly, the 2nd support level at 35831.23 also serves as a pullback support, reinforcing its significance as a potential zone for price support in the neutral market conditions.
On the resistance side, the 1st resistance level is positioned at 37814.50. This level holds significance as a multi-swing high resistance and is further strengthened by its alignment with the 161.80% Fibonacci Extension, indicating its potential to act as a strong barrier to upward price movement.
Furthermore, the 2nd resistance level at 40352.21 is categorized as a significant resistance level due to its association with the 61.80% Fibonacci Projection.
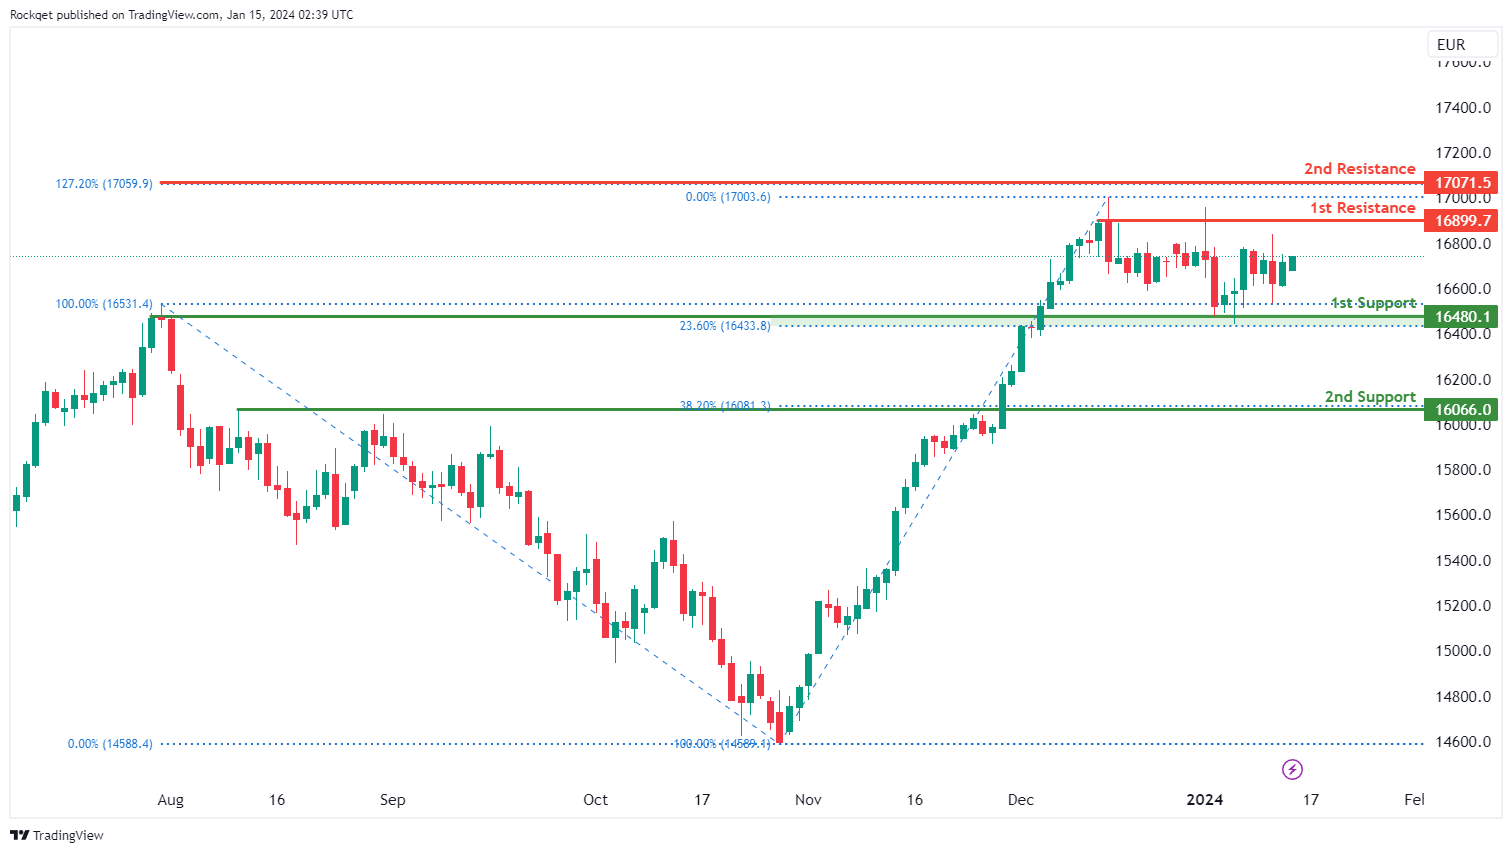
GER40:
The GER40 chart currently exhibits a neutral overall momentum, suggesting a lack of a clear trend direction. Several factors contribute to this neutral momentum, and as a result, the price could potentially make fluctuations between the 1st resistance and 1st support levels.
The 1st support at 16480.10 is considered favorable due to its identification as an overlap support and coincides with the 23.60% Fibonacci Retracement, suggesting historical significance as a level where buying interest has previously emerged.
The 2nd support at 16066.00 is recognized as a pullback support and aligns with the 38.20% Fibonacci Retracement, adding confluence to its potential as a support level.
On the resistance side, the 1st resistance at 16899.70 is identified as a swing high resistance. The 2nd resistance at 17071.50 is noteworthy for the presence of the 127.20% Fibonacci Extension, adding significance to this potential resistance level.
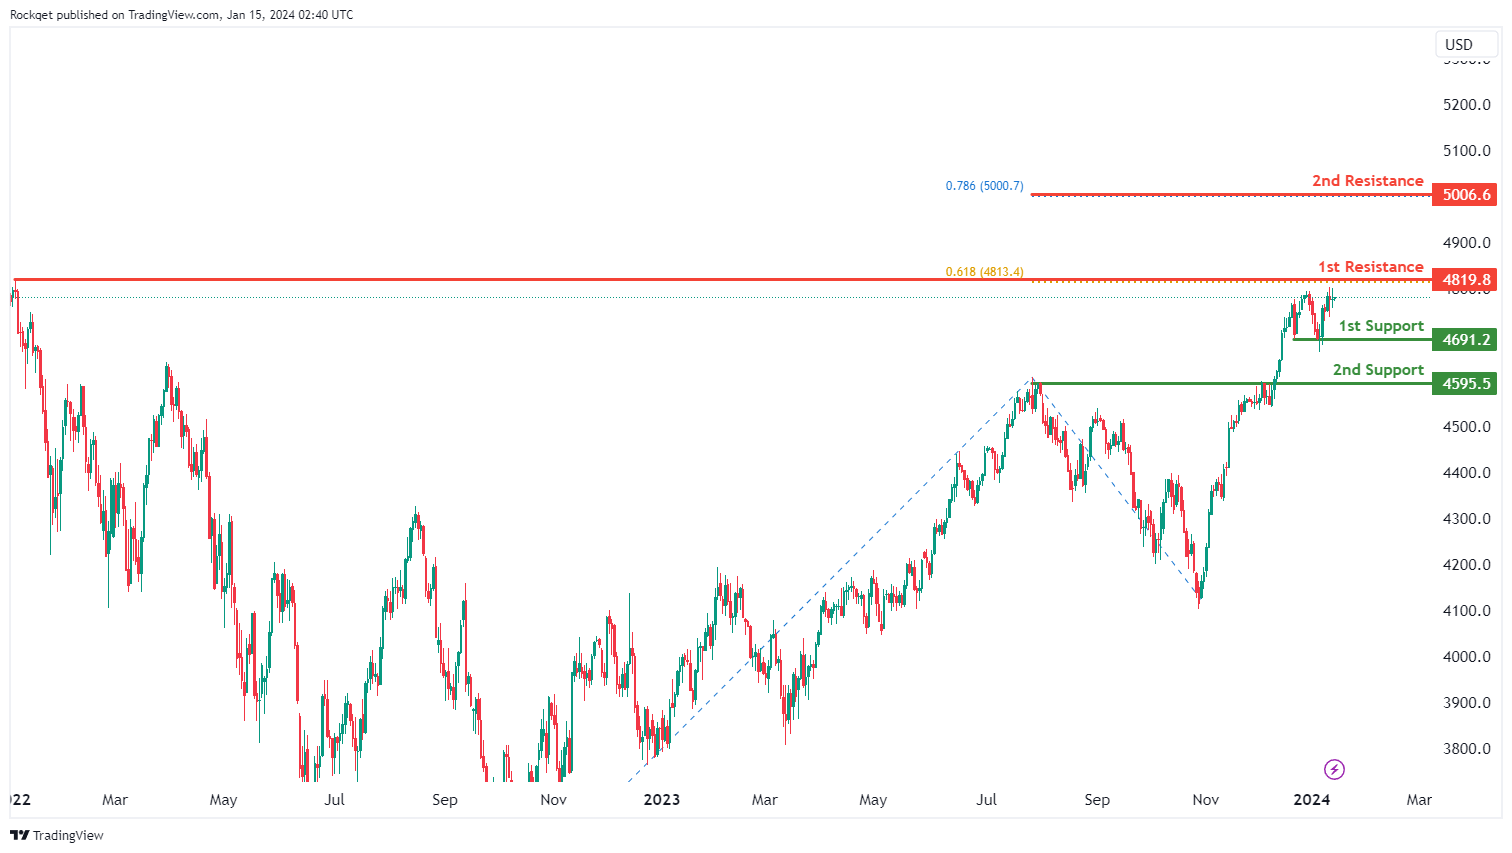
US500:
The US500 chart currently demonstrates a bullish overall momentum, indicating an upward trend. There is a potential scenario for a bullish continuation towards the 1st resistance.
The 1st support at 4691.2 is considered advantageous as a pullback support, suggesting historical significance as a level where buying interest has previously emerged.
The 2nd support at 4595.5 is recognized as another pullback support, adding to its potential as a support level.
On the resistance side, the 1st resistance at 4819.8 is identified as a swing high resistance and aligns with the 61.80% Fibonacci Projection, potentially acting as a barrier where selling interest could materialize.
The 2nd resistance at 5006.6 is noteworthy for the presence of the 78.60% Fibonacci Projection, adding significance to this potential resistance level.
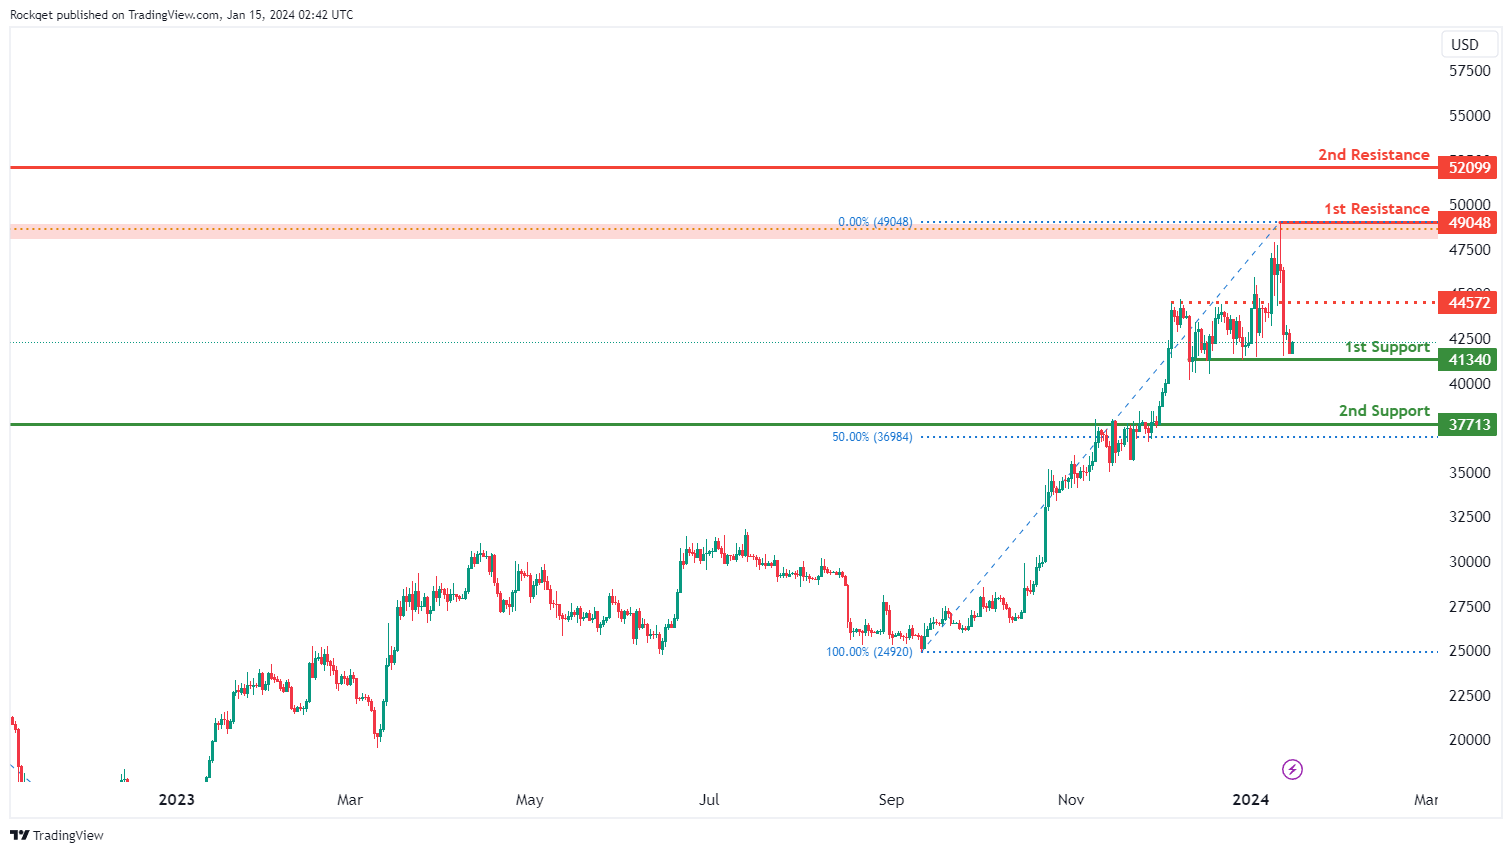
BTC/USD:
The BTC/USD chart currently indicates a bearish overall momentum, suggesting a potential downward trend. There is a scenario in which the price could make a bearish reaction off the 1st resistance and drop towards the 1st support.
The 1st support at 41340 is considered favorable as it is identified as a multi-swing low support, implying historical significance as a level where buying interest has previously emerged.
The 2nd support at 37713 is recognized as a pullback support, adding to its potential as a support level.
On the resistance side, the intermediate resistance at 44572 is identified as a pullback resistance, suggesting a level where selling interest could materialize.
The 1st resistance at 49048 is considered significant as it aligns with a swing high resistance, potentially acting as a barrier. The 2nd resistance at 52099 is also recognized as a swing high resistance.
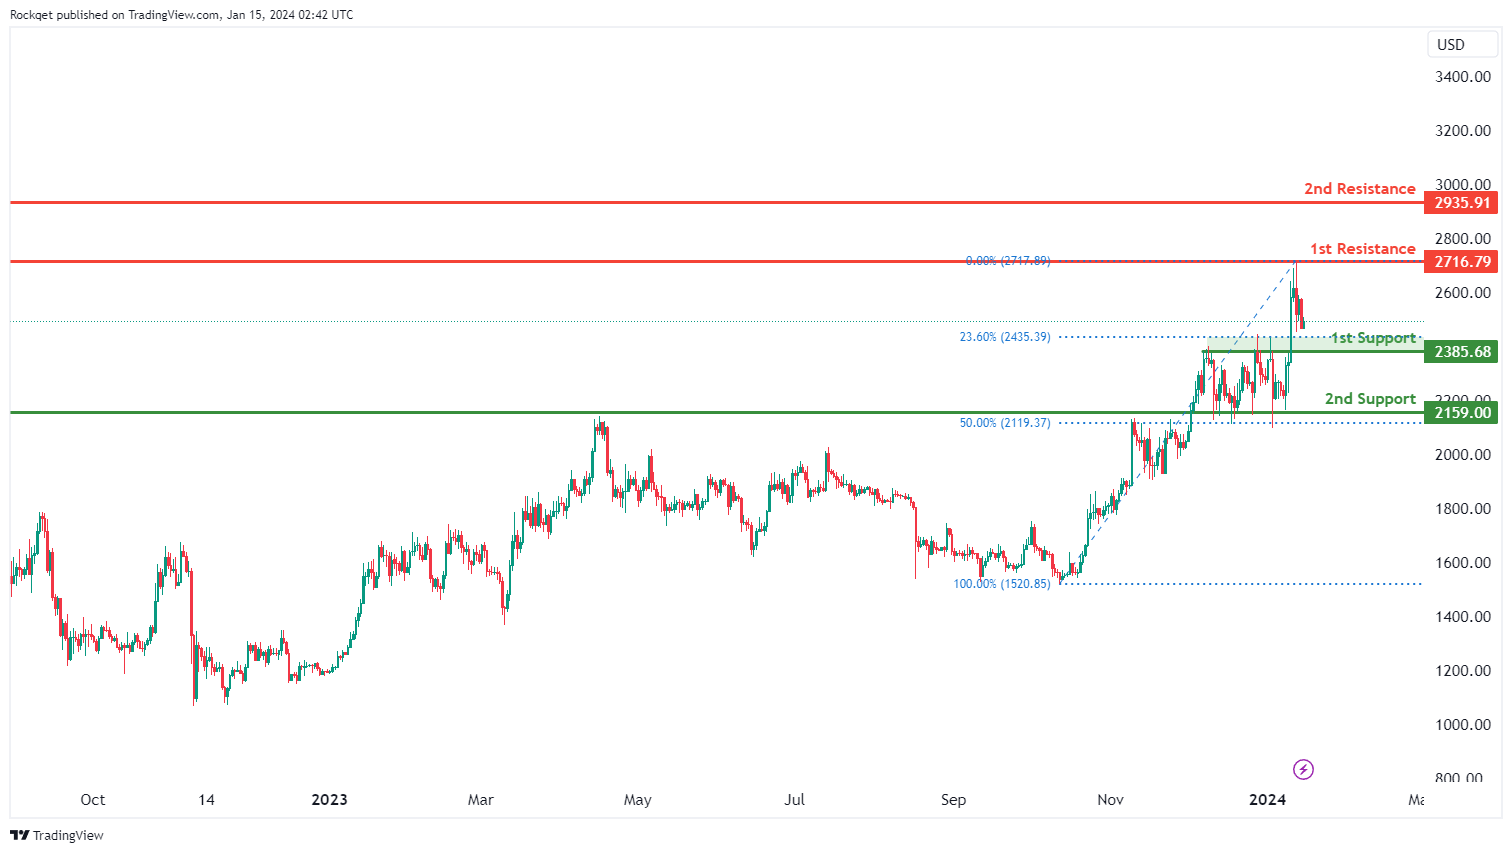
ETH/USD:
The ETH/USD chart currently exhibits a bearish overall momentum, indicating a potential downward trend. There is a scenario in which the price could make a bearish continuation towards the 1st support.
The 1st support at 2385.68 is considered advantageous due to its identification as a pullback support and its alignment with the 23.60% Fibonacci Retracement, suggesting historical significance as a level where buying interest has previously emerged.
The 2nd support at 2159.00 is recognized as an overlap support, adding to its potential as a support level.
On the resistance side, the 1st resistance at 2716.79 is deemed significant as it aligns with a swing high resistance, potentially acting as a barrier where selling interest could materialize. The 2nd resistance at 2935.91 is also recognized as a swing high resistance.
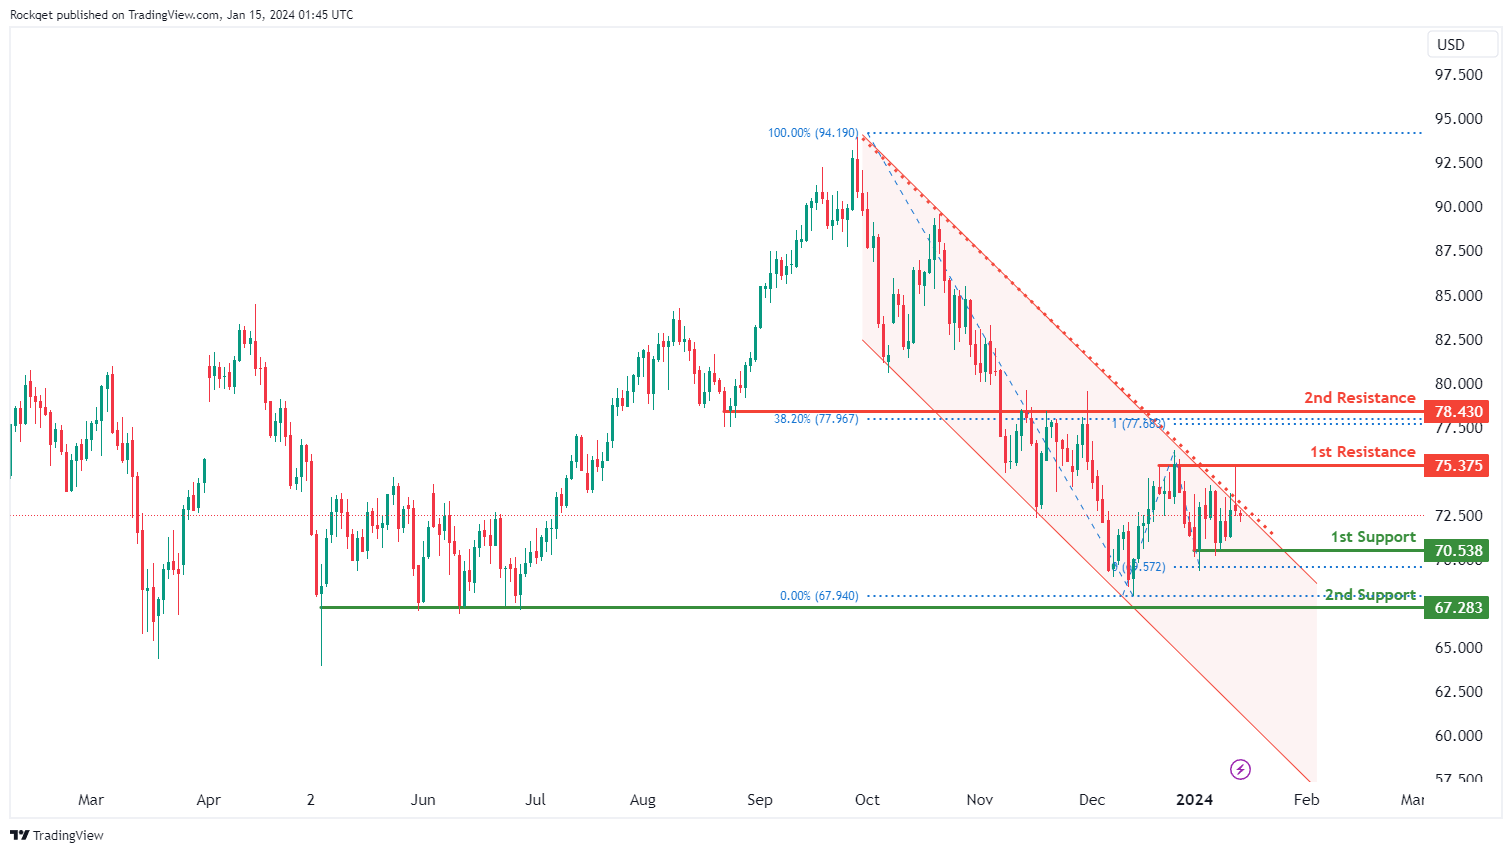
WTI/USD:
The WTI (West Texas Intermediate) chart currently exhibits a bearish overall momentum, indicating a downward trend in the price of oil. This bearish momentum is characterized by the fact that the price is within a bearish descending channel, suggesting the potential for further declines.
The 1st support level at 70.53 is considered significant as it has acted as a multi-swing low support in the past. This level may attract buying interest and provide temporary support for the price if it reaches this point.
The 2nd support at 67.28 is also categorized as a multi-swing low support, reinforcing its significance as a potential support zone in case of a price drop.
On the resistance side, the 1st resistance at 75.37 is marked as a multi-swing high resistance, signifying the potential for price reversals or resistance at this level.
The 2nd resistance at 78.43 is categorized as an overlap resistance. Notably, it aligns with the 38.20% Fibonacci Retracement level and the 100% Fibonacci Projection, indicating Fibonacci confluence. This makes it a strong potential barrier for the price.
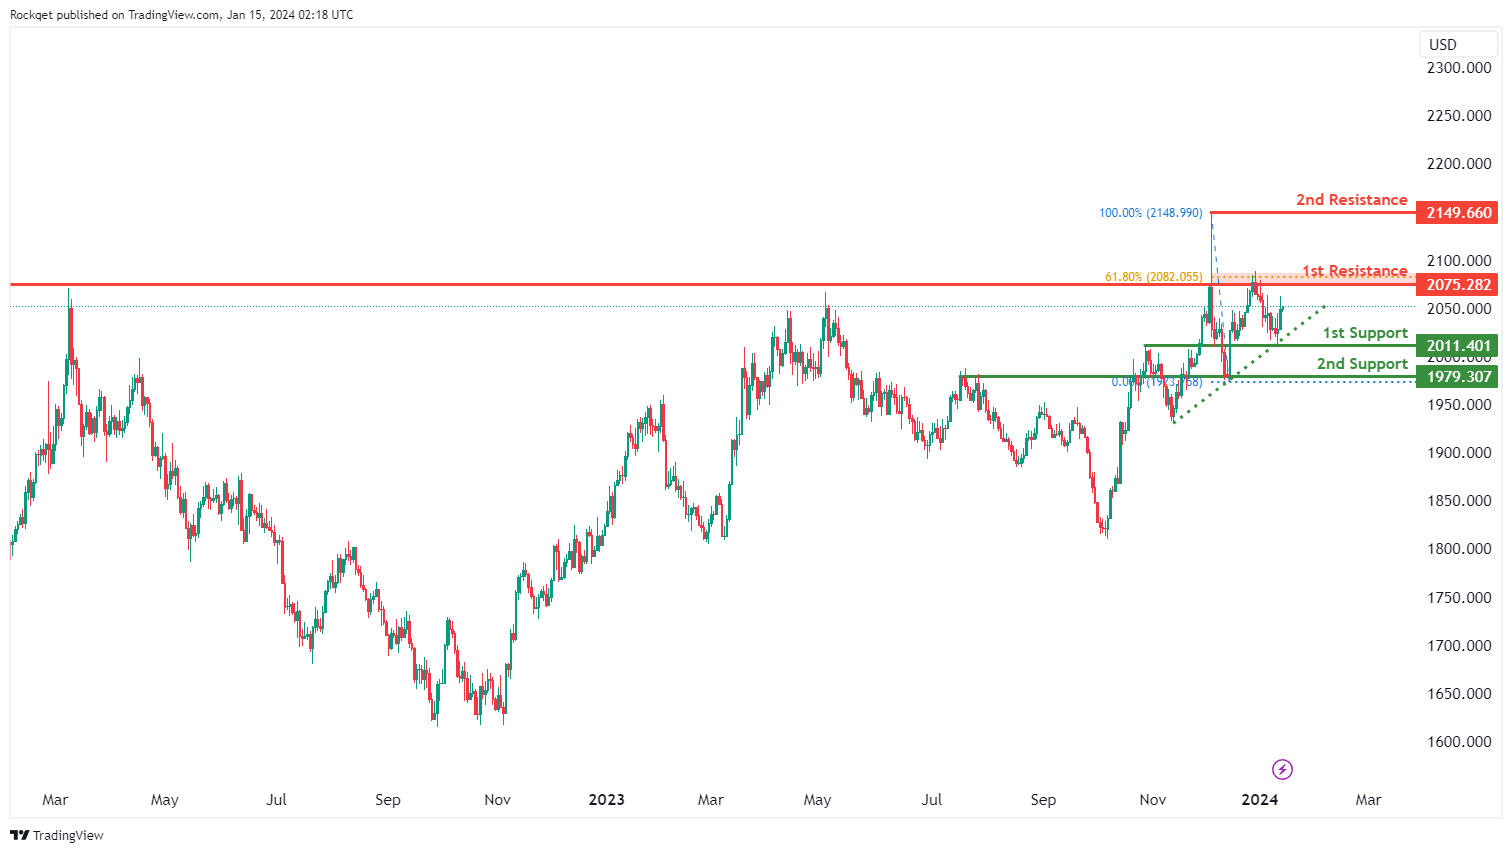
XAU/USD (GOLD):
The XAU/USD chart currently has a bullish overall momentum, indicating strength in the price of Gold (XAU) relative to the US Dollar (USD). This bullish momentum is supported by the fact that price is above a major ascending trend line, suggesting that further upward movement may be in store.
The 1st support at 2011.40 is identified as an overlap support level. This means it has acted as a significant level of support in the past and could potentially provide buying interest if the price retraces.
The 2nd support at 1979.30 is also categorized as an overlap support, further reinforcing its significance as a potential support area.
On the resistance side, the 1st resistance at 2075.28 is marked as an overlap resistance. Additionally, it aligns with the 61.80% Fibonacci Retracement level, making it a strong potential barrier for the price.
The 2nd resistance at 2149.66 is categorized as a swing high resistance. Swing highs often represent points of reversal or resistance in price movement.
EUR/USD Could Recover Unless This Level Gives Way
Key Highlights
- EUR/USD is holding the key 1.0880 support zone.
- A key rising channel is forming with support at 1.0935 on the 4-hour chart.
- GBP/USD is consolidating gains near the 1.2750 level.
- Gold prices could gain pace if it clears the $2,060 resistance level.
EUR/USD Technical Analysis
The Euro started a fresh decline from the 1.1140 level against the US Dollar. EUR/USD even declined below the 1.0950 level to move into a bearish zone.
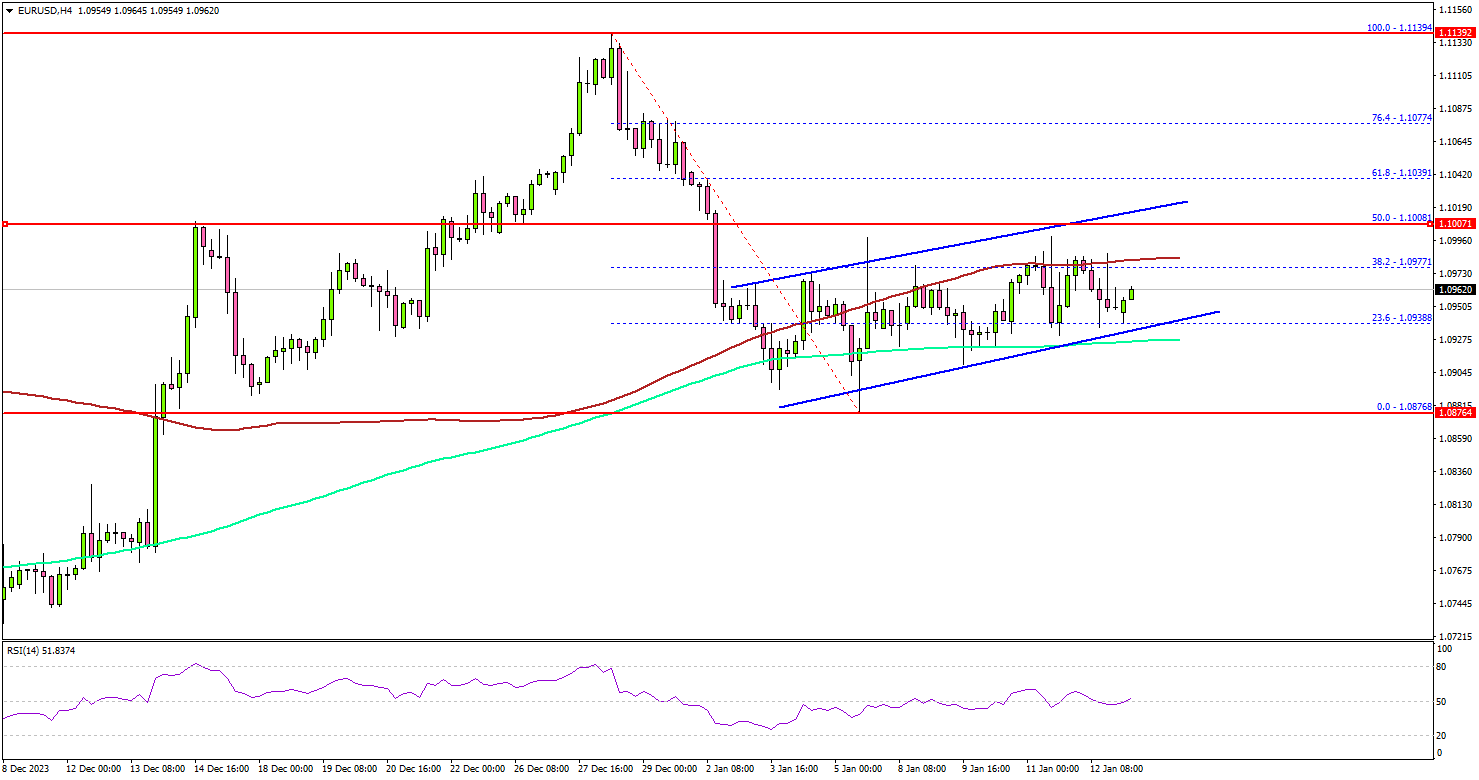
Looking at the 4-hour chart, the pair settled below the 100 simple moving average (red, 4 hours). However, the bulls were active above the 1.0880 support and the 200 simple moving average (green, 4 hours).
A low was formed near 1.0878 and the pair is now attempting a recovery wave. There was a move above the 1.0950 level. There is also a key rising channel forming with support at 1.0935 on the same chart.
On the upside, immediate resistance is near the 1.0000 level. The next key resistance is near the 1.1040 level. A close above the 1.1040 zone could open the doors for more upsides. The next stop for the bulls might be 1.1120.
If there is a fresh decline, the pair might test the 1.0935 support. The next major support sits at 1.0900. A downside break below the 1.0900 zone could spark a sustained decline. The next major support is 1.0880, below which the pair might decline and test 1.0835.
Looking at Gold, the bulls gained strength and they might now attempt a move above the $2,060 resistance zone.
Economic Releases
- Euro Zone Industrial Production for Nov 2023 (MoM) - Forecast -5.9%, versus -6.6% previous.
Contrary to market expectations, PBoC maintains MLF rate but increases liquidity
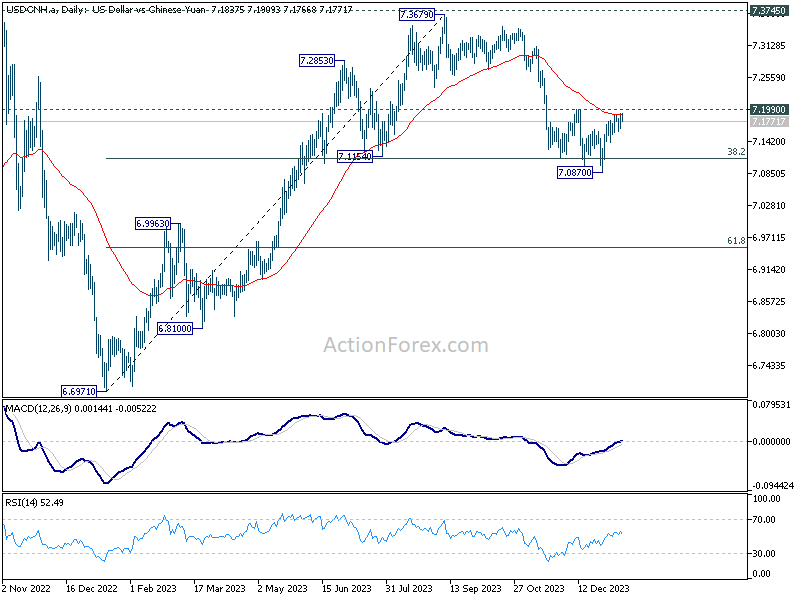
Despite the anticipation of a rate cut to bolster the weakening economy, currently grappling with deflation for the past three months, PBoC held firm, keeping the rate on CNY 995B worth of one-year medium-term lending facility loans steady at 2.50%. This decision defied the general expectation of a 0.1% cut to 2.40%.
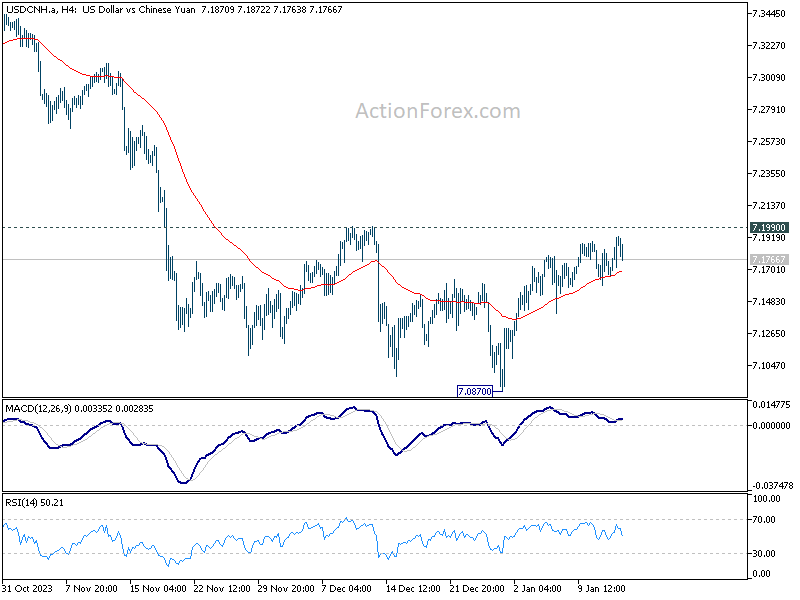
Opting not to alter the policy rate, the central bank instead chose to enhance liquidity in the banking system. This is seen from the net injection of CNY 216B of fresh funds, following the expiration of CNY 779B worth of MLF loans this month. Moreover, PBoC also infused CNY 89B yuan through seven-day reverse repos, maintaining a stable borrowing cost at 1.80%.
There is little reaction from USD/CNH to PBoC's announcement. Technically, USD/CNH is now at a critical juncture, pressing 55 D EMA, just ahead of 7.199 near term resistance. Near term outlook is staying bearish. Another decline and break of 7.0870 short term bottoming will resume the whole fall from 7.3679 to 61.8% retracement of 6.6971 to 7.3679 at 6.9533.
However, firm break of 7.1990 will argue that the fall from 7.3679 has completed and turn near term outlook bullish for retesting this high.
ECB’s Lane: Wage increases as determinants for rate cut timing and extent
In an interview with Corriere della Sera, ECB Chief Economist Philip Lane acknowledged that the December inflation data was "broadly in line with our projections". He highlighted a "continued progress" in easing of core inflation, yet pointed out existing "headwinds to services inflation."
A critical point raised by Lane concerns wage growth, which he notes is still rising well above any kind of long-run equilibrium rate". ECB is expecting "high wage increases" to continue in 2024. "the scale of that will determine the timing and the scale of rate adjustment this year," he added.
Lane also touched upon ECB's reliance on data. He mentioned that while new wage data is received weekly, the "most complete dataset" from Eurostat's national accounts will only be available at the end of April.
This timeline suggests that key policy decisions, especially those pertaining to rate cuts, are likely to be heavily influenced by data available by June meeting.
Finally, Lane's projection of a "significant recovery" in the European economy this year is tempered with caution, as he acknowledges downside risks to their forecasts. The question of whether 2024 will see a recovery or a continuation of the stagnation experienced in 2023 remains a "big data question" for ECB.
In a World Gone Bananas, Don’t Squash the Other Fruit
Policy interest rates needed to increase from their pandemic lows, but there is a question of how far central banks really need to lean against apparently strong demand. What appears to be demand-driven could be a ripple effect from supply shocks affecting other products.
When Cyclone Larry hit North Queensland in 2006, most of Australia’s banana crop was knocked out. Banana prices increased around 400%. This was enough to add more than ½ a percentage point to inflation in the June quarter of that year. It was also one of the cleanest examples of a supply shock that monetary policy should look through. (And at the time resulted in me uttering the sentence, “Of course we can see through bananas!”. But that’s another story.)
Less well known is that prices of other fruit increased in that period, even though those crops were not damaged by the cyclone. This happened because, at those prices, people stopped buying bananas and substituted into other fruit, pushing their prices up. As banana supply normalised, prices of those fruit normalised too.
The question is, should we interpret the impact on prices of those other fruit as “demand-driven”? After all, their prices increased and so did the quantity consumed, the pattern you would expect to see with a positive demand shock.
Through the pandemic period and following Russia’ s invasion of Ukraine, supply shocks were prominent. Factories and other businesses were closed, shipping was disrupted, and domestic logistics were constrained. But there was also stimulus to demand coming from the extraordinary fiscal and monetary policy support. If the prescription for monetary policy is to look through temporary supply shocks to the extent one can without inflation expectations rising, but respond to demand-driven inflation, how do you tell the difference in this situation? This issue becomes especially relevant given the RBA’s assessment that inflation is becoming “increasingly homegrown and demand driven”.
One approach to this is simply to follow the logic that if price went up and quantity consumed went down, it must be supply-driven, while if both increased, it was demand-driven. This is the essence of a methodology developed at the Federal Reserve Bank of San Francisco and used by the RBA. It implies that about half the surge in inflation of recent years stemmed from supply shocks, with the rest coming from strong demand. Different methods using model-based estimates attribute a bit more of the increase in inflation to supply shocks, but the conclusions are qualitatively similar. But is this the right way to interpret recent price moves? Or, with apologies to Jeanette Winterson, is this another case of bananas not being the only fruit?
The complicated way to assess this would be to estimate how much of the price movements in the “demand-driven” components of the CPI reflected demand shifting from supply-constrained components, and how much was from stronger underlying demand. This would become intractable faster than you can say “estimate cross-elasticities of demand”. Another way would be to estimate how much of the increase in overall inflation is explained by the usual drivers of demand, such as income, for example using standard demand-driven models such as a Phillips Curve. The RBA have done this calculation using their own models. As noted above, these exercises do suggest that supply shocks were a bit more important than the San Francisco Fed approach, with demand-driven inflation playing a smaller, but still important, role. But these estimates are only as good as your model.
The simpler way is to remember that inflation is an aggregate phenomenon that should abstract from relative price shifts. It is the balance of aggregate demand and supply that matters. One way to assess aggregate demand for consumption goods and services is by looking at total consumption. Unlike in some peer economies, it has been weak of late in Australia, especially in per capita terms. After initially bouncing back to its pre-pandemic trend when the economy opened up, more recently consumption has been weaker than many expected. This is largely because real household incomes have gone backwards, squeezed by inflation itself, rising taxation and higher interest rates. There are clearly pockets of strong demand and some households are still cashed up with pandemic-related extra savings. But there is always a diversity of experience across households, and these distributional issues should not entirely overthrow an assessment of the aggregate situation.
Last week we saw the November monthly CPI indicator surprise a little on the downside. As our Westpac Economics colleague Senior Economist Justin Smirk noted, the categories that were lower than expected included personal services categories that the RBA had previously been pointing to as evidence of resilient demand.
Slower demand for discretionary services might be a response to the squeeze on household incomes, including from high inflation. But it could also be partly an adjustment as overseas travel patterns normalise. The international borders reopened in 2022, but airline capacity has taken longer to recover. On some metrics, it has still not done so completely. As long as supply in this industry is constrained and airfares higher than pre-pandemic, we should not be surprised to see domestic holidaying and other domestic services demand pushed up as a substitute. And just like the other fruit, we should not be surprised if demand for these services slows as supply constraints on international travel subside.
One upside surprise in the month was in homebuilding costs, which reached 35% above their level four years previously in November 2019. Growth in this component actually picked up in the month. Given the low level of dwelling investment, it is hard to attribute this to strong demand. But neither can we point to global supply chain issues as the culprit anymore. In Canada, one of the few other countries that include homebuilding costs in their CPI, this component has been falling for some months and is up 24% over the same four-year period. Rather, the domestic homebuilding industry remains supply-constrained. The backlog of already approved projects remains high. Meanwhile some capacity has exited, either through bankruptcy or the bid from infrastructure and other non-residential construction projects.
The rapid inflation of rents can, by contrast, be seen as the effect of strong demand. The population surge has strained this market. Vacancy rates are low, and it is hard to see how supply could have kept up, even if the building industry had not been as constrained as it is. But we do not expect this surge to be repeated in 2024. While still elevated by historical standards, demand pressures will gradually subside. Over time this will take some pressure off rental inflation without further action from monetary policy.
Even if the inflation surge had been driven solely by supply shocks, central banks would still have needed to raise policy rates. Both fiscal and monetary policy had been extremely accommodative. This extraordinary pandemic-era support was no longer needed. It was also important to demonstrate resolve and prevent inflation expectations rising. In thinking about how contractionary policy needs to be – and for how long – this expectations channel is important, and there is more to say about it. But it is just as important to be clear on how much of the current inflation is truly demand-driven. Otherwise, policymakers risk squashing the other fruit, to no real benefit.
A Black Friday Technical Aside
This “other fruit” issue is different from the well-known “substitution bias” issue in CPIs. Substitution bias arises because the CPI is compiled using fixed weights for each category. It does not allow for shifting spending patterns in response to large price changes, at least not at first. The spike in banana prices therefore fed through to the CPI as if people were still buying the same number of bananas. The ABS does reweight the CPI to account for these changes, and in recent years it has done so more often than it did back when Cyclone Larry hit, especially for fruit and vegetables, where it now has access to supermarket scanner data. But even with this improvement in data collection methods, measured CPIs tend to overstate people’s experience of this kind of price spikes.
A similar issue is becoming more prominent recently, with the increasing shift of pre-Christmas spending from December into the Black Friday sales in November. This time, the substitution is across time not fruit: people are buying the cheaper on-sale item instead of the full-price item the following month. Retail sales data show that spending is increasingly shifting into the discounted period. Even if household goods prices were being measured monthly, a quarterly CPI would miss the dampening effect on prices of spending being increasingly concentrated in the sales periods. The situation is even worse than that in Australia, though: many goods prices are currently only measured in the first month of the quarter, so Australia’s monthly and quarterly CPI data entirely miss the discounting in November. Prices come back in December, so longer-term trends are less distorted. But these measurement issues will matter for interpretation of December quarter CPI results.
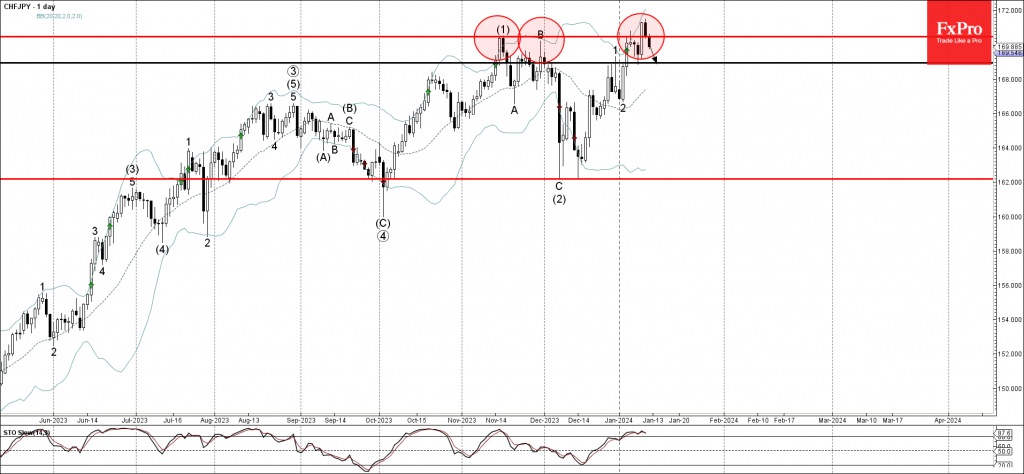
CHFJPY Wave Analysis
- CHFJPY reversed from resistance level 170.50
- Likely to fall to support level 168.95
CHFJPY currency pair recently reversed down from the key resistance level 170.50 (former double top from November).
The downward reversal from the resistance level 170.50 created the daily candlesticks reversal pattern Dark Cloud Cover.
Given the overbought daily Stochastic, CHFJPY currency pair can be expected to fall further to the next support level 168.95.
Dollar’s Indecisive Week, Rate Cut Bets Hold Despite Inflation Surprises
Dollar demonstrated a distinct lack of decisiveness in its trading last week, encapsulating a theme of uncertainty that has become characteristic since the start of the year. The greenback has indeed close the week within prior week's range against most major counterparts, with Canadian Dollar being the only exception.
This pattern of indecision is largely rooted in the lack of clarity over Fed's rate path, even though monetary easing is widely expected this year. The stronger-than-expected inflation data has not deterred market participants from bettering on a rate cut in March. However, this viewpoint is not uniformly held, as economists present a divided front.
The overall development also led to cautious and subdued risk sentiment across financial markets. This ongoing ambiguity could continue to maintain a low volatility environment for Dollar in the near term.
Meanwhile, Japanese Yen experienced varied fortunes, initially facing downward pressure due to receding speculation of an imminent rate hike by BoJ. The week was riddled with mixed messages from various media sources regarding BoJ's stance, contributing to market confusion and volatility. Despite this, Yen managed to mount a recovery towards the week's end, benefiting from decline in global benchmark treasury yields.
The broader currency markets saw British Pound emerged as the standout performer, receiving a mild boost from GDP data that surpassed expectations. Euro followed closely as the second strongest, trailed by Dollar.
Conversely, Australian Dollar bore the brunt of market skepticism, ending the week as the weakest link. Its performance was influenced by the downturn in Chinese stock markets and a tepid response to slightly better-than-expected Chinese economic data. Canadian Dollar and the Swiss Franc also found themselves on the weaker end of the spectrum.
Dollar's indecision persists amid Fed's policy uncertainty
Dollar has been characterized by a notable lack of clear direction, oscillating between brief rallies and selloffs without establishing a sustained trend. This indecision in greenback's movement is largely attributed to the mixed signals from recent economic data and the uncertainty surrounding Fed's monetary policy path for the year ahead.
Despite an initial surge at the outset of 2023, Dollar has struggled to sustain its momentum. Recent economic releases, including the surprisingly strong CPI and solid non-farm payroll data, failed to catalyze a lasting rally. Equally, weaker-than-anticipated ISM services data did not trigger a significant downturn.
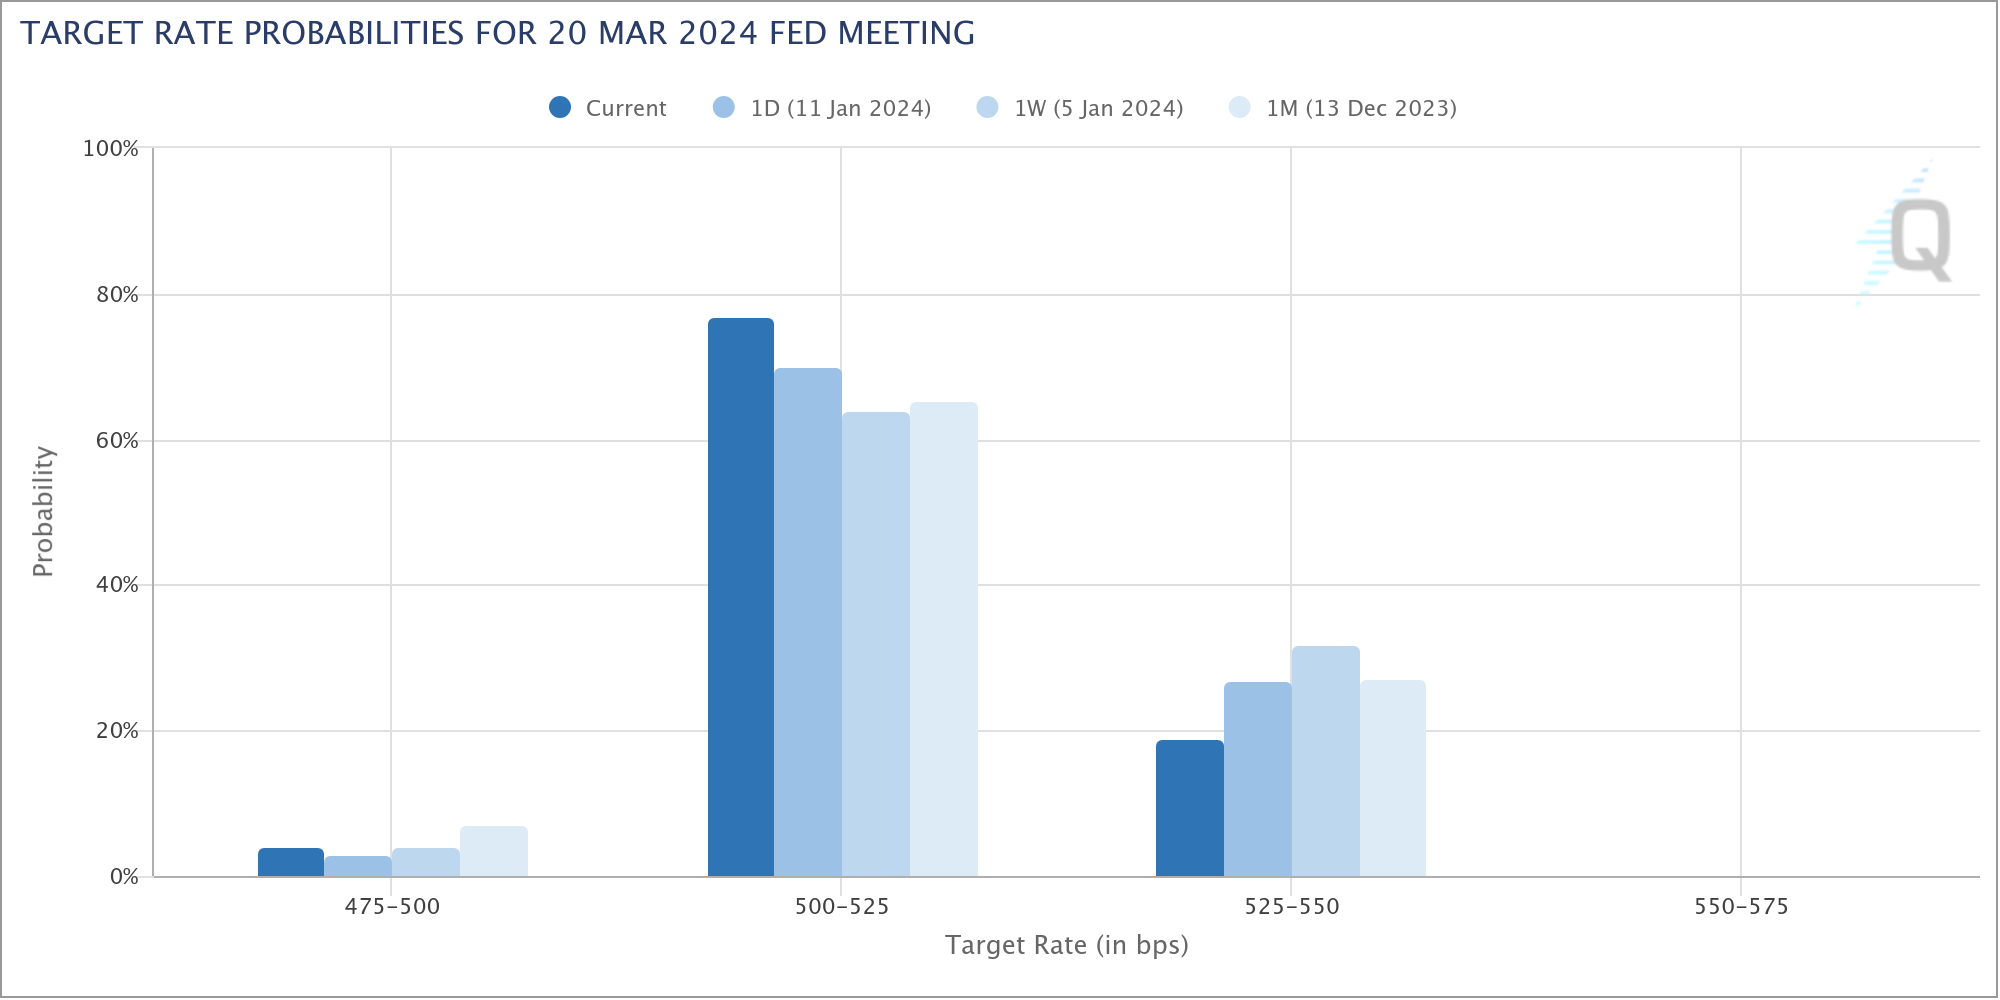
The anticipation of Fed's monetary policy path remains a central theme. Fed fund futures have been aggressive, pricing in over 80% likelihood of a rate cut as early as March, with an expected total easing of 1.50% by the end of 2024. This aggressive stance contrasts with more conservative forecasts from some economists, who anticipate the initiation of rate cuts in June, followed by potentially two more within the year, aligning more closely with Fed's own projections
Federal Reserve officials have maintained a balanced stance in their recent communications. While acknowledging the forecasts for rate cuts in 2024, they have emphasized the prematurity of fixing a timeline and pace for policy adjustments, especially considering the current month is only January. The lack of clear expectations on Fed's path could keep Dollar's movement indecisive for some time.
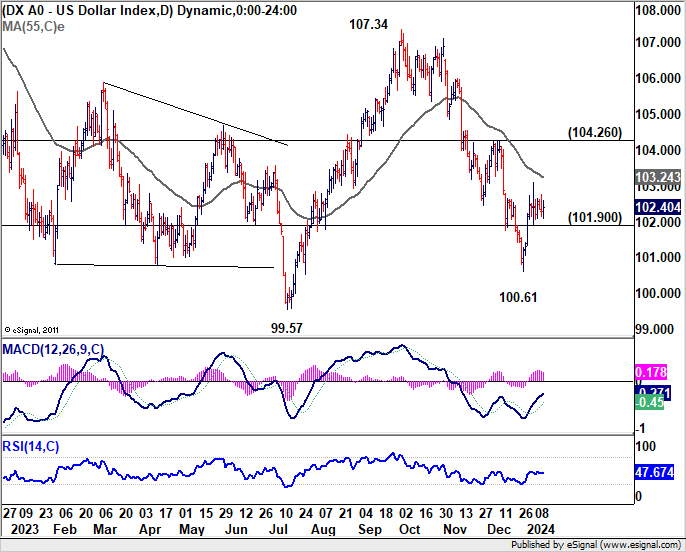
Dollar index stayed in tight range below 103.10 temporary top last week. Overall outlook is unchanged that fall from 107.34 is seen as the second leg of the consolidation pattern from 99.57. Below 101.90 minor support would bring deeper selloff through 100.61. But downside should be contained by 99.57 low to bring rebound. Meanwhile, break of 55 D EMA (now at 103.24) is the first sign that fall from 107.34 has completed. Sustained trading above 104.26 resistance will argue that rise from 100.61 is already the third leg of the pattern and target 107.34.
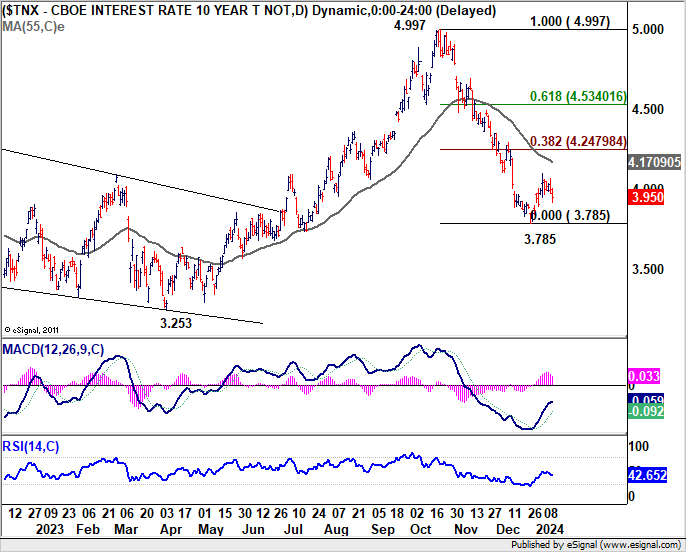
Meanwhile, 10-year yield closed notably lower at 3.95 last week after failing to stay firm above 4% handle. Nevertheless, outlook is unchanged that a short term bottom was formed at 3.785 and the consolidation pattern from there is going to extend for a while. Any retreat at this stage should be contained above 3.785. Another rise is expected to 55 D EMA (now at 4.170), and possibly higher, until meeting strong resistance from 38.2% retracement of 4.997 to 3.785 at 4.247.
Nikkei soars to 30-year high amid speculation of BoJ's hesitance on rate hike
Japanese financial market has seen significant movements this week, with Nikkei index reaching its highest level in over three decades. This surge is primarily attributed to growing speculation around BoJ's monetary policy, as latest reports of unexpectedly muted wage growth in November have fueled doubts about the emergence of a wage-price cycle robust enough for the central bank to consider an interest rate increase.
Several media reports have further influenced market perceptions. Bloomberg, citing unnamed sources, reported that BoJ officials might be contemplating a downward revision of core CPI forecast for the fiscal year starting April 2024. The forecast could be adjusted from the previous 2.8% to 2.5%, owing to the recent decline in oil prices.
Channel News Asia also provided insights from their sources, suggesting that while core inflation forecast for fiscal 2024 might be lowered, CPI core-core forecast would likely remain close to 2% target, at 1.9% for both fiscal 2024 and 2025. According to CNA's sources, consumer spending is holding up well, and there is a growing conviction that wage hikes will continue and possibly broaden this year. Another source indicated that the overall uptrend in inflation and wages remains intact.
These conflicting reports and the ambiguity they bring could limit any significant recovery attempts by Yen in the short term. The market is keenly awaiting BoJ's updated quarterly projections, scheduled to be released during its meeting on January 22-23. Moreover, the outcomes of Spring wages negotiations will play a crucial role in shaping BoJ's decision-making, particularly regarding a potential rate hike in April.
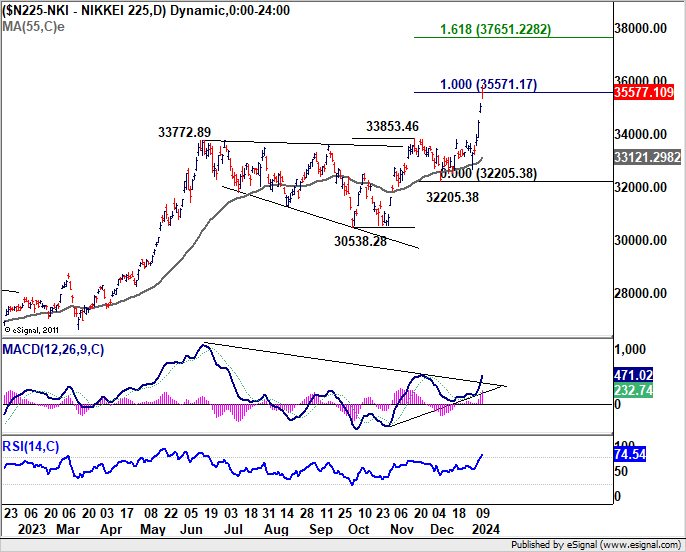
In the meantime, Nikkei finally broke out of its six-month range and surged to highest level in more than three decades, on speculation that BoJ is not ready to hike interest soon. For the near term, outlook in Nikkei will stay bullish as long as 33853.25 resistance turned support holds. Sustained trading above 100% projection of 30538.28 to 33853.46 from 32205.38 would prompt upside acceleration to 61.8% projection at 37651.22.
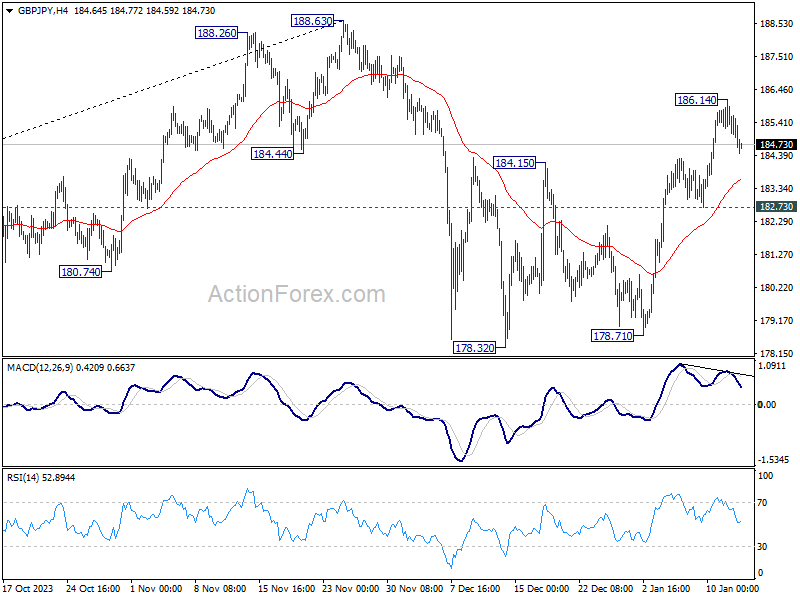
In the currency markets, GBP/JPY's strong rally confirmed that corrective fall from 188.63 has completed at 178.32 already. Rise from there could be the second leg of the corrective pattern from 188.63. But even in this less bullish case, further rally is expected as long as 182.73 support holds. Above 186.14 will resume the rebound to retest 188.63 high.
Safe haven demand boosts Gold in wake of US-led Yemen strikes
Gold rebound strongly, driven by escalating geopolitical tensions in the Middle East. The pivotal catalyst for this rally was the US and UK-led military actions against Houthi rebel targets in Yemen. The airstrikes, involving approximately 70 strikes, aimed to disrupt the Iran-backed Houthi group's aggressive activities in the critical Red Sea shipping lanes.
The response from the Houthis was one of defiance, as they threatened to intensify their attacks and declared all US and UK interests as "legitimate targets." This bold declaration raises the specter of a broader conflict, potentially drawing Western powers further into the complex Middle East situation.
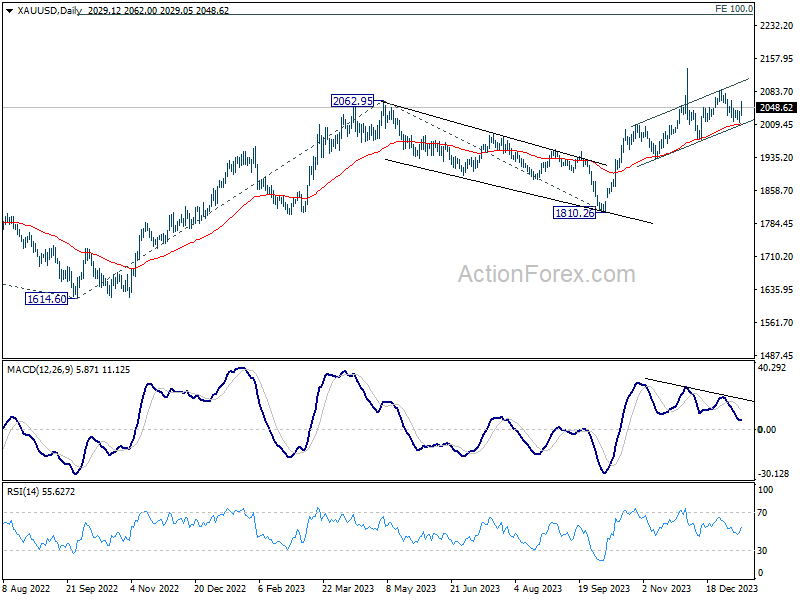
From a technical analysis standpoint, Gold's rebound argues that corrective pull back from 2088.24 has completed at 2013.05 already, after defending near term rising channel support. Immediate focus is now on 2063.74 resistance. Firm break there should push Gold through 2088.24 to retest 2134.97 record high.
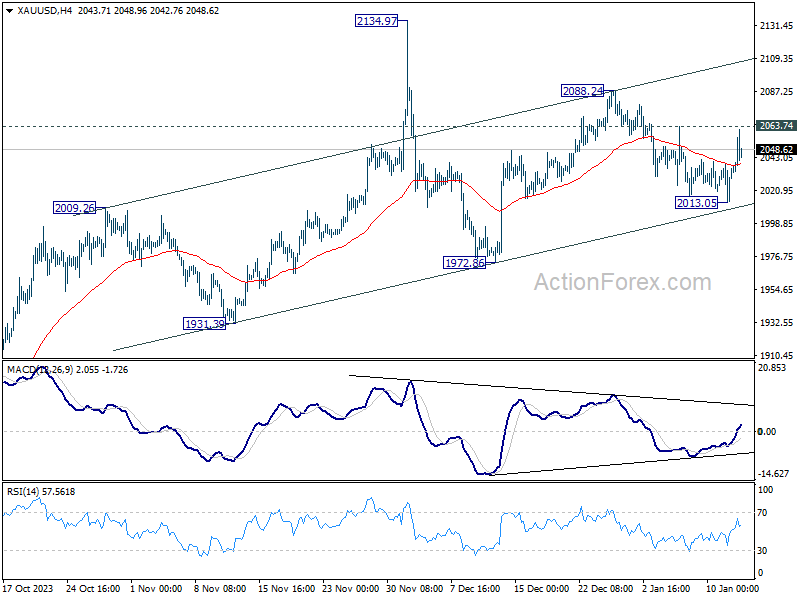
In the bigger picture, upside momentum hasn't been convincing as seen in D MACD. But Gold is holding above rising 55 D EMA, and maintaining near term bullishness. Current up trend is still in favor to continue to 100% projection of 1614.6o t0 2062.95 from 1810.26 at 2258.61.
AUD/USD Weekly Report
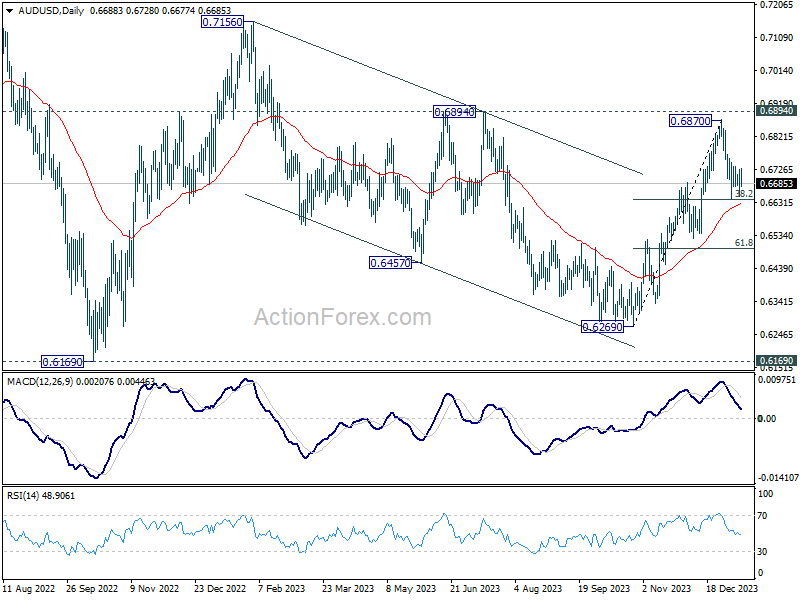
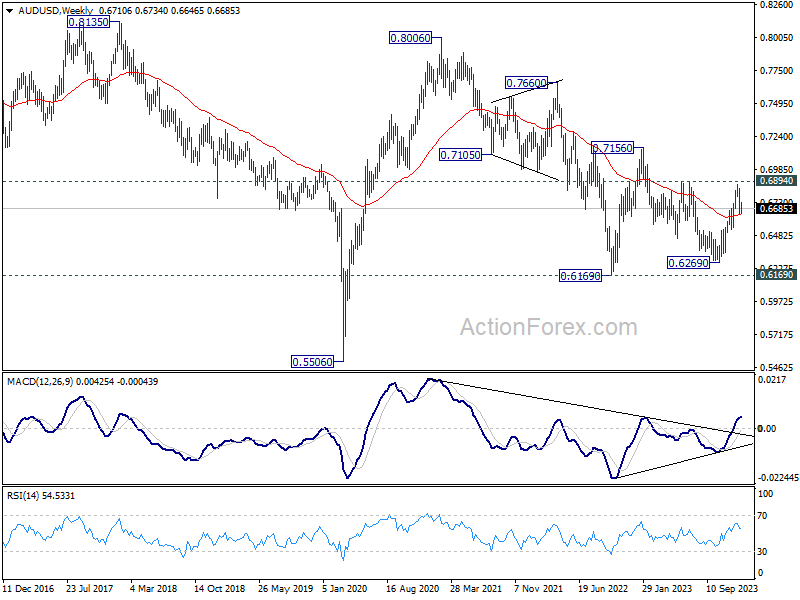
AUD/USD turned into sideway trading above 0.6639 last week. Initial bias remains neutral this week and further decline is expected as long as 0.6759 minor resistance holds. Firm break of 0.6639 will resume the fall from 0.6870 to 61.8% retracement of 0.6269 to 0.6870 at 0.6497 next. On the upside, break of 0.6759 will bring retest of 0.6870 resistance instead.
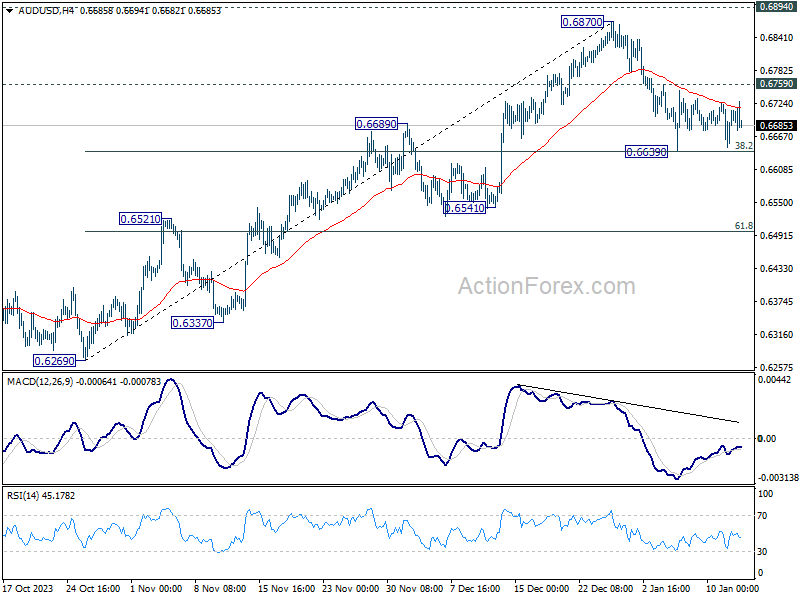
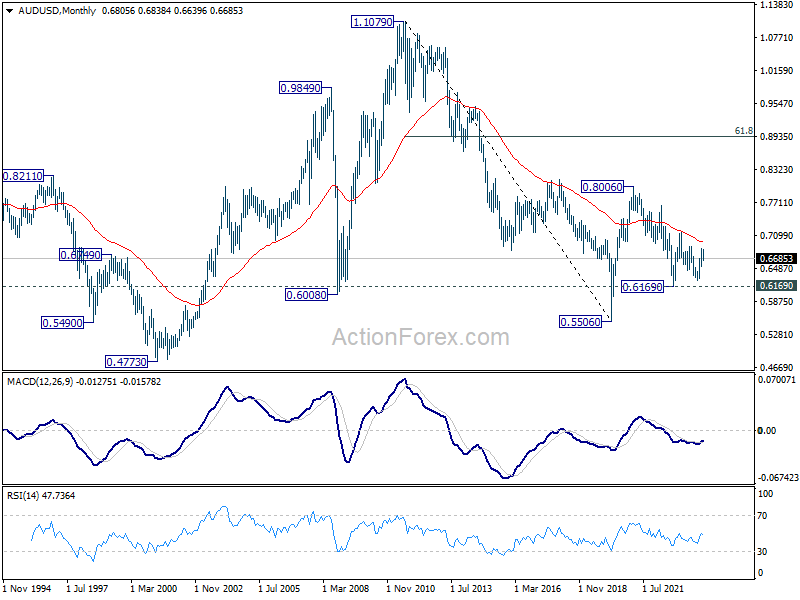
In the bigger picture, price actions from 0.6169 (2022 low) could be just a medium term corrective pattern to the down trend from 0.8006 (2021 high). Rise from 0.6269 is seen as the third leg of the pattern that could target 0.7156 on break of 0.6894 resistance. For now, range trading should be seen between 0.6169 and 0.7156 (2023 high), until further developments.
In the long term picture, the down trend from 1.1079 (2011 high) should have completed at 0.5506 (2020 low) already. It's unsure yet whether price actions from 0.5506 are developing into a corrective pattern, or trend reversal. But in either case, fall from 0.8006 is seen the second leg of the pattern. Hence, in case of deeper decline, downside strong support should emerge above 0.5506 to bring reversal.
EUR/USD Weekly Outlook
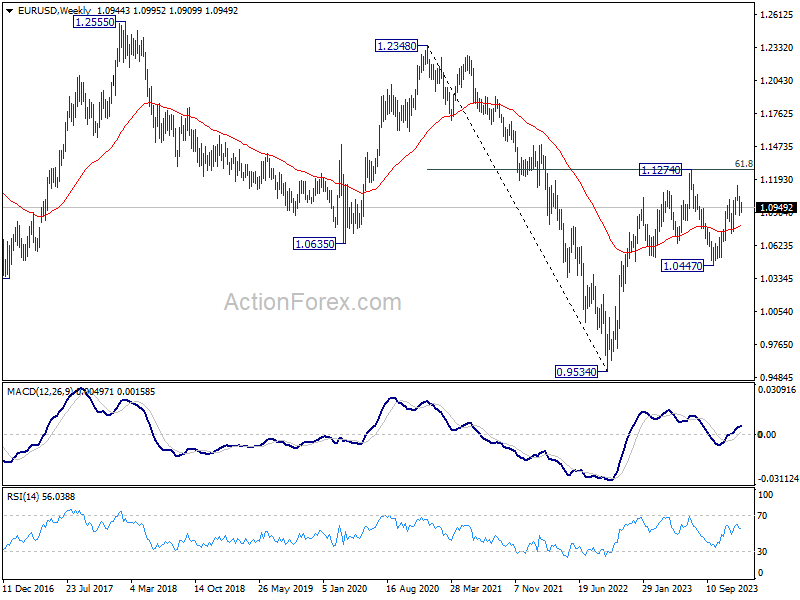
EUR/USD turned into range trading above 1.0876 last week. Initial bias stays neutral this week first, but further fall is in favor as long as 1.0997 minor resistance intact. Break of 1.0876 will resume the fall from 1.1138 to 1.0722 support next. Nevertheless, firm break of 1.0997 will turn bias back to the upside for retesting 1.1138 high instead.
In the bigger picture, price actions from 1.1274 are viewed as a corrective pattern to rise from 0.9534 (2022 low). Rise from 1.0447 is seen as the second leg. While further rally could cannot be ruled out, upside should be limited by 1.1274 to bring the third leg of the pattern. Meanwhile, sustained break of 1.0722 support will argue that the third leg has already started for 1.0447 and below.
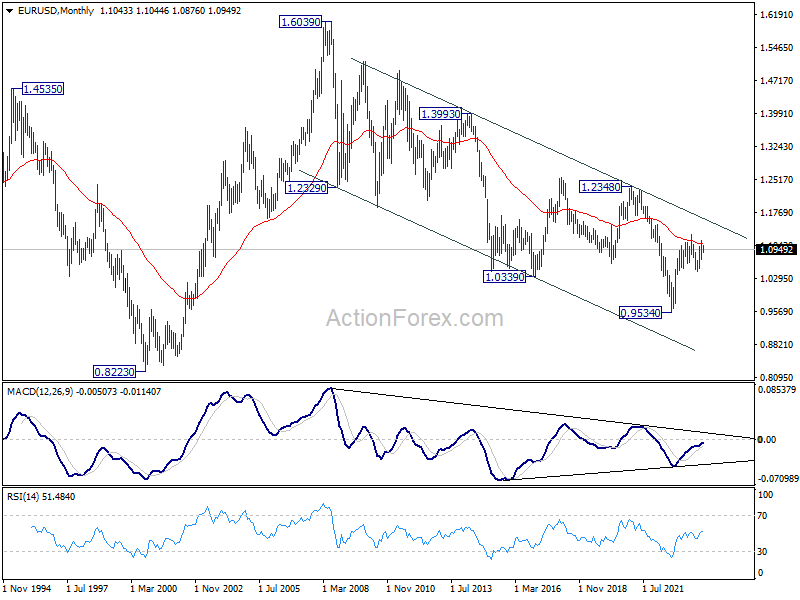
In the long term picture, a long term bottom is in place at 0.9534 on bullish convergence condition in M MACD. It's still early to call for bullish trend reversal with the pair staying inside falling channel in the monthly chart. Nevertheless, sustained trading above 55 M EMA (now at 1.1078) and break of 1.1274 resistance will raise the chance of reversal and target 1.2348 resistance for confirmation.