Sample Category Title
Gold Price Trims Gains, Can This Key Support Hold?
Key Highlights
- Gold prices rallied toward $2,150 before a downside correction.
- It broke a key bullish trend line with support near $2,035 on the 4-hour chart.
- Crude oil prices extended losses and traded below the $72.00 support.
- EUR/USD failed to stay above the key 1.0820 support.
Gold Price Technical Analysis
Gold rallied above the $2,000 and $2,050 resistance. It even spiked toward $2,150 before the bears appeared. A high was formed near $2,145 and the price corrected lower.
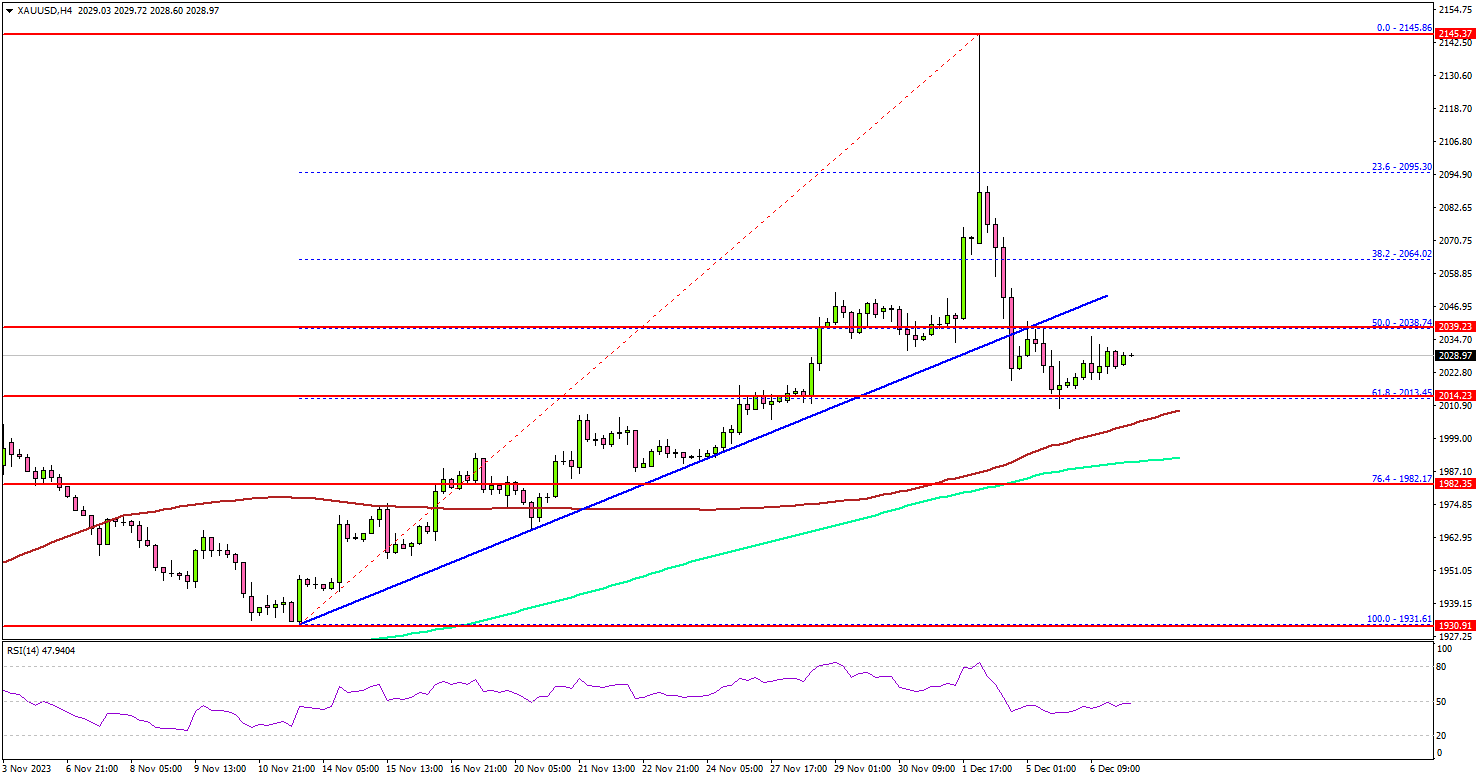
The 4-hour chart of XAU/USD indicates that the price declined heavily below the $2,120 and $2,100 levels. It broke a key bullish trend line with support near $2,035.
The bears were able to push the price below the 50% Fib retracement level of the upward move from the $1,931 swing low to the $2,145 high. The price is now testing the $2,010 support and trading above the 100 Simple Moving Average (red, 4 hours).
The 61.8% Fib retracement level of the upward move from the $1,931 swing low to the $2,145 high is also acting as a support. The next major support could be $1,985 or the 200 Simple Moving Average (green, 4 hours). Any more losses might call for a move toward the $1,960 level.
On the upside, the price is facing resistance near $2,040. An upside break above the $2,040 level could send the price soaring toward the $2,080 resistance. The next major resistance is near the $2,095 level, above which Gold could test $2,120.
Looking at crude oil, the bears remained in action, and they were able to push the price below the $72.00 support.
Economic Releases to Watch Today
- US Initial Jobless Claims - Forecast 222K, versus 218K previous.
WTI oil breaks 70, focus shits to 63/67 support zone
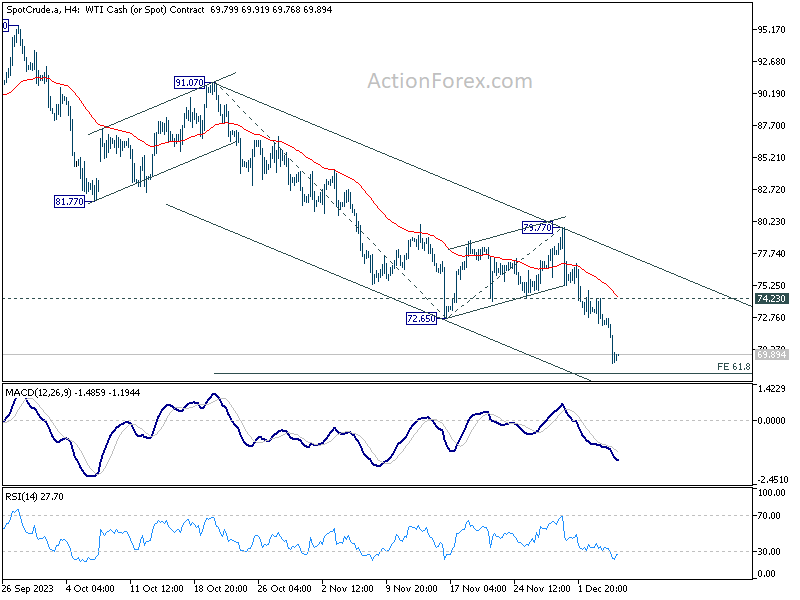
WTI crude oil fell sharply overnight, breaking 70 psychological level for the first time since June. Further decline is expected in the short-term from technical perspective. But 63/67 support zone is expected to provide a floor to contain this downtrend.
This selloff is driven by several key factors. The primary concern is demand destruction in the fuel market, underscored by EIA reporting a larger-than-expected increase in US gasoline inventories. Additionally, persistent worries about China's economic health are adding to the bearish sentiment in the oil market. This concern is exacerbated by Moody's downgrade of China's A1 rating outlook from stable to negative. Market skepticism regarding the effectiveness of OPEC+'s production cuts also plays a role.
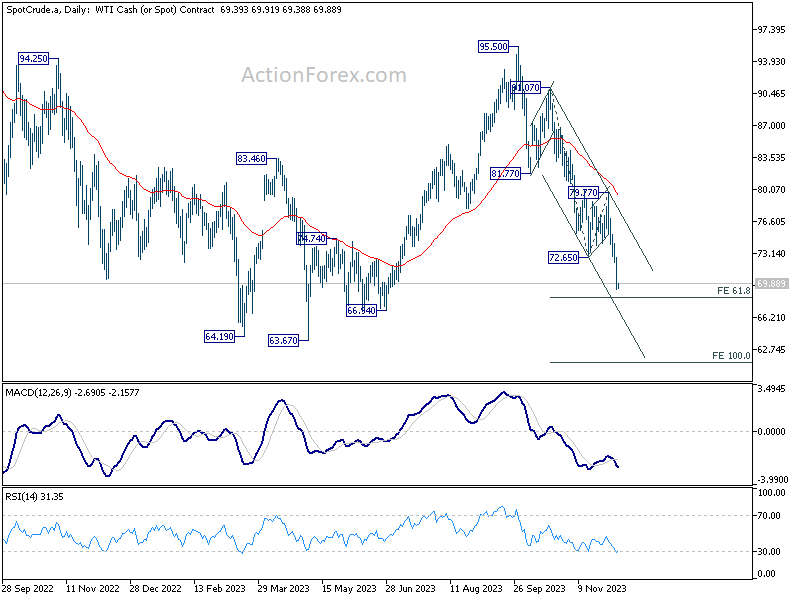
Technically, WTI's strong break of 72.65 support confirms resumption of the fall from 95.50. Further decline is expected as long as 74.23 resistance holds. Break of 61.8% projection of 91.07 to 72.65 from 79.77 at 68.38 is envisaged.
Strong support is expected from 63.67/66.94 zone to contain downside to complete the five wave sequence from 95.50, and bring sustainable rebound. Even if 63.67 is breached, 100% projection at 61.35 should provide the floor, preventing further substantial drops in oil price.
BoJ’s Ueda sees multiple options for target interest rates post-negative rate era
BoJ Governor Kazuo Ueda noted there are various options for its interest rate targets once it transitions away from negative short-term borrowing costs. However, he emphasized that no decision has been made yet regarding this shift. Ueda reiterated BoJ's commitment to continuing its monetary easing under Yield Curve Control to support economic activity and foster a cycle of wage growth.
Speaking to the parliament, Governor Ueda noted the economy is to continue recovering moderately. But there is "extremely high" uncertainty surrounding the outlook. He emphasized, "We have not yet reached a situation in which we can achieve [our] price target sustainably and stably and with sufficient certainty."
Regarding shifts in BoJ's monetary policy, Ueda outlined that once the central bank moves away from its negative interest rate policy, it could consider various options for its interest rate targets. These include continuing to target the interest rate applied to reserves that financial institutions hold with the central bank or reverting to a policy that focuses on the overnight call rate. He clarified, "We have not made a decision yet on which interest rate to target once we end our negative interest rate policy."
ECB’s Villeroy foresees 2024 rate cut possibility, dismisses immediate action
ECB Governing Council member Francois Villeroy de Galhau indicated that the central bank will not pursue further interest rate hikes. In an interview with the French newspaper La Depeche du Midi, Villeroy stated, "Our decisions to increase interest rates are fully playing their role as a remedy against the disease that is inflation."
He added, "This is why, barring any shock, there will be no further increase in our rates — the question of a reduction may arise in 2024, but not now."
Villeroy expressed confidence in the progress made in the fight against inflation, noting that "we are well on our way... even if we are not yet finished." He urged patience with the duration of these measures, reiterating the ECB's commitment to bringing inflation back toward 2% by 2025 at the latest.
Furthermore, he pointed out that disinflation is occurring faster than anticipated due to two main factors: slowdown in energy prices, unaffected by conflicts in the Middle East, and deceleration of other prices, including services and manufactured products, as a result of ECB's monetary policy.
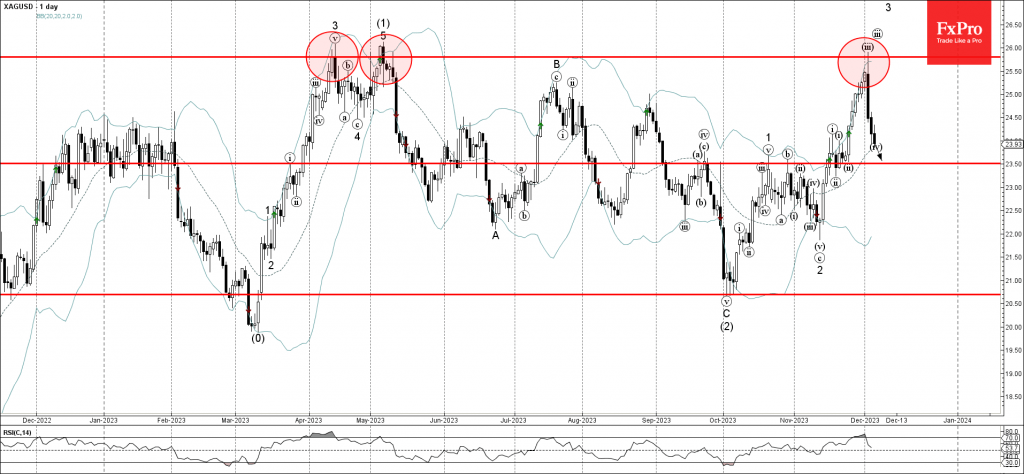
Silver Wave Analysis
- Silver reversed from resistance level 25.80
- Likely to fall to support level 23.50
Silver falling strongly after the price reversed down from the key resistance level 25.80, which reversed the price multiple times in April and May.
The downward reversal from the resistance level 25.80 started the active minor corrective wave iv.
Given the strength of the resistance level 25.80 and the bearish sentiment seen across the precious metal markets today, Silver can be expected to fall further to the next support level 23.50.
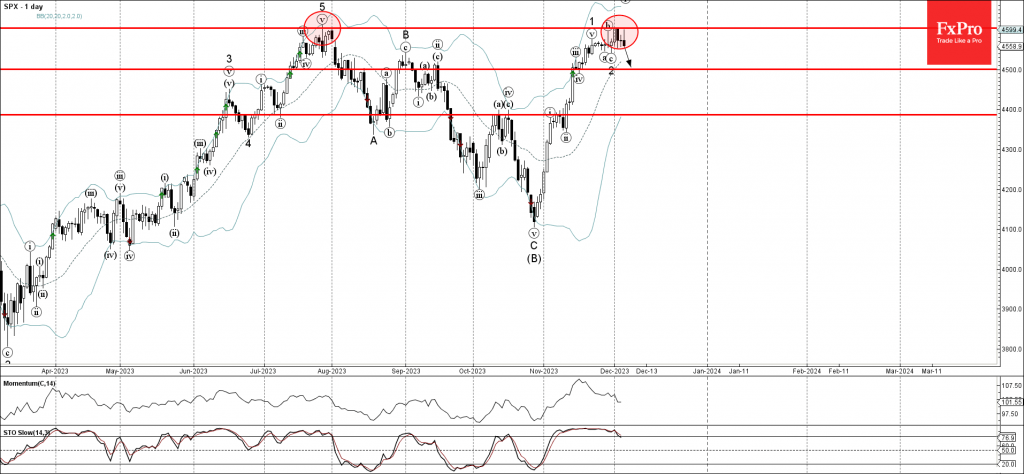
S&P 500 Wave Analysis
- S&P 500 reversed from long-term resistance level 4600.00
- Likely to fall to support level 4500.00
S&P 500 index under the bearish pressure after the earlier downward reversal from the long-term resistance level 4600.00, which stopped the sharp weekly uptrend in July.
The downward reversal from the resistance level 4600.00 stopped the previous minor impulse wave 3.
Given the strength of the resistance level 4600.00 and the still overbought daily Stochastic, S&P 500 index can be expected to fall further to the next round support level 4500.00.
Slowing Economy Keeps Bank of Canada On Hold in December
The Bank of Canada maintained the overnight rate at 5.0%, while stating that it will continue with Quantitative Tightening (QT).
The Bank highlighted the slowing in economic momentum stating, "economic growth stalled through the middle quarters of 2023 (and that) higher interest rates are clearly restraining spending". The Bank also noted that the labour market has cooled, as "job creation has been slower than labour force growth, job vacancies have declined further, and the unemployment rate has risen modestly."
On the improvement in inflation, it stated that "the slowdown in the economy is reducing inflationary pressures in a broadening range of goods and services prices". It did hedge this by stating that "shelter price inflation has picked up, reflecting faster growth in rent and other housing costs along with the continued contribution from elevated mortgage interest costs."
On the future path of policy, the Bank "is still concerned about risks to the outlook for inflation" and maintained the statement that it "remains prepared to raise the policy rate further if needed".
Key Implications
A hold today was the only option for the BoC. Given the economic backdrop, the BoC has likely gained greater confidence that its policy stance is sufficiently restrictive. There has been obvious weakness emanating from the housing market for a while now, but more recently, consumer spending has slowed alongside a further cooling in the labour market. But with inflation still above 3%, we get why the BoC isn't ready to declare victory. Instead, the BoC seems like it is preparing to sit on the sidelines for the next couple of months while maintaining its cautious rhetoric.
Markets don't think the BoC will be able to get too comfortable. The next move is clearly a cut, with odds pointing to the first move in April. We agree. The next few months are going to be challenging given our expectation that the unemployment rate will continue to rise, which will hit consumer spending and bring inflation down along with it. No wonder the Canada 2- and 10-year yields have fallen approximately 90 basis points over the last two months.
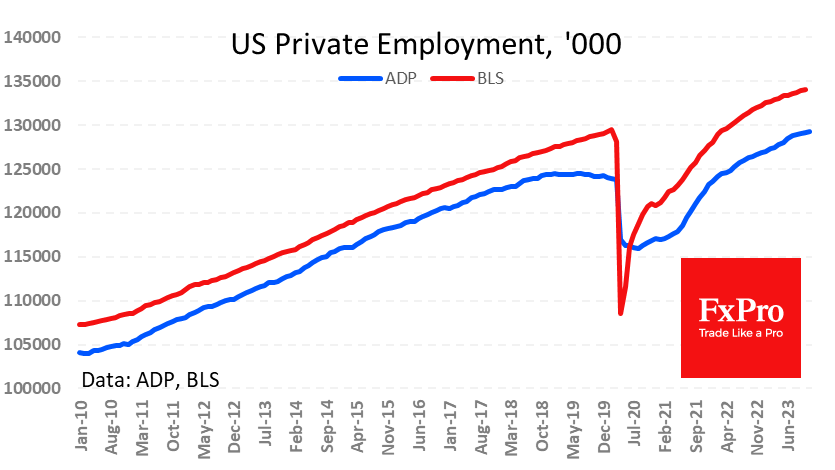
US Private Sector Slowed Hiring, ADP Says
ADP reported a 103k increase in new private sector jobs in the US, against expectations of 130k and 106k (revised from 113k) a month earlier.
This indicator was designed as the last insight on the jobs market before the official data. In the last three months, according to ADP, the private sector has been creating an average of 100k new jobs per month. We saw a similar slowdown at the end of 2018, followed by a year of stagnation and a reversal to decline before the pandemic hit.
The slowdown in the labour market comes as interest rates come under pressure and the potential for a quick recovery from the pandemic is exhausted.
The importance of the ADP reports to the markets is diminishing as they increasingly diverge from official data. The difference began to accumulate in 2018 when the official data continued the trend of employment growth with stagnant or declining numbers from an independent source.
Dow Jones is Close to a Peak
The Dow Jones index has switched into consolidation mode, joining the S&P500 and Nasdaq100, which did so almost two and three weeks ago, respectively. This could be consolidation before a spurt to new highs, but it’s more likely that we’re seeing a depletion of growth.
The Dow Jones index is trading just 0.8% away from its record close in December 2021 and 2% away from its all-time high, having added nearly 12% during the rally over the past five weeks. The rally has been so rapid that the RSI on the daily charts has exceeded 80, an extremely overbought zone. Sometimes, a move into this territory kicks off an even wilder rally, indicating extreme investor greed.
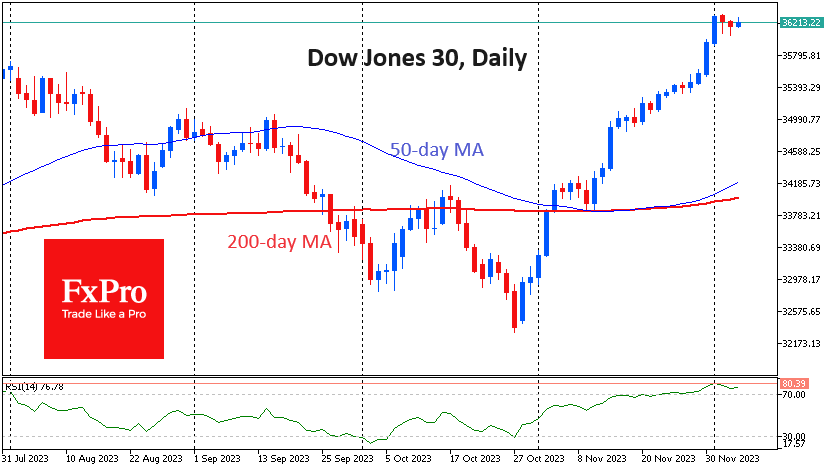
But a different pattern of behaviour seems to have been chosen this time. The Dow Jones index slowly slid on Monday and Tuesday. The S&P500 and Nasdaq100, the broader equity indices, did not connect to the upside and continued to consolidate at recent tops.
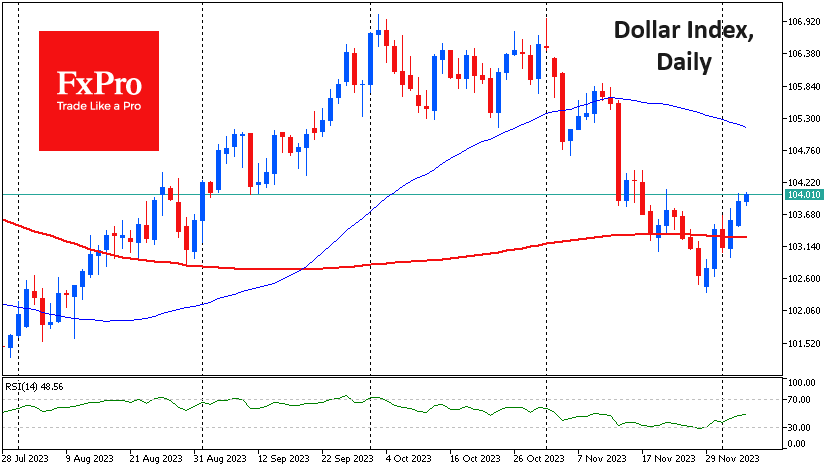
Equally important is the behaviour of the currency market, where the dollar has been adding since late November, which is usually a bearish factor for the market. And this is clearly visible in the dynamics of other indices. Dow Jones, contrary to simple logic, has accelerated its ascent these days.
Such character of movement reminds one of active liquidation of short positions. We saw ruthless equivalents of such liquidations in gold, with the capitulation peak on the 1st and at the beginning of trading on the 4th of December. We saw the opposite situation in April 2020, with negative prices in some oil futures.
That is, technically, from current levels, it is now more comfortable to be bearish in the Dow Jones, assuming that the index is more likely to fall by 5% than rise by another similar amount. Fundamentally, it’s also not easy to buy stocks whose prices include expectations that the Fed will cut rates by 150 points over the next year, with final demand and corporate profits remaining as strong.