
Sample Category Title
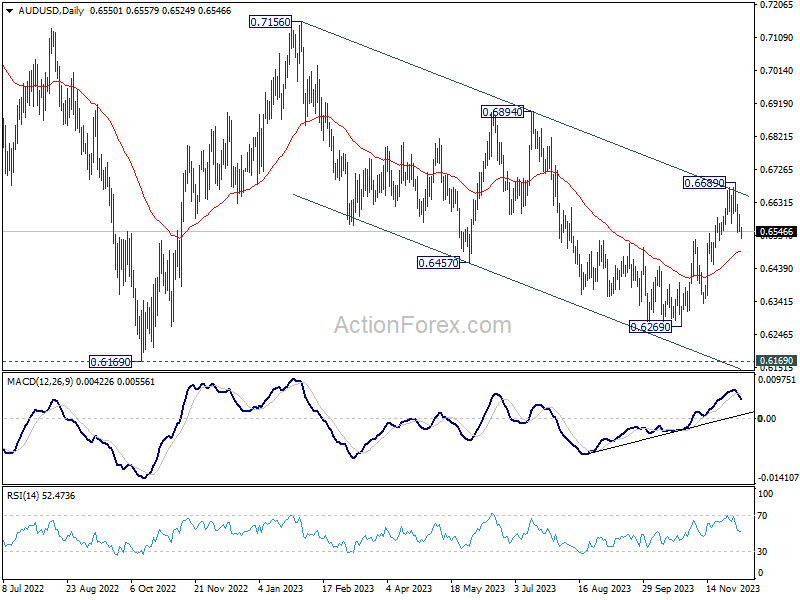
AUD/USD Daily Report
Daily Pivots: (S1) 0.6531; (P) 0.6565; (R1) 0.6582; More...
Intraday bias in AUD/USD remains on the downside as fall from 0.6689 short term top is in progress. Deeper decline would be seen to 55 D EMA (now at 0.6489). On the upside, above 0.6596 minor resistance will turn intraday bias neutral first. But risk is mildly on the downside as long as 0.6689 resistance holds, in case of recovery.
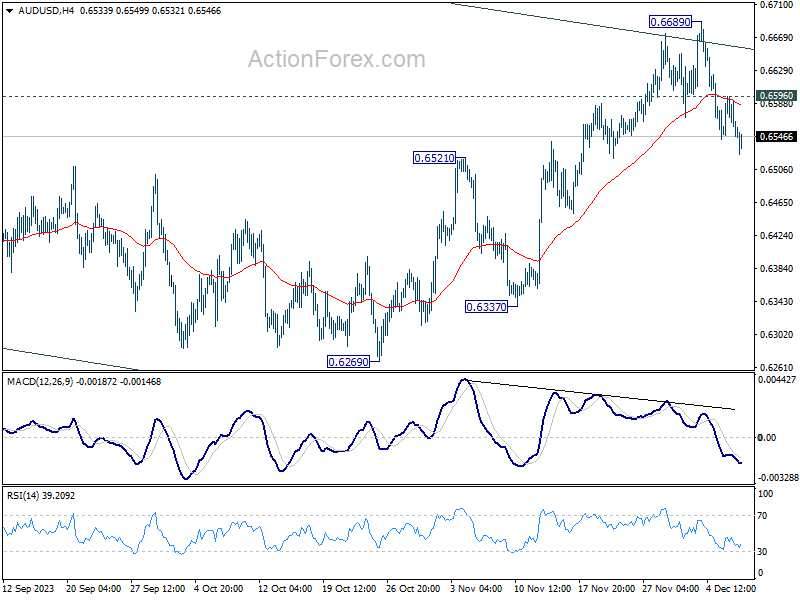
In the bigger picture, there is no confirmation that down trend from 0.8006 (2021 high) has completed. price actions from 0.6169 (2022 low) could be just a medium term corrective pattern, with rise from 0.6269 as the third leg. For now, range trading should be seen between 0.6169 and 0.7156 (2023 high), until further developments.
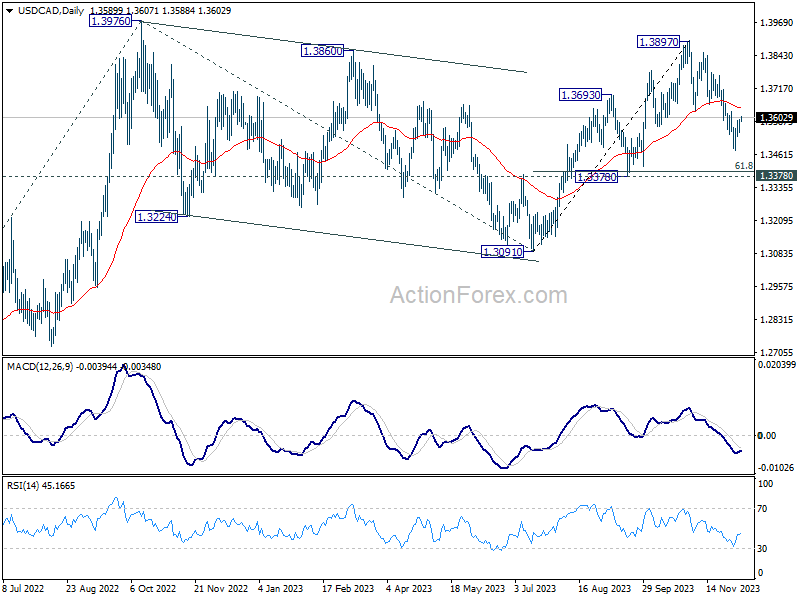
USD/CAD Daily Outlook
Daily Pivots: (S1) 1.3562; (P) 1.3581; (R1) 1.3613; More...
Intraday bias in USD/CAD stays neutral and outlook is unchanged. On the downside, below 1.3479 will resume the corrective fall from 1.3897. But downside should be contained by 1.3378 support, which is close to 61.8% retracement of 1.3091 to 1.3897 at 1.3399, to bring rebound. On the upside, break of 1.3625 resistance will indicate short term bottoming, and turn bias back to the upside for stronger rise.
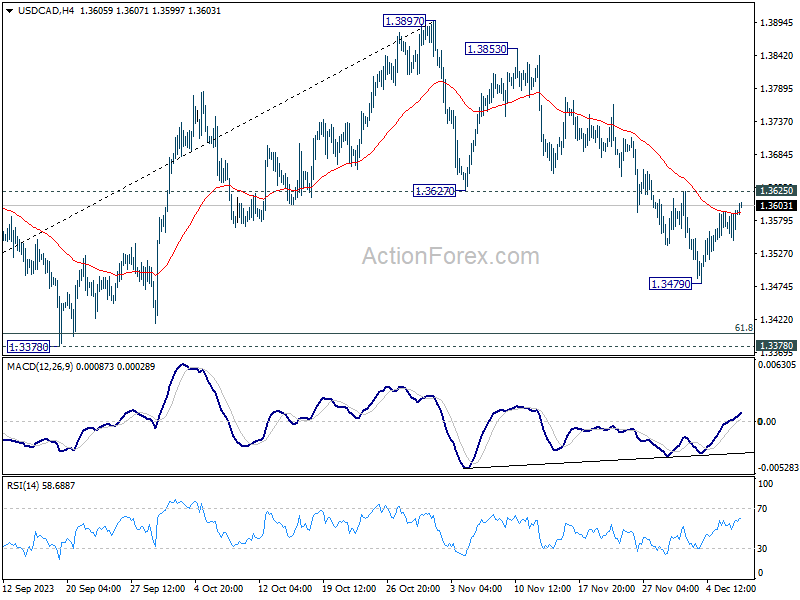
In the bigger picture, rise from 1.3091 is seen as the fifth leg of the whole rise from 1.2005 (2021 low). Further rally is expected as long as 1.3378 support holds, to 61.8% projection of 1.2401 to 1.3976 from 1.3091 at 1.4064. However, decisive break of 1.3378 will dampen this view and bring deeper fall back to 1.3091 instead.
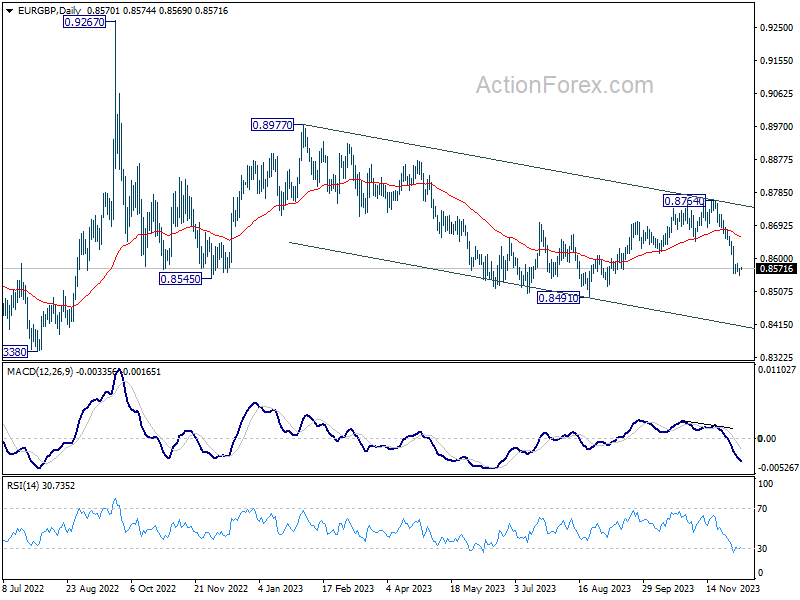
EUR/GBP Daily Outlook
Daily Pivots: (S1) 0.8556; (P) 0.8568; (R1) 0.8582; More....
Intraday bias in EUR/GBP stays on the downside with 0.8587 minor resistance intact, despite loss of downside momentum. Current fall from 0.8764 should target a retest on 0.8491 low. Firm break there will resume larger down trend. On the upside, above 0.8587 minor resistance will turn intraday bias neutral and bring consolidations first, before staging another decline.
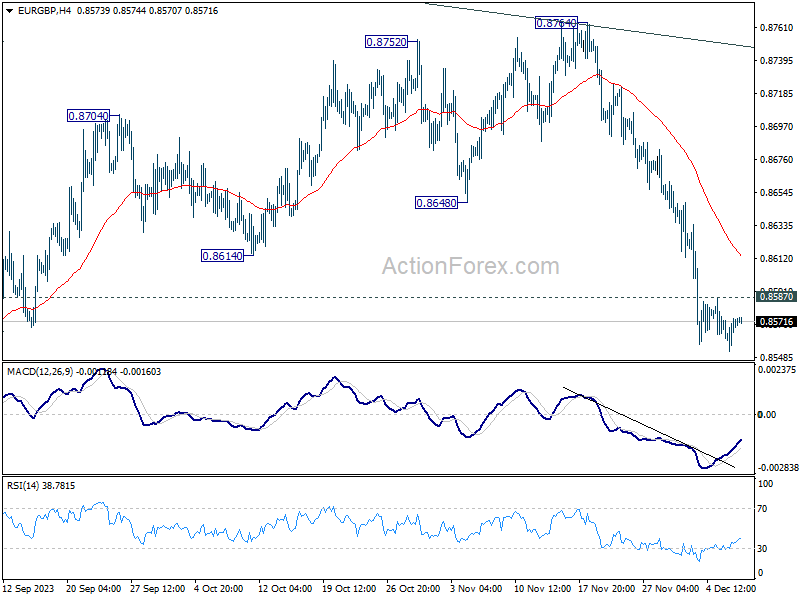
In the bigger picture, current development suggests that down trend from 0.9267 (2022 high) is still in progress. This decline is now seen as the third leg of the pattern from 0.9499 (2020 high). Break of 0.8201 will target 100% projection of 0.9499 to 0.8201 from 0.9267 at 0.7969. In any case, outlook will stay bearish as long as 0.8764 resistance holds.
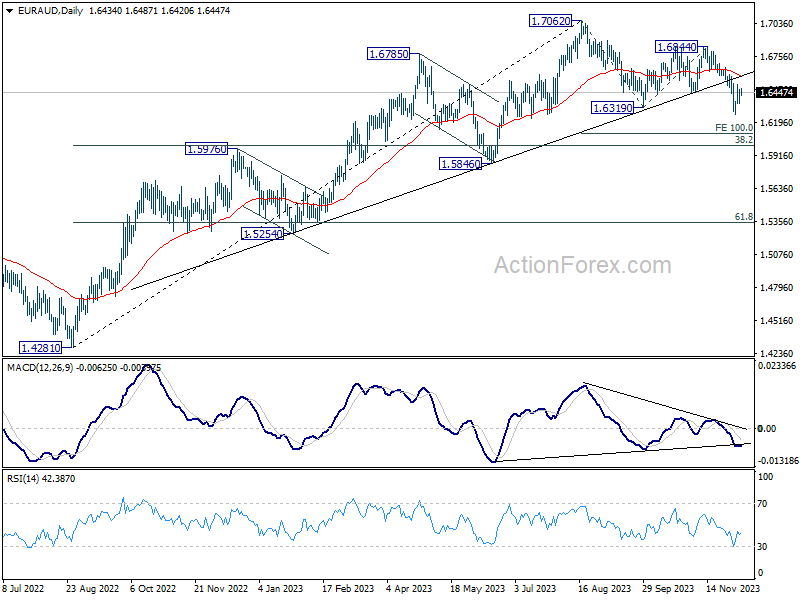
EUR/AUD Daily Outlook
Daily Pivots: (S1) 1.6370; (P) 1.6427; (R1) 1.6493; More...
EUR/AUD is staying in consolidation from 1.6267 and intraday bias remains neutral at this point. Outlook stays bearish as long as 55 D EMA (now at 1.6593) holds. On the downside, break of 1.6267 will resume larger decline from 1.7062 to 100% projection of 1.7062 to 1.6319 from 1.6844 at 1.6106 next.
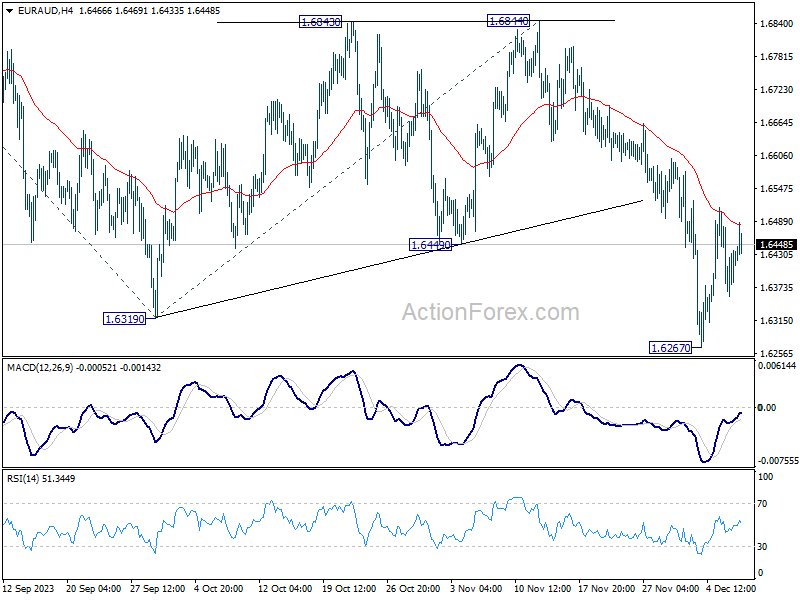
In the bigger picture, the break of medium term trend line support now suggests fall from 1.7062 correcting the whole up trend from 1.4281 (2022 low). Deeper decline would be seen to 38.2% retracement of 1.4281 to 1.7062 at 1.6000. Strong support could be seen there to bring rebound on first attempt. But risk will stay on the downside as long as 1.6844 resistance holds. Sustained break of 1.6000 would bring further fall to 61.8% retracement at 1.5343.
EUR/CHF Daily Outlook
Daily Pivots: (S1) 0.9405; (P) 0.9427; (R1) 0.9437; More...
Intraday bias in EUR/CHF stays on the downside with focus on 0.9407 low. Decisive break there will confirm resumption of larger down trend. On the upside, above 0.9467 minor resistance will delay the bearish case and turn intraday bias neutral for consolidation first.
In the bigger picture, medium term outlook remains bearish as long as 0.9683 resistance holds. Firm break of 0.9407 (2022 low) will resume long term down trend. Next target will be 61.8% projection of 1.1149 to 0.9407 from 1.0095 at 0.9018.
EUR/JPY Daily Outlook
Daily Pivots: (S1) 158.26; (P) 158.69; (R1) 159.01; More..
EUR/JPY's fall from 164.29 accelerates to as low as 157.34 so far. Intraday bias stays on the downside and deeper decline would be seen to 154.32 cluster support (38.2% retracement of 139.05 to 164.29 at 154.64). On the upside, above 158.56 minor resistance will turn intraday bias neutral and bring consolidations first, before staging another decline.
In the bigger picture, bearish divergence condition in 55 D EMA indicates that a medium term top could be formed at 164.29 already. Price actions from there are tentatively seen as a correction only. There is no clear sign that the up trend from 144.42 (2020 low) has completed yet. As long as 55 W EMA (now at 152.12) holds, another rally through 164.29 is still in favor as a later stage.
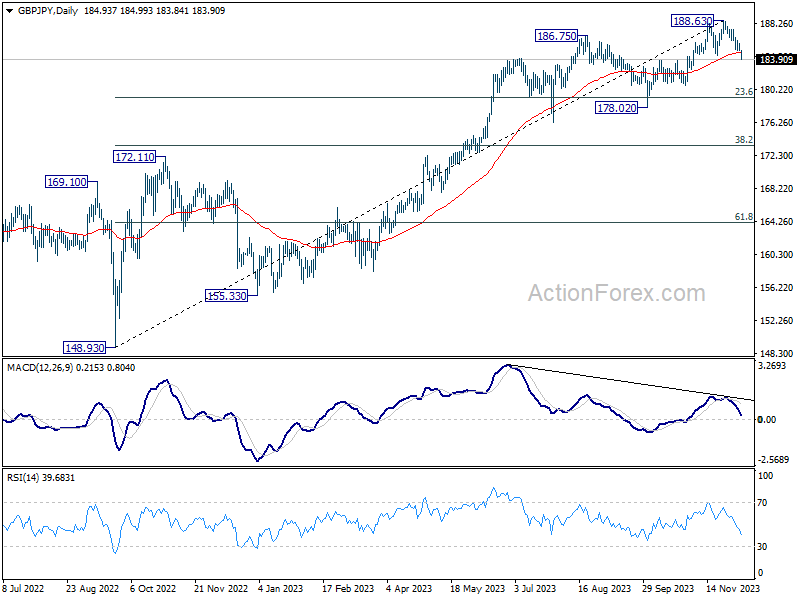
GBP/JPY Daily Outlook
Daily Pivots: (S1) 184.74; (P) 185.27; (R1) 185.56; More...
GBP/JPY's fall from 188.63 accelerates lower today and breaks through 184.44 support. Current development argues that a medium term is in place on bearish divergence condition in D MACD. Fall from 188.63 is likely corrective whole rise from 148.93. Intraday bias is now on the downside for 23.6% retracement of 148.93 to 188.63 at 173.46 next. On the upside, above 185.78 minor resistance will turn intraday bias neutral and bring consolidations first. But risk will now stay on the downside as long as 188.63 resistance holds.
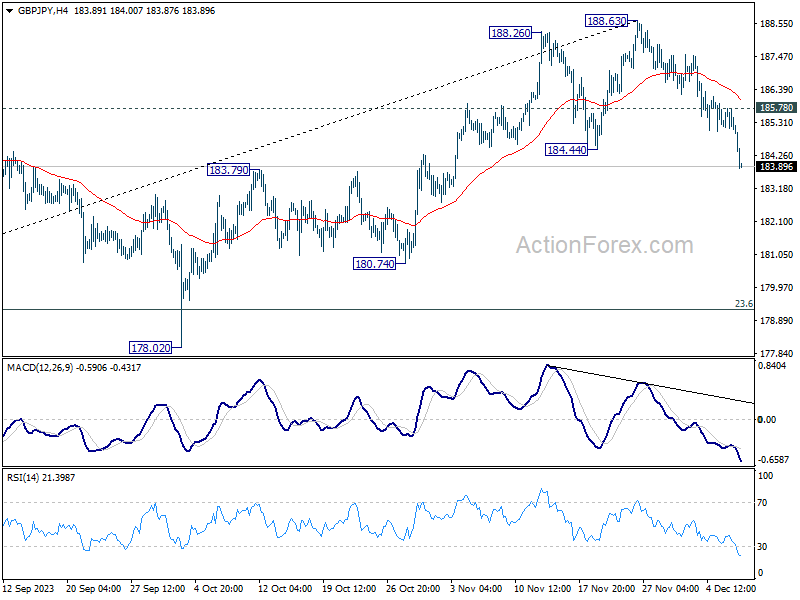
In the bigger picture, while a medium term top is in place at 188.63, there is no clear sign of long term bearish trend reversal yet. As long as 172.11 resistance turned support holds, price actions from 188.63 are seen as a corrective move only. Larger up trend from 123.94 (2022 low) could resume at a later stage.
Yen Climbs as Markets React to BoJ Ueda’s Talk and China’s Import Contraction
Yen and Dollar strengthened notably in Asian session today, amid a backdrop of risk aversion that's reflected in the continued downturn in Hong Kong's stock market and softness in Japan. A key factor impacting market sentiment is the unexpected slump in China's imports, including the decline in crude oil imports – the first such annual decrease since April. This drop is a significant indicator of China's waning domestic demand, raising alarm bells about the health of one of the world's largest economies.
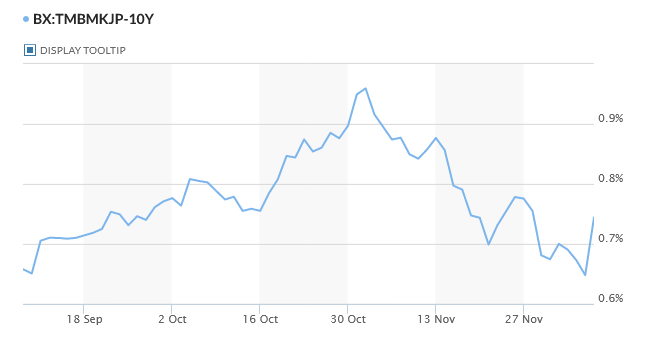
At the same time, Yen received additional boost following remarks by BoJ Governor Kazuo Ueda in parliament. While Ueda maintained BoJ's dovish position and emphasized the necessity of continuing ultra-loose monetary policy, his mere discussion about exiting negative interest rates caught the attention of traders. This mention, despite not indicating an immediate policy shift, has resonated within the financial markets, leading to a sharp rise in 10-year JGB yield , which surpassed 0.75% mark.
Conversely, Australian and New Zealand Dollars are facing increased selling pressure, possibly due to the regional impact of China's economic slowdown. Canadian Dollar's performance remains mixed, even in the face of an ongoing decline in oil prices. Among European currencies, Swiss Franc continues to outperform Euro and Sterling, following suit with the recent downtrend in European benchmark treasury yields.
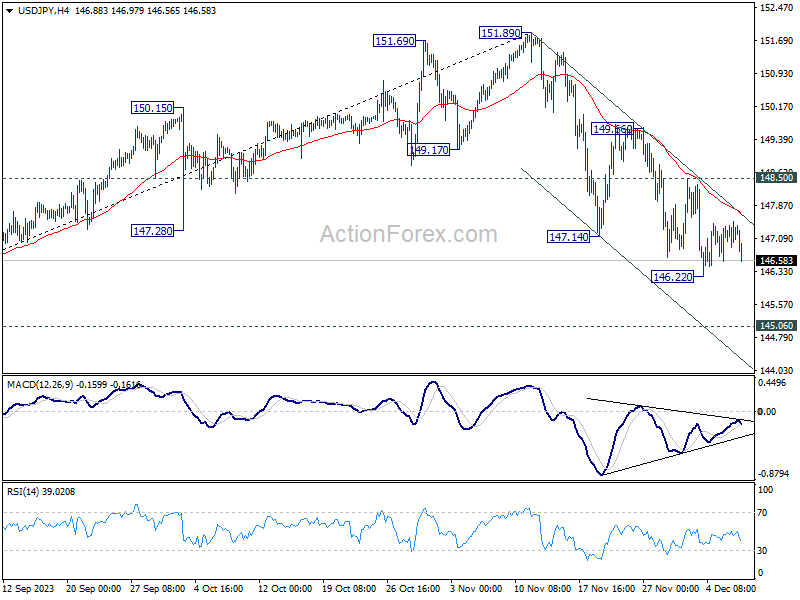
From a technical analysis standpoint, Yen's strength is evident across various crosses. GBP/JPY has broken below 184.44 support level. Similarly, AUD/JPY and NZD/JPY have breached their respective support levels at 96.01 and 90.06. A focus is now on when USD/JPY would break through 146.22 to temporary low to resume the whole fall from 151.89 to 145.06 key medium term support level.
In Asia, at the time of writing, Nikkei is down -1.79%. Hong Kong HSI is down -1.19%. China Shanghai SSE is down -0.21%. Singapore Strait Times is down -0.81%. Japan 10-year JGB yield is up 0.1016 at 0.750. Overnight, DOW fell -0.19%. S&P 500 fell -0.39%. NASDAQ fell -0.58%. 10-year yield fell -0.050 to 5.121.
China's Exports Rebound in November While Import Slump
China's export figures for November 2023 showed an unexpected rise, growing by 0.5% yoy to USD 291.9B, surpassing the anticipated -0.8% yoy decline. This increase marks the first growth in exports China has seen in seven months.
Notably, exports to US rose by 7% yoy. However, exports to EU and ASEAN experienced declines, falling by -14.5% yoy and -7.0% yoy, respectively.
Conversely, imports decreased by -0.6% yoy to USD 223.5B, significantly underperforming against the expected rise of 3.0% yoy. This decline in imports contributed to widening of trade surplus, which expanded from USD 56.5B to USD 68.4B, exceeding the forecasted USD 58.1B surplus.
Looking at the broader January to November period, China's exports contracted by -5.2% yoy, while imports declined by -6.0% yoy. The cumulative trade balance for this period stood at a surplus of USD 748.13B.
BoJ's Ueda sees multiple options for target interest rates post-negative rate era
BoJ Governor Kazuo Ueda noted there are various options for its interest rate targets once it transitions away from negative short-term borrowing costs. However, he emphasized that no decision has been made yet regarding this shift. Ueda reiterated BoJ's commitment to continuing its monetary easing under Yield Curve Control to support economic activity and foster a cycle of wage growth.
Speaking to the parliament, Governor Ueda noted the economy is to continue recovering moderately. But there is "extremely high" uncertainty surrounding the outlook. He emphasized, "We have not yet reached a situation in which we can achieve [our] price target sustainably and stably and with sufficient certainty."
Regarding shifts in BoJ's monetary policy, Ueda outlined that once the central bank moves away from its negative interest rate policy, it could consider various options for its interest rate targets. These include continuing to target the interest rate applied to reserves that financial institutions hold with the central bank or reverting to a policy that focuses on the overnight call rate. He clarified, "We have not made a decision yet on which interest rate to target once we end our negative interest rate policy."
ECB's Villeroy foresees 2024 rate cut possibility, dismisses immediate action
ECB Governing Council member Francois Villeroy de Galhau indicated that the central bank will not pursue further interest rate hikes. In an interview with the French newspaper La Depeche du Midi, Villeroy stated, "Our decisions to increase interest rates are fully playing their role as a remedy against the disease that is inflation."
He added, "This is why, barring any shock, there will be no further increase in our rates — the question of a reduction may arise in 2024, but not now."
Villeroy expressed confidence in the progress made in the fight against inflation, noting that "we are well on our way... even if we are not yet finished." He urged patience with the duration of these measures, reiterating the ECB's commitment to bringing inflation back toward 2% by 2025 at the latest.
Furthermore, he pointed out that disinflation is occurring faster than anticipated due to two main factors: slowdown in energy prices, unaffected by conflicts in the Middle East, and deceleration of other prices, including services and manufactured products, as a result of ECB's monetary policy.
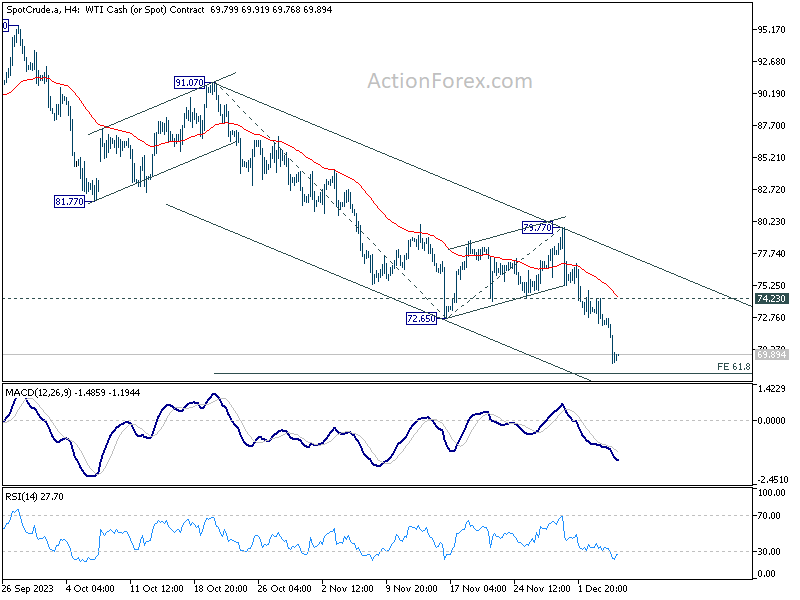
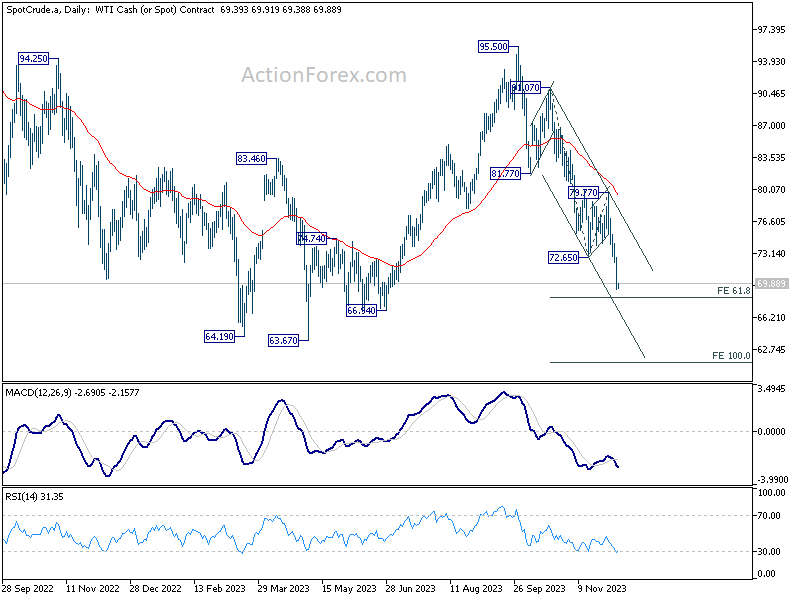
WTI oil breaks 70, focus shits to 63/67 support zone
WTI crude oil fell sharply overnight, breaking 70 psychological level for the first time since June. Further decline is expected in the short-term from technical perspective. But 63/67 support zone is expected to provide a floor to contain this downtrend.
This selloff is driven by several key factors. The primary concern is demand destruction in the fuel market, underscored by EIA reporting a larger-than-expected increase in US gasoline inventories. Additionally, persistent worries about China's economic health are adding to the bearish sentiment in the oil market. This concern is exacerbated by Moody's downgrade of China's A1 rating outlook from stable to negative. Market skepticism regarding the effectiveness of OPEC+'s production cuts also plays a role.
Technically, WTI's strong break of 72.65 support confirms resumption of the fall from 95.50. Further decline is expected as long as 74.23 resistance holds. Break of 61.8% projection of 91.07 to 72.65 from 79.77 at 68.38 is envisaged.
Strong support is expected from 63.67/66.94 zone to contain downside to complete the five wave sequence from 95.50, and bring sustainable rebound. Even if 63.67 is breached, 100% projection at 61.35 should provide the floor, preventing further substantial drops in oil price.
Looking ahead
Germany industrial production, France trade balance, Eurozone GDP revision, and Swiss foreign currency reserves will be released in European session. Later in the day, US will release Challenger job cuts and jobless claims.
GBP/JPY Daily Outlook
Daily Pivots: (S1) 184.74; (P) 185.27; (R1) 185.56; More...
GBP/JPY's fall from 188.63 accelerates lower today and breaks through 184.44 support. Current development argues that a medium term is in place on bearish divergence condition in D MACD. Fall from 188.63 is likely corrective whole rise from 148.93. Intraday bias is now on the downside for 23.6% retracement of 148.93 to 188.63 at 173.46 next. On the upside, above 185.78 minor resistance will turn intraday bias neutral and bring consolidations first. But risk will now stay on the downside as long as 188.63 resistance holds.
In the bigger picture, while a medium term top is in place at 188.63, there is no clear sign of long term bearish trend reversal yet. As long as 172.11 resistance turned support holds, price actions from 188.63 are seen as a corrective move only. Larger up trend from 123.94 (2022 low) could resume at a later stage.
Economic Indicators Update
| GMT | Ccy | Events | Actual | Forecast | Previous | Revised |
|---|---|---|---|---|---|---|
| 00:30 | AUD | Trade Balance (AUD) Oct | 7.13B | 7.45B | 6.79B | 6.18B |
| 03:00 | CNY | Trade Balance (USD) Nov | 68.4B | 58.1B | 56.5B | |
| 05:00 | JPY | Leading Economic Index Oct P | 108.7 | 108.2 | 108.2 | 108.9 |
| 07:00 | EUR | Germany Industrial Production M/M Oct | -0.20% | -1.40% | ||
| 07:45 | EUR | France Trade Balance (EUR) Oct | -8.5B | -8.9B | ||
| 08:00 | CHF | Foreign Currency Reserves (CHF) Nov | 658B | |||
| 09:00 | EUR | Italy Industrial Output M/M Oct | -0.60% | 0.00% | ||
| 10:00 | EUR | Italy Retail Sales M/M Oct | 0.10% | -0.30% | ||
| 10:00 | EUR | Eurozone GDP Q/Q Q3 | -0.10% | -0.10% | ||
| 10:00 | EUR | Eurozone Employment Change Q/Q Q3 F | 0.30% | 0.30% | ||
| 12:30 | USD | Challenger Job Cuts Nov | 8.80% | |||
| 13:30 | USD | Initial Jobless Claims (Dec 1) | 226K | 218K | ||
| 13:30 | CAD | Building Permits M/M Oct | 1.10% | -6.50% | ||
| 15:00 | USD | Wholesale Inventories Oct F | -0.20% | -0.20% | ||
| 15:30 | USD | Natural Gas Storage | 8.3B | 10B |
Technical Outlook and Review
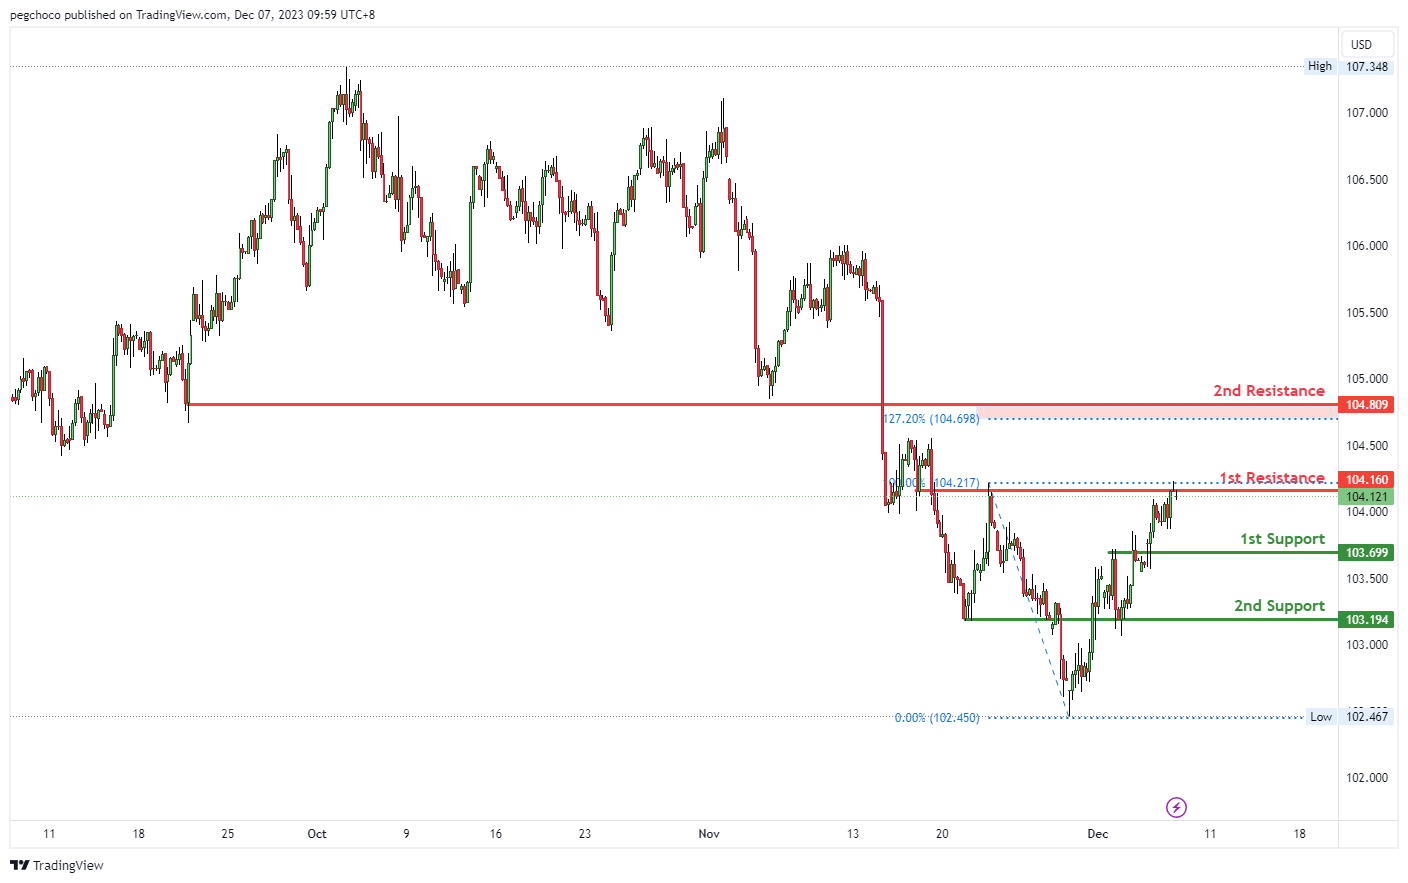
DXY:
The DXY (US Dollar Index) chart is currently exhibiting a bearish overall momentum, and there’s a possibility of a bearish reaction off the 1st resistance level, leading to a potential drop towards the 1st support.
On the support side, the 1st support at 103.69 is identified as an overlap support level, suggesting it could be a significant area where buying interest might emerge. Additionally, there is a 2nd support at 103.19, also categorized as an overlap support, which further reinforces its potential as a level where buyers may become active.
On the resistance side, the 1st resistance at 104.16 is noted as an overlap resistance, implying it could act as a substantial barrier where selling interest could intensify. Furthermore, the 2nd resistance at 104.81 is identified as a pullback resistance, indicating another level where selling pressure may increase.
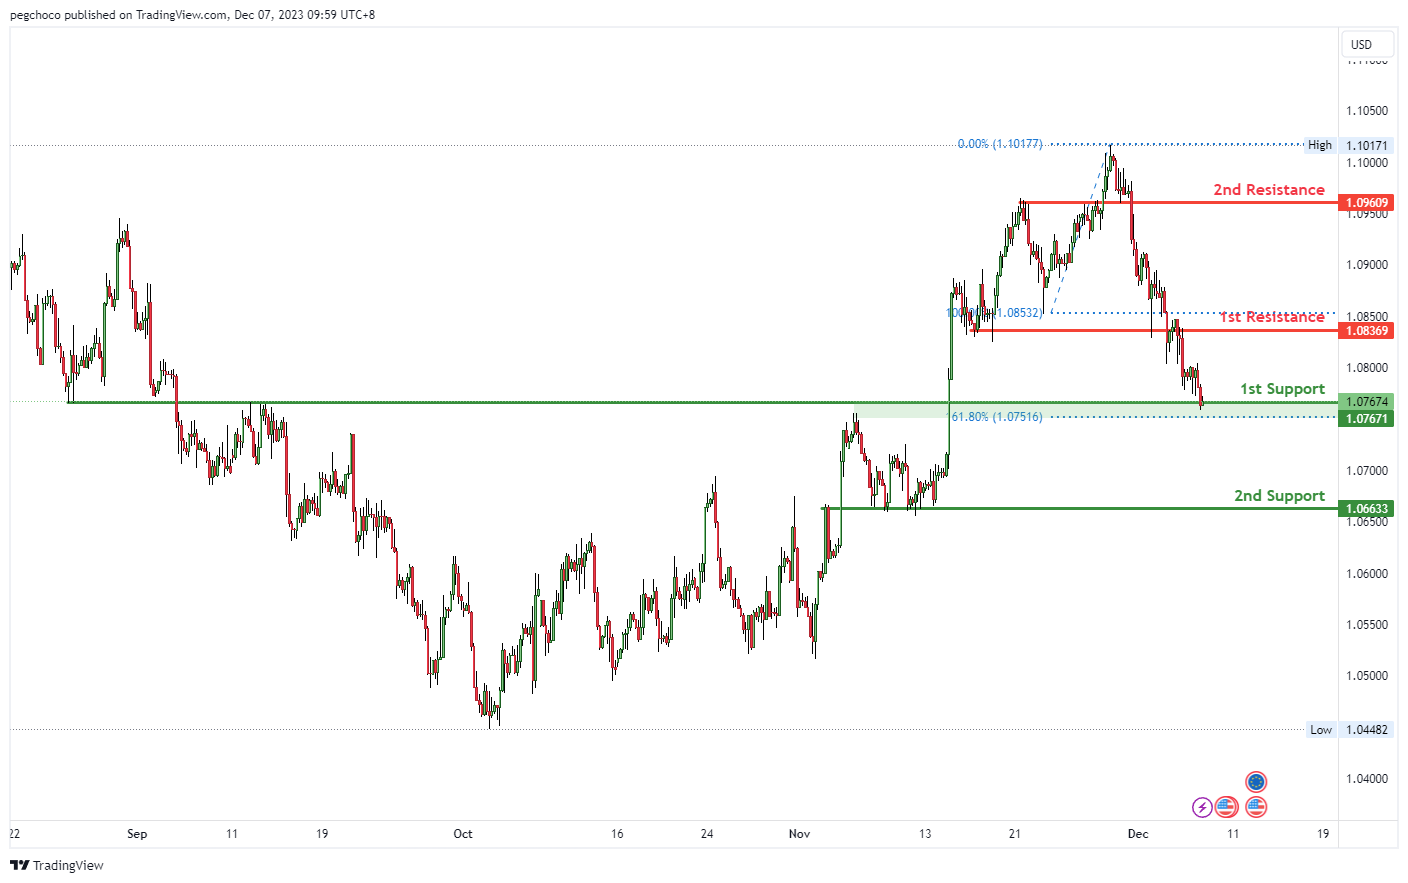
EUR/USD:
The EUR/USD chart currently exhibits a bullish overall momentum, and there’s potential for a bullish bounce off the 1st support level, suggesting a move towards the 1st resistance.
On the support side, the 1st support at 1.0767 is categorized as a pullback support and is further strengthened by the presence of the 161.80% Fibonacci Extension. This level indicates a potential area where buying interest may emerge.
Additionally, there is a 2nd support at 1.0663, identified as an overlap support, which could provide additional reinforcement to the support area.
On the resistance side, the 1st resistance at 1.0836 is categorized as an overlap resistance, implying it could act as a significant barrier where selling interest may intensify.
Further up, the 2nd resistance at 1.0960 is noted as a pullback resistance, indicating another level where selling pressure may increase.
resistance factors for the EUR/USD.
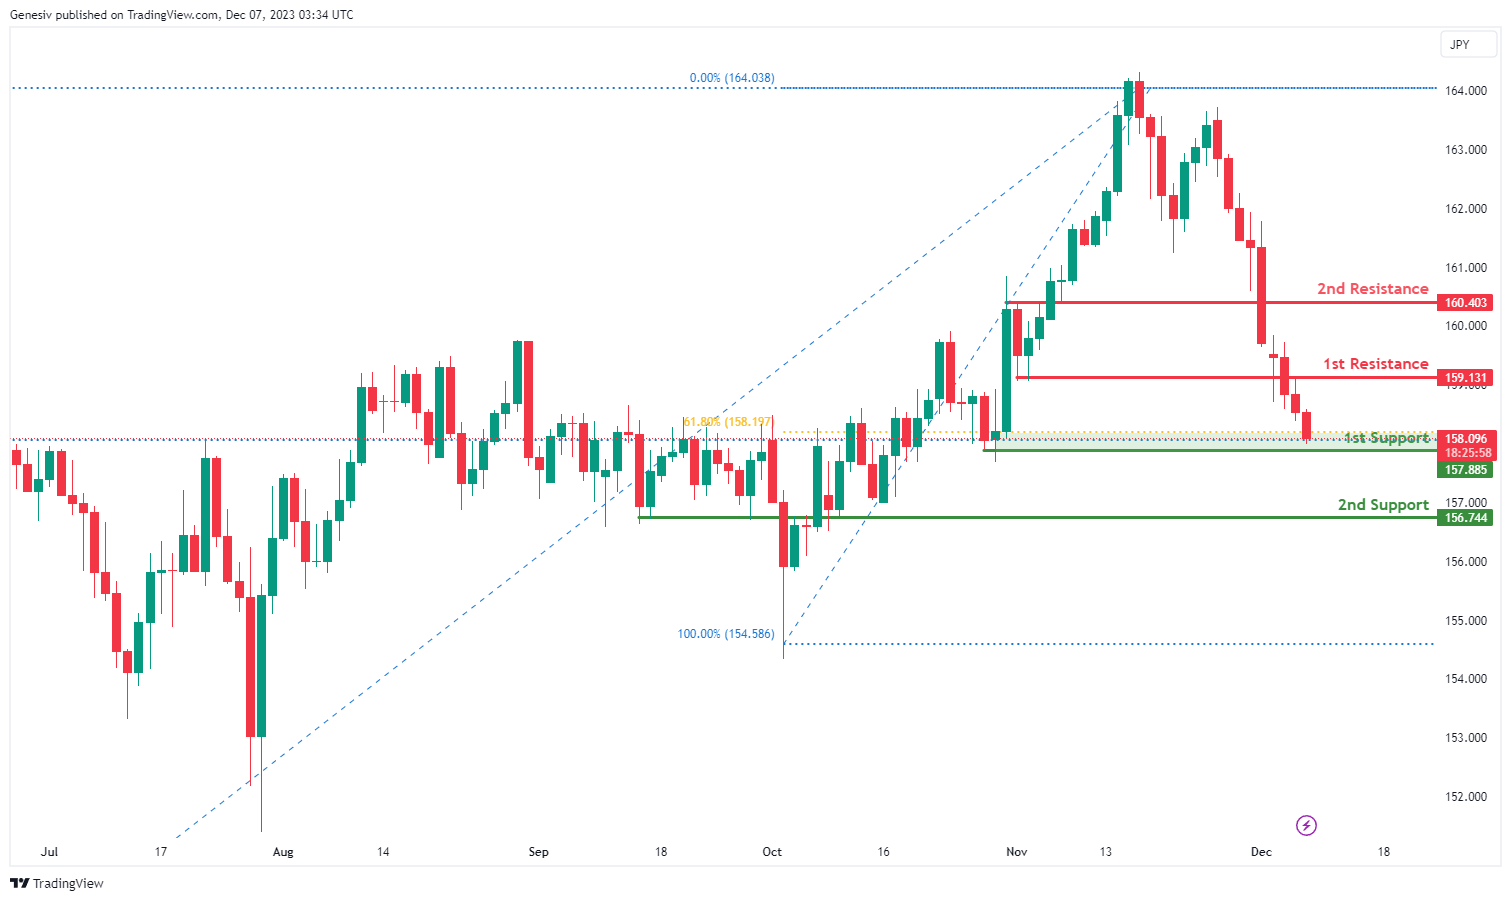
EUR/JPY:
The EUR/JPY chart currently has bullish momentum. The price could drop further to the first support before rebounding and rising towards the first resistance.
1st Support at 157.89: This level is considered a multi-swing low support, suggesting historical significance as a level where the price may find support.
2nd Support at 156.74: This support is characterized by an overlap support and a 61.80% Fibonacci retracement, adding to its significance as a potential strong support zone.
1st Resistance at 159.13: The first resistance is identified as a pullback resistance, indicating a level where selling interest might be observed, potentially slowing down the upward movement.
2nd Resistance at 160.40: This level is noted as an overlap resistance, suggesting historical significance as a potential barrier to further upward movement.
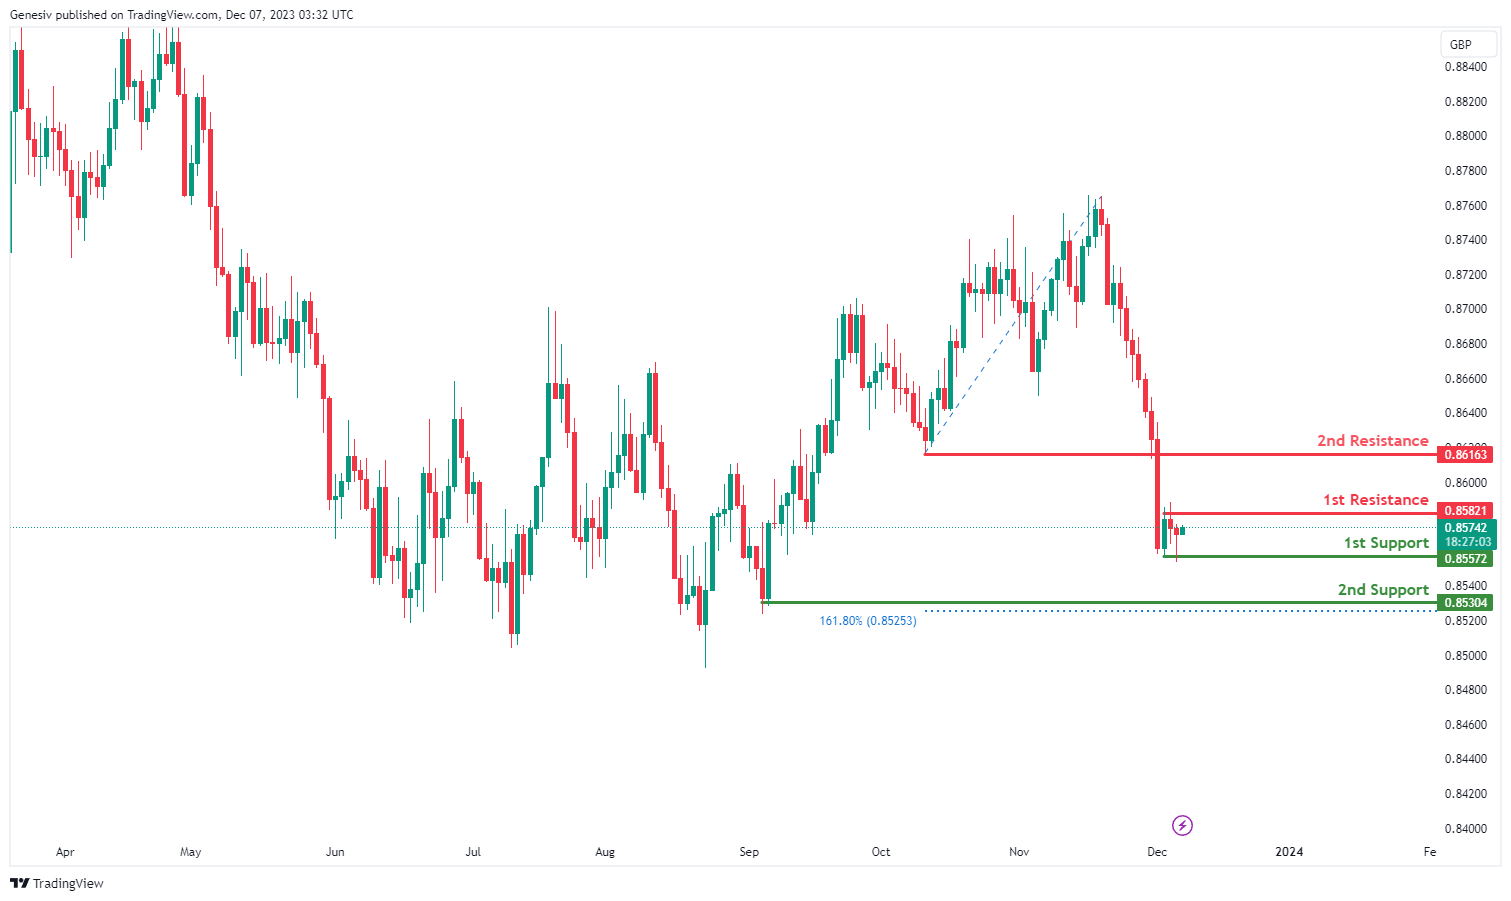
EUR/GBP:
The EUR/GBP currency pair exhibits a bullish overall momentum, with a potential scenario for a bullish bounce off the first support, heading towards the first resistance.
1st Support at 0.8557: This level is identified as a multi-swing low support, indicating historical significance as a level where the price has found support in the past.
2nd Support at 0.8530: The second support is described as a swing low support, reinforcing the potential strength of this support zone.
1st Resistance at 0.8582: This level is recognized as a swing high resistance, suggesting historical points where the price faced obstacles and potential reversals.
2nd Resistance at 0.8616: The second resistance is identified as a pullback resistance, indicating a level where selling interest might be observed, potentially slowing down the upward movement.
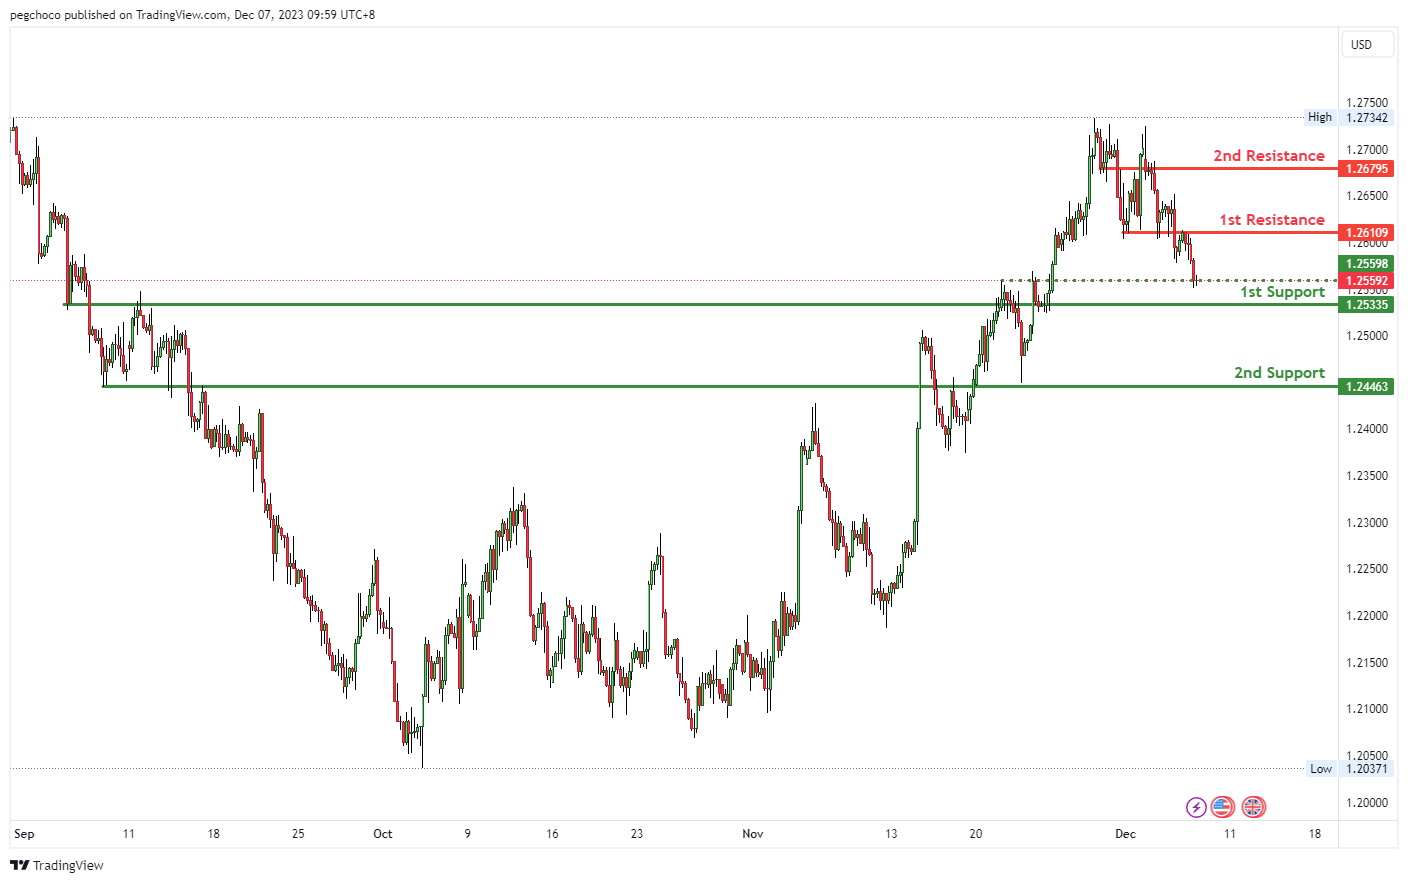
GBP/USD:
The GBP/USD chart currently demonstrates a bullish overall momentum, and there’s potential for a bullish bounce off the 1st support level, indicating a possible move towards the 1st resistance.
On the support side, the 1st support at 1.2535 is identified as an overlap support, suggesting it could serve as a significant level where buying interest may emerge and potentially provide support for the GBP/USD pair.
Further down, there is a 2nd support at 1.2446, also categorized as an overlap support, which reinforces the significance of this support level.
On the resistance side, the 1st resistance at 1.2610 is noted as an overlap resistance, implying it could act as a substantial barrier where selling interest may intensify.
Moreover, the 2nd resistance at 1.2679 is also categorized as an overlap resistance, further emphasizing its potential role as a resistance level.
Additionally, there’s an intermediate support at 1.2559, identified as a pullback support, which could provide added support in case of a retracement.
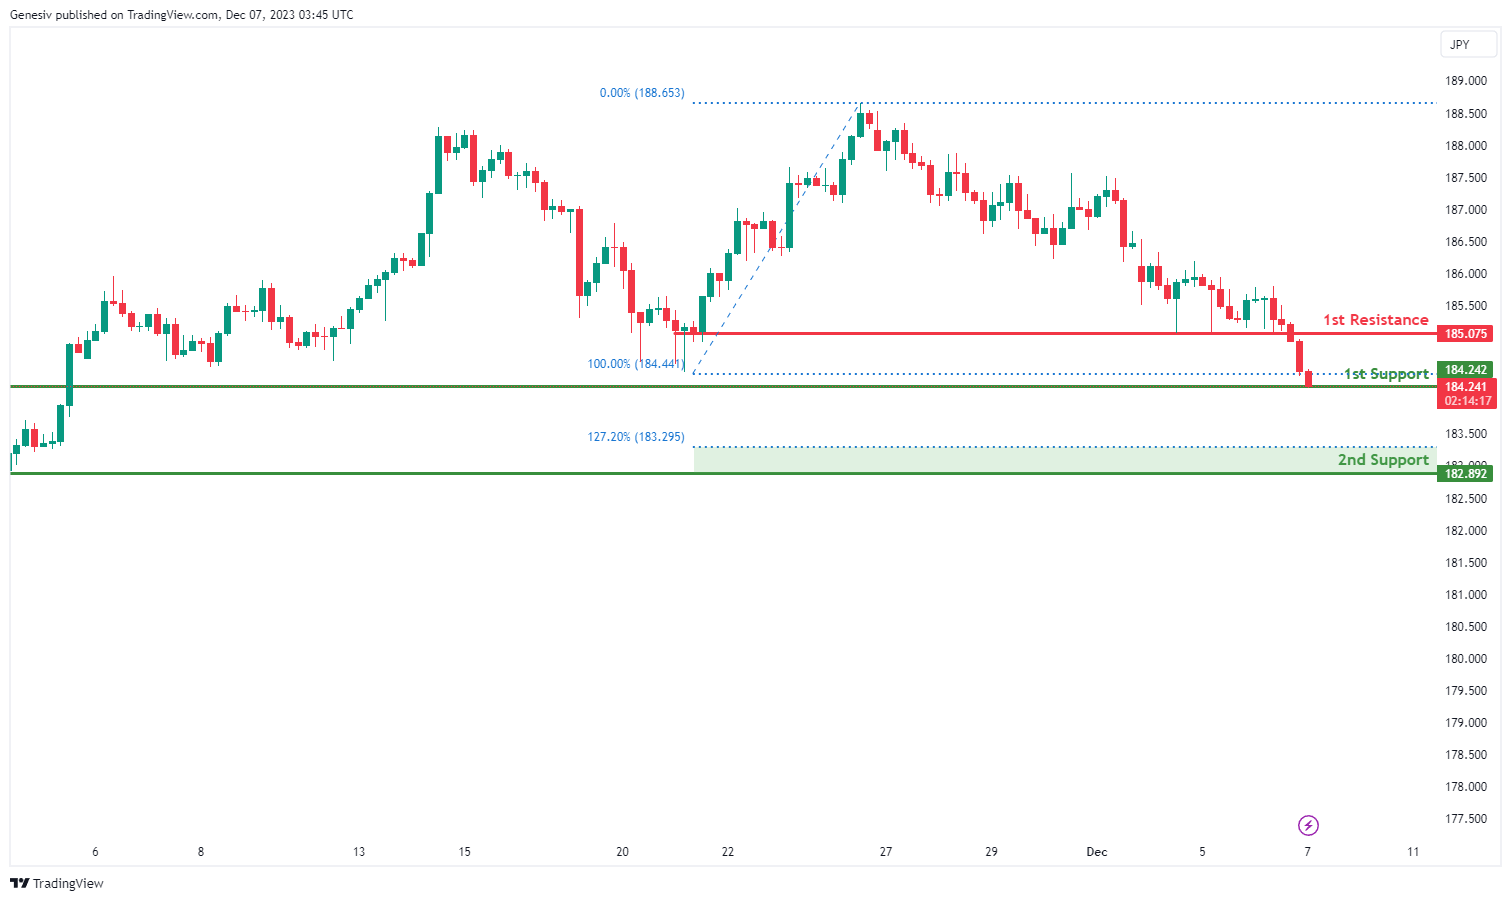
GBP/JPY:
The GBP/JPY currency pair is currently experiencing a bearish momentum, suggesting a potential bearish continuation towards the first support
1st Support at 184.24: This support is identified as a pullback support, indicating a level where buying interest may arise.
2nd Support at 182.89 is considered a significant level, characterized as a swing low support and supported by the 127.20% Fibonacci Extension, reinforcing its potential as a strong defensive barrier.
1st Resistance at at 185.08 is noted as a pullback resistance, implying a level where selling interest might be observed.
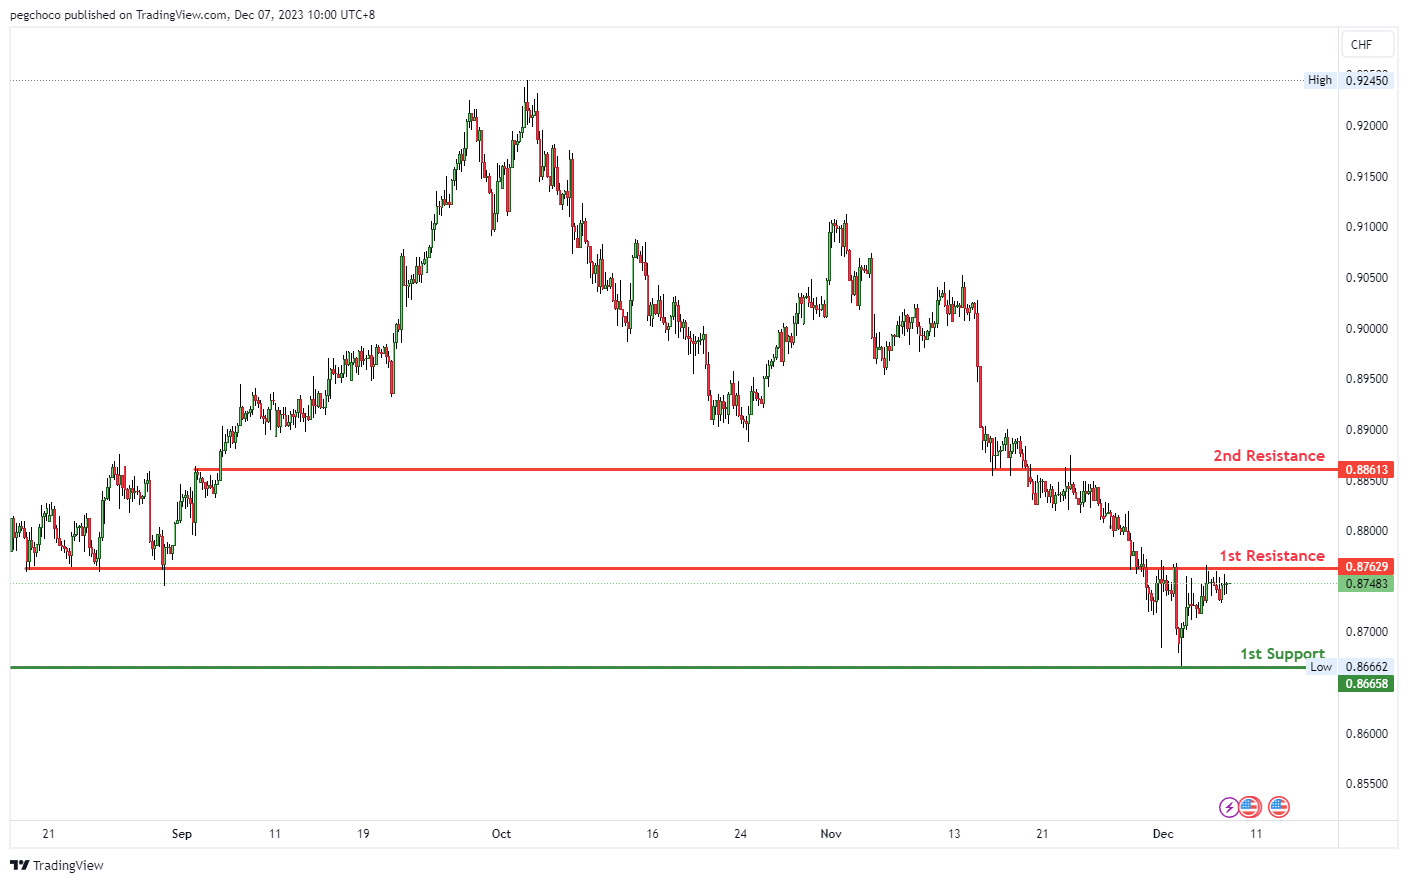
USD/CHF:
The USD/CHF chart currently displays a neutral overall momentum, and there’s a potential scenario in which price could fluctuate between the 1st resistance and 1st support levels.
On the support side, the 1st support at 0.8665 is considered a multi-swing low support. This designation suggests that it may hold significance as a level where buying interest could emerge, potentially providing support to the USD/CHF pair.
On the resistance side, the 1st resistance at 0.8762 is identified as an overlap resistance. This indicates that it could act as a notable barrier where selling interest might intensify, potentially preventing further upside movement.
Additionally, the 2nd resistance at 0.8861 is also classified as an overlap resistance, reinforcing its potential role as a resistance level.
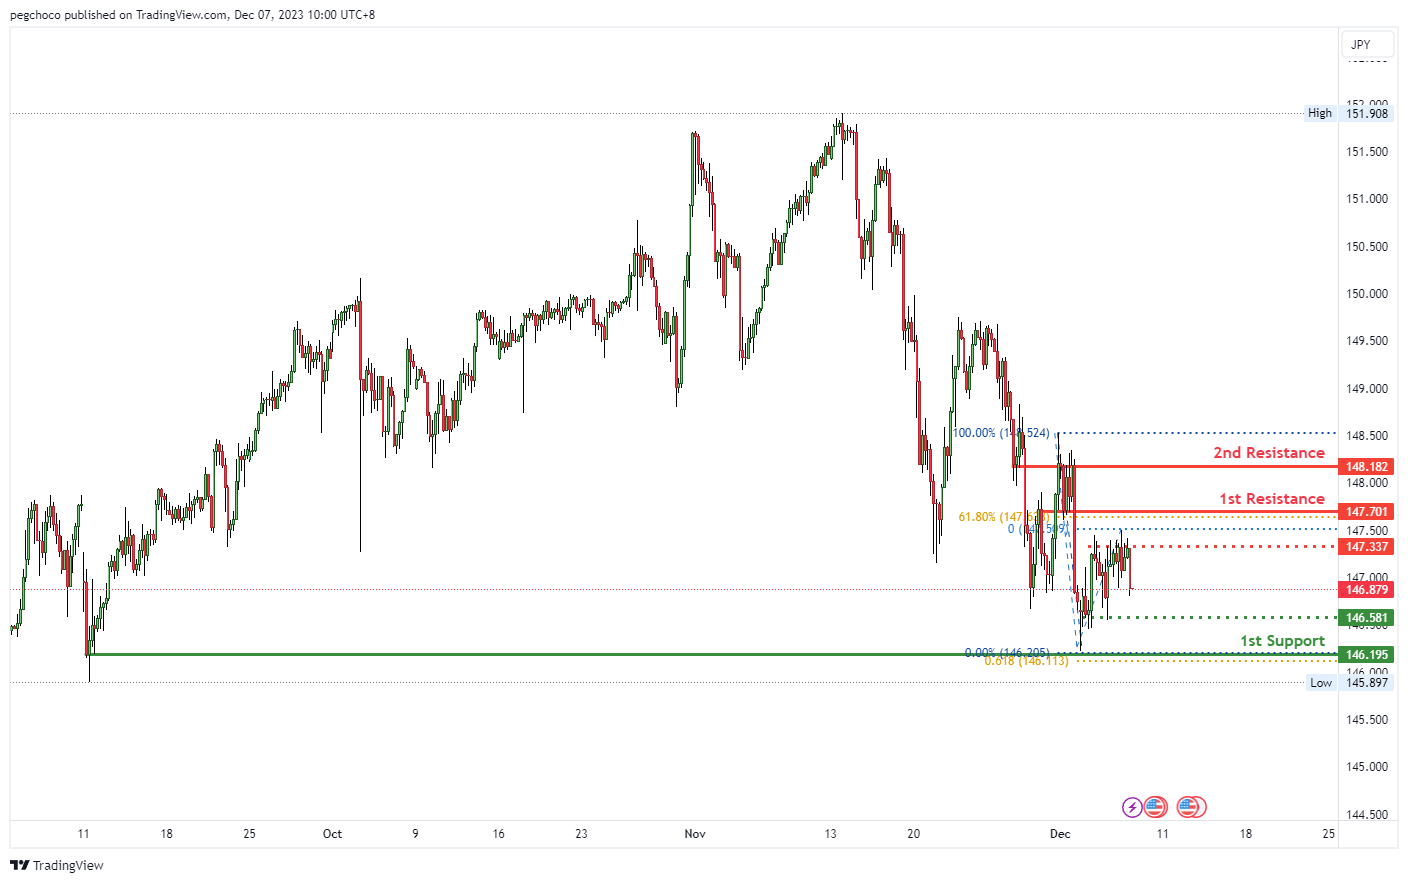
USD/JPY:
The USD/JPY chart currently exhibits a bearish overall momentum, and there’s a potential scenario in which price could experience a bearish reaction off the 1st resistance and drop towards the 1st support.
On the support side, the 1st support at 146.19 is classified as a swing low support and is further reinforced by the presence of the 61.80% Fibonacci Projection, indicating its potential significance as a level where buying interest may emerge, offering support to the USD/JPY pair.
Additionally, there is an intermediate support at 146.58, identified as a multi-swing low support, which further strengthens the notion that this could be a noteworthy support level.
On the resistance side, the 1st resistance at 147.70 is categorized as a pullback resistance, and it coincides with the 61.80% Fibonacci Retracement level. This suggests it could serve as a substantial barrier where selling interest may intensify, potentially leading to a bearish continuation.
The 2nd resistance at 148.18 is recognized as an overlap resistance, indicating another level where selling pressure may increase.
Intermediate resistance is also noted at 147.33, classified as a multi-swing high resistance, adding to the complexity of the price action in this area.
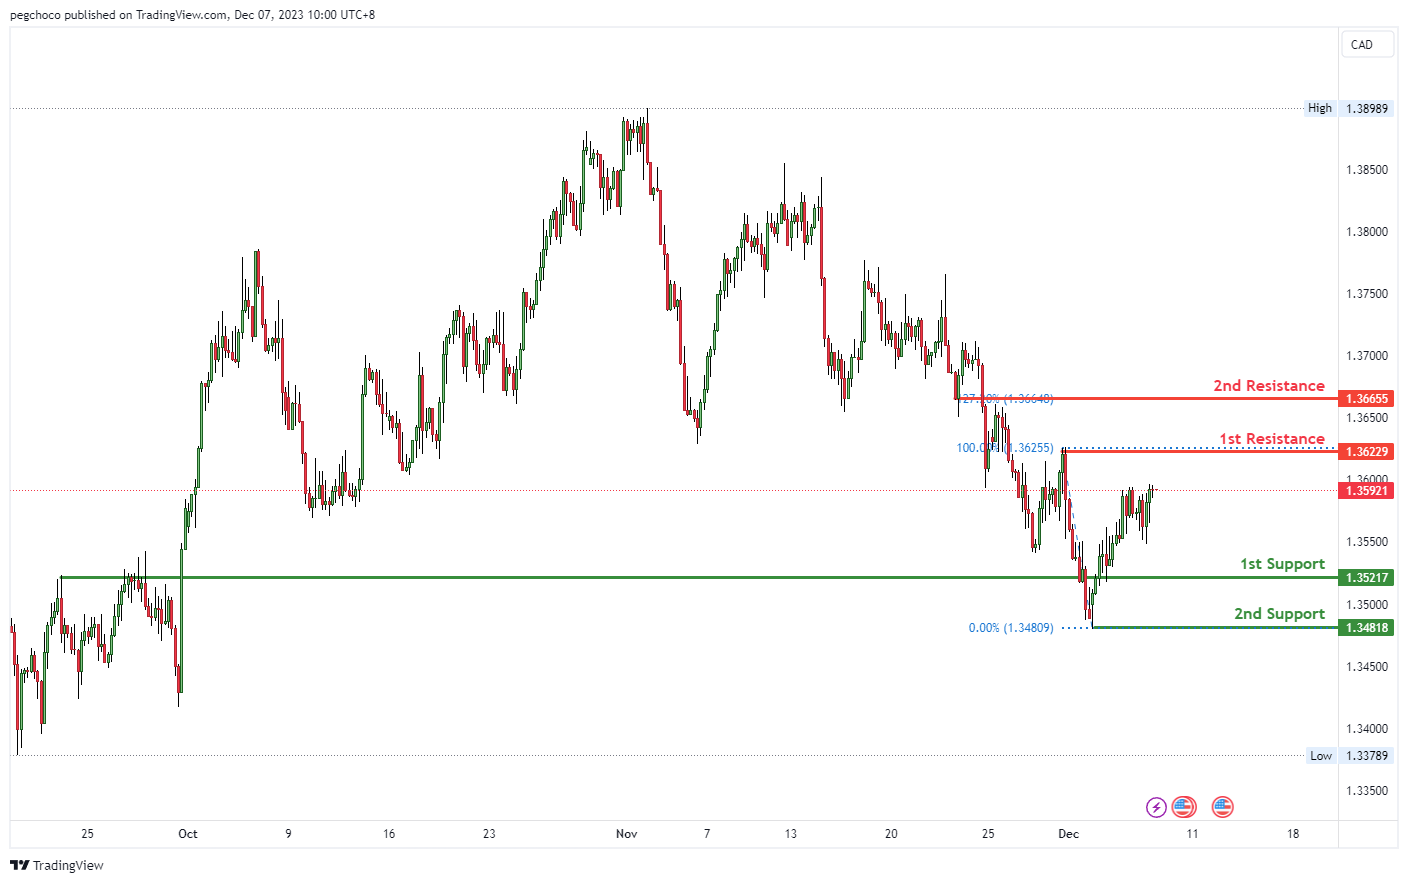
USD/CAD:
The USD/CAD chart currently exhibits a neutral overall momentum, indicating that there is no strong bullish or bearish bias at the moment. This suggests that price may move within a range between the 1st resistance and 1st support levels.
The 1st support level at 1.3521 is classified as an overlap support, which implies that it has historical significance and may attract buying interest. Traders should watch this level closely, as it could potentially provide support for the USD/CAD pair.
The 2nd support at 1.3481 is identified as a swing low support, further emphasizing its importance as a level where buyers may step in. This level adds an additional layer of potential support.
On the resistance side, the 1st resistance at 1.3622 is categorized as a swing high resistance. This indicates that it is a significant barrier where selling interest could intensify, potentially preventing price from moving higher.
The 2nd resistance at 1.3666 is also classified as an overlap resistance, signifying its potential importance as a level where selling pressure may increase. Traders should monitor this level as a potential obstacle to upward movements.
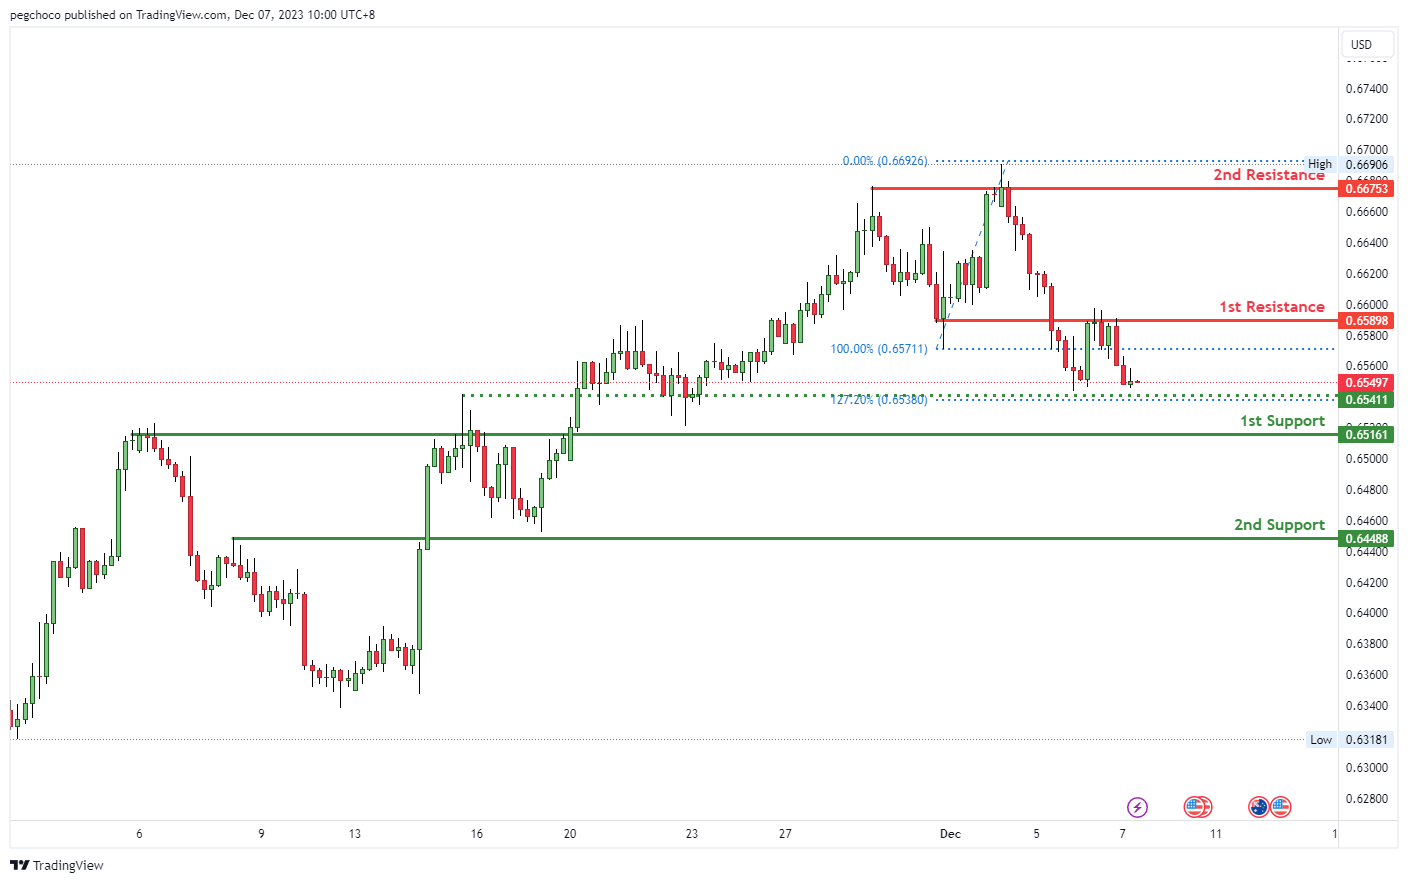
AUD/USD:
The AUD/USD chart currently has a bearish overall momentum, and there’s potential for a bearish continuation towards the 1st support level.
The 1st support at 0.6516 is categorized as a pullback support, suggesting it may act as a significant level where buying interest could potentially emerge, halting or slowing down the bearish momentum.
The 2nd support at 0.6448 is also identified as a pullback support, reinforcing the potential significance of this level as a zone where buyers might become active.
On the resistance side, the 1st resistance at 0.6589 is noted as an overlap resistance, indicating that it’s a substantial barrier where selling interest could intensify, potentially leading to a continuation of the bearish trend.
The 2nd resistance at 0.6675 is categorized as a multi-swing high resistance, further suggesting its importance as a potential barrier to upward movements.
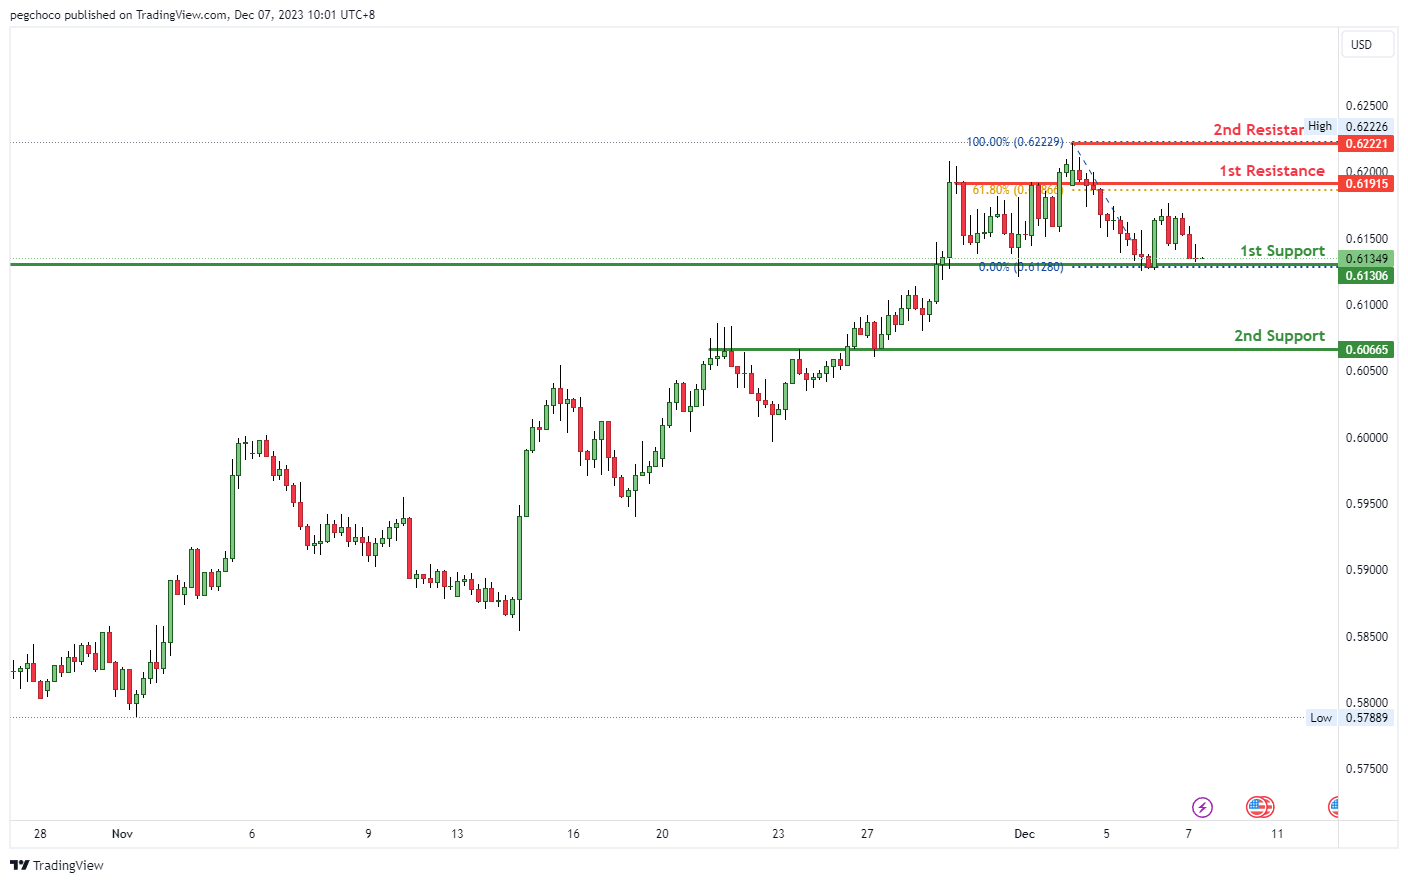
NZD/USD
The NZD/USD chart currently has a bearish overall momentum, and there’s potential for a bearish break off the 1st support level with a potential drop towards the 2nd support.
The 1st support at 0.6130 is categorized as an overlap support, suggesting it may be a significant level where buying interest could emerge. However, the bearish momentum indicates the possibility of a breakdown below this support level.
The 2nd support at 0.6066 is also identified as an overlap support, further reinforcing its significance as a potential area where buyers might become active. Traders should closely monitor price movements to see if this level holds in the event of a bearish breakout.
On the resistance side, the 1st resistance at 0.6191 is noted as a pullback resistance, indicating that it’s a substantial barrier where selling interest could intensify, potentially leading to a bearish continuation.
The 2nd resistance at 0.6222 is categorized as a swing high resistance, which could act as an additional barrier to upward movements.
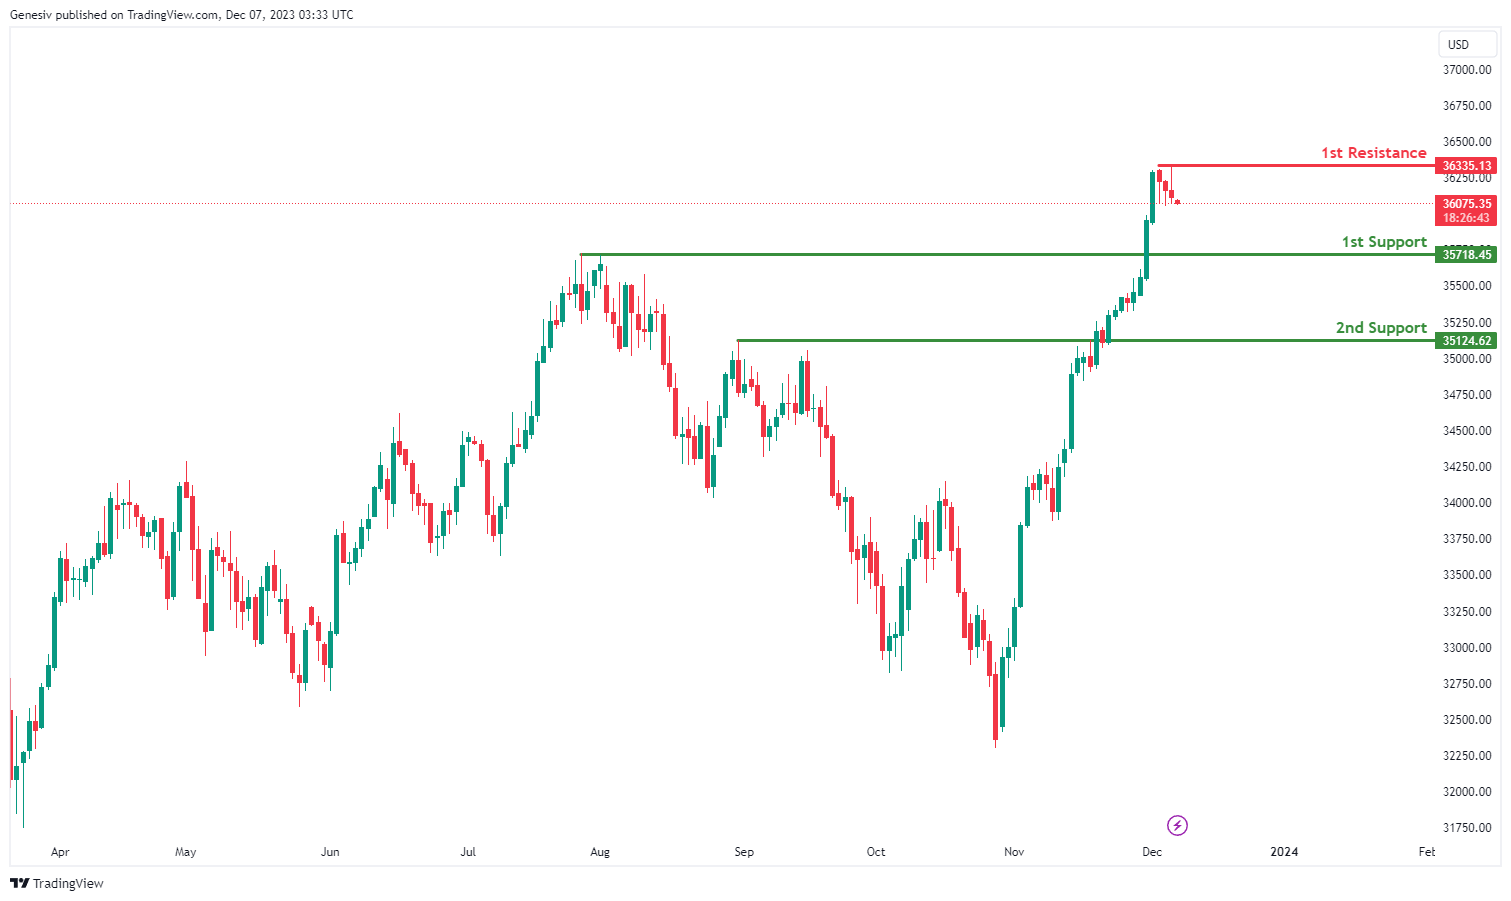
DJ30:
The DJ30 shows a bearish overall momentum, suggesting a prevailing downtrend.
1st Support at 35718.45: This support level is located at 35718.45 and is considered significant because it is based on pullback support. Pullback support levels often represent areas where the price has previously retraced to before resuming its upward movement.
2nd Support at 35124.62: The second support level is at 35124.62 and is based on an overlap support. An overlap support occurs when multiple price movements have historically converged around a specific level, creating a zone of support. This level suggests a stronger support zone, and it aligns with the first support level, reinforcing its significance.
1st Resistance at 36338.02: The first resistance level is at 36338.02 and is considered strong because it’s based on swing high resistance. Swing high resistance levels are where the price has previously encountered selling pressure after reaching a peak.
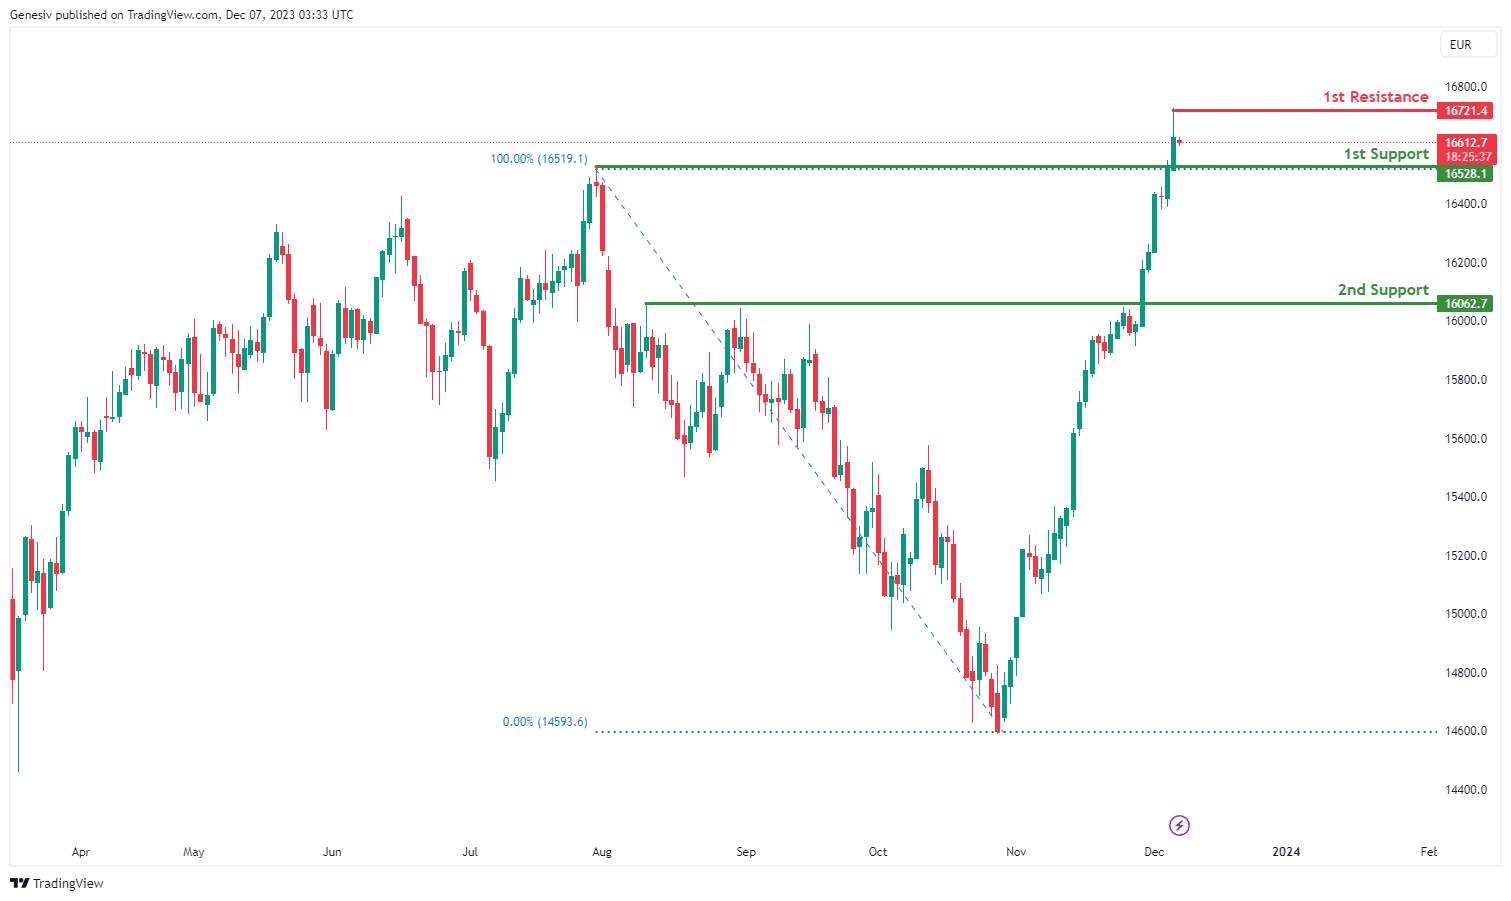
GER40:
The GER40 indicates a bearish overall momentum, suggesting a prevailing downtrend.
1st Support at 16610.7: This support level is at 16610.7 and is considered significant because it’s based on pullback support. Pullback support levels often represent areas where the price has previously retraced to before resuming its upward movement.
2nd Support at 16062.7: The second support level is at 16062.7 and is also based on pullback support. Similar to the first support, this level represents an area where buyers have historically become more active during pullback phases. It’s slightly lower than the first support, suggesting that if the price continues to decline, this could be the next potential level of support.
1st Resistance at 16721.4: The first resistance level is at 16721.4 and is considered strong because it’s based on swing high resistance. Swing high resistance levels are where the price has previously encountered selling pressure after reaching a peak.
2nd Resistance at 17054.5: The second resistance level is at 17054.5 and is associated with the 127.20% Fibonacci Extension. Fibonacci extensions are often used by traders to identify potential price targets based on historical price movements.
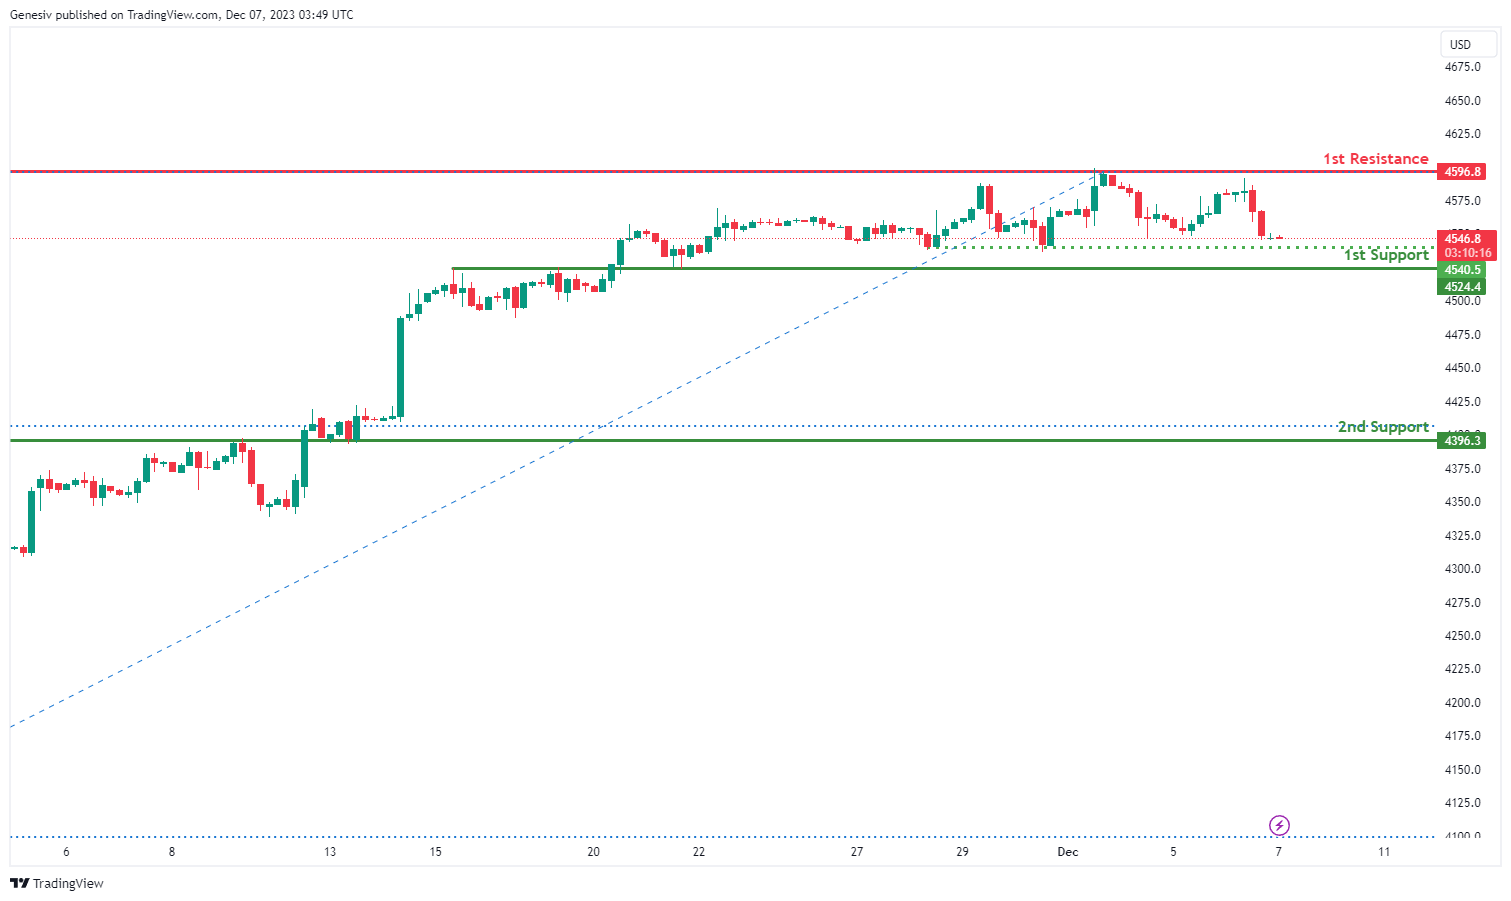
US500:
The chart of US500 indicates a bearish momentum, suggesting a prevailing downtrend.
1st Support at 4540.5: This support level is at 4540.5 and is considered significant because it’s based on an overlap support. Overlap support levels often represent areas where the price has previously found support and may attract buying interest again.
2nd Support at 4396.3: The second support level is at 4396.3 and is also based on an overlap support. It’s slightly lower than the first support and could serve as an additional support level if the price continues to drop. This level represents another historical area where buyers have been active.
1st Resistance at 4596.8: The first resistance level is at 4596.8 and is considered strong because it’s based on swing high resistance. Swing high resistance levels are where the price has previously encountered selling pressure after reaching a peak.
Intermediate Support at 4547.1: This intermediate support level is at 4547.1 and is based on swing low support. Swing low support levels represent areas where the price has previously found support during its downward swings. It’s located slightly above the 1st support level, indicating a potential support zone.
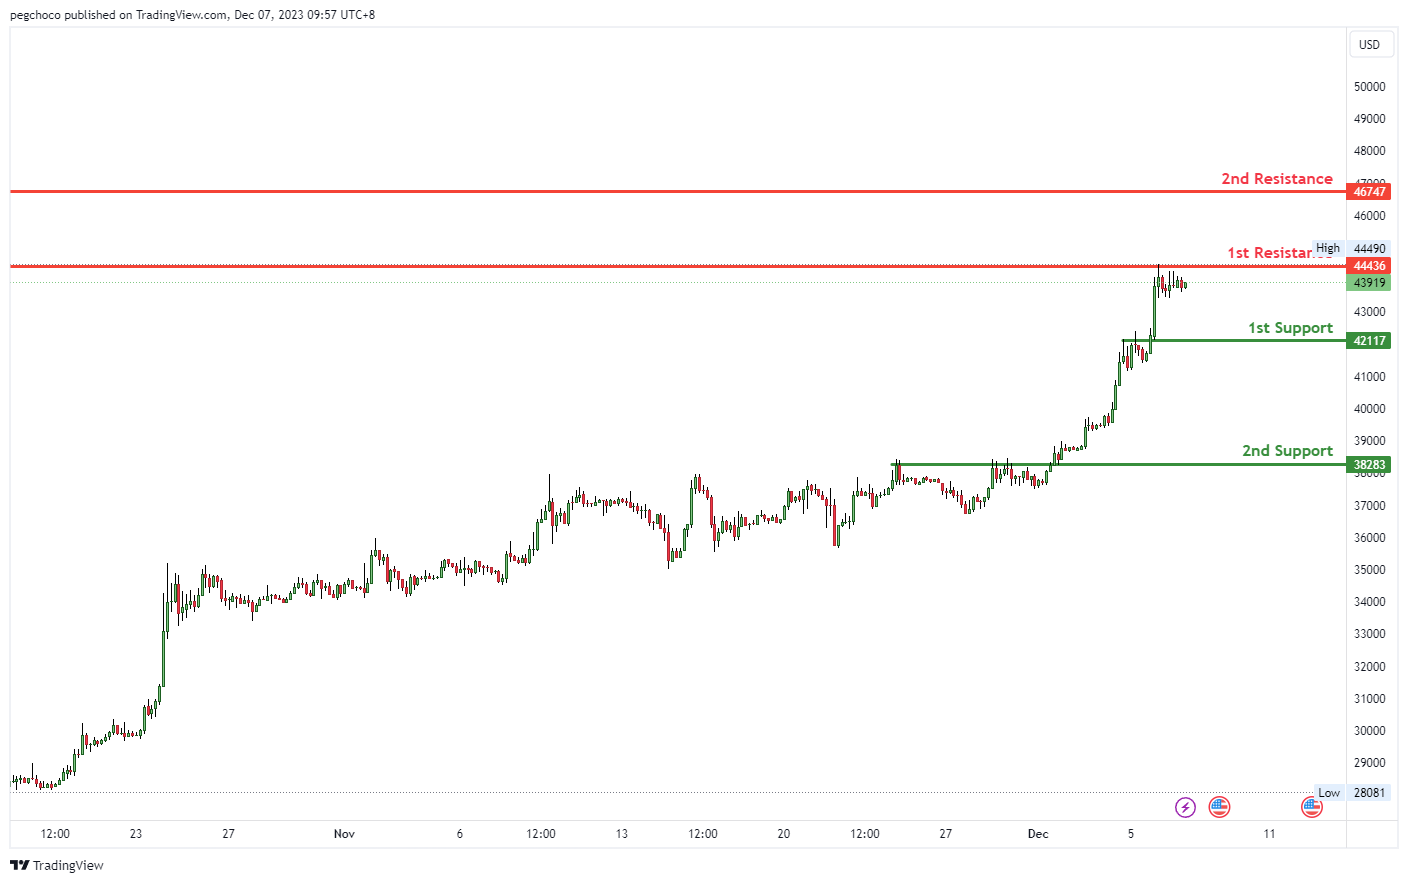
BTC/USD:
The BTC/USD chart currently exhibits a bearish overall momentum, indicating a potential bearish reaction off the 1st resistance level with a potential drop towards the 1st support.
The 1st support at 38283 is categorized as an overlap support, suggesting it may be a significant level where buying interest could emerge. This level may act as a potential area of support for the BTC/USD pair due to historical price interactions or other technical factors.
The 2nd support at 35619 is also identified as an overlap support, further reinforcing its significance as a potential area where buyers might become active.
On the resistance side, the 1st resistance at 44436 is noted as a pullback resistance. This implies that it’s a substantial barrier where selling interest could intensify, potentially leading to a bearish continuation.
The 2nd resistance at 46747 is categorized as an overlap resistance, indicating another level where selling pressure may increase.
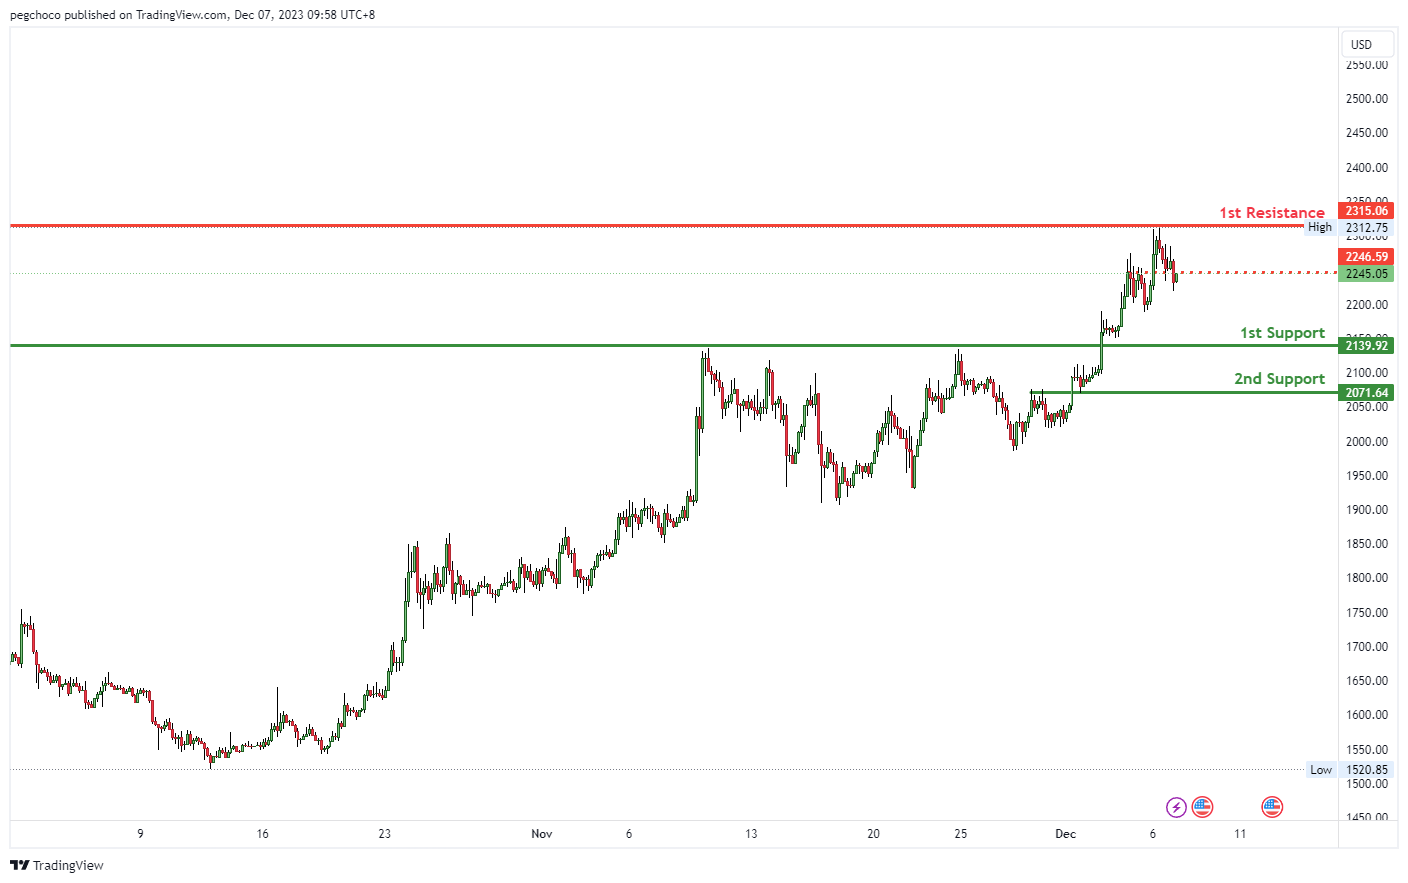
ETH/USD:
The ETH/USD chart currently indicates a bearish overall momentum, suggesting the possibility of a bearish continuation towards the 1st support level.
The 1st support at 2139.92 is identified as a pullback support. This implies that it could be a significant level where buying interest may emerge, potentially providing support for the ETH/USD pair as it may attract traders looking to buy at lower prices.
The 2nd support at 2071.64 is categorized as an overlap support. This reinforces the significance of this support level, indicating that it may be an area where buyers become active due to historical price congestion or other technical factors.
On the resistance side, the 1st resistance at 2315.06 is noted as a pullback resistance. This implies that it’s a substantial barrier where selling interest could intensify, potentially leading to a bearish continuation.
The intermediate resistance at 2246.59 is also categorized as a pullback resistance, further emphasizing its significance as a potential level where selling pressure may increase.
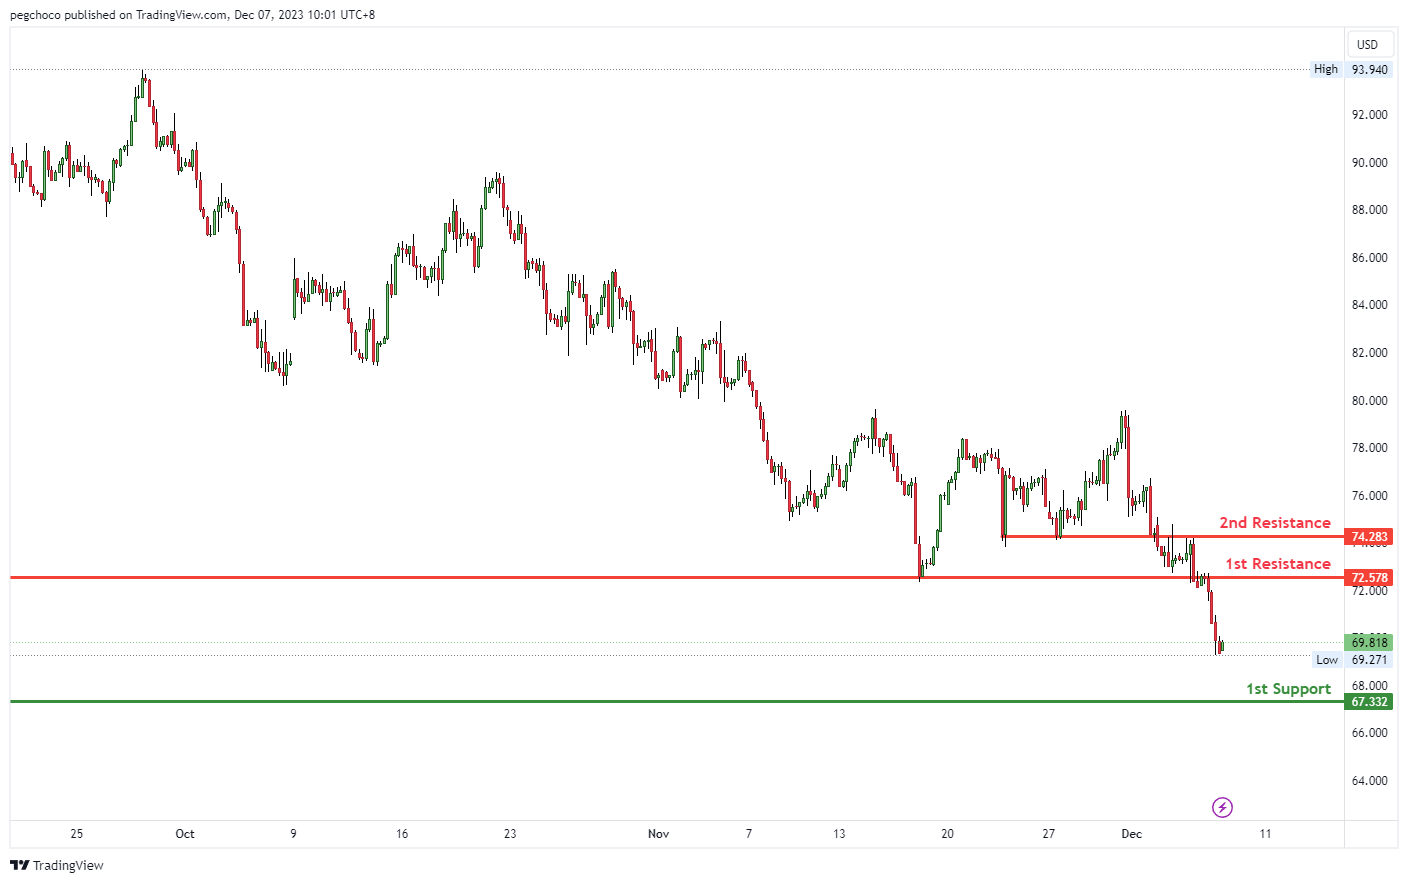
WTI/USD:
The WTI (West Texas Intermediate) chart currently exhibits a bearish overall momentum, indicating a potential scenario for a bearish continuation towards the 1st support level.
The 1st support at 67.33 is noted without a specific reason. It’s important to consider that support levels should ideally be accompanied by reasons or factors that make them significant. Traders often look for support levels with identifiable reasons, such as previous price congestion, trendlines, or Fibonacci levels, to have more confidence in their effectiveness.
On the resistance side, the 1st resistance at 72.57 is categorized as an overlap resistance. This implies that it’s a substantial barrier where selling interest could intensify, potentially leading to a bearish continuation.
The 2nd resistance at 74.28 is also identified as an overlap resistance, reinforcing its significance as a potential level where selling pressure may increase.
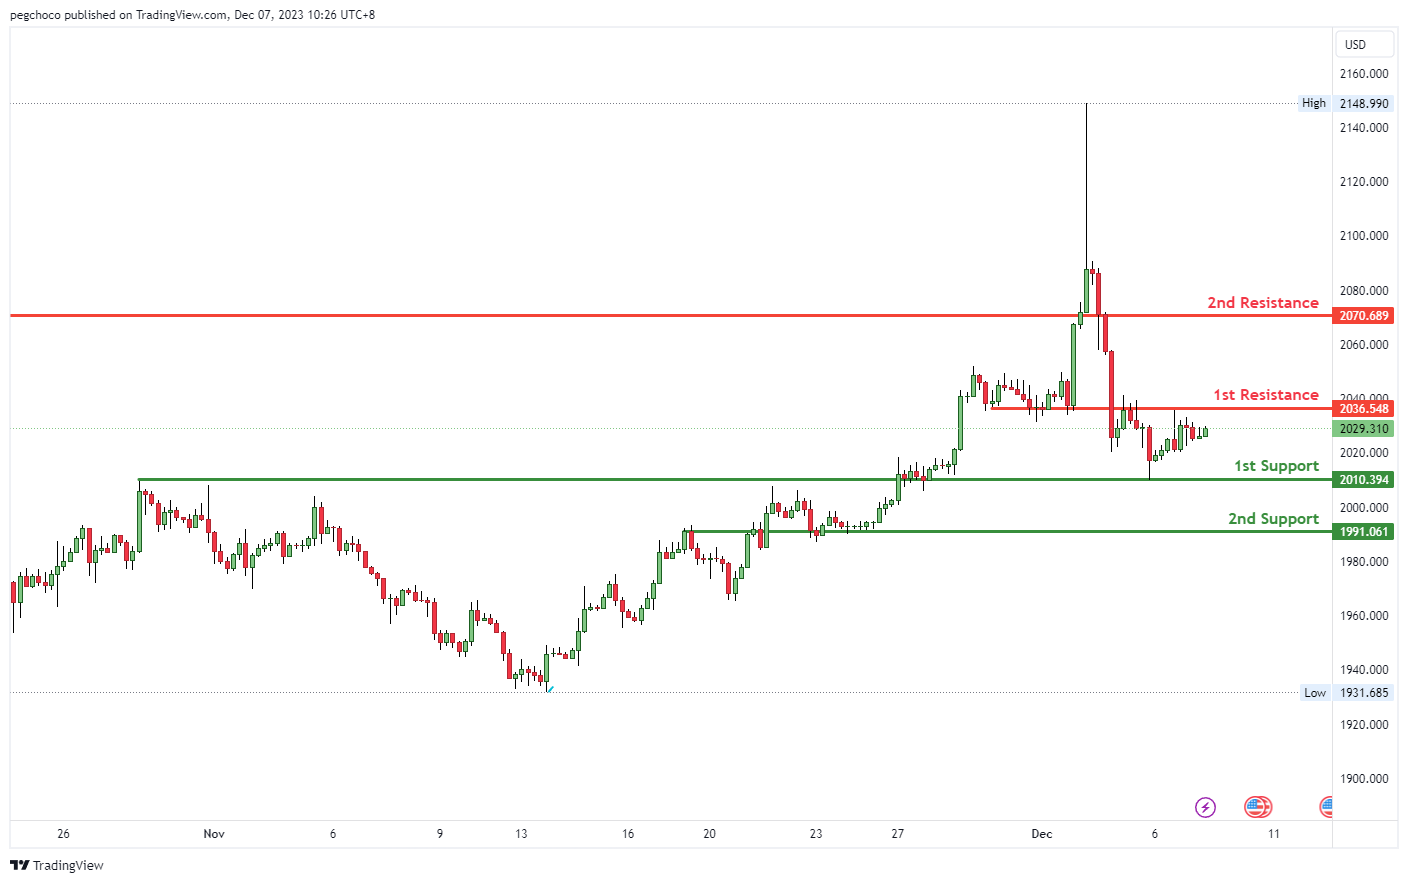
XAU/USD (GOLD):
The XAU/USD chart currently demonstrates a neutral overall momentum, suggesting a potential scenario in which the price may fluctuate between the 1st resistance and 1st support levels.
On the support side, the 1st support at 2010.39 is classified as an overlap support, indicating that it could be a significant level where buying interest may emerge. This level may serve as a foundation of support for XAU/USD.
Furthermore, there is a 2nd support at 1991.06, also identified as an overlap support, reinforcing its importance as a potential area where buyers might become active.
On the resistance side, the 1st resistance at 2036.54 is categorized as an overlap resistance. This level could act as a substantial barrier where selling interest may intensify, potentially leading to a pause or reversal in the price movement.
The 2nd resistance at 2070.68 is recognized as a pullback resistance, indicating another level where selling pressure may increase.
China’s exports return to growth in Nov, but imports slump
China's export figures for November 2023 showed an unexpected rise, growing by 0.5% yoy to USD 291.9B, surpassing the anticipated -0.8% yoy decline. This increase marks the first growth in exports China has seen in seven months.
Notably, exports to US rose by 7% yoy. However, exports to EU and ASEAN experienced declines, falling by -14.5% yoy and -7.0% yoy, respectively.
Conversely, imports decreased by -0.6% yoy to USD 223.5B, significantly underperforming against the expected rise of 3.0% yoy. This decline in imports contributed to widening of trade surplus, which expanded from USD 56.5B to USD 68.4B, exceeding the forecasted USD 58.1B surplus.
Looking at the broader January to November period, China's exports contracted by -5.2% yoy, while imports declined by -6.0% yoy. The cumulative trade balance for this period stood at a surplus of USD 748.13B.