Sample Category Title
US ADP jobs grows 103k, pay rise slows further
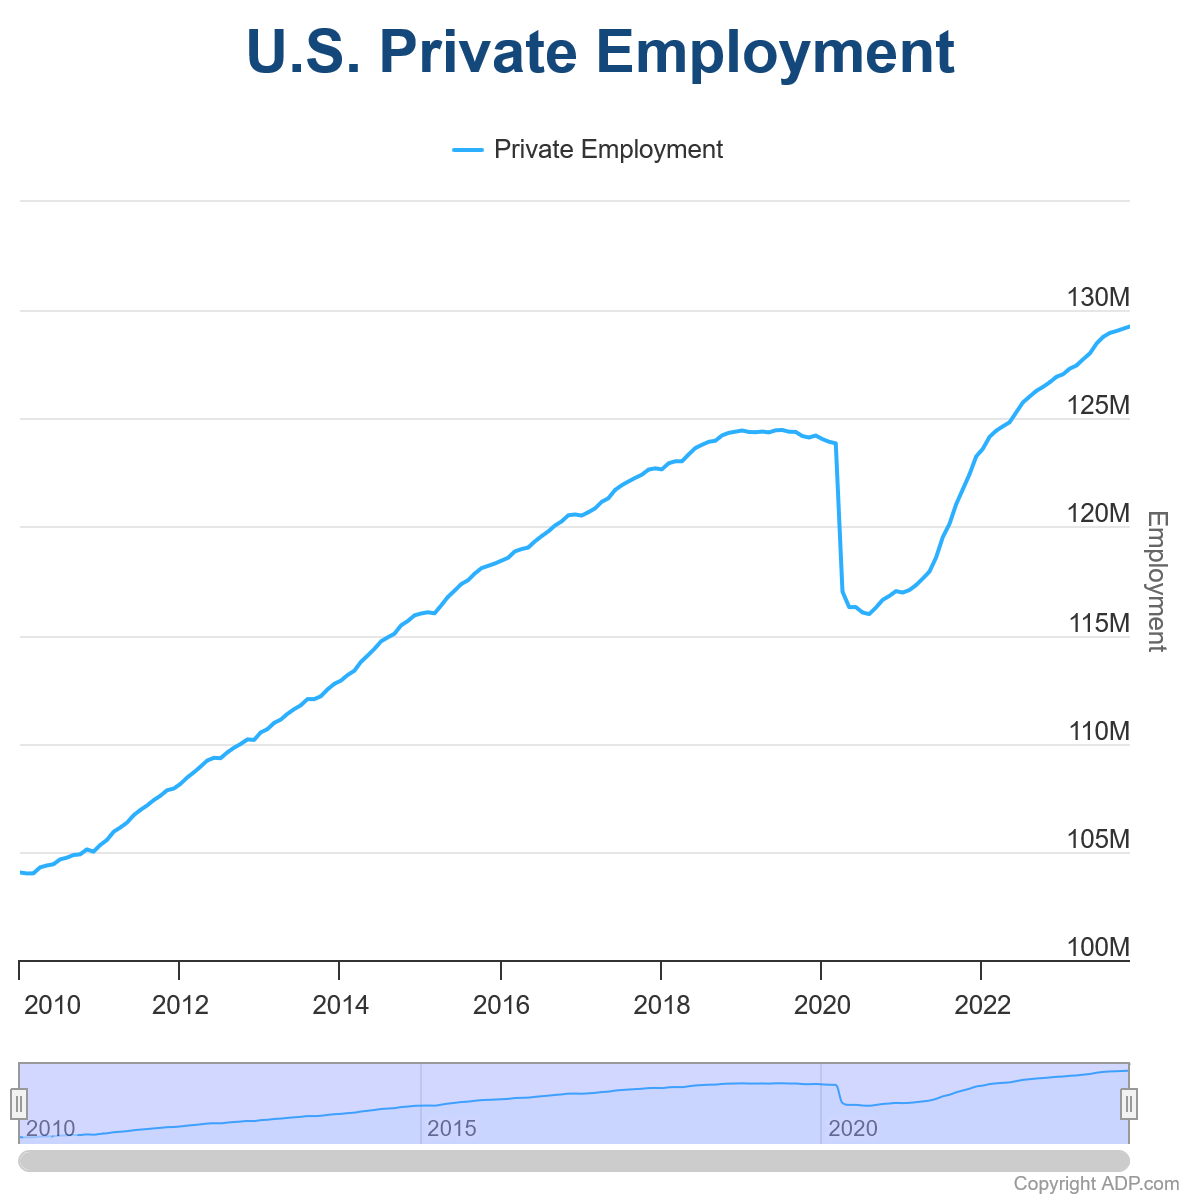
US ADP private sector employment grew 103k in November, below expectation of 120k. By sector, goods-producing jobs fell -14k while service-providing jobs rose 117k. By establishment size, small companies added 6k jobs, medium companies added 68k, large companies added 33k.
Job-stays saw a 5.6% yoy pay increase, down from 5.7% yoy, and the slowest since September 2021. Job-changes saw a 8.3% yoy pay rise, down from 8.4% yoy, slowest since June 2021.
"Restaurants and hotels were the biggest job creators during the post-pandemic recovery," said Nela Richardson, chief economist, ADP. "But that boost is behind us, and the return to trend in leisure and hospitality suggests the economy as a whole will see more moderate hiring and wage growth in 2024."
NIKKEI Futures (NKD_F) Found Buyers At The Blue Box
Hello fellow traders. In this technical article we’re going to take a look at the Elliott Wave charts charts of NIKKEI Futures published in members area of the website. As our members know NIKKEI Futures has recently made pull back that has unfolded as Elliott Wave Double Three Pattern. It made clear 7 swings from the November 20th peak and completed correction right at the Equal Legs zone( Blue Box Area) . In further text we’re going to explain the Elliott Wave pattern and trading setup.
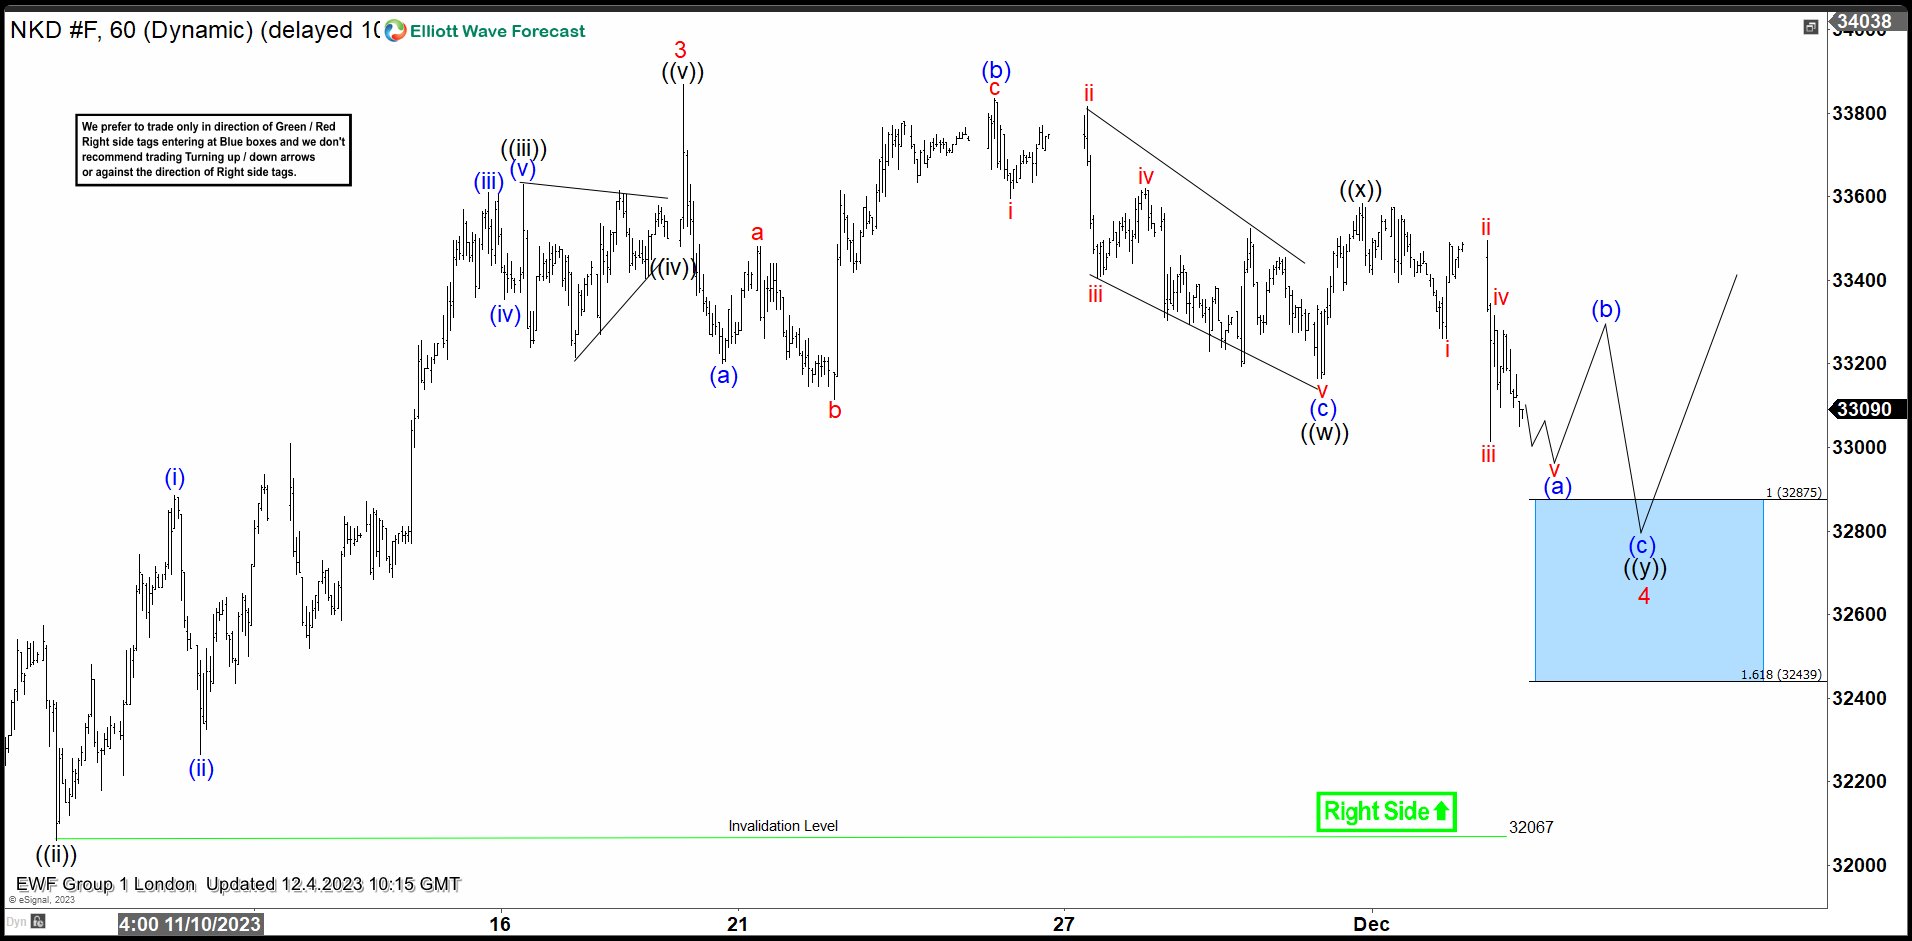
NIKKEI Elliott Wave 1 Hour Chart 12.04.2023
NIKKEI is doing correction that is unfolding as a 7 swings pattern. Pull back has ((w))((x))((y)) labeling. The price structure is incomplete at the moment, calling for a further weakness in near term toward : 32875-32439. We don’t recommend selling Nikkei and prefer the long side from the marked Blue Box ( buying zone). Once Nikkei reaches our buying area, it should ideally make either rally toward new highs or in 3 waves bounce alternatively. Once bounce reaches 50 Fibs against the ((x)) black high, we will make long position risk free ( put SL at BE) and take partial profits.
Quick reminder on how to trade our charts :
Red bearish stamp+ blue box = Selling Setup
Green bullish stamp+ blue box = Buying Setup
Charts with Black stamps are not tradable. 🚫
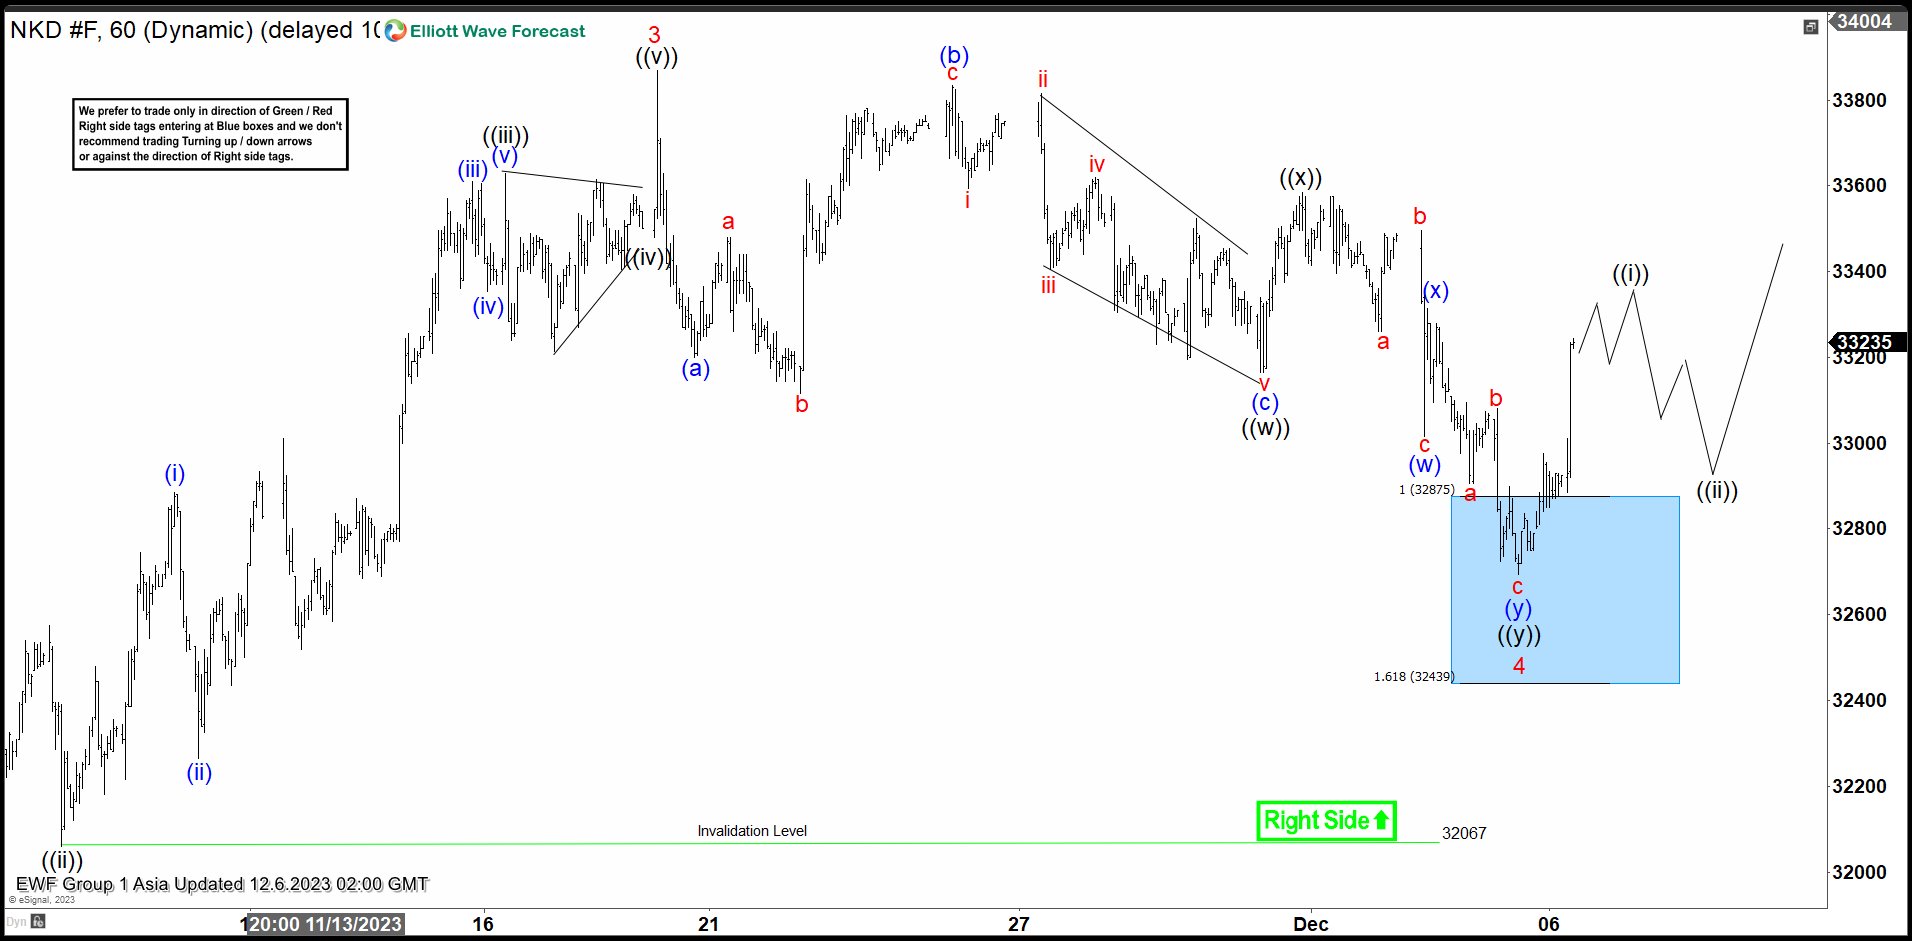
NIKKEI Elliott Wave 1 Hour Chart 12.06.2023
NIKKEI made extension toward our buying zone at : 32875-32439. The futures found buyers at the blue box as expected and we got good reaction from there. Bounce already reached 50 fibs against the ((x)) black connector which confirms cycle from the peak is done. Consequently, any long positions from the equal legs area should be risk free by now. As far as the price stays above 32700 low, we can see further strength in Nikkei.
BoE’s Bailey: Rates to stay high for an extended period
BoE Governor Andrew Bailey, in a press conference today, stated that "rates are likely to need to remain at these levels for an extended period to bring inflation back to target on a sustained basis," referring to the current bank rate at 5.25%.
He also noted that the full impact of the higher interest rates is yet to be fully realized, and highlighted the central bank's vigilance towards potential financial stability risks that might emerge as a result.
Separately, BoE's half-yearly Financial Stability Report noted, "The overall risk environment remains challenging, reflecting subdued economic activity, further risks to the outlook for global growth and inflation, and increased geopolitical tensions."
The report also drew attention to the strains on household finances due to rising living costs and higher interest rates. It pointed out that some effects of these higher rates, particularly in terms of mortgage repayments, have yet to fully manifest.
GBP/USD: Cable – Limited Correction Likely to Precede Fresh Rise, US Labor Data in Focus
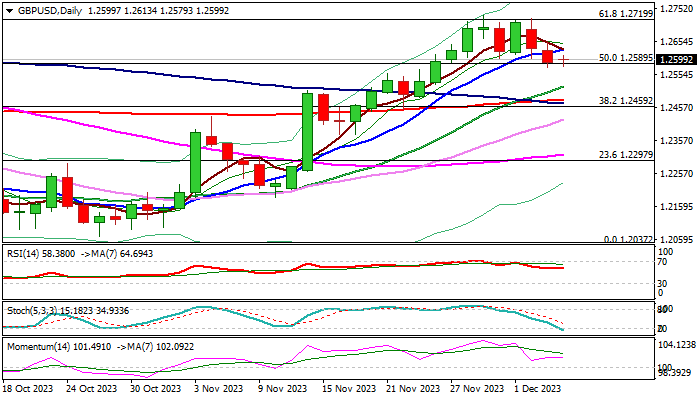
Cable is holding within a tight range on Wednesday morning, as two-day pullback found a footstep on broken Fibo support at 1.2585, though stronger dollar and weaker than expected UK data continue to sour the sentiment.
Traders await release of US labor data (ADP report is due later today and NFP on Friday) for fresh direction signals.
Technical studies on daily chart are bullishly aligned (positive momentum / MA’s mainly in bullish setup / oversold stochastic) which points to scenario of limited correction preceding fresh push higher.
Extended dips should hold above rising 20DMA (1.2518) and should not exceed 200DMA (1.2479) to keep short-term action biased higher, with break of recent tops (also Fibo 61.8% of 1.3141/11.2037) which recently capped multiple attacks, to signal bullish continuation.
Res: 1.2631; 1.2700; 1.2719; 1.2746.
Sup: 1.2577; 1.2518; 1.2500; 1.2467.
EUR/GBP: Hits New Multi-Month Low, But Oversold Studies Continue to Obstruct Bears
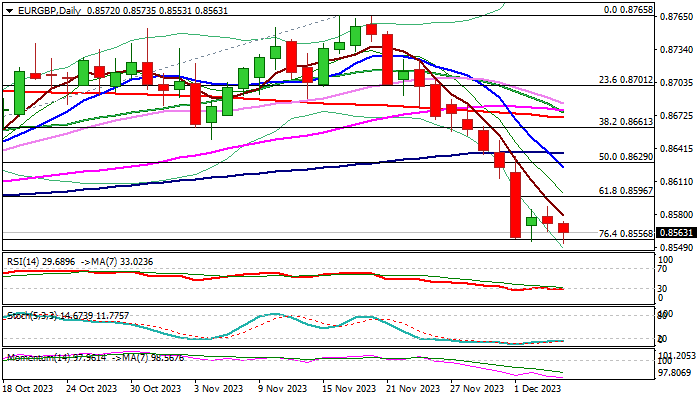
EURGBP fell to three-month low early Wednesday, attempting to resume larger downtrend, after a brief consolidation in past two days.
Larger bears regained traction following a double rejection of recovery attempts and received fresh boost from weak German data (factory orders slumped in October and Nov construction PMI fell to the lowest since mid-2020).
Bears probe again through pivotal Fibo support at 0.8566 (76.4% retracement of 0.8492/0.8765) which contained several attacks in past few sessions, with firm break here to signal bearish continuation and expose targets at 0.8523 (Sep 5 higher low) and 0.8499 (2023 low, posted on Aug 23).
Daily studies are in full bearish setup but oversold, which may produce headwinds and keeps bears further on hold.
Current range top (0.8588) marks initial resistance, followed by broken Fibo 61.8% (0.8596), which should ideally cap upticks and guard upper pivot at 0.8623 (base of thick daily cloud/ falling 10DMA).
Res: 0.8573; 0.8588; 0.8596; 0.8623.
Sup: 0.8553; 0.8523; 0.8499; 0.8471.
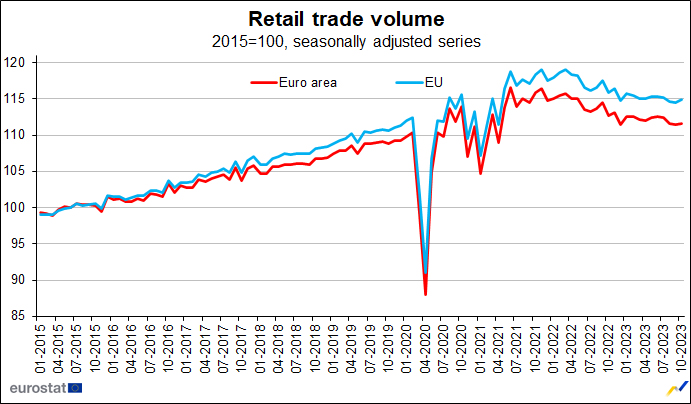
Eurozone retail sales rises 0.1% mom in Oct, EU up 0.3% mom
Eurozone retail sales volume rose 0.1% mom in October, below expectation of 0.2% mom. Volume of retail trade increased by 0.8% mom for non-food products, while it decreased by -0.8% mom for automotive fuels and by -1.1% mom for food, drinks and tobacco.
EU retail sales rose 0.3% mom. Among Member States for which data are available, the highest monthly increases in the total retail trade volume were registered in Croatia (+3.1%), the Netherlands (+2.4%) and Slovakia (+1.9%). The largest decreases were observed in France (-1.0%), Belgium and Austria (both -0.8%), Spain and Portugal (both -0.4%).
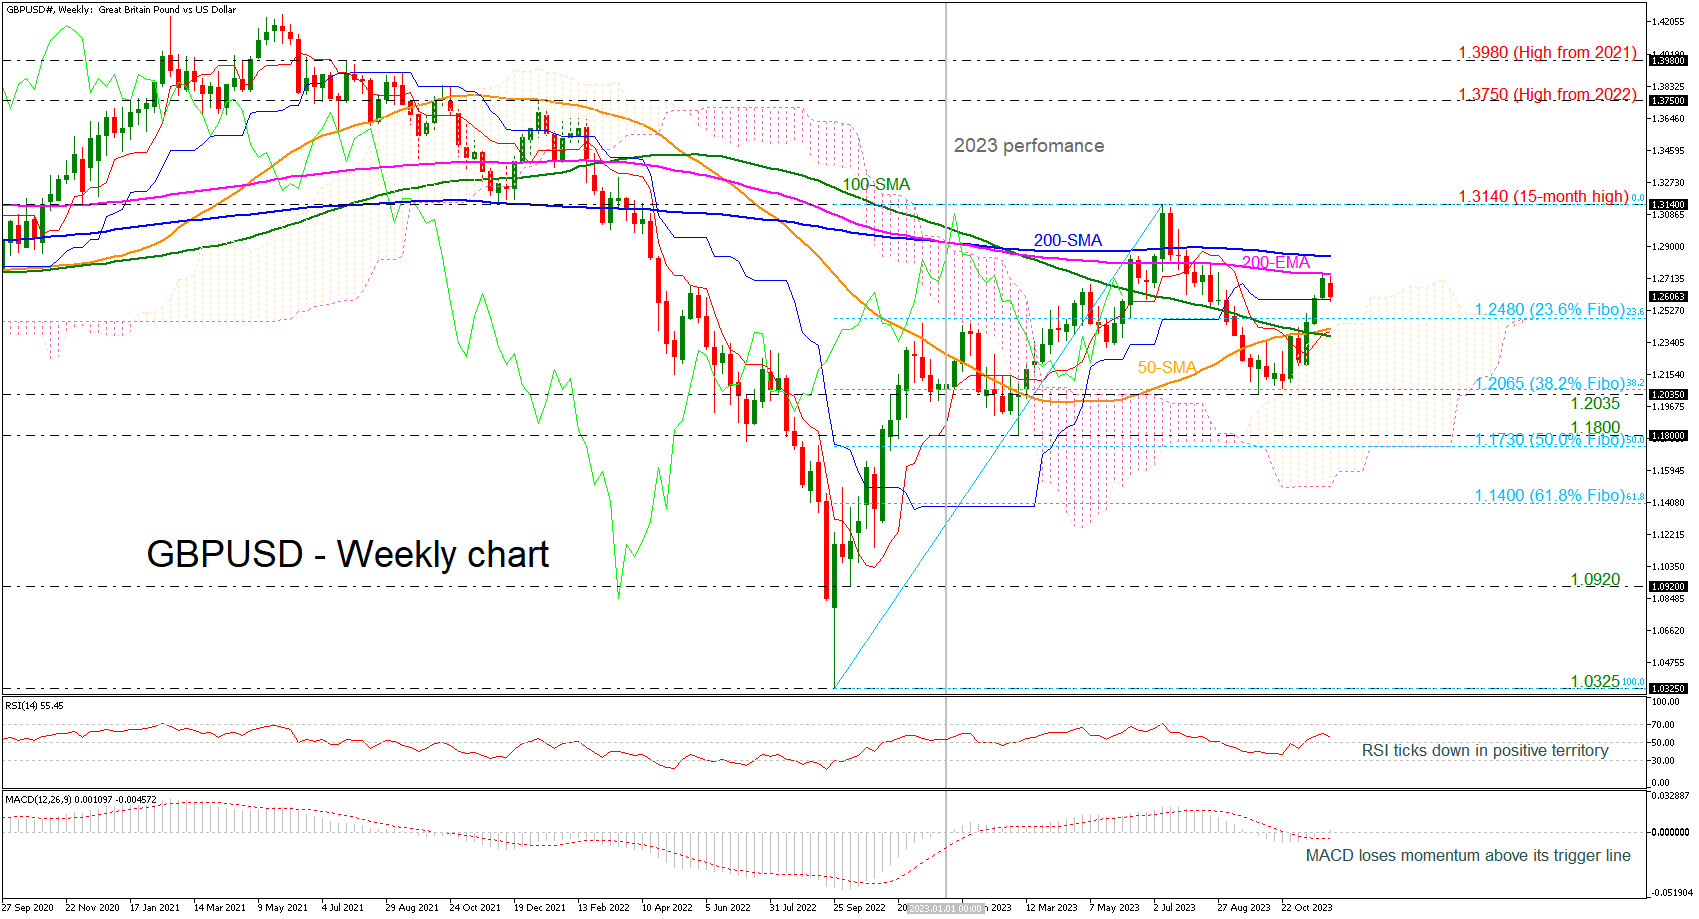
GBPUSD Ends 2023 in Bullish Area
- GBPUSD finds strong resistance near 200-week EMA
- Technical signals are negative
- Will 2024 be a negative year for the pair?
With the year 2023 drawing to a close, GBPUSD could not carry the impressive rally of the last three weeks above the bullish crossover within the 50- and the 100-week simple moving averages (SMAs) and the 23.6% Fibonacci retracement level of the upward wave from 1.0325 to 1.3140 at 1.2480. Also, the pair found strong resistance near the 200-week exponential moving average (EMA), sending prices lower this week so far.
Currently, the market price is holding above the opening price from last January. However, the technical oscillators are suggesting a weakening momentum. Specifically, the RSI is pointing south in the bullish region, while the MACD is flattening above its trigger line and near the zero level.
The market structure is positive in the long-term picture as the pair keeps fluctuating within a bullish territory. Hence, even if downside pressures resume, the pair will remain attractive unless it exits the bullish formation below the 38.2% Fibonacci of 1.2065. If that bearish scenario unveils, selling forces could intensify towards the 1.1800 mark and the 50.0% Fibonacci of 1.1730. Then, additional losses from there could test the 61.8% Fibonacci of 1.1400.
In the event the price stays resilient above the 200-week EMA and the 200-week SMA, the bulls might push for a close above the 15-month high of 1.3140. Therefore, a successful move higher could immediately shift the attention to the 1.3750 barricade, registered in 2022.
In a nutshell, GBPUSD may remain supported in the coming sessions, especially if it jumps beyond the immediate moving averages. However, a bearish round cannot be excluded from the table as the oscillators suggest a bearish structure in the near future.
USDCAD Slows Down Before BoC Rate Decision
- USDCAD halts near last week's limits
- Bias remains skewed to the downside
- BoC policy announcement awaited
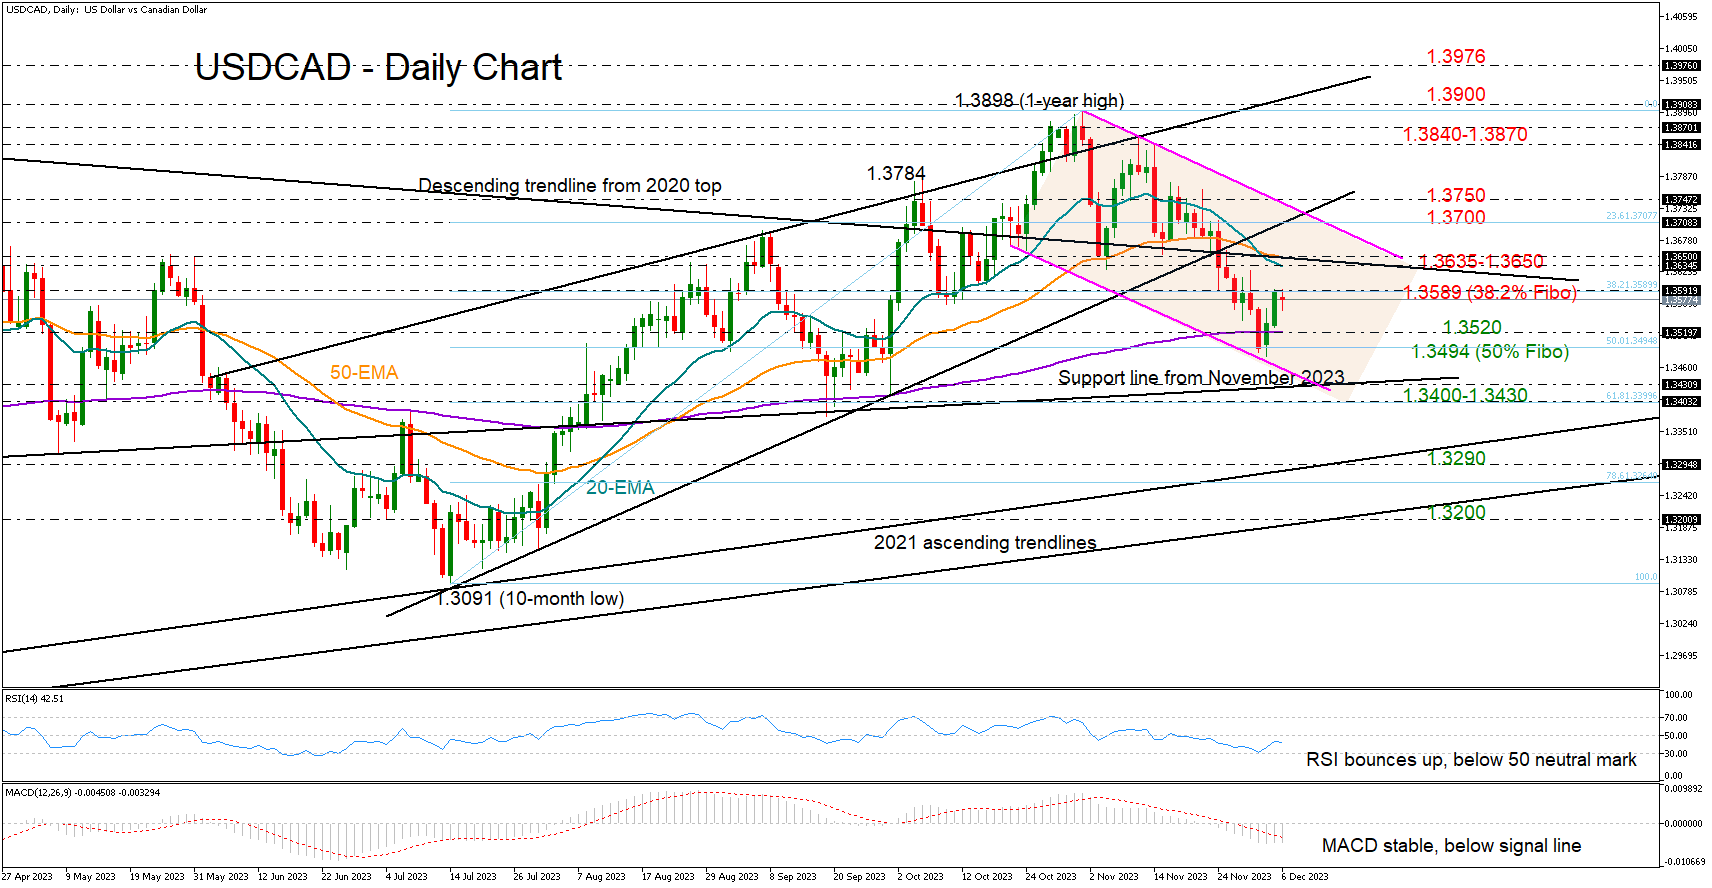
USDCAD opened with mild losses on Wednesday after Tuesday’s remarkable rally stalled near last week’s resistance of 1.3593. Traders were also in a wait-and-see mode ahead of the Bank of Canada’s rate decision at 15:00 GMT.
The 1.3593 bar overlaps with the 38.2% Fibonacci retracement of the July-October uptrend, making a pullback likely. Yet, the RSI has yet to crawl above its 50 neutral mark despite bouncing off oversold levels and the MACD is still flattening below its red signal line, suggesting that the latest rebound has not boosted buying confidence yet.
The 20- and 50-day simple moving averages (SMAs) and the descending trendline from the 2020 top could also cap any potential increases around 1.3650. If the bulls manage to breach that border, the 23.6% Fibonacci of 1.3700 and the 1.3750 restrictive region could create new risks, delaying a forceful rally to 1.3840-1.3870.
A bearish correction could initially stabilize somewhere between the 200-day SMA and the 50% Fibonacci mark of 1.3494. Should sellers dominate there, the price could slide towards the constraining line from November seen at 1.3425 or lower around the 61.8% Fibonacci of 1.3400. Additional losses could persist until the 2021 ascending trendline comes under examination within the 1.3290-1.3300 area.
In brief, USDCAD has not escaped downside risks despite regaining some ground this week. A durable recovery above 1.3700-1.3750 might be necessary for an upward outlook revision.
Germany 30 Technical: New Intraday Record High, Short-Term Bullish Trend Intact
- Cleared above 16,300 major range resistance in place since November 2021.
- Watch the 16,440 key short-term support.
The price actions of the Germany 30 Index (a proxy for the DAX futures) have continued to surge upward since our last analysis and cleared above the 16,200 short-term resistance as highlighted in our prior report.
Yesterday, 5 December it managed to have a daily close (closed at 16,534) above the 16,300 major range resistance in place since November 2021 that was tested in July 2023 where it printed an all-time high of 16,530 before it staged a decline of -11.8% in the next three months to print a low of 14,585 on October 2023.
Breakout above major range resistance
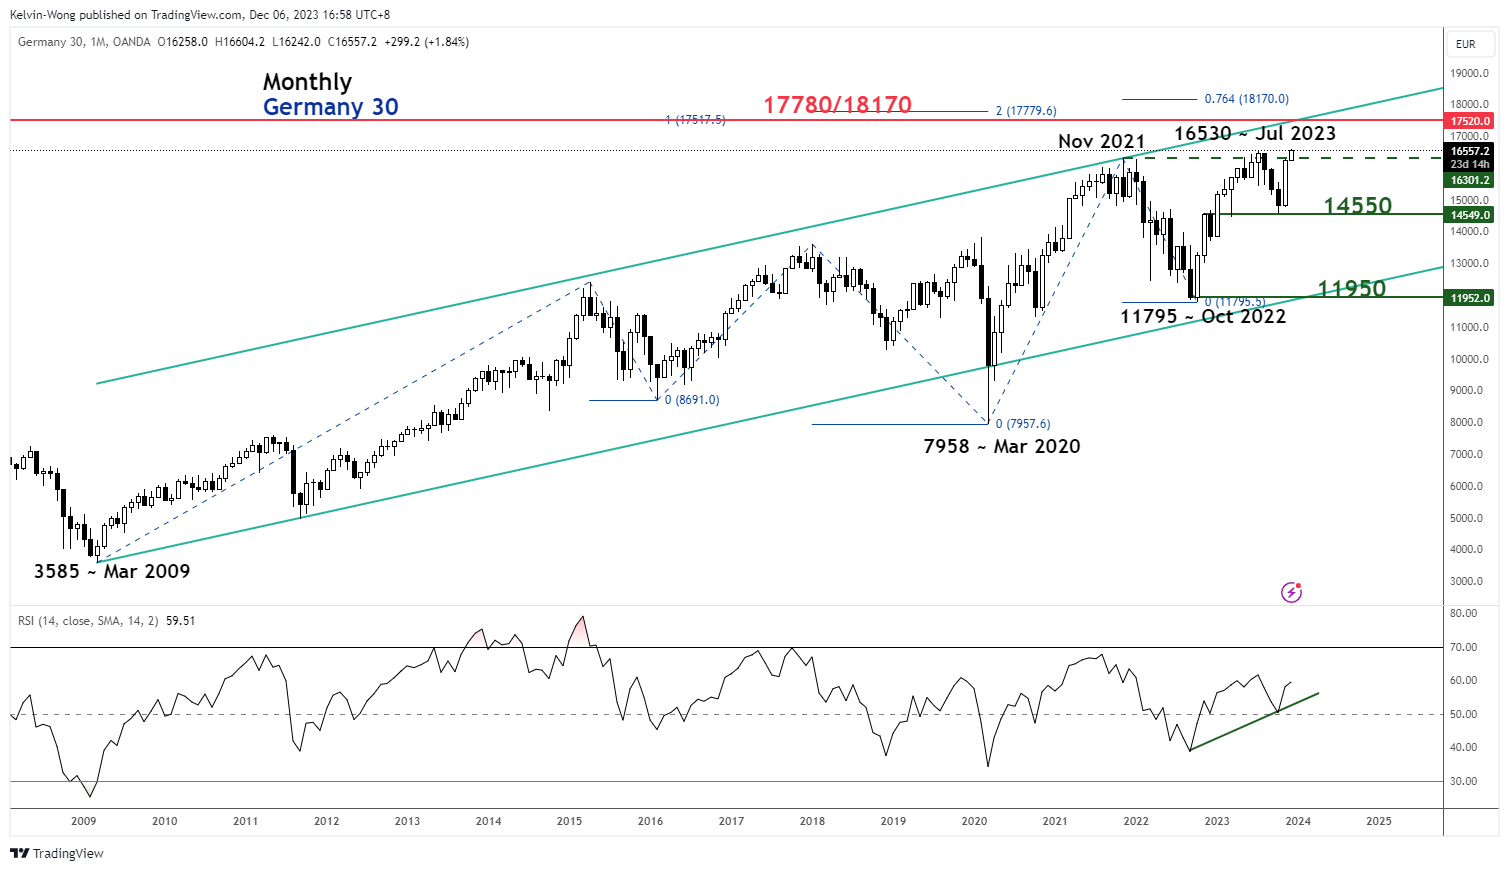
Fig 1: Germany 30 long-term secular trend as of 6 Dec 2023 (Source: TradingView, click to enlarge chart)
The risk of a failure bullish breakout above 16,300 has a lower odd this time round because the long-term monthly RSI momentum indicator has exhibited a bullish momentum reading as it shaped a higher low right at the 50 level and still has further room to manoeuvre to the upside before it reaches its overbought region (above 70 level).
All in all, the Germany 30 Index may be undergoing a major impulsive upmove sequence in place since the October 2022 low of 11,795 within its long-term secular uptrend trend phase from March 2009 low of 3,585. The intermediate major resistance zone stands at 17,780/18,170 (upper boundary of the long-term secular ascending channel & Fibonacci extension cluster).
Watch the 16,440 key short-term support
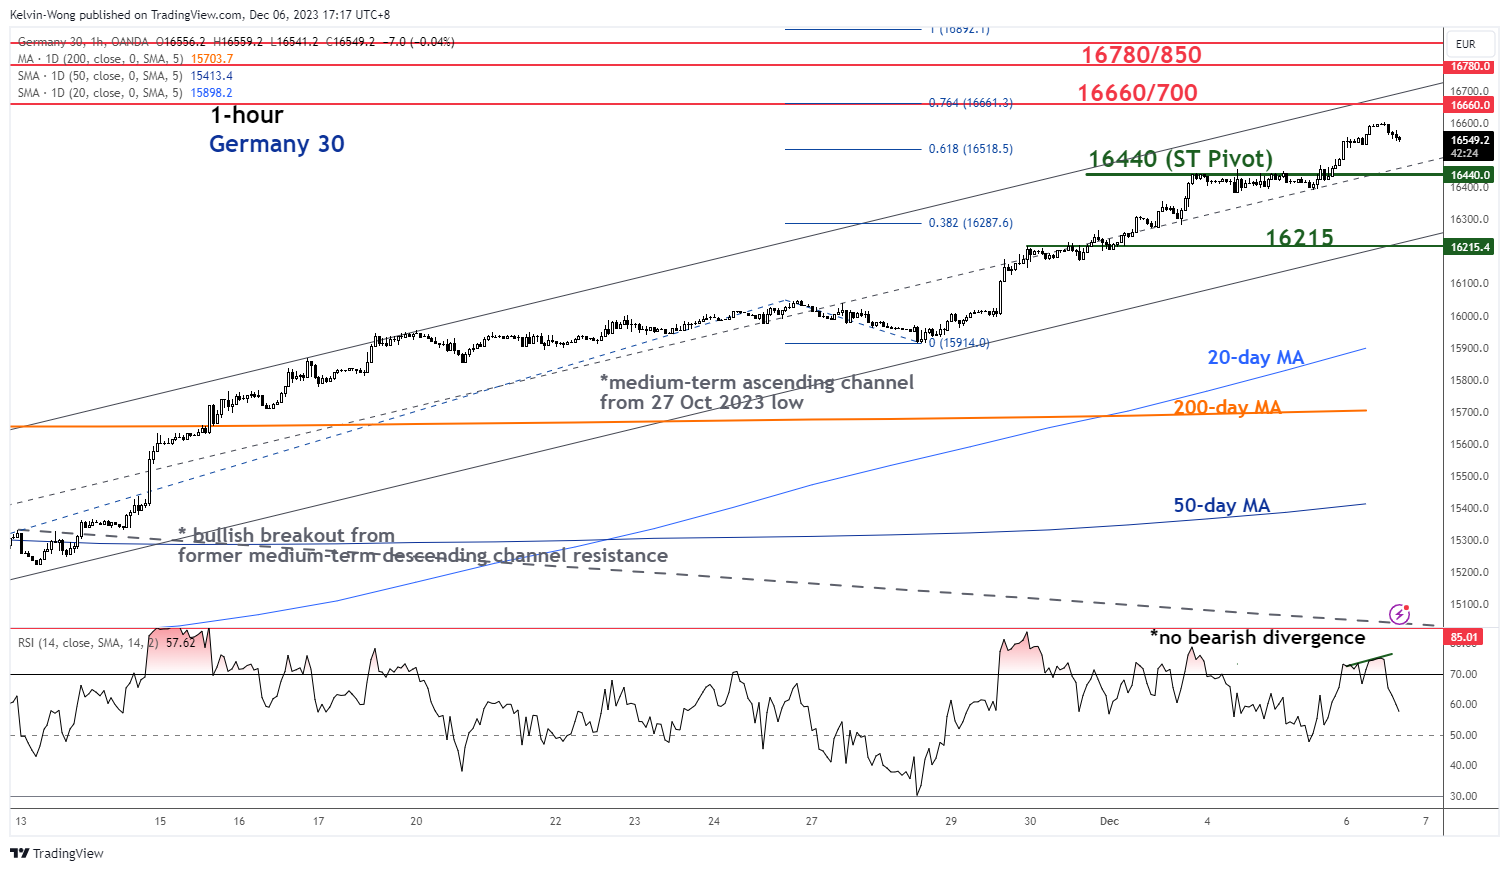
Fig 2: Germany 30 minor short-term trend as of 6 Dec 2023 (Source: TradingView, click to enlarge chart)
Based on the shorter-term hourly chart, the Germany 30 Index has continued to oscillate within the upper half of a medium-term ascending channel in place since the 27 October 2023 low, and today’s price action has ticked higher to print a fresh intraday all-time high of 16,597 at this time of the writing.
The recent exit from its overbought region as depicted by the hourly RSI momentum indicator has not flashed out a prior bearish divergence condition that highlights a higher probability of a minor pull-back in price actions rather than a steeper bearish reversal.
If the 16,440 key short-term pivotal support (also the median line of the medium-term ascending channel) manages to hold, the short-term bullish tone is likely to remain intact with the next intermediate resistances coming in at 16,660/700 and 16,780/850.
However, a breakdown below 16,440 negates the bullish tone to expose the next intermediate support at 16,215 (the lower boundary of the medium-term ascending channel).
Australian Dollar Rebounds Despite Soft GDP
- Australian GDP falls to 0.2%
- AUD/USD rebounds after two-day losing streak
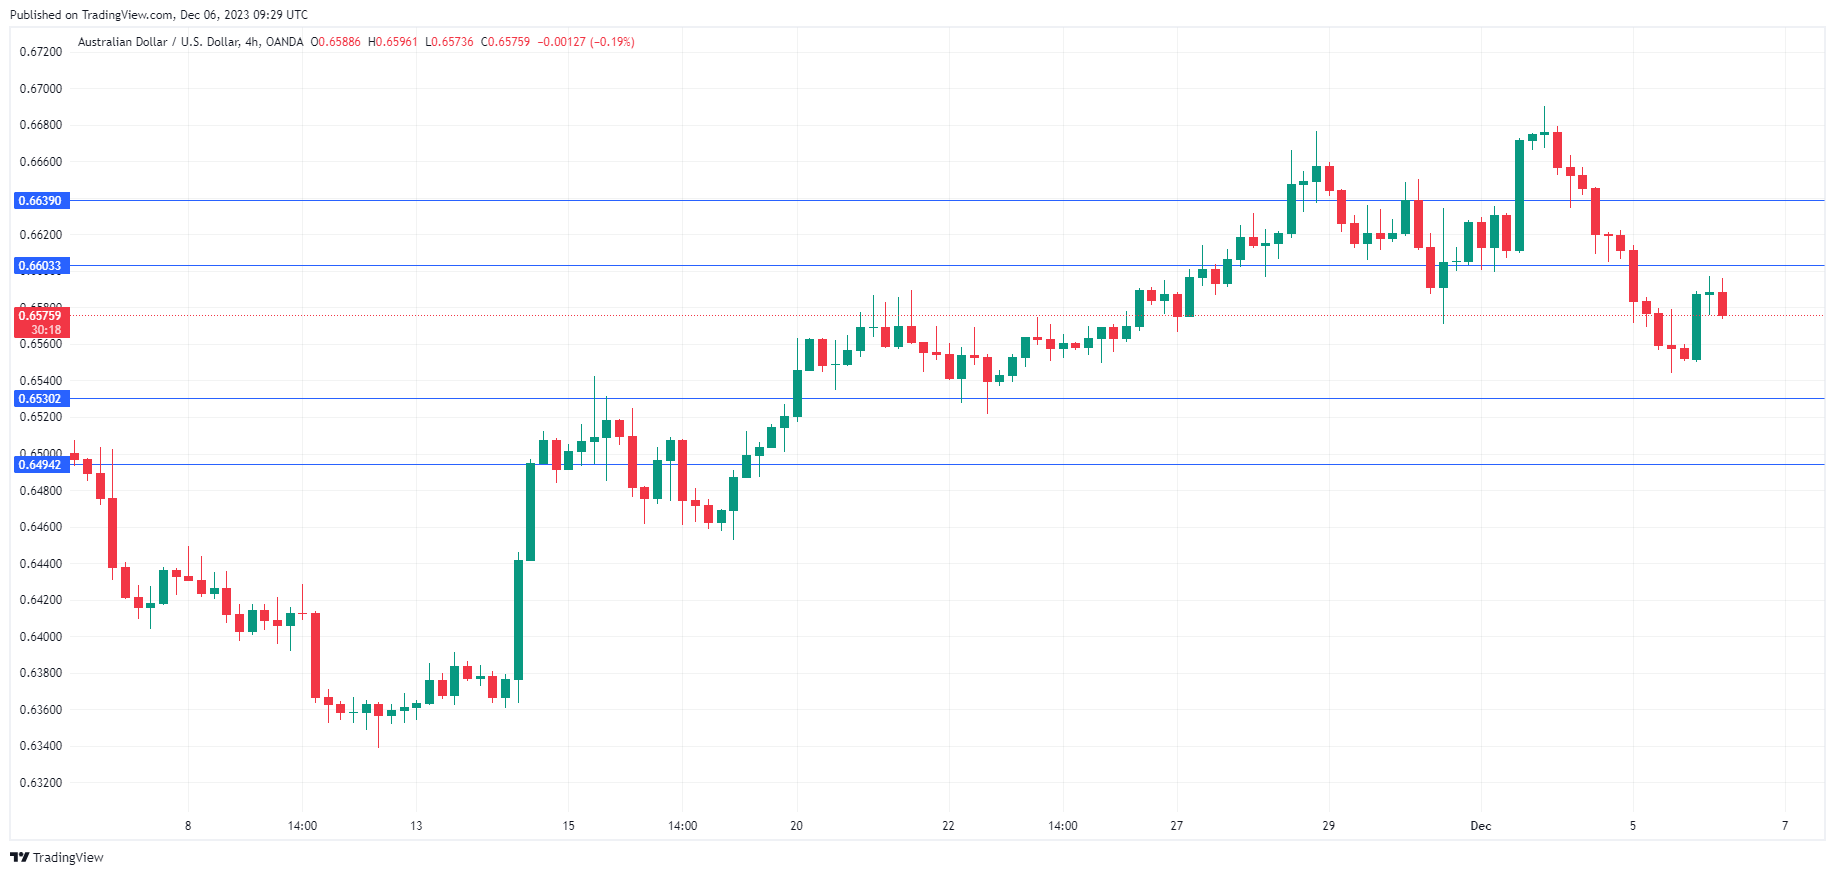
The Australian dollar has bounced back on Wednesday and snapped a two-day losing streak. In the European session, AUD/USD is trading at 0.6574, up 0.34%.
Australian GDP eases to 0.2%
Australia’s GDP rose 0.2% q/q in the third quarter, below the consensus estimate of 0.4% and the second quarter print of 0.4%. This was the weakest rate of expansion since Q3 2022, as household consumption showed no growth and exports dropped for the first time since Q1 2022. Despite the weak release, the Australian dollar is higher today.
The soft GDP report points to weak consumer spending, as consumers are being squeezed by elevated borrowing costs and high inflation. In October, headline inflation eased to 4.9% y/y, down sharply from 5.6% in September. The trimmed mean, a key core inflation indicator, ticked lower to 5.3%, down from 5.4% in September. Inflation has been heading in the right direction but consumers are still seeing pricing rising, albeit at a slower pace.
The drop in exports is a worrisome event and is largely due to the slowdown in China, which is Australia’s largest export market. China’s growth has been slowing, debt is rising and the property sector is in crisis with some of the largest construction companies facing bankruptcy. On Tuesday, Moody’s rating agency cut its credit outlook for China from stable to negative. Moody’s maintained China’s credit rating at A1, but the credit outlook downgrade reflects deep concern about the state of China’s economy.
On Tuesday, China’s Caixin Services PMI improved in November to 51.5, up from 50.4 in October. This indicates weak growth, with the 50 line separating contraction from expansion. The manufacturing sector has been a drag on the economy, with manufacturing PMIs indicating contraction in eight of the past nine months.
AUD/USD Technical
- There is support at 0.6530 and 0.6494
- 0.6603 and 0.6639 are the next resistance lines