Sample Category Title
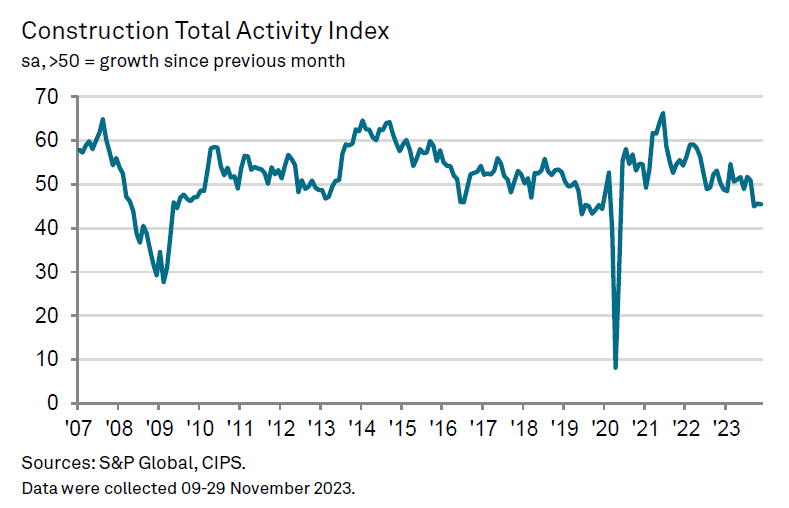
UK PMI construction fell to 45.5, ongoing sectoral downturn
UK PMI Construction ticked down from 45.6 to 45.5 in November, remaining below the neutral 50 mark and underperforming against the expected 47.1. This level indicates continued contraction in the construction sector for the third month, marking it as the second-lowest reading since May 2020.
Tim Moore of S&P Global Market Intelligence highlighted the sector's issues, stating, "A slump in house building has cast a long shadow over the UK construction sector." He pointed out that the downturn in residential construction has persisted for the past 12 months, with recent reductions among the steepest since 2009.
Elevated mortgage costs and adverse market conditions were cited as key reasons for the decline in housing projects. Additionally, rising interest rates and economic uncertainty are adversely affecting commercial construction, while civil engineering activity saw its sharpest drop since July 2022.
Moore also noted a significant decrease in overall input prices for the second consecutive month, marking the fastest rate of decline since July 2009. Despite this decrease in costs, the sector continues to face substantial challenges.
Bitcoin and Ether Reach New Heights. Where is the Stopping Point?
Market picture
The crypto market made another leap forward on Tuesday afternoon after spending less than 24 hours in consolidation mode. In the last day, the total crypto cap reached $1.6 trillion, up 3.9% in a day, 11% in a week and 20% in 30 days. The acceleration in recent days is evident, which may reflect both speculators hastily closing short positions and increasing FOMO.
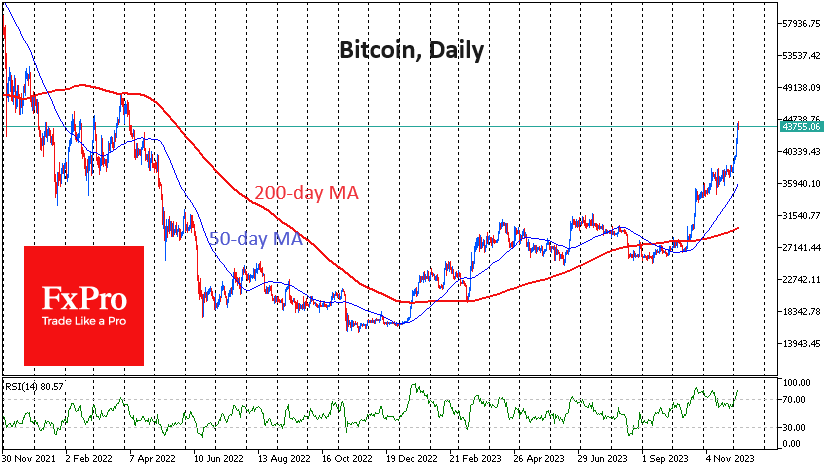
Bitcoin is adding over 5% in 24 hours, trading near $43.7K at the time of writing and touching $44.5K at the start of the day. Previously, we have repeatedly noted “thin air territory” in the $40-46K range. The market did not linger here in previous times, and we should look for hints of turning points not earlier than the $46-47K area, where there was a reversal in March last year and temporary support in 2021.
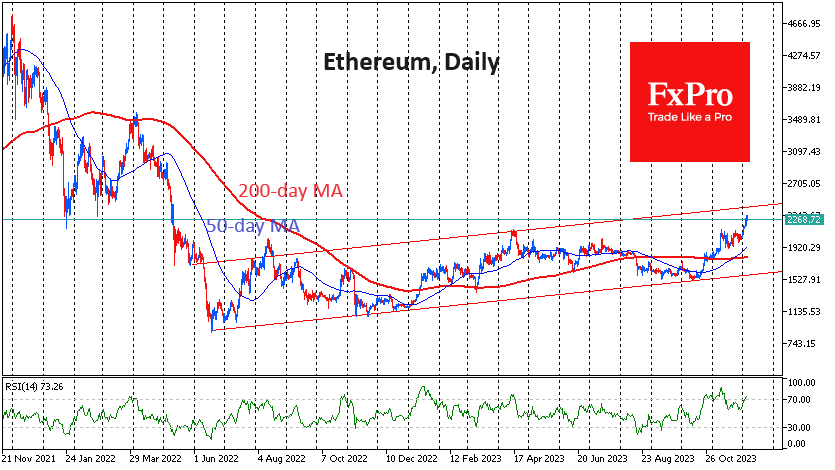
Ethereum tested $2300 but has so far quickly retreated to $2260. In the dynamics of ETH since the middle of last year, a broad upward channel can be identified, the upper boundary of which now passes through $2430. It is worth being prepared for the bulls to pull the price closer to these levels before deciding to take profits.
News background
According to unconfirmed rumours, Qatar’s sovereign wealth fund is preparing to enter the crypto market with huge investments and invest up to $500 billion in VTS, said Max Kaiser, advisor to the president of El Salvador. In his opinion, VTS may soon overcome the $150K mark and go further.
Bloomberg Intelligence strategist Mike McGlone believes Bitcoin is now showing much more strength than gold, which hit record highs earlier in the week but then collapsed 5%.
Brazil’s largest bank, Itau Unibanco, has launched a Bitcoin and Ethereum trading service for clients of its investment platform, confirming its willingness to become a full participant in the country’s growing cryptocurrency market.
Tether’s unrealised profits from Bitcoin investments reached $1.1 billion. According to EmberCN, Tether holds 57,576 BTC with a purchase price of $22,480 per coin.
Cryptocurrencies have spent a record $19 million on lobbying in the US this year. The leader in spending on defending its interests was cryptocurrency exchange Coinbase, which this year allocated $2.16 million for lobbying.
Can NZDUSD Bulls Keep the Rally Alive?
- NZDUSD in the green today but sentiment mixed
- Key market events increase possibility of stronger moves
- Momentum indicators on the brink of giving bearish signals
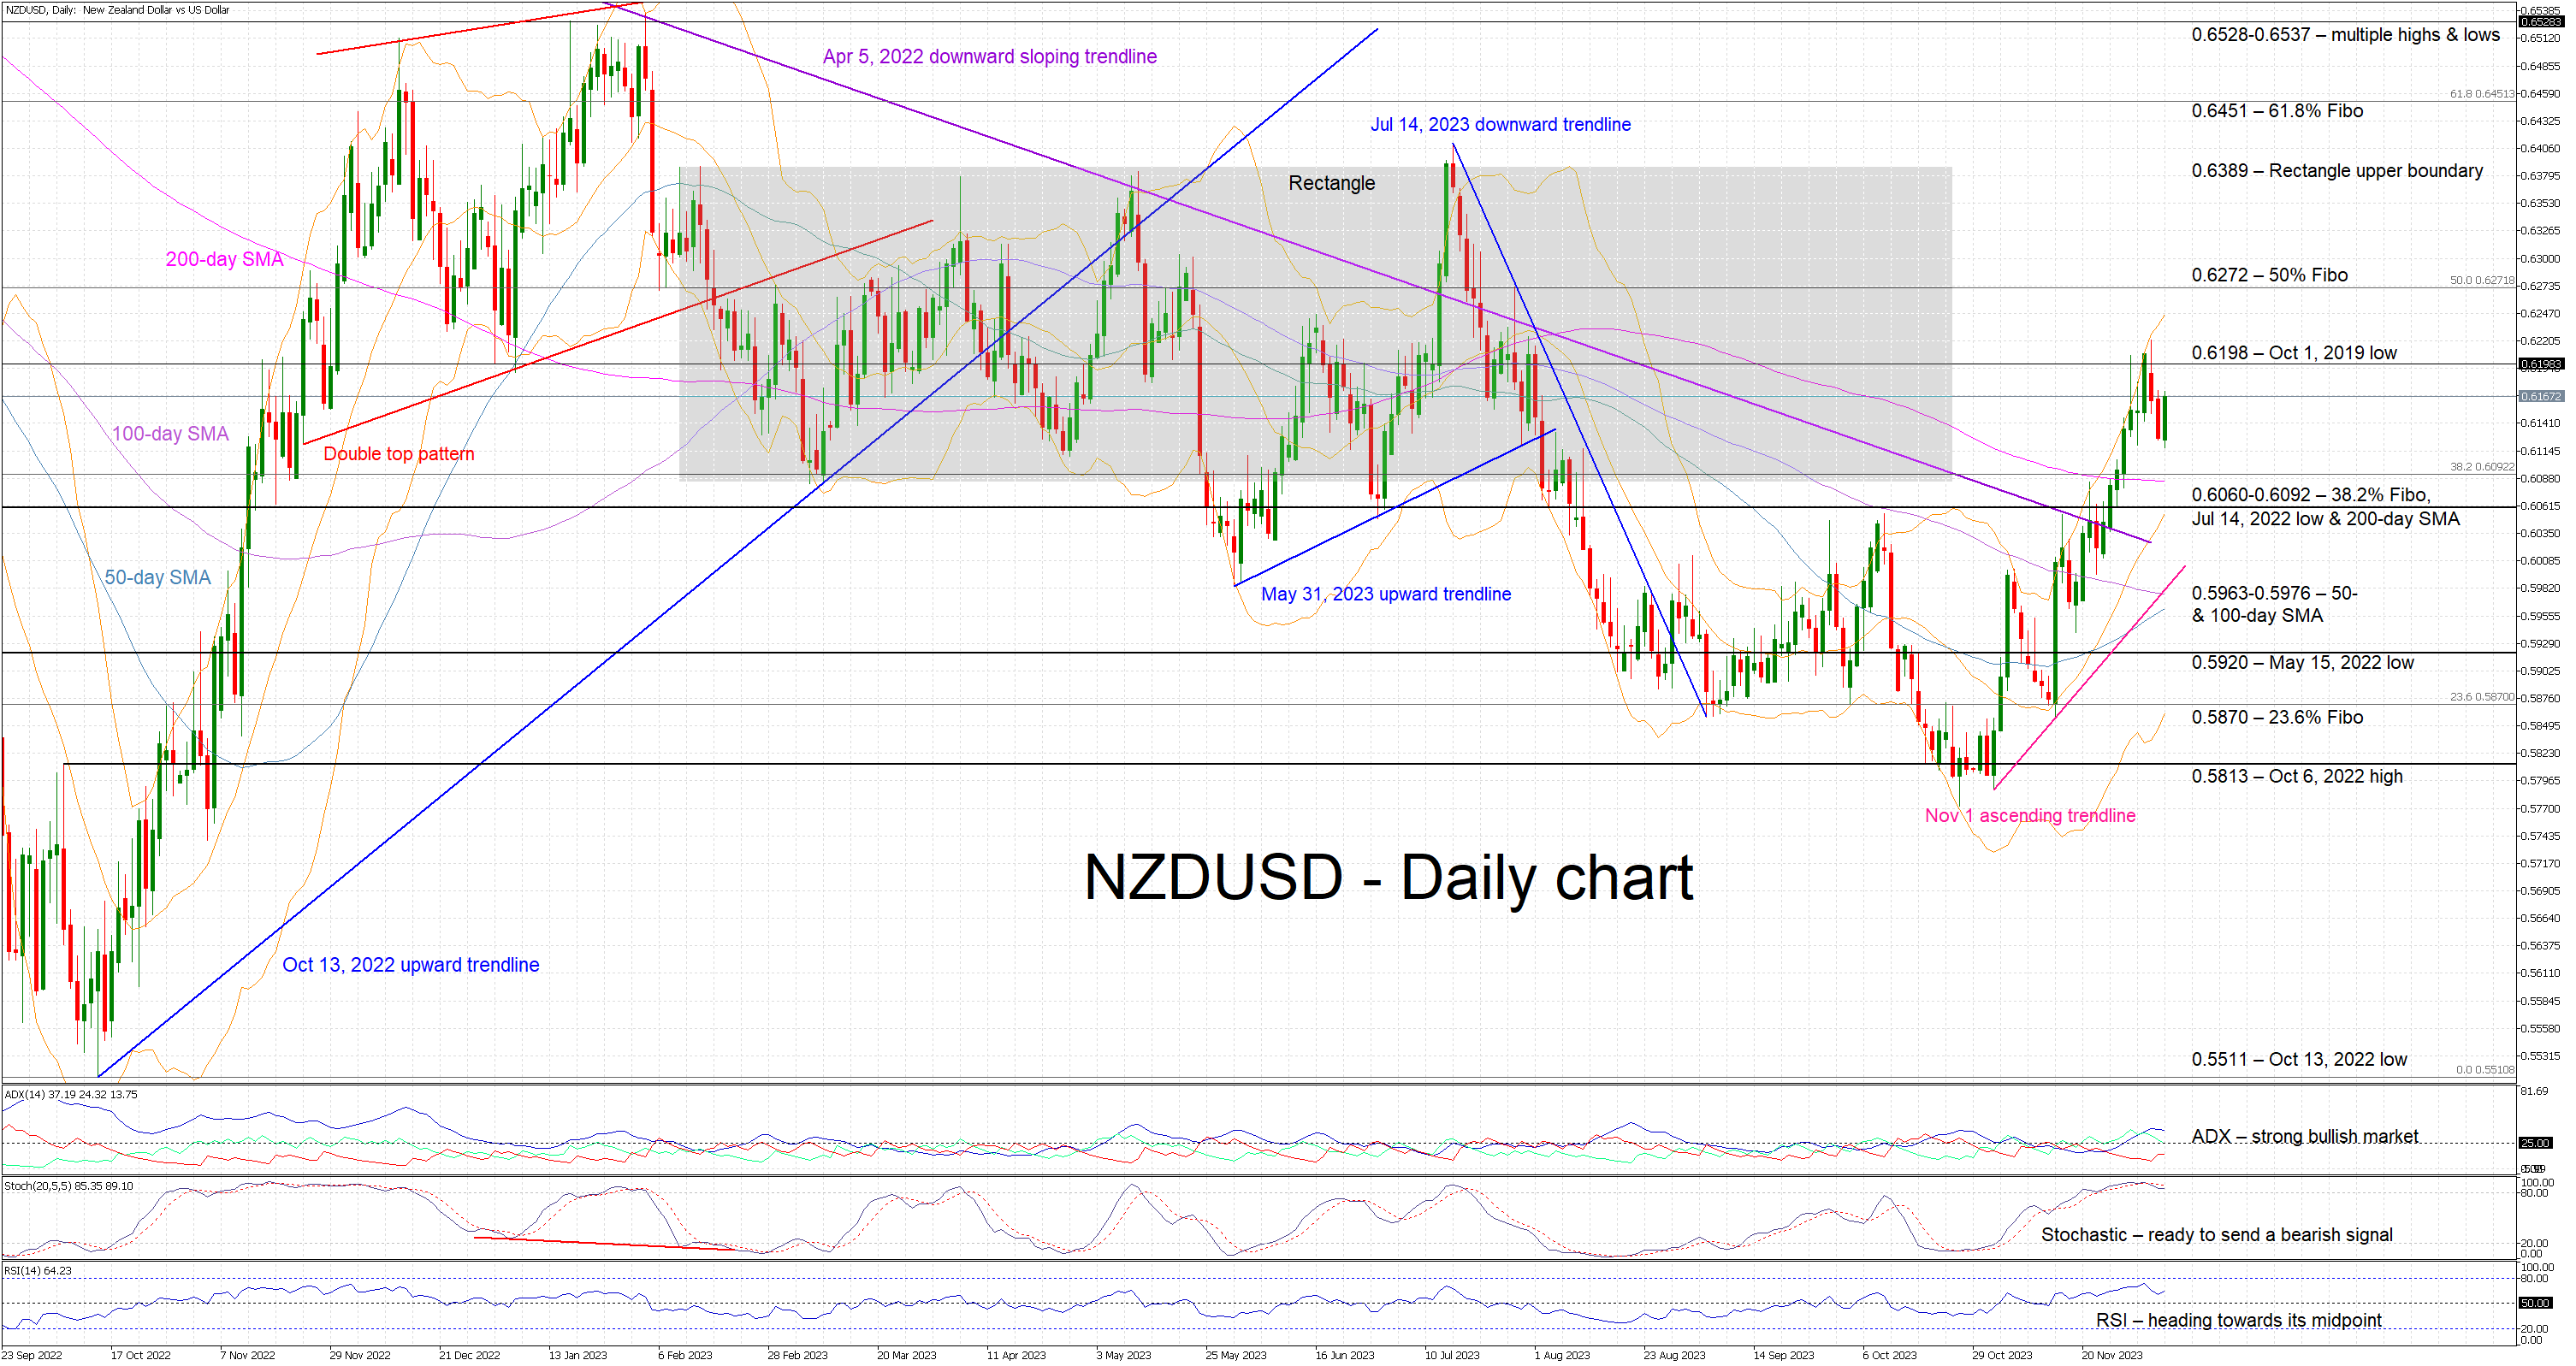
NZDUSD is edging higher today, reacting to the previous two sizeable red candles. It has been an aggressive rally from the November 1 low of 0.5788 as NZDUSD bulls took advantage of the widespread USD weakness and the relative hawkishness of the RBNZ to record a 3-month high of 0.6222. In the meantime, the convergence of the 50- and 100-day simple moving averages (SMA) means that volatility could remain high this week.
Amidst these developments, the focus has turned to the momentum indicators. More specifically, the Average Directional Movement Index (ADX) is above its threshold, but it is now trading sideways and thus casting a shadow over the current upleg. Similarly, the RSI is edging slightly higher but remains below its recent peak. More importantly, the stochastic oscillator has broken below its moving average and prepares to exit the overbought area. Should such a move take place, it could be seen as a first strong bearish step.
If the bulls are keen to record a higher high, they could try to push NZDUSD above the October 1, 2019 low at 0.6198 and then potentially set their eyes on the 0.6272 level. This is defined by the 50% Fibonacci retracement of the April 5, 2022 – October 13, 2022 downtrend, and, if broken, it could open the door for a more protracted rally towards the 0.6389 level.
On the flip side, the bears are trying to regain market control. They could try to push NZDUSD towards the busy 0.6060-0.6092 region, which is populated by the 38.2% Fibonacci retracement, the July 14, 2022 low and the 200-day SMA. Even lower, the path looks clear until the 0.5963-0.5976 region that is set by the 50- and 100-day SMAs.
To sum up, NZDUSD bulls have managed to record a 3-month high, but their aim for a higher high appears to be more difficult now since the momentum indicators are preparing to turn bearish.
EUR/CHF Daily Outlook
Daily Pivots: (S1) 0.9435; (P) 0.9452; (R1) 0.9465; More...
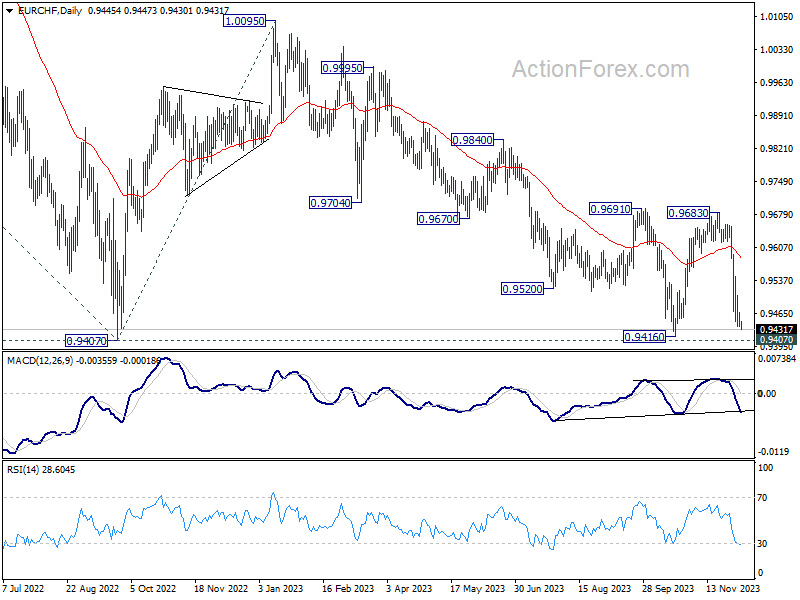
Intraday bias in EUR/CHF remains on the downside despite some loss of downside momentum. Retest of 0.9407/16 support zone should be seen. Decisive break there will resume larger down trend. On the upside, above 0.9467 minor resistance will delay the bearish case and turn intraday bias neutral for consolidation first.
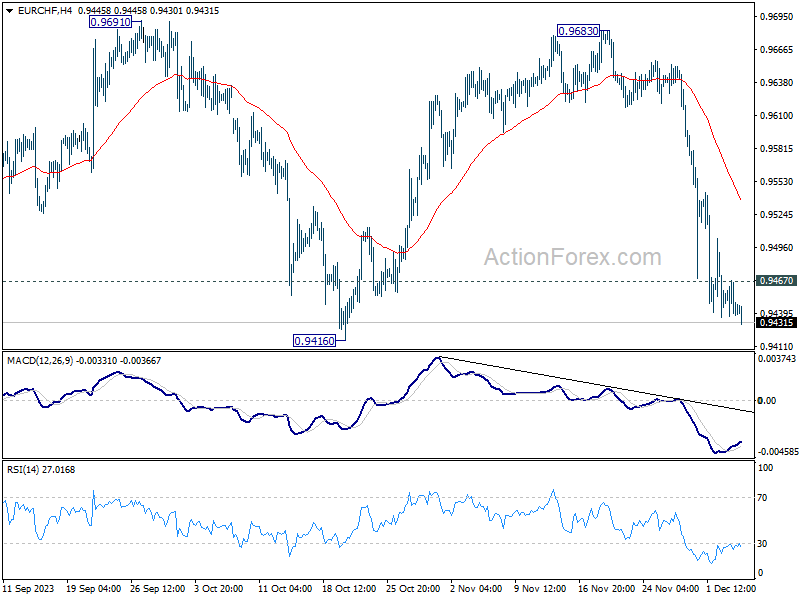
In the bigger picture, medium term outlook remains bearish as long as 0.9683 resistance holds. Firm break of 0.9407 (2022 low) will resume long term down trend. Next target will be 61.8% projection of 1.1149 to 0.9407 from 1.0095 at 0.9018.
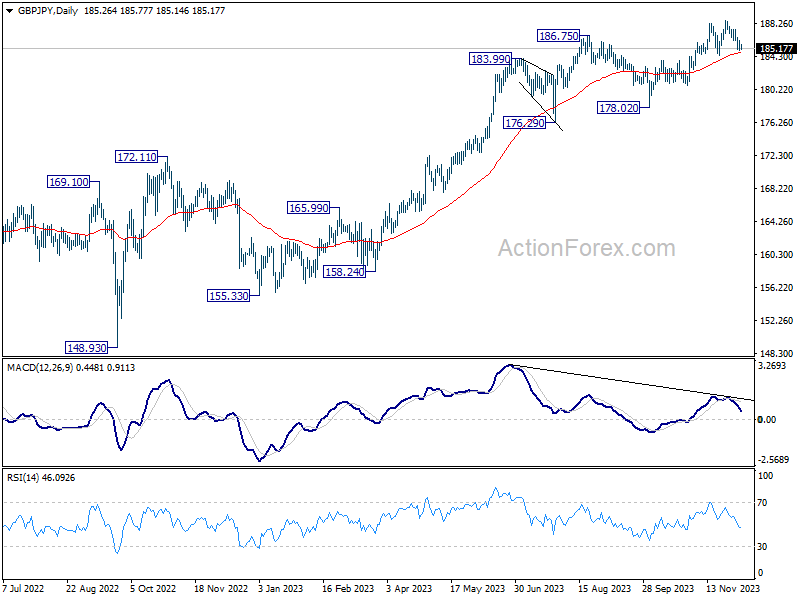
GBP/JPY Daily Outlook
Daily Pivots: (S1) 184.88; (P) 185.54; (R1) 186.01; More...
GBP/JPY is still staying in range of 184.44/188.63 and intraday bias remains neutral first. As long as 184.44 support holds, further rally is expected. Decisive break of 188.63 will resume larger up trend. However, firm break of 184.44 will turn bias to the downside for deeper correction back to 178.02 support instead.
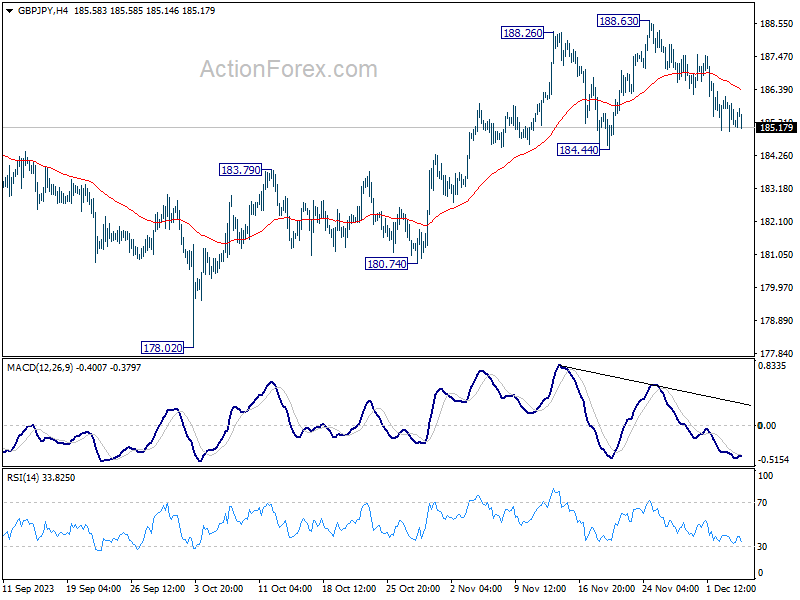
In the bigger picture, as long as 184.44 support holds, larger up trend from 123.94 (202 low) should still be in progress, next target is 195.86 (2015 high). However, firm break of 184.44 will now argue that a medium term top is formed, possibly in bearish divergence condition in D MACD, and bring deeper fall back to 178.02 support.
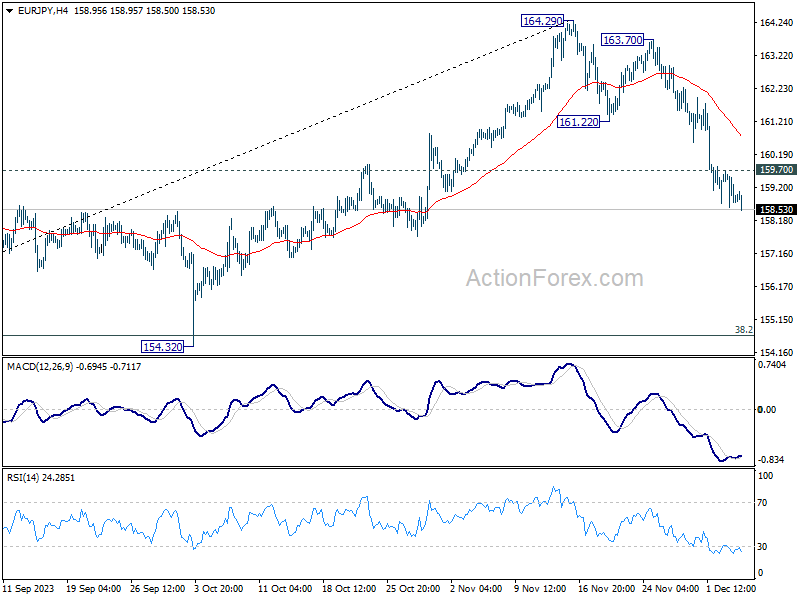
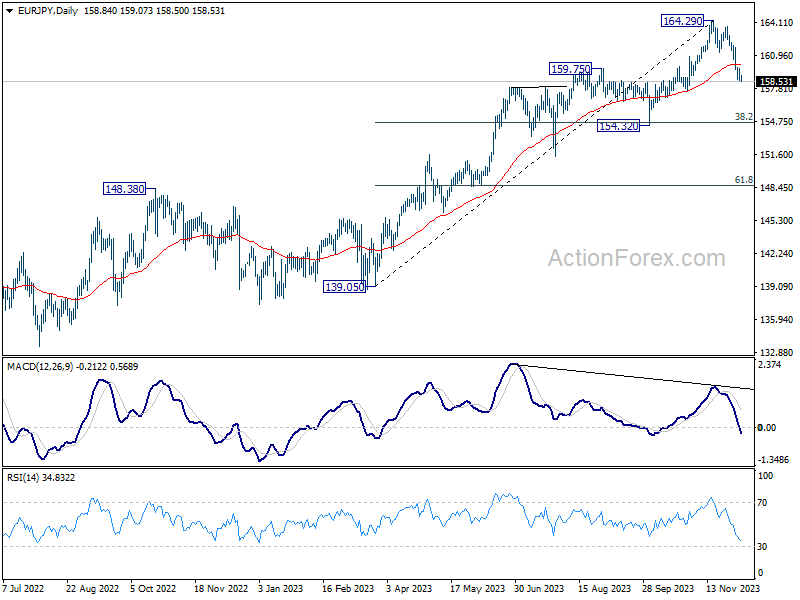
EUR/JPY Daily Outlook
Daily Pivots: (S1) 158.41; (P) 159.07; (R1) 159.55; More..
Intraday bias in EUR/JPY remains on the downside at this point. Current fall from 164.29 should target 154.32 cluster support (38.2% retracement of 139.05 to 164.29 at 154.64). On the upside, above 159.70 minor resistance will turn intraday bias neutral and bring consolidations first, before staging another decline.
In the bigger picture, bearish divergence condition in 55 D EMA indicates that a medium term top could be formed at 164.29 already, after hitting rising channel resistance. But price actions from there are tentatively seen as a correction only. There is no clear sign that the up trend from 144.42 (2020 low) has completed yet. As long as 55 W EMA (now at 152.12) holds, another rally through 164.29 is still in favor as a later stage.
EUR/GBP Daily Outlook
Daily Pivots: (S1) 0.8563; (P) 0.8575; (R1) 0.8586; More....
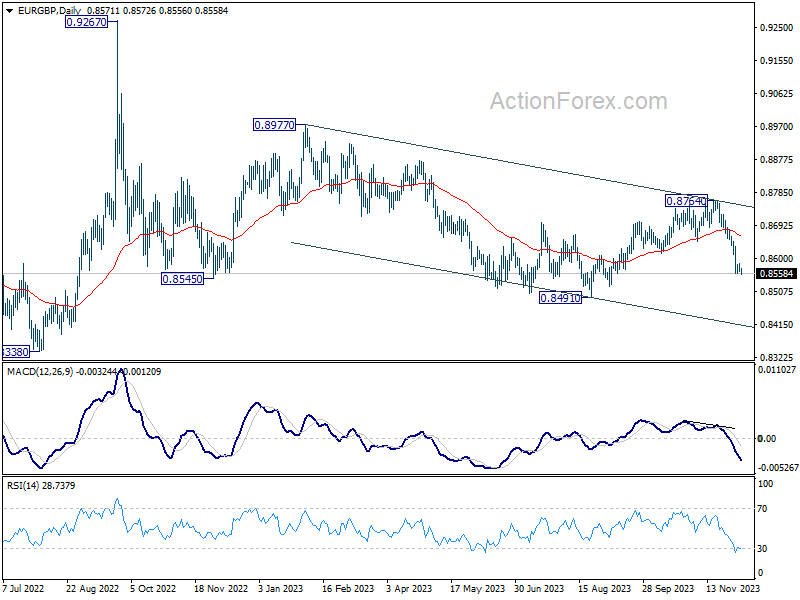
Despite some loss of downside momentum, there is no sign of bottoming yet. Intraday bias stays on the downside. Fall from 0.8764 should target a retest on 0.8491 low. Firm break there will resume larger down trend. On the upside, above 0.8587 minor resistance will turn intraday bias neutral and bring consolidations first, before staging another decline.
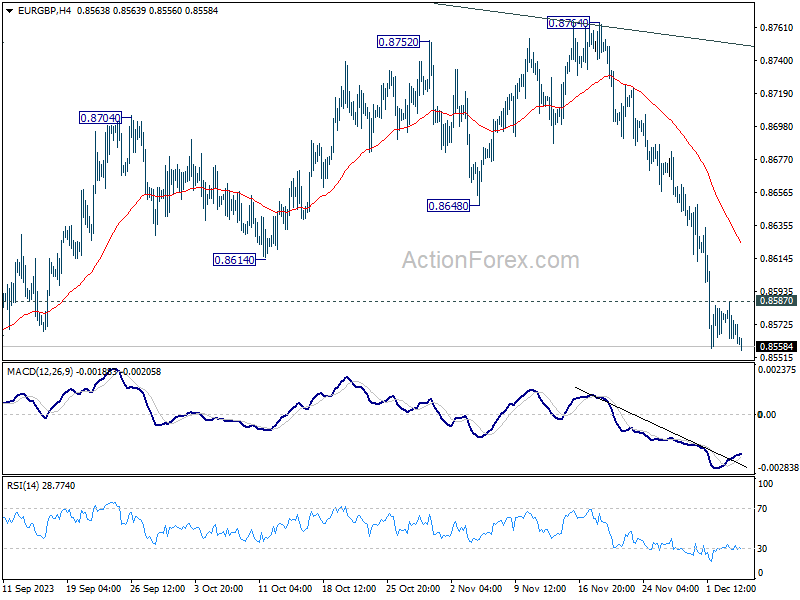
In the bigger picture, current development suggests that down trend from 0.9267 (2022 high) is still in progress. This decline is now seen as the third leg of the pattern from 0.9499 (2020 high). Break of 0.8201 will target 100% projection of 0.9499 to 0.8201 from 0.9267 at 0.7969. In any case, outlook will stay bearish as long as 0.8764 resistance holds.
EUR/AUD Daily Outlook
Daily Pivots: (S1) 1.6382; (P) 1.6449; (R1) 1.6548; More...
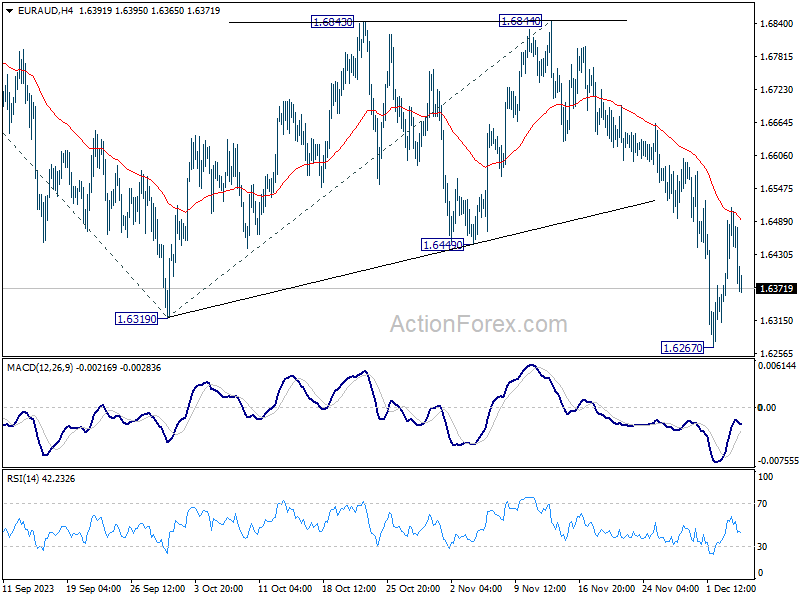
Intraday bias in EUR/AUD remains neutral at this point as consolidations from 1.6267 is extending. Outlook stays bearish as long as 1.6844 resistance holds. On the downside, break of 1.6267 will resume larger decline from 1.7062 to 100% projection of 1.7062 to 1.6319 from 1.6844 at 1.6106 next.
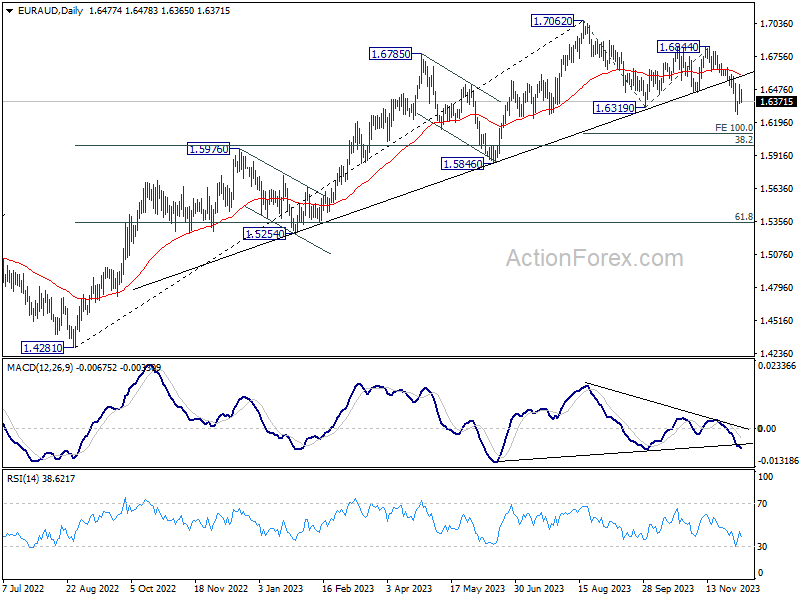
In the bigger picture, the break of medium term trend line support now suggests fall from 1.7062 correcting the whole up trend from 1.4281 (2022 low). Deeper decline would be seen to 38.2% retracement of 1.4281 to 1.7062 at 1.6000. Strong support could be seen there to bring rebound on first attempt. But risk will stay on the downside as long as 1.6844 resistance holds. Sustained break of 1.6000 would bring further fall to 61.8% retracement at 1.5343.
DXY Escaped Downward November Trend Channel
Markets
Monday’s uptick in yields already got wiped out yesterday. Culprit this time: US JOLTS. October job openings fell from a downwardly revised 9350k to 8733k vs the 9300k expected. It’s still a historically high number but it suggests the labour market is further normalizing. In current circumstances this is all the evidence (for a quick Fed pivot) markets are looking for. The US services ISM rose to a higher than expected 52.7 on a combination of rising business activity (55.1) and a solid flow of new orders (55.5). Employment, however, undershot expectations by growing only marginally, strengthening the message coming from the JOLTS. Prices paid barely eased from 58.6 to 58.3. US yields shed between 5.9 (2-y) and 11.3 bps (30-y). ECB’s Schnabel Reuters interview triggered Bund outperformance for most of the day before UST’s caught up later. German yields dropped 8.5-14.2 bps with the long end outperforming. Stocks in Europe eked out a nice gain, allowing the EuroStoxx50 to surpass important resistance in the 4400 area. In the US however, the yield drop offered much less equity support. The jury’s out on whether the soft landing scenario is all but priced in now. EUR/USD dropped towards next support at 1.08. DXY escaped the downward November trend channel by closing above 104. Currencies Down Under underperformed. Moody’s cut the rating outlook of a key trading partner, China, to negative. It highlighted the economic and financial uncertainty surrounding the country. While the CNY held its nerves yesterday, it is facing stronger selling pressures this morning. USD/CNY gaps higher to 7.158. With news flow thin otherwise, we move on to today’s eco calendar. On the agenda are meetings by the Canadian and Polish central bank and US ADP employment growth. The latter is expected at 130k. Risks for an asymmetric market reaction remain live. The US 10-y is nearing the 50% retracement on the 2023 rise fast (4.13%). In the corrections of the past several years, this often served as an important support. However, we don’t want to call the end until we actually see yields stop moving south on disappointing (activity) data. Since US yield moves lately easily spilled over to Europe, we hold on to a stronger dollar, more so given the recessionary vibe that’s looming over the continent. EUR/USD is currently losing the 1.08 with next support kicking in at 1.0756 and 1.0733. Sterling continues to be in a sweet spot. EUR/GBP is stabilizing near the recent lows just north of support at 0.8557.
News & Views
Australian GDP growth unexpectedly slowed to 0.2% in Q3 from 0.4% in Q2, the country’s bureau of statistics released this morning. Activity was 2.1% higher compared to the same month last year. It was the eighth straight rise in quarterly GDP, but consensus expected a faster 0.5% Q3 growth. Government spending and capital investment were the main drivers of Q3 GDP growth. Government final consumption expenditure rose 1.1%, driven by social benefits to households. Defense also contributed to growth. A 1.1% increase in gross capital formation was also supported by public corporation activity. Change in inventories contributed 0.4% to GDP growth but this mainly reflected falling exports. Net trade contributed a net -0.6% to growth. Household consumption in Q3 was flat, even as the household saving to income ratio dropped for the eight straight quarter to 1.1%, the lowest since Q4 2007. The Q3 GDP release allows the RBA to keep a guarded wait-and-see approach. The 2-y government bond yield dropped 10 bps this morning (3.98%). The Aussie dollar initially rose in a positive risk sentiment, but the rebound slowed after the release of the GDP data. AUD/USD currently trades slightly below 0.66.
Spain, which currently holds the EU presidency, proposed a new framework aimed at reducing government deficits while at the same time leaving room for green and defense investments, Bloomberg reported citing people familiar with the matter. The proposal would oblige countries to cut debt as a percentage of GDP by an average 1 ppt over an adjusted period when it exceeds 90% of GDP. Countries with debt to GDP levels between 60% and 90% would have to reduce their debt by half that pace. According the report, countries would also need to build a fiscal buffer of 1.5% of GDP, below the ECB’s 3.0% target, but it would give governments leeway to finance the green transition and support the block’s military capacity. In the proposal, a government expenditure cap might also be an important mechanism to reduce the deficits.
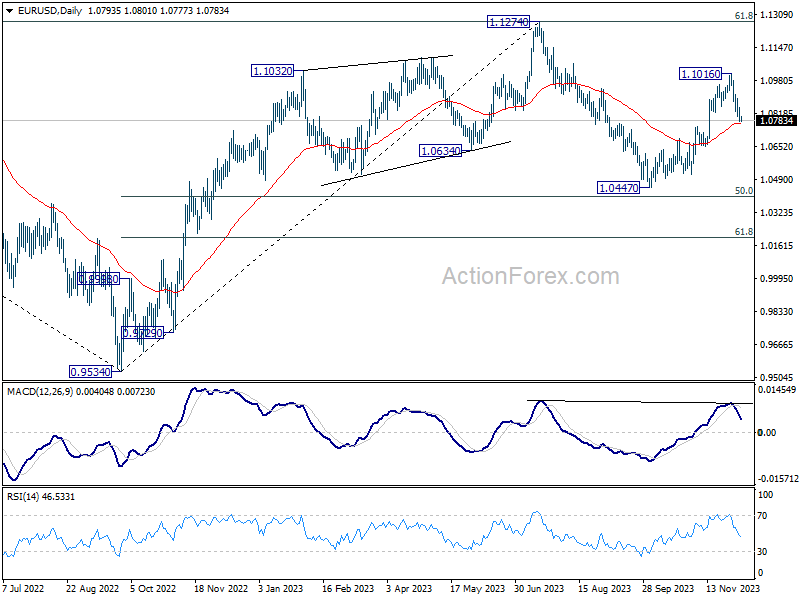
EUR/USD Daily Outlook
Daily Pivots: (S1) 1.0768; (P) 1.0808; (R1) 1.0838; More...
Intraday bias in EUR/USD remains on the downside at this point. Current fall from 1.1016 short term top is in progress. Sustained break of 55 D EMA (now at 1.0770) will pave the way to retest 1.0447 support. On the upside, above 1.0846 minor resistance will turn intraday bias neutral first. But risk will stay on the downside as long as 1.1016 resistance holds, in case of recovery.
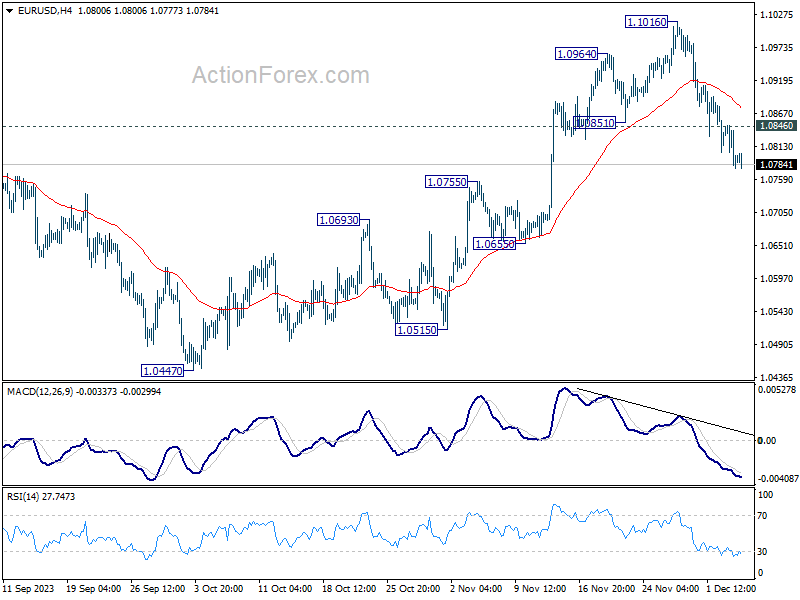
In the bigger picture, price actions from 1.1274 are viewed as a corrective pattern to rise from 0.9534 (2022 low). Rise from 1.0447 is tentatively seen as the second leg. Hence while further rally could be seen, upside should be limited by 1.1274 to bring the third leg of the pattern. Meanwhile, sustained break of 55 D EMA will argue that the third leg has already started for 1.0447 and below.