Sample Category Title
BoC set to stand pat, will dovish shift follow?
BoC is widely expected to hold overnight rate target steady at 5.00% today, amidst a backdrop of increasing economic challenges. Current market climate suggests the potential for a slightly dovish shift in the central bank's statement. However, while there is speculation among some investors about the possibility of BoC commencing rate cuts as early as the second quarter of next year, it seems premature for the central bank to signal any definite intentions in this regard at the current juncture.
Governor Tiff Macklem's recent comments have significantly influenced market expectations. He noted that "the excess demand in the economy that made it too easy to raise prices is now gone" and the economy is "approaching balance". His observation that softening economic activity will exert "more downward pressure on inflation" and the acknowledgment that "interest rates may now be restrictive enough" have nearly eliminated the odds of further rate hikes.
In a recent Reuters poll, a majority of economists, specifically 18 out of 26, projected that BoC's rate would decrease to 4.0% or lower by the end of 2024. Nevertheless, Macklem is expected to reiterate that discussions about rate cuts are still premature, indicating a cautious approach from the central bank in the face of uncertain economic conditions.
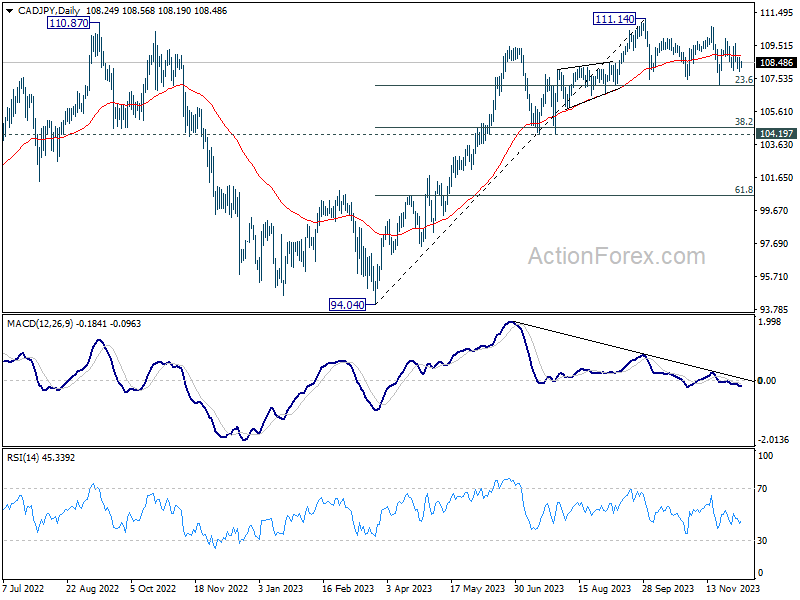
CAD/JPY has been bounded in range trading below 111.14 since September. The pull back is so far rather shallow as contained by 23.6% retracement of 94.04 to 111.14 at 107.10. There is not sign of trend reversal, and another rise through 111.14 is still in favor. However, considering bearish divergence condition in D MACD, upside potential could be relatively limited.
On the other hand, firm break of 107.10 could indicate that deeper decline is underway to 38.2% retracement of 104.60, or even further to 61.8% retracement at 100.57. However, such a significant decline would likely require concurrent dovish policy shifts from BoC and hawkish turn from BoJ, potentially materializing early in the next year.
Technical Outlook and Review
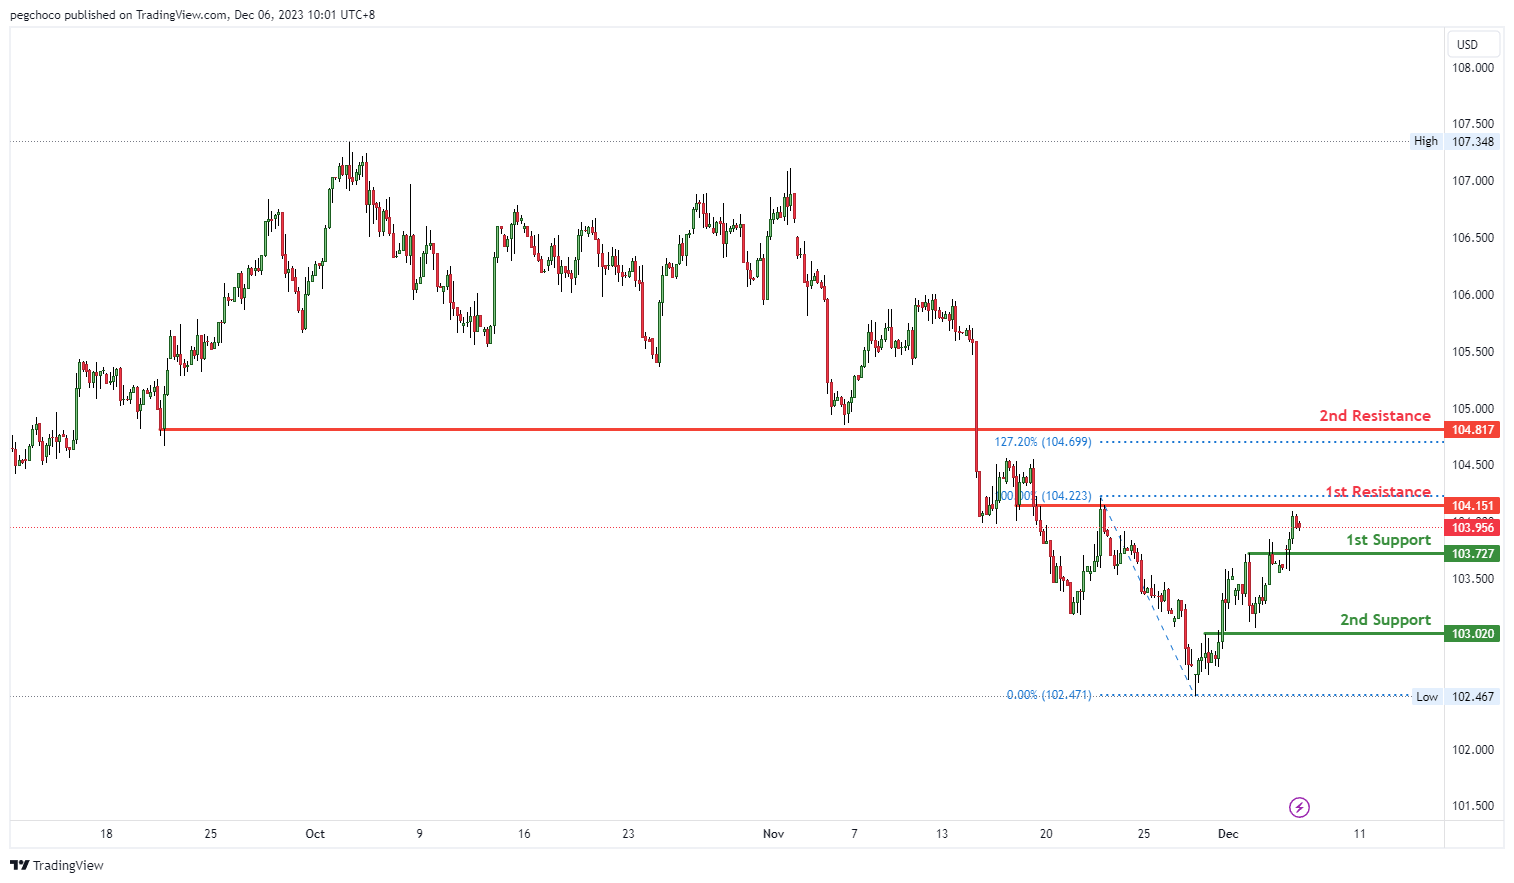
DXY:
The DXY (US Dollar Index) chart currently has a bearish overall momentum, and there’s potential for a bearish continuation towards the 1st support level.
The 1st support at 103.72 is categorized as a pullback support, suggesting that it could be a significant level where buying interest may emerge, potentially providing support for the DXY.
Further down, there is a 2nd support at 103.02, also identified as an overlap support. This reinforces the significance of this support level, suggesting it as a potential area where buyers might become active.
On the resistance side, the 1st resistance at 104.15 is noted as an overlap resistance. This implies that it’s a substantial barrier where selling interest could intensify, potentially triggering a bearish continuation.
The 2nd resistance at 104.81 is identified as a pullback resistance, further reinforcing the potential resistance factors for the DXY.
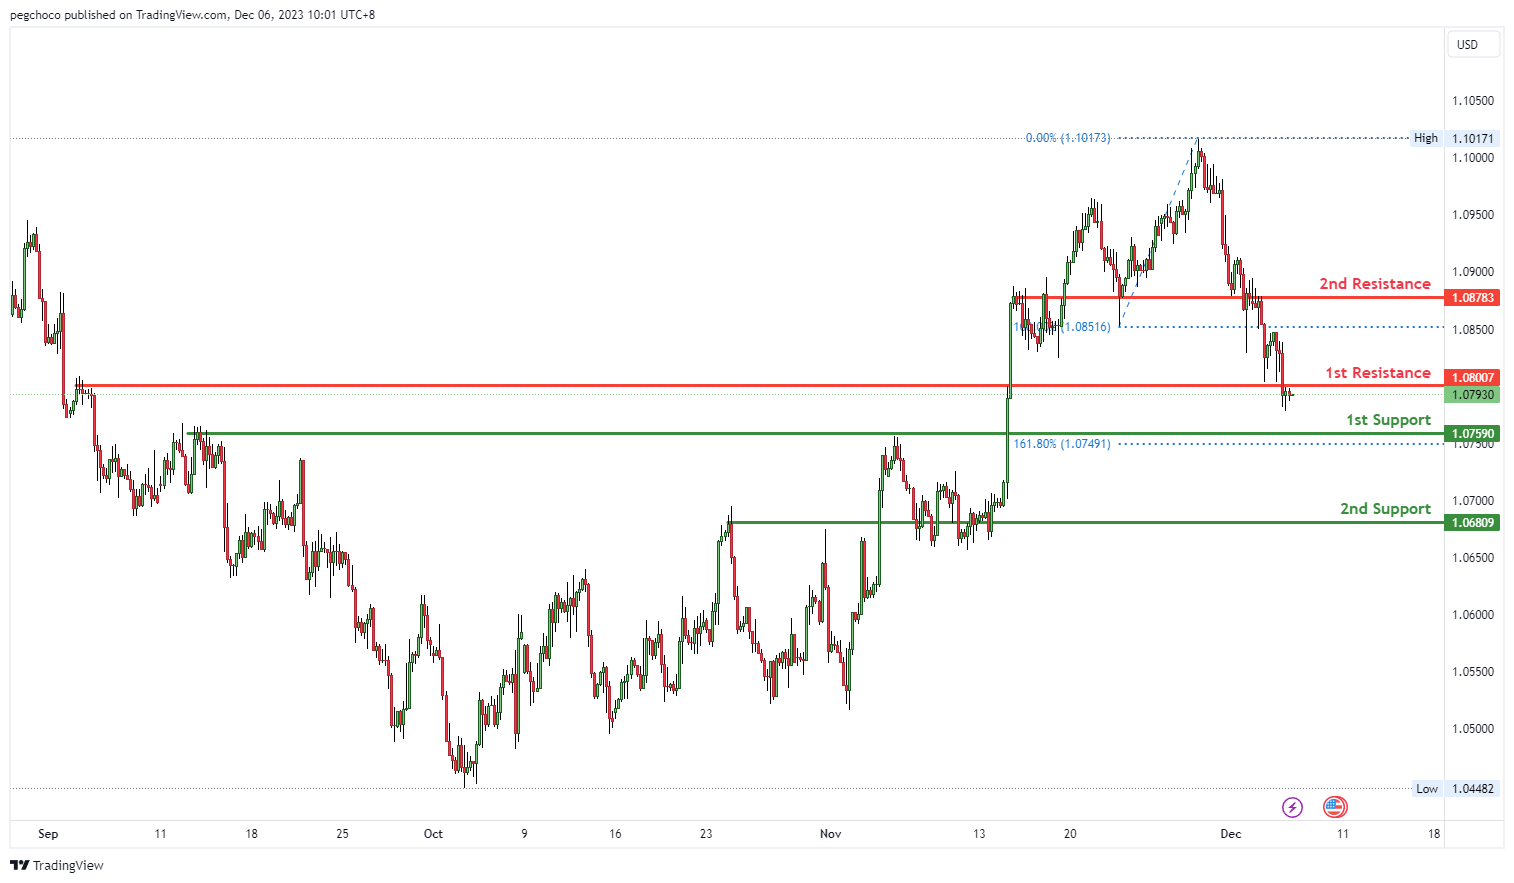
EUR/USD:
The EUR/USD chart currently has a bearish overall momentum, and there’s potential for a bearish reaction off the 1st resistance level.
On the support side, the 1st support at 1.0759 is identified as a pullback support, indicating that it could be a significant level where buying interest may emerge, potentially providing support for the EUR/USD pair.
Further down, there is a 2nd support at 1.0712, also noted as a pullback support. This reinforces the significance of this support level, suggesting it as a potential area where buyers might become active.
On the resistance side, the 1st resistance at 1.0880 is categorized as a pullback resistance. This implies that it’s a substantial barrier where selling interest could intensify, potentially triggering a bearish reaction.
The 2nd resistance at 1.0878 is identified as an overlap resistance, further reinforcing the potential resistance factors for the EUR/USD.
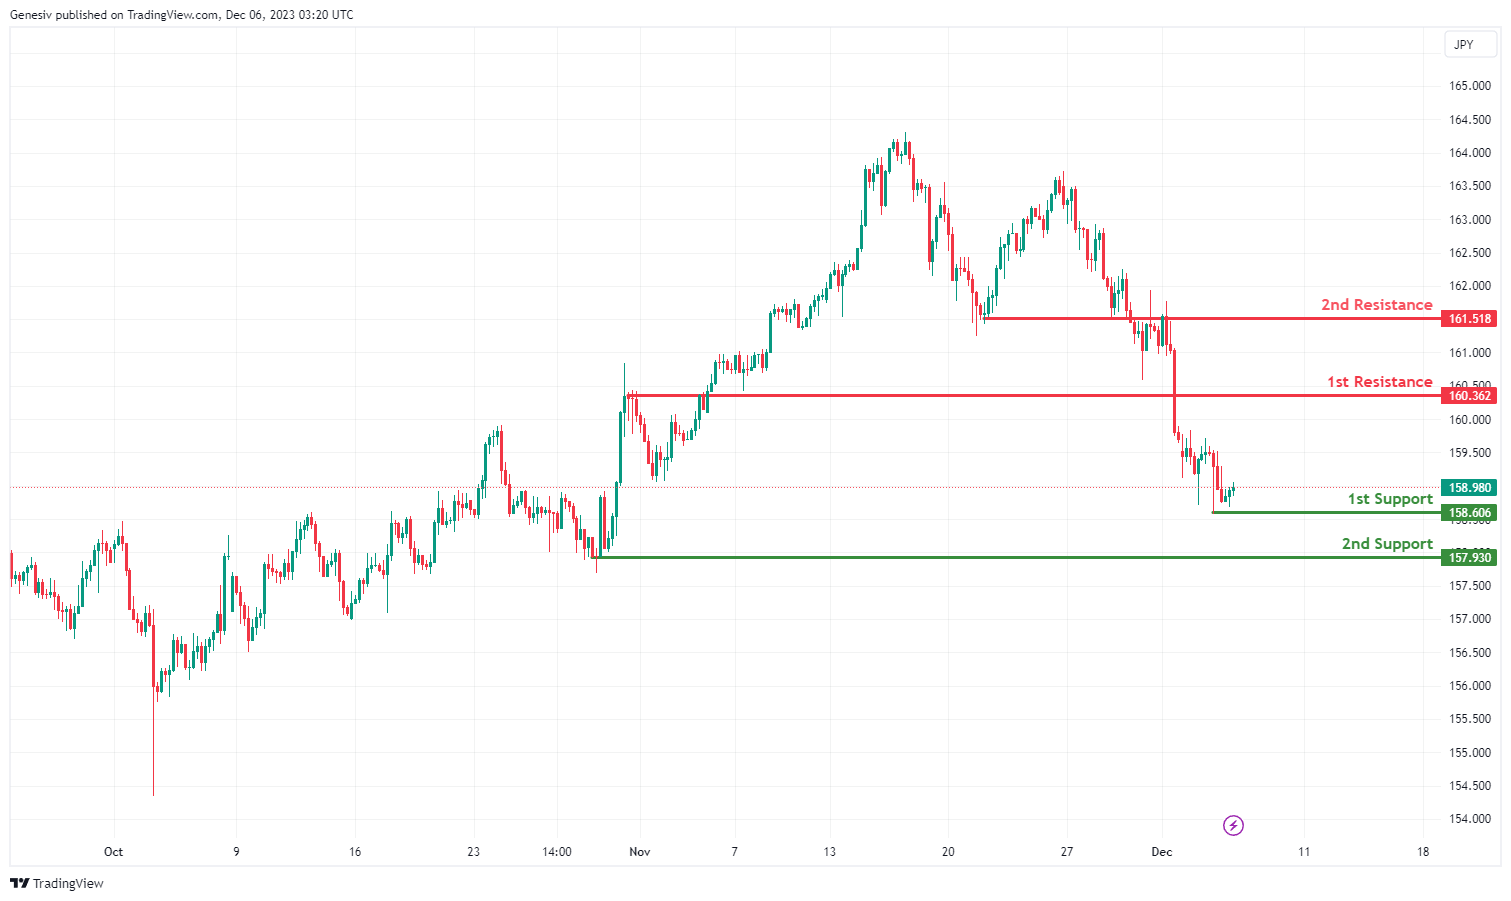
EUR/JPY:
The EUR/JPY chart currently has bullish overall momentum, indicating a prevailing upward trend.
1st Support at 158.61: This support level is at 158.61 and is considered strong because it’s based on a swing low support. Swing lows are significant points where the price has previously found buying interest and reversed its downward movement.
2nd Support at 157.93:The second support level is at 157.93 and is also based on a swing low support. This suggests that there is confluence in support around this area, making it a potentially robust support level.
1st Resistance at 160.36:The first resistance level at 160.36 is considered strong as it’s based on pullback resistance. A pullback resistance level is where the price has previously encountered selling pressure after a retracement from a previous move.
2nd Resistance at 161.52:The second resistance level is at 161.52 and is based on an overlap resistance. An overlap resistance occurs when multiple price movements have historically converged around a specific level, creating resistance.
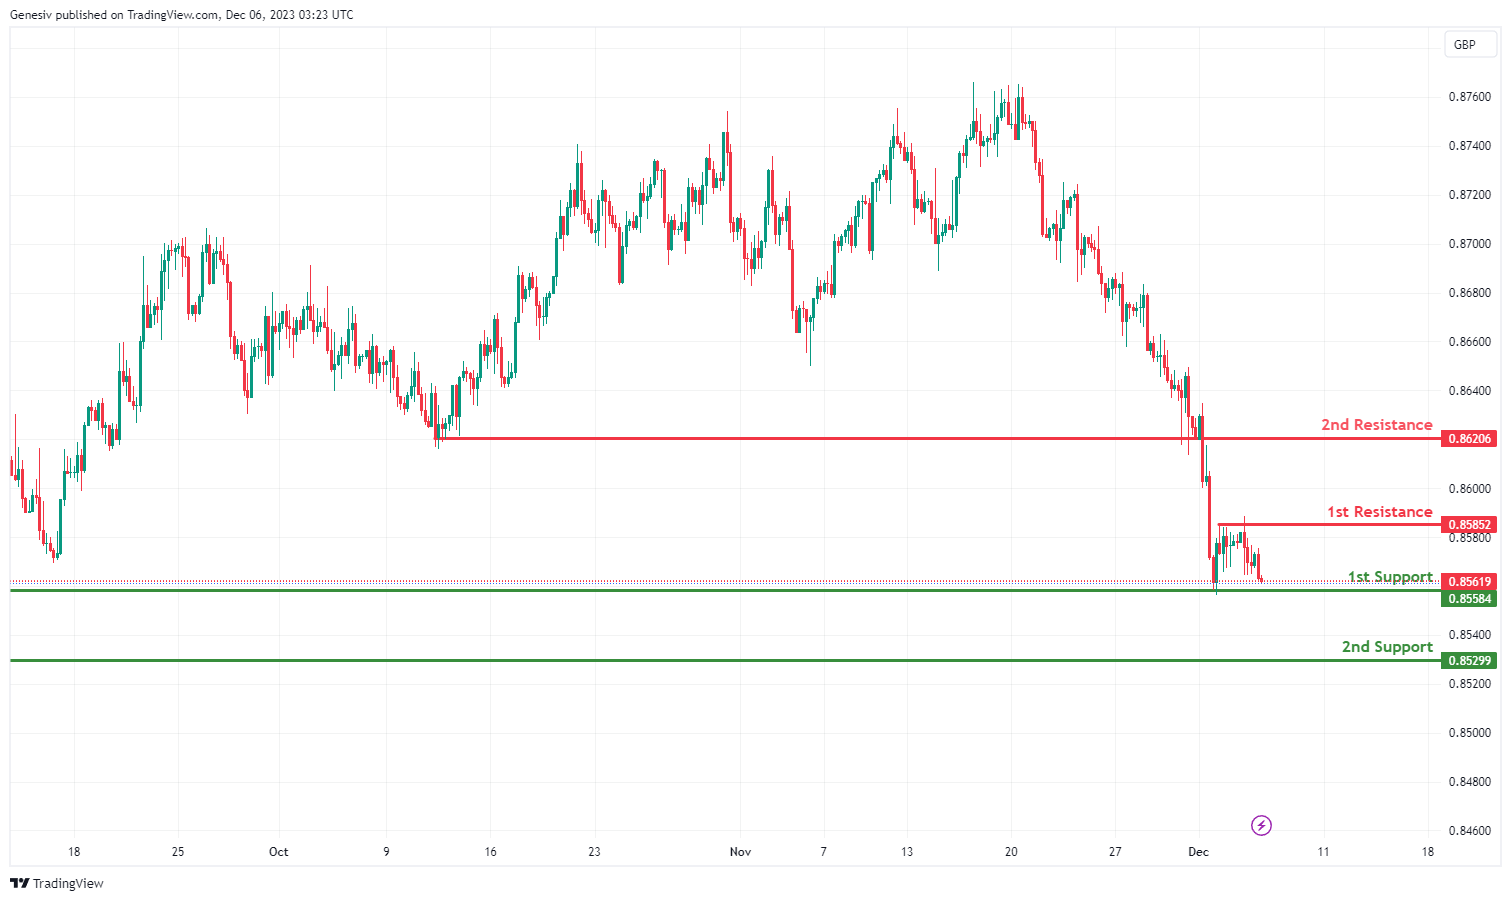
EUR/GBP:
The EUR/GBP chart currently has a bearish overall momentum, indicating a prevailing downward trend.
1st Support at 0.8558: This support level is at 0.8558 and is considered strong because it’s based on multi-swing low support. Multi-swing lows represent price levels where the currency pair has previously found support and reversed its downward movement.
2nd Support at 0.8530: The second support level is at 0.8530 and is based on a swing low support. This level also represents a point where the price has historically found support.Swing lows are important because they indicate potential areas where buyers might step in.
1st Resistance at 0.8585: The first resistance level at 0.8585 is considered strong as it’s based on pullback resistance. Pullback resistance levels are where the price has previously encountered selling pressure after a retracement from a previous decline.
2nd Resistance at 0.8621: The second resistance level is at 0.8621 and is based on an overlap resistance. An overlap resistance occurs when multiple price movements have historically converged around a specific level, creating resistance.
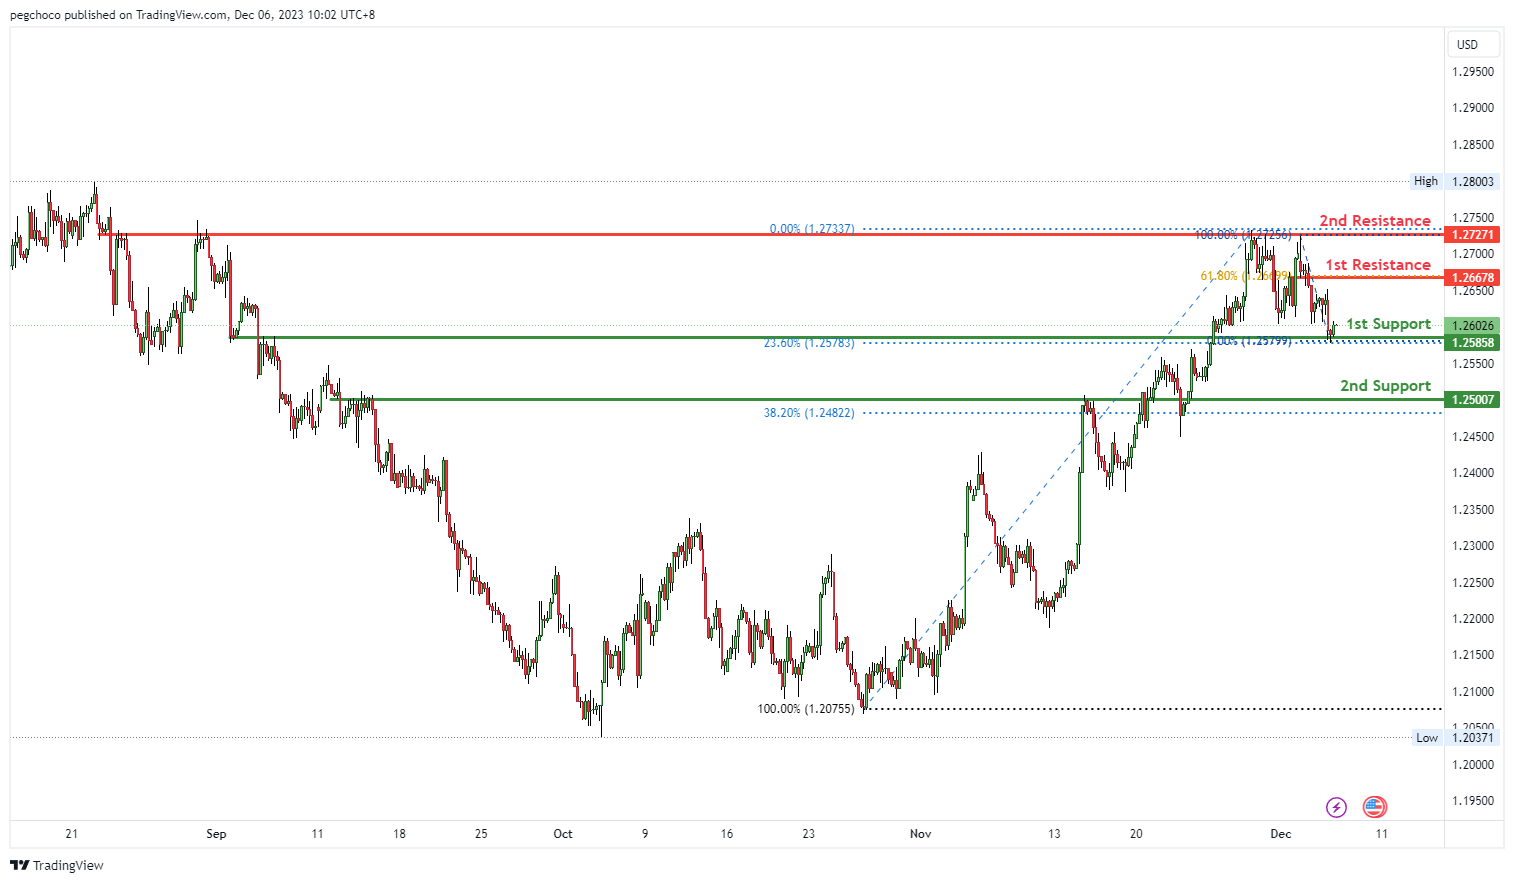
GBP/USD:
The GBP/USD chart currently has a bullish overall momentum, and there’s potential for a bullish bounce off the 1st support level.
On the support side, the 1st support at 1.2585 is identified as an overlap support, indicating that it could be a significant level where buying interest may emerge, potentially providing support for the GBP/USD pair.
Further down, there is a 2nd support at 1.2500, noted as a pullback support. This reinforces the significance of this support level, suggesting it as another potential area where buyers might become active.
On the resistance side, the 1st resistance at 1.2667 is categorized as a pullback resistance. This implies that it’s a substantial barrier where selling interest could intensify, potentially triggering a bearish reaction.
The 2nd resistance at 1.2727 is identified as an overlap resistance, further reinforcing the potential resistance factors for the GBP/USD.
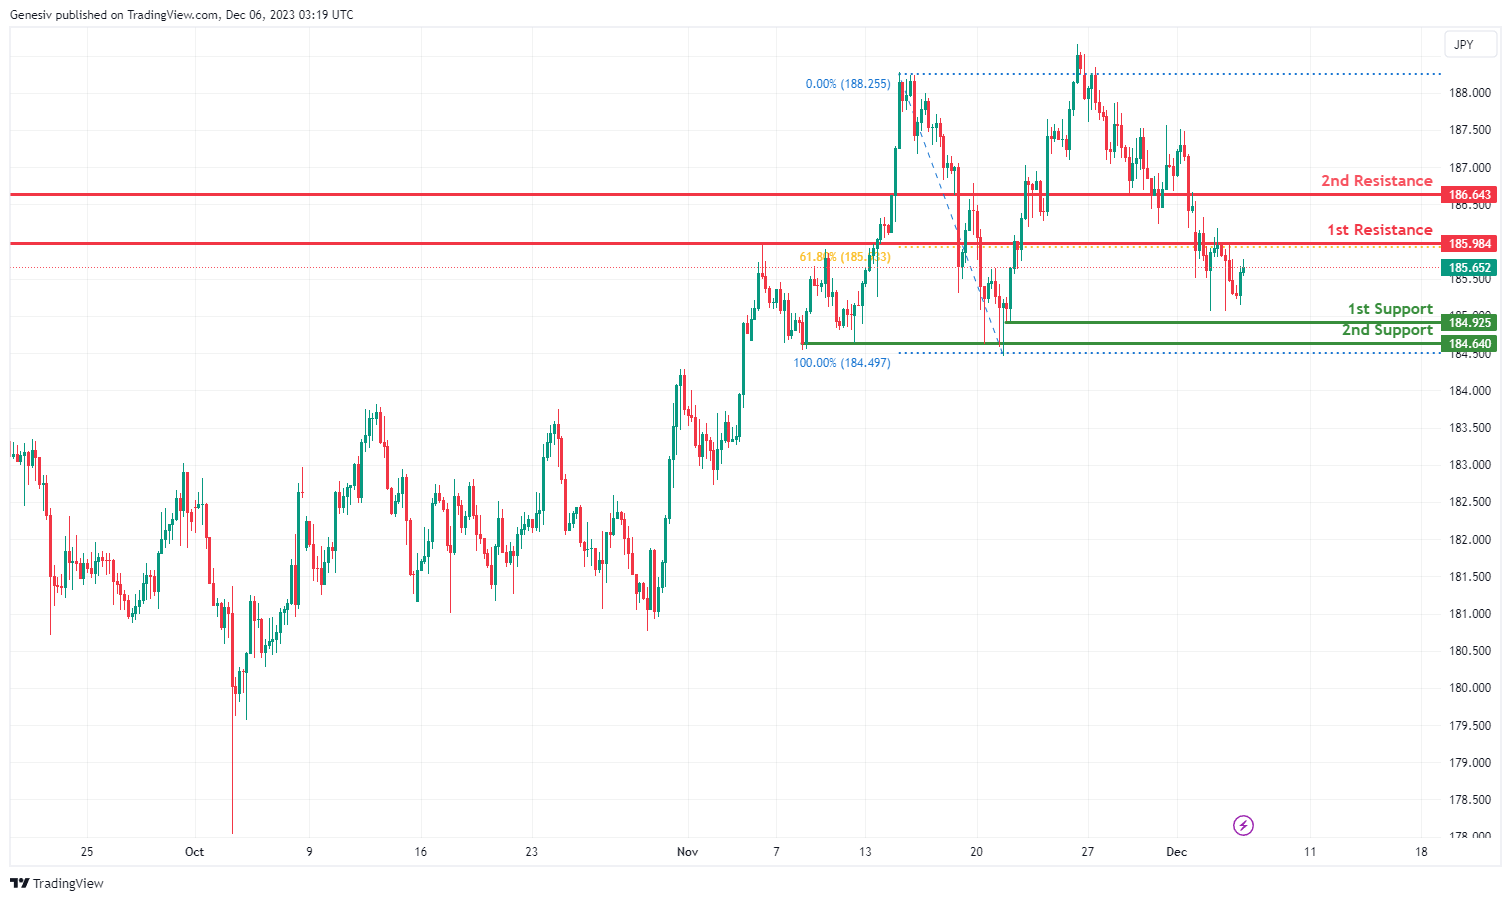
GBP/JPY:
The overall momentum of GBP/JPY is weak bearish with low confidence. This suggests that there is a modest inclination towards bearishness in the market, but it’s not very strong or certain.
1st Support at 184.93: This support level is at 184.93 and is considered good because it’s based on a swing low support. A swing low is a point where the price has previously found buying interest and reversed its downward movement.
2nd Support at 184.64: The second support level is at 184.64 and is also considered good because it’s based on multi-swing low support. This means that there have been multiple instances in the past where the price has bounced or found support around this level.
1st Resistance at 185.98: The first resistance level is at 185.98, and it’s considered good because it’s based on pullback resistance. A pullback resistance level is where the price has previously encountered selling pressure after a pullback from a previous move. Furthermore, this level aligns with the 61.80% Fibonacci Retracement, which adds significance to it.
2nd Resistance at 186.64: The second resistance level is at 186.64 and is based on pullback resistance as well. This level has acted as a barrier to price advancement in the past.
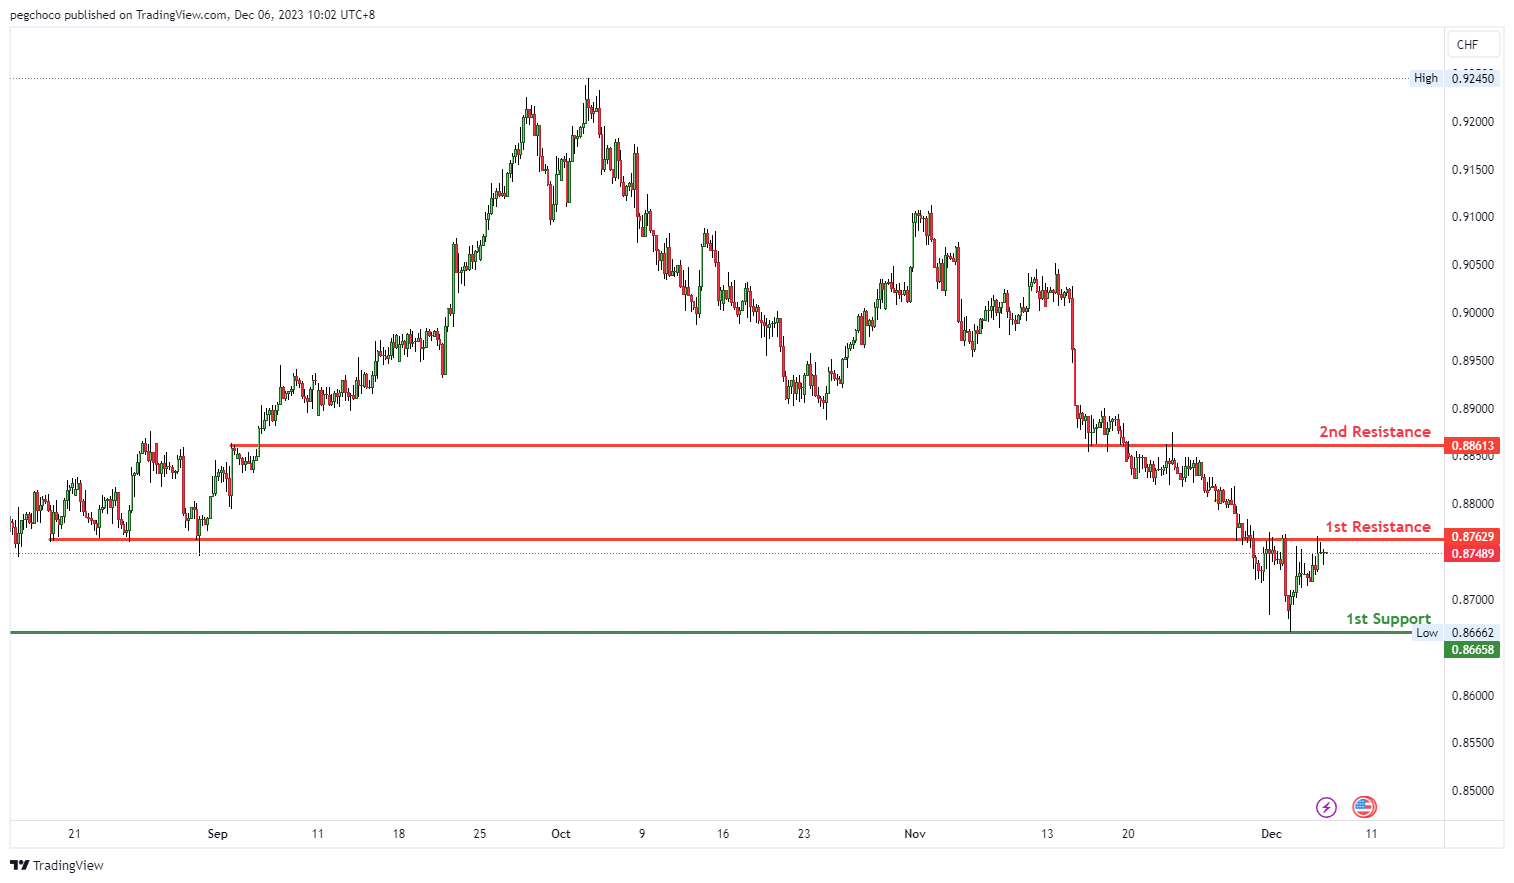
USD/CHF:
The USD/CHF chart currently has a bearish overall momentum, and there’s potential for a bearish reaction off the 1st resistance level.
On the support side, the 1st support at 0.8665 is categorized as a multi-swing low support. This indicates that it could be a significant level where buying interest may emerge, potentially providing support for the USD/CHF pair.
On the resistance side, the 1st resistance at 0.8762 is identified as an overlap resistance. This implies that it’s a substantial barrier where selling interest could intensify, potentially triggering a bearish reaction.
Further up, there is a 2nd resistance at 0.8861, also noted as an overlap resistance, further reinforcing the potential resistance factors for the USD/CHF.
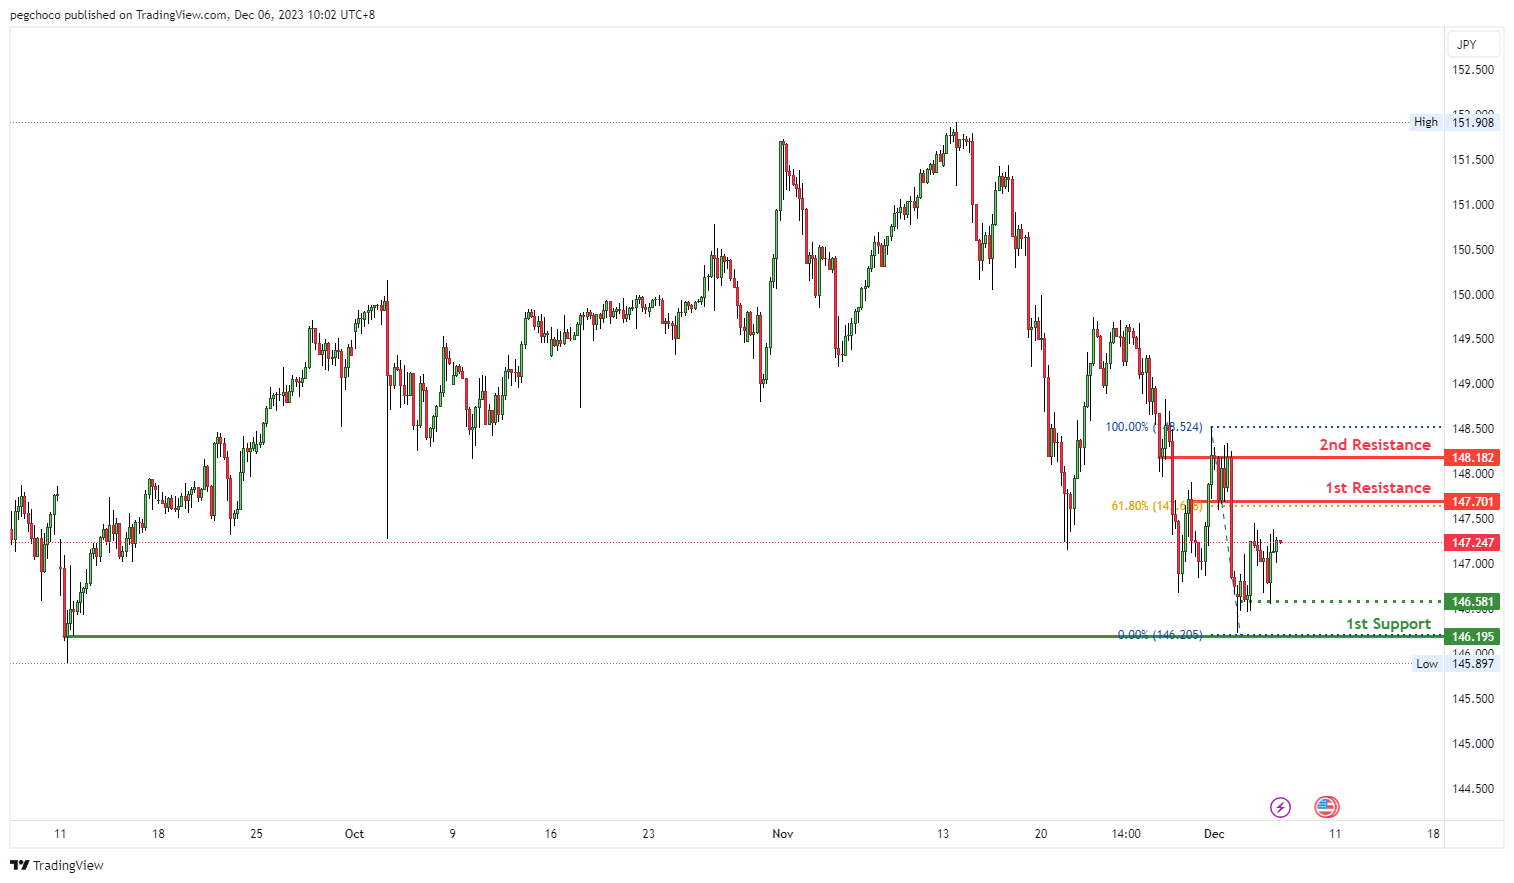
USD/JPY:
The USD/JPY chart currently exhibits a bearish overall momentum, and there’s potential for a bearish reaction off the 1st resistance level.
On the support side, the 1st support at 146.19 is categorized as a swing low support, indicating it’s a level where buying interest may emerge, potentially providing support for the USD/JPY pair. Further reinforcing this support, there is an intermediate support at 146.58, identified as a multi-swing low support.
On the resistance side, the 1st resistance at 147.70 is noted as a pullback resistance, implying it’s a significant barrier where selling interest could intensify, potentially leading to a bearish reaction. The 2nd resistance at 148.18 is identified as an overlap resistance, further strengthening the potential resistance factors for USD/JPY.
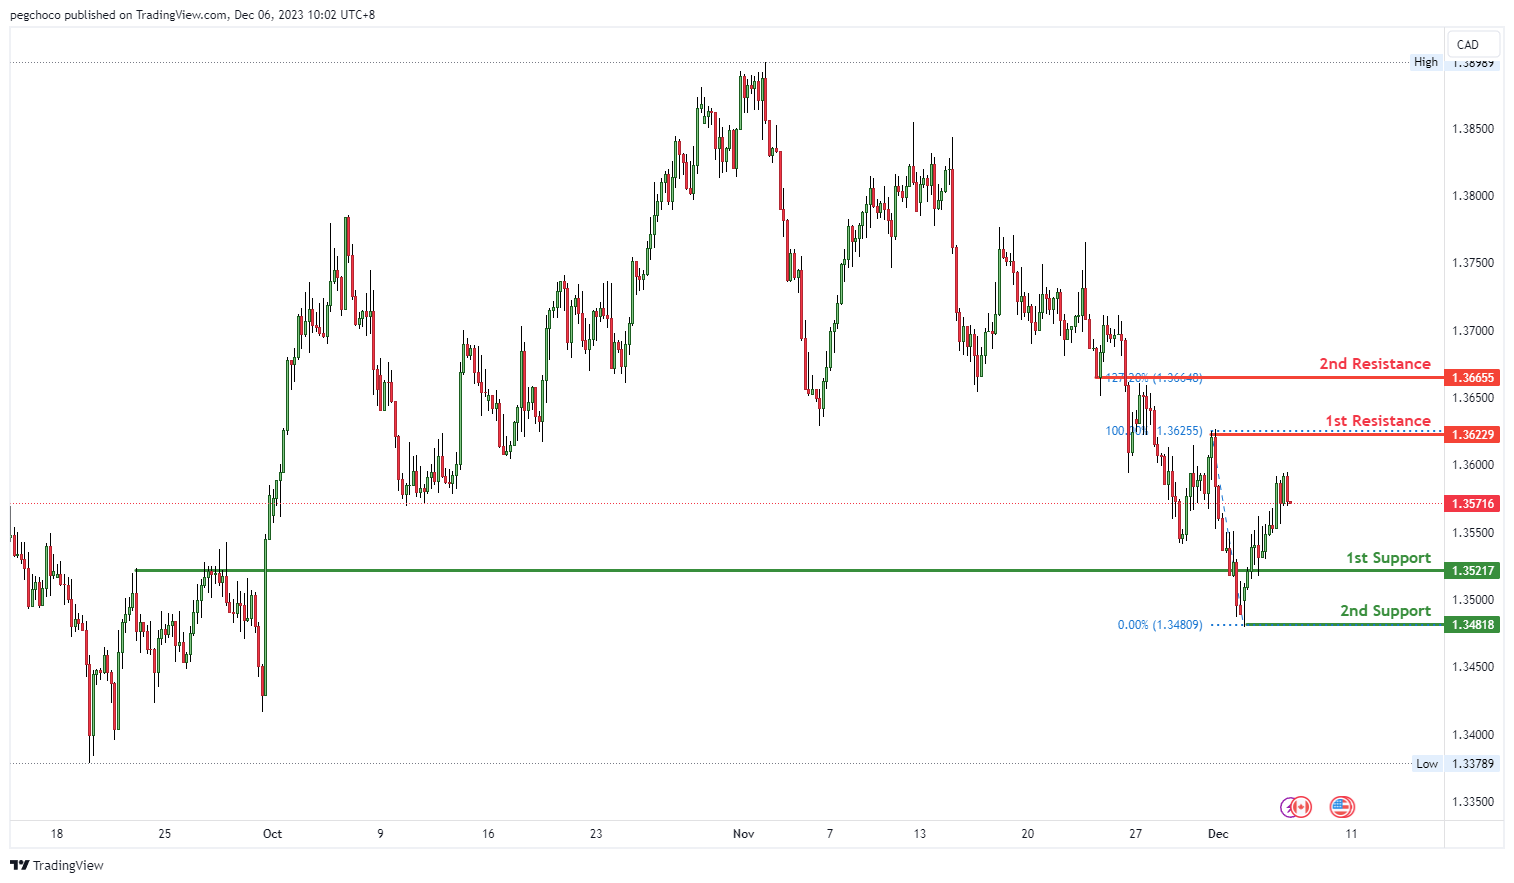
USD/CAD:
The USD/CAD chart currently demonstrates a bearish overall momentum, and there’s potential for a bearish reaction off the 1st resistance level, with a drop towards the 1st support.
On the support side, the 1st support at 1.3521 is categorized as an overlap support, suggesting it could be a significant level where buying interest may emerge. Additionally, the 2nd support at 1.3481 is identified as a swing low support, reinforcing its potential significance as a level where buyers might become active.
On the resistance side, the 1st resistance at 1.3622 is noted as a swing high resistance, implying that it could act as a substantial barrier where selling interest may intensify. The 2nd resistance at 1.3666 is identified as an overlap resistance and is accompanied by the 127.20% Fibonacci Extension, indicating another level where selling pressure may increase.
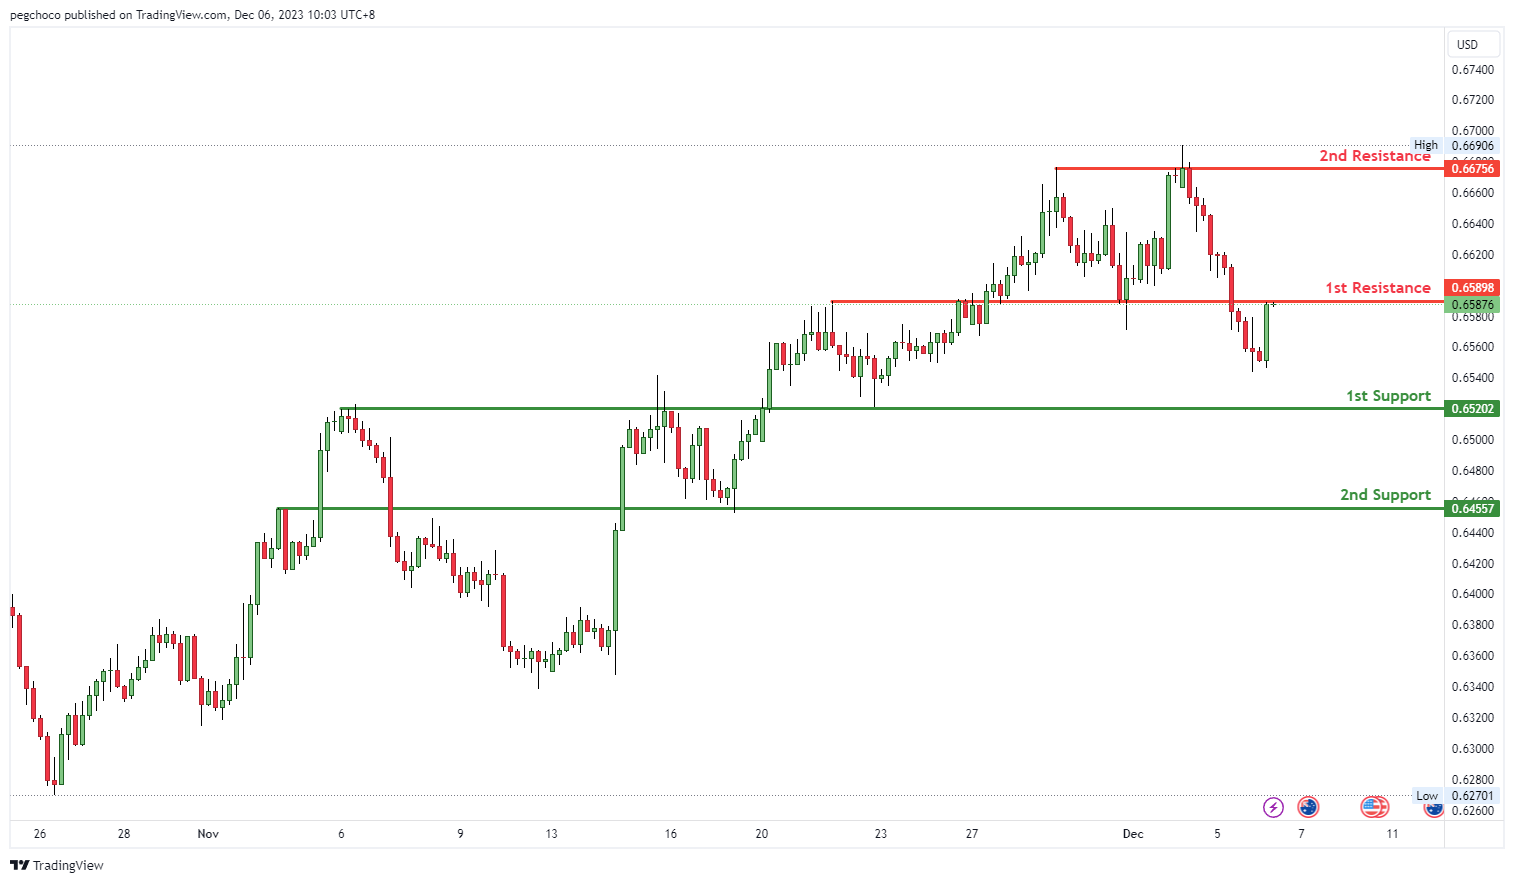
AUD/USD:
The AUD/USD chart currently exhibits a bearish overall momentum, and there’s potential for a bearish reaction off the 1st resistance level, with a drop towards the 1st support.
On the support side, the 1st support at 0.6520 is categorized as an overlap support, indicating its potential significance as a level where buying interest may emerge. Additionally, the 2nd support at 0.6455 is also identified as an overlap support, reinforcing its importance as a potential area for buyers to become active.
On the resistance side, the 1st resistance at 0.6589 is noted as a pullback resistance, suggesting that it could act as a substantial barrier where selling interest might intensify. The 2nd resistance at 0.6675 is identified as a multi-swing high resistance, indicating another level where selling pressure may increase.
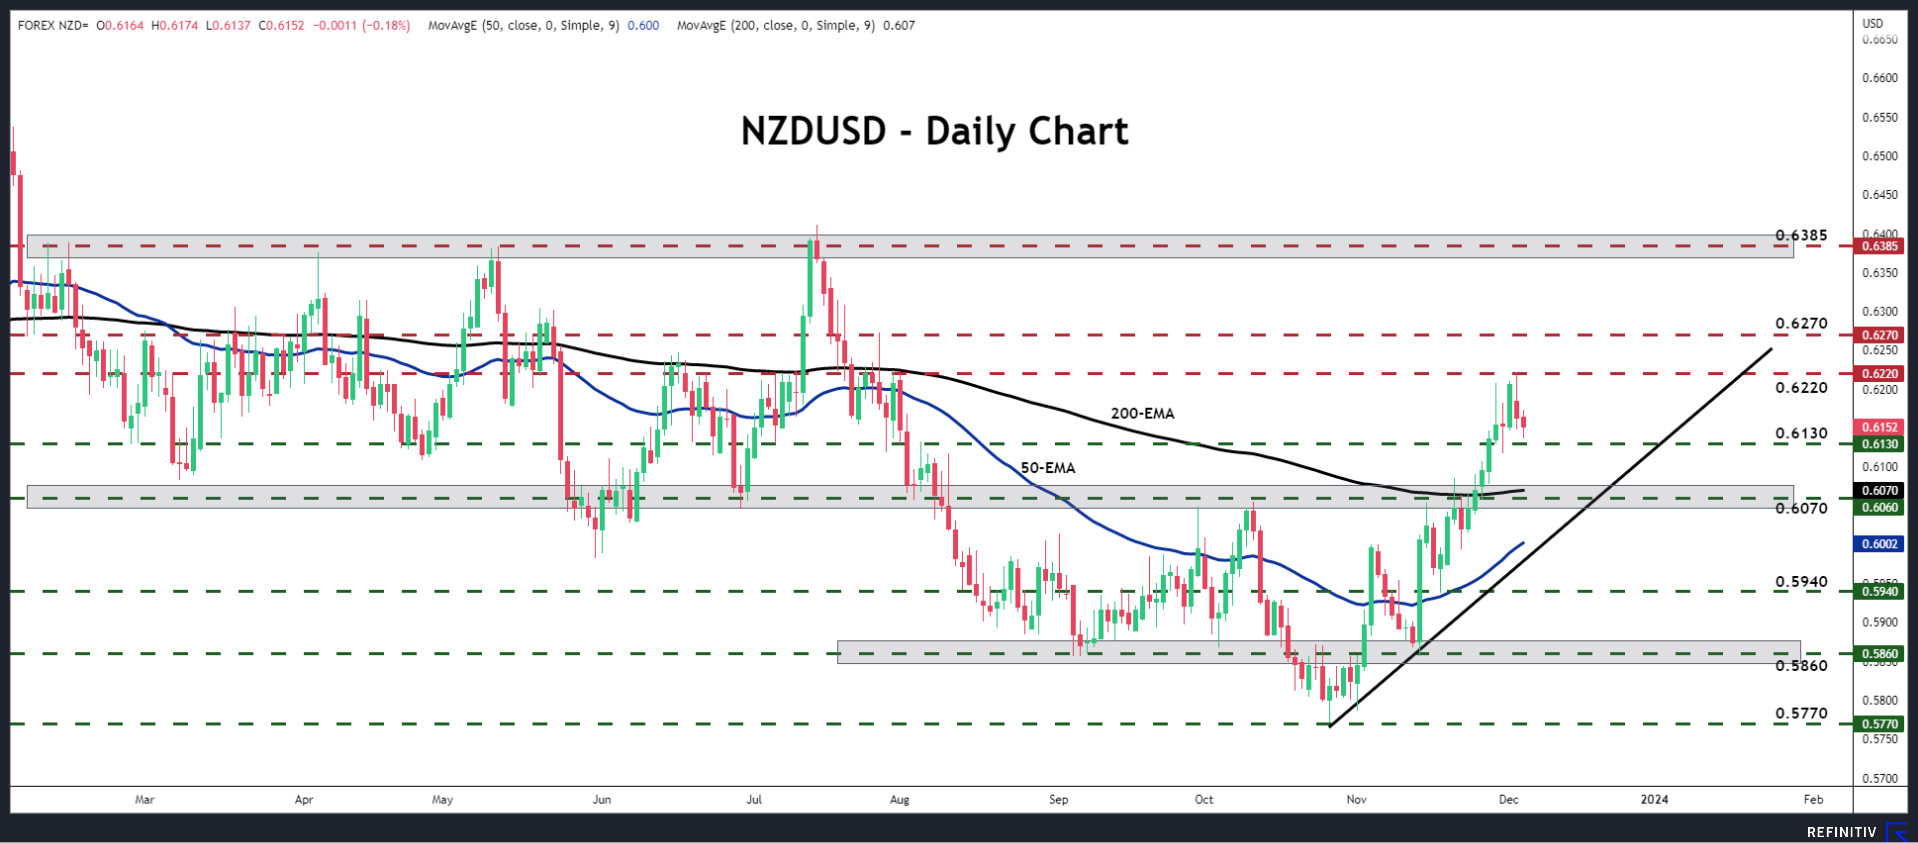
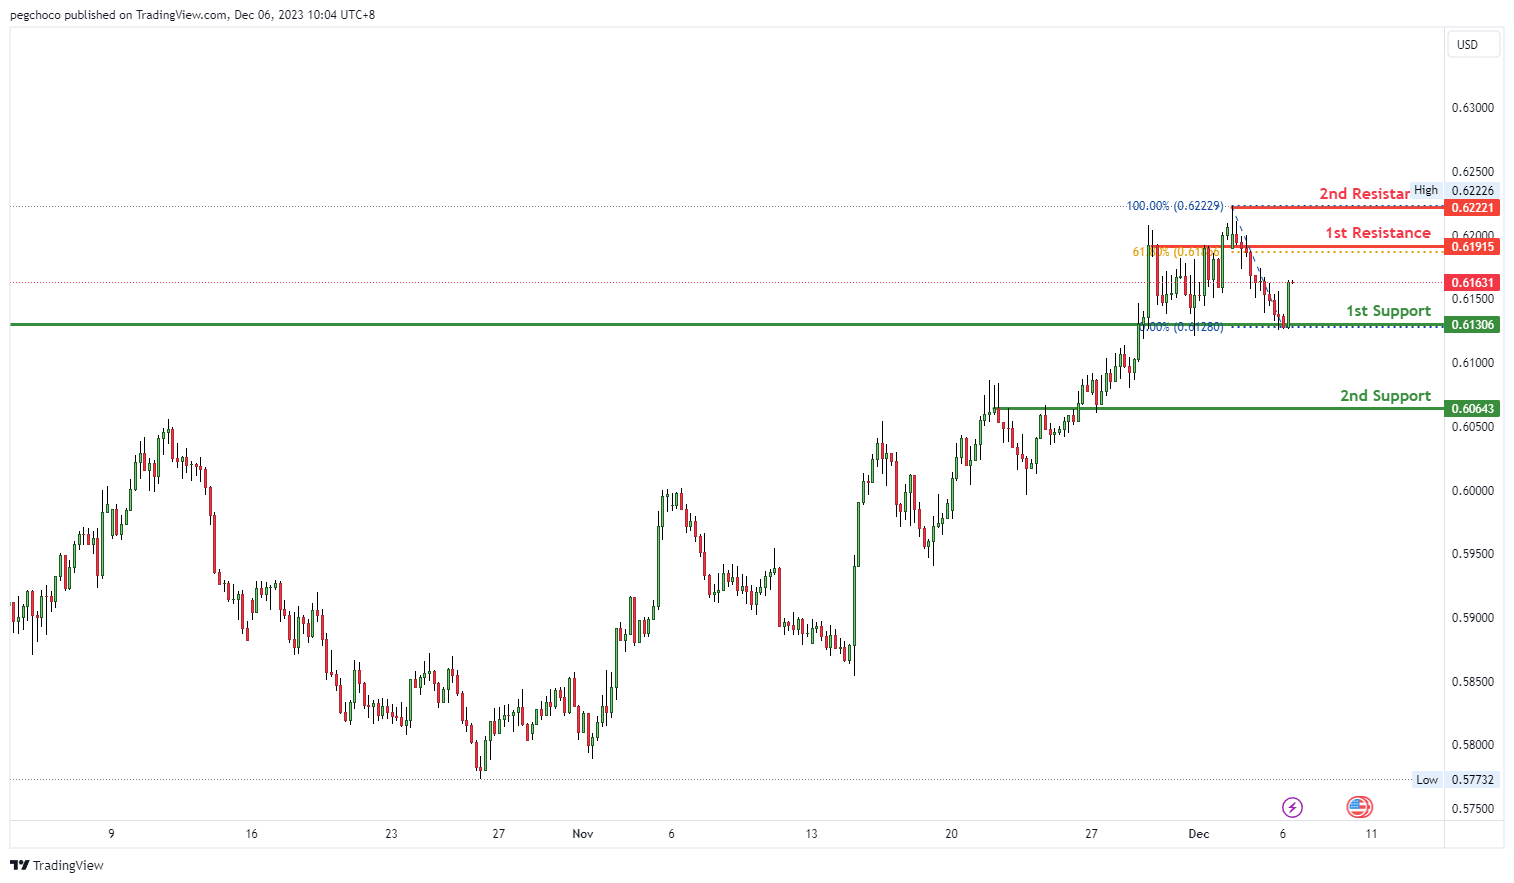
NZD/USD
The NZD/USD chart currently demonstrates a bullish overall momentum, and there’s potential for a bullish continuation towards the 1st resistance level.
On the support side, the 1st support at 0.6130 is identified as an overlap support, indicating its significance as a potential level where buying interest may emerge. Additionally, the 2nd support at 0.6064 is also categorized as an overlap support, further reinforcing its importance.
On the resistance side, the 1st resistance at 0.6191 is noted as a pullback resistance, suggesting that it could act as a substantial barrier where selling interest might intensify. The 2nd resistance at 0.6222 is identified as a swing high resistance, adding another level of potential selling pressure.
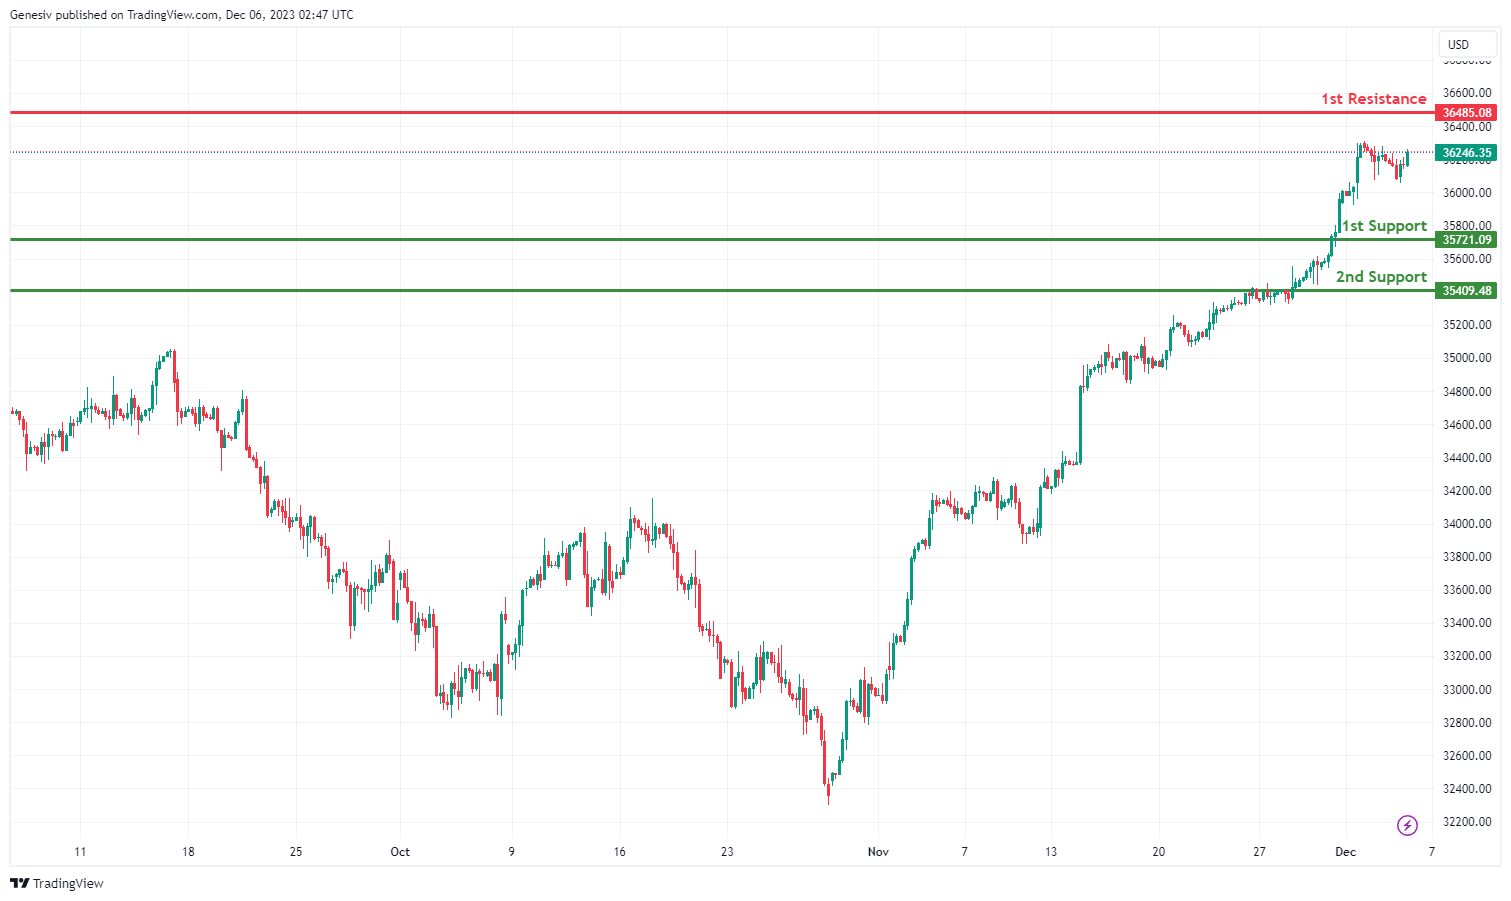
DJ30:
The DJ30,the momentum of the chart is weak bullish with low confidence. Price could potentially make a: Bullish continuation towards 1st resistance.
1st support at 35721.09: This level is a multi-swing low support, indicating that it has previously provided a base for the price. This could be a potential level for buying interest.
2nd support at 15409.48: This level represents an overlap support, where previous price action has clustered around this area.
1st resistance at 36485.08: This level is a swing high resistance, where the price has encountered selling pressure in the past. There is potential bullish breakouts or reversals around this level.
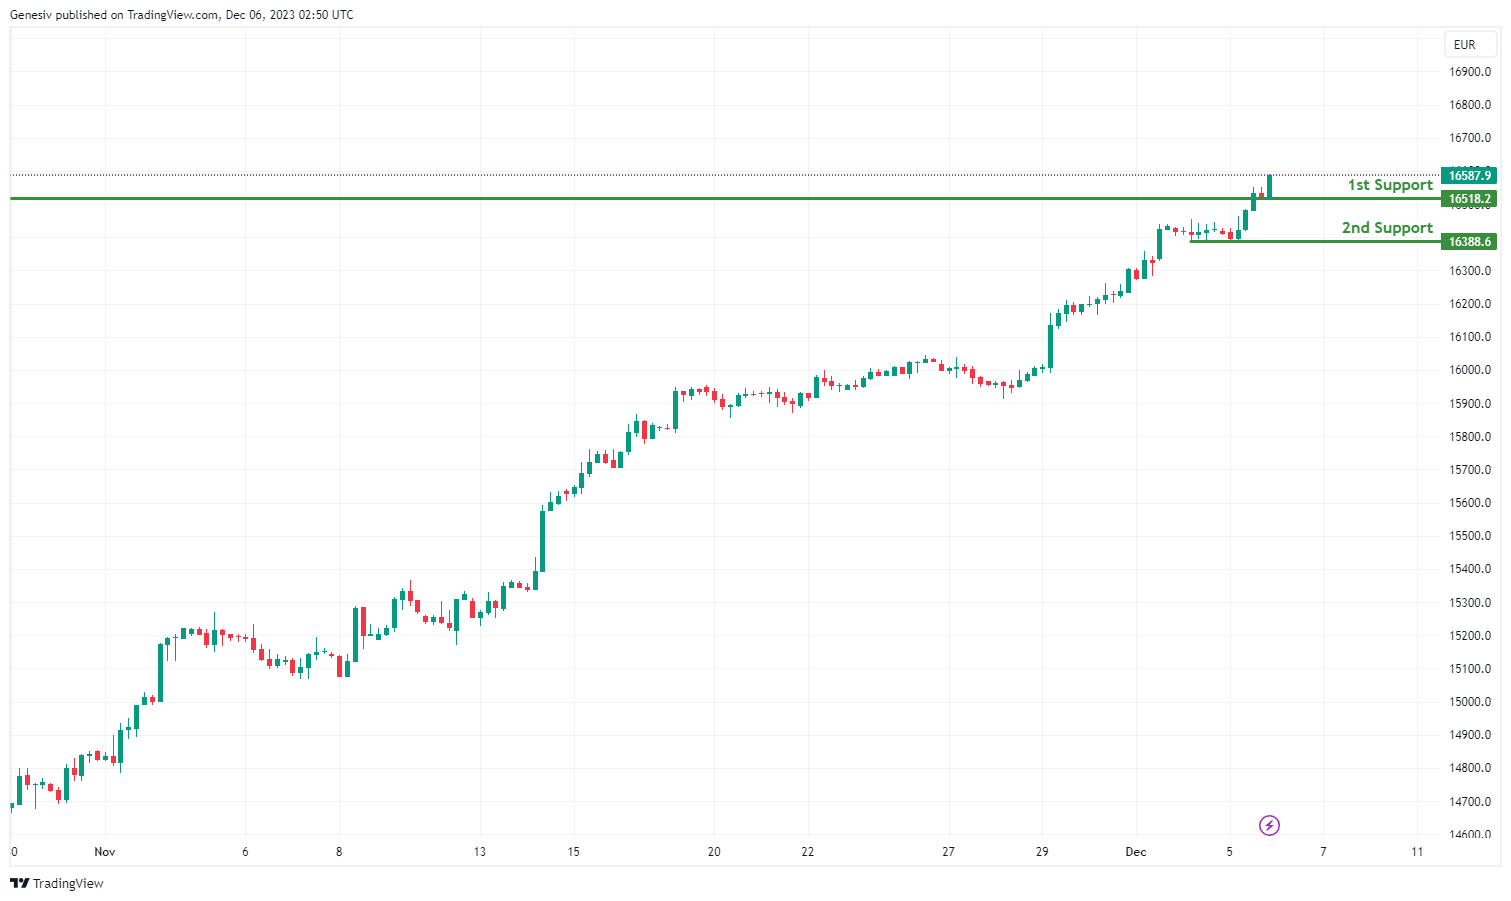
GER40:
The GER40, the overall momentum of the chart is Bullish. Price could potentially make a bullish continuation towards 1st resistance. Given the bullish momentum, traders may anticipate a continuation of the uptrend towards the 1st resistance level.
1st support at 16518.2: This level is a pullback support, suggesting that it has acted as a level where buyers have previously stepped in during a pullback. Traders may consider this as a potential area for buying opportunities.
2nd support at 16388.6: This level is a swing low support, indicating that it has historically been a level where the price has found support. It adds to the bullish case for the index.
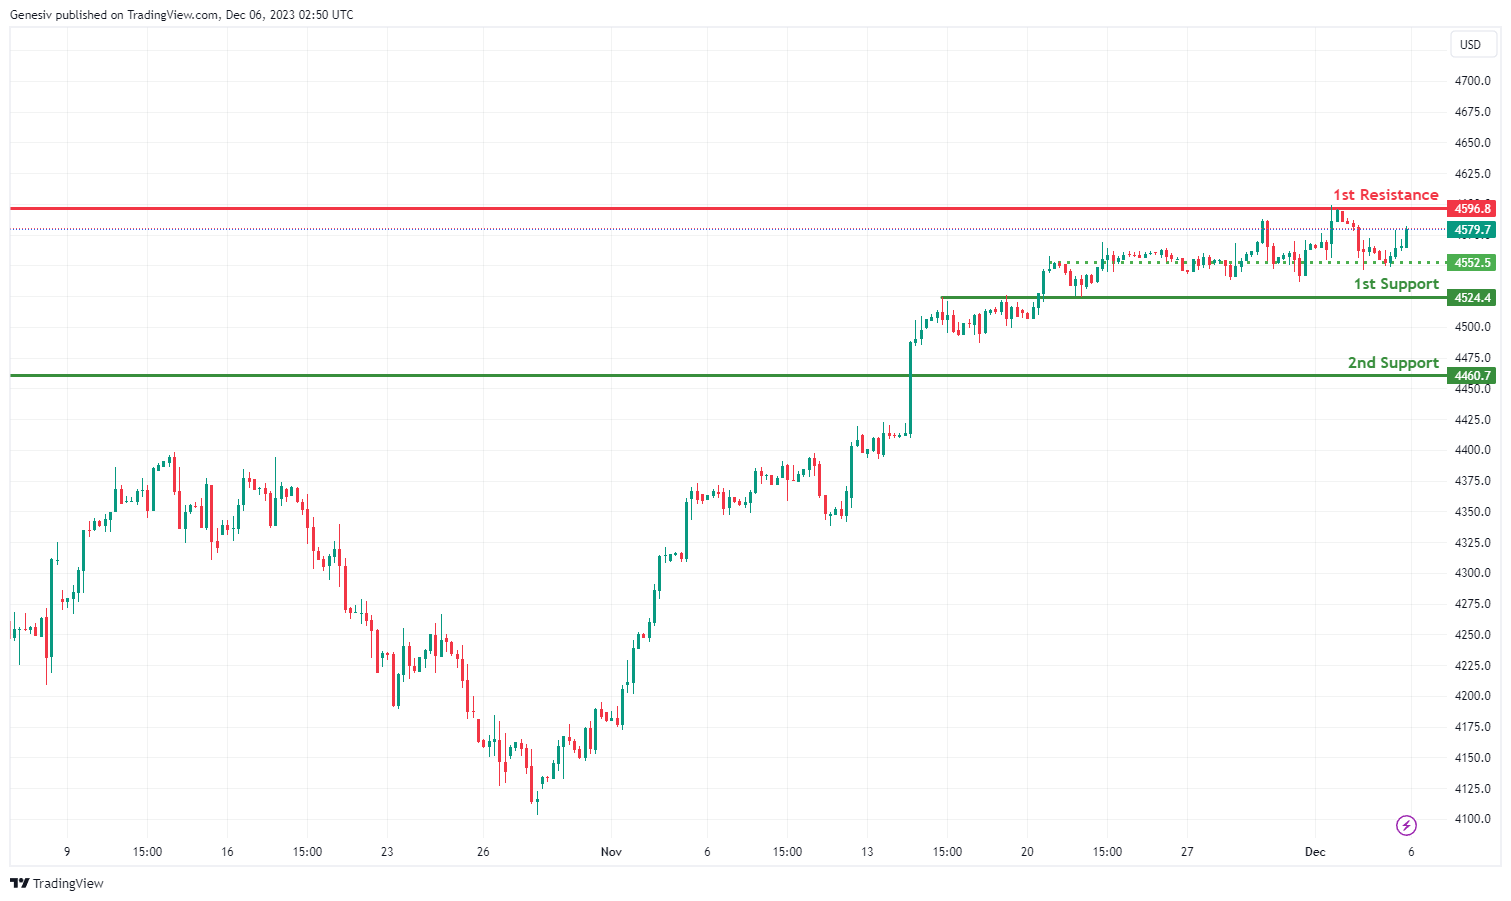
US500:
The overall momentum of US500 is bullish, which means that the prevailing sentiment in the market is positive. This suggests that buyers have been more active than sellers, leading to upward price movements.
1st Support at 4524.4:This support level is at 4524.4, and it is considered a good support because it’s based on an overlap in historical price action. An overlap support level is one where the price has previously paused or reversed, indicating that there may be buying interest at this level.
2nd Support at 4460.7: The second support level is at 4460.7, and it’s considered good due to multi-swing low support. This suggests that there have been multiple instances in the past where the price has found support around this level.
1st Resistance at 4596.8: The first resistance level is at 4596.8, and it’s considered good because it’s based on a swing high resistance. A swing high is a point where the price has previously encountered selling pressure and reversed. This level represents a potential obstacle for further price advancement, as it has acted as a turning point in the past.
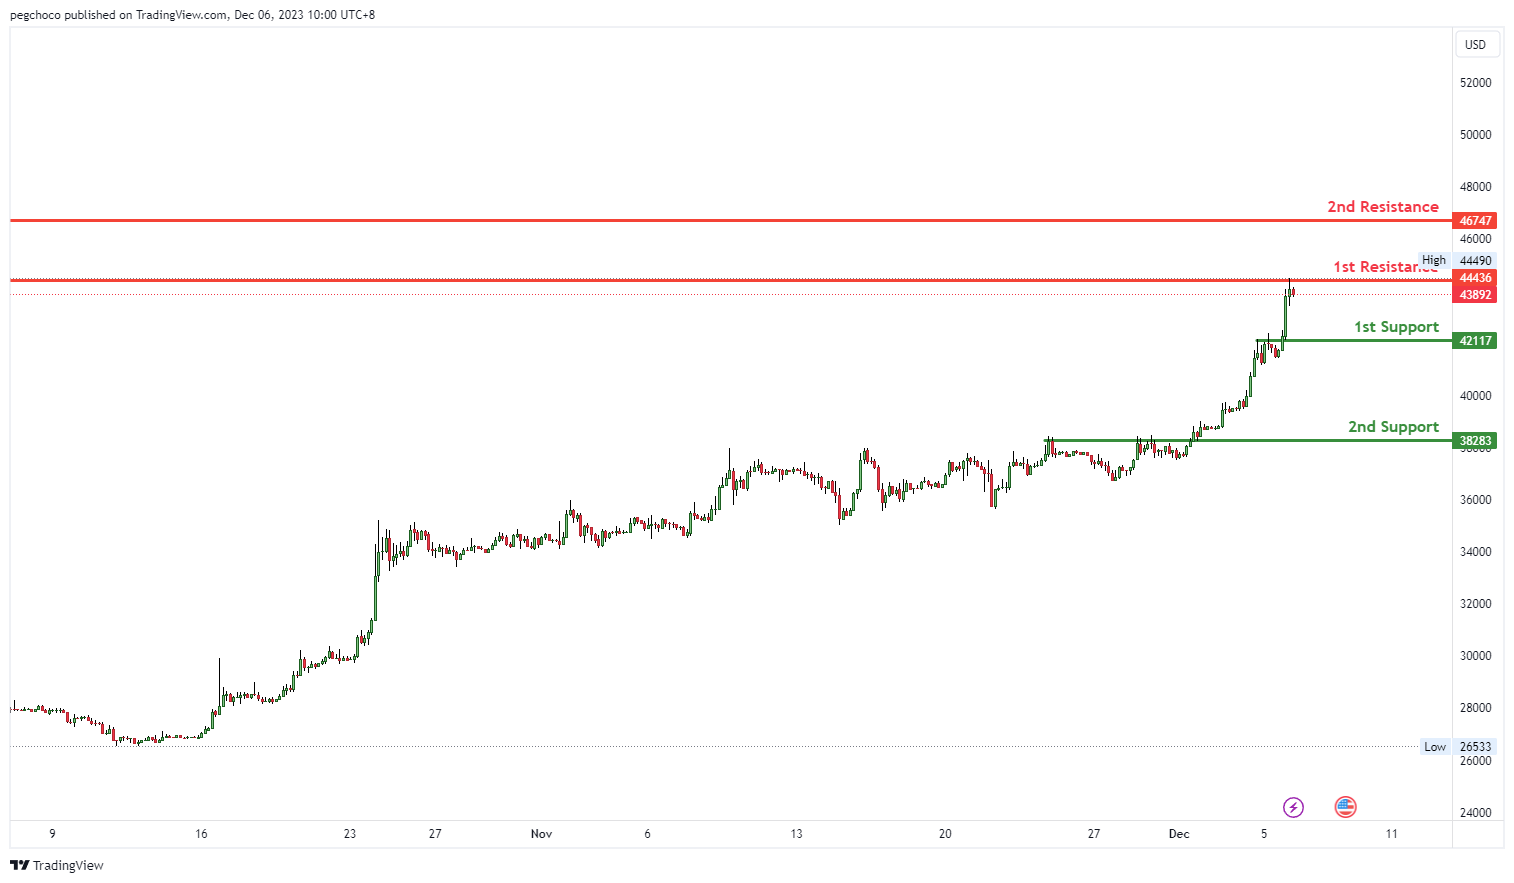
BTC/USD:
The BTC/USD chart is currently exhibiting a bearish overall momentum, and there’s potential for a bearish reaction off the 1st resistance level, with a drop towards the 1st support.
On the support side, the 1st support at 42117 is categorized as an overlap support, indicating it could be a significant level where buying interest may emerge. Additionally, the 2nd support at 38283 is also identified as an overlap support, further reinforcing its potential importance as a level where buyers might step in.
On the resistance side, the 1st resistance at 44436 is noted as a pullback resistance, suggesting it could act as a substantial barrier where selling interest may intensify. The 2nd resistance at 46747 is identified as an overlap resistance, potentially indicating another level where selling pressure could increase.
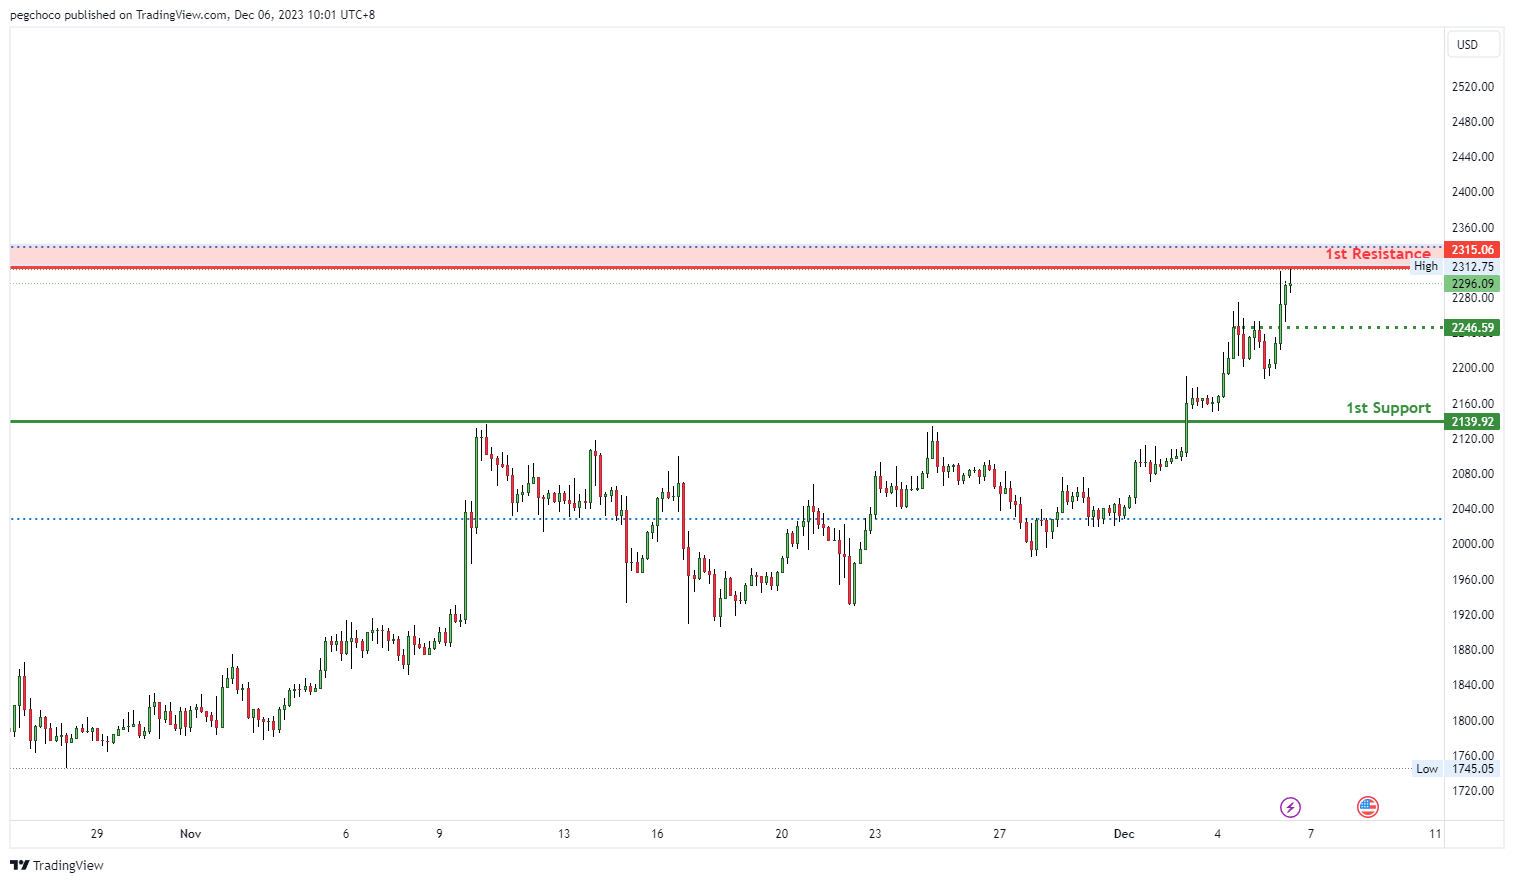
ETH/USD:
The ETH/USD chart is currently showing a bearish overall momentum, and there’s potential for a bearish reaction off the 1st resistance level, leading to a drop towards the 1st support.
On the support side, the 1st support at 2139.92 is considered a pullback support level, indicating it could be a significant area where buying interest may emerge. Additionally, there is an intermediate support at 2246.59, identified as an overlap support, further reinforcing its potential as a level where buyers might become active.
On the resistance side, the 1st resistance at 2315.06 is noted as a pullback resistance, implying it could act as a substantial barrier where selling interest may intensify.
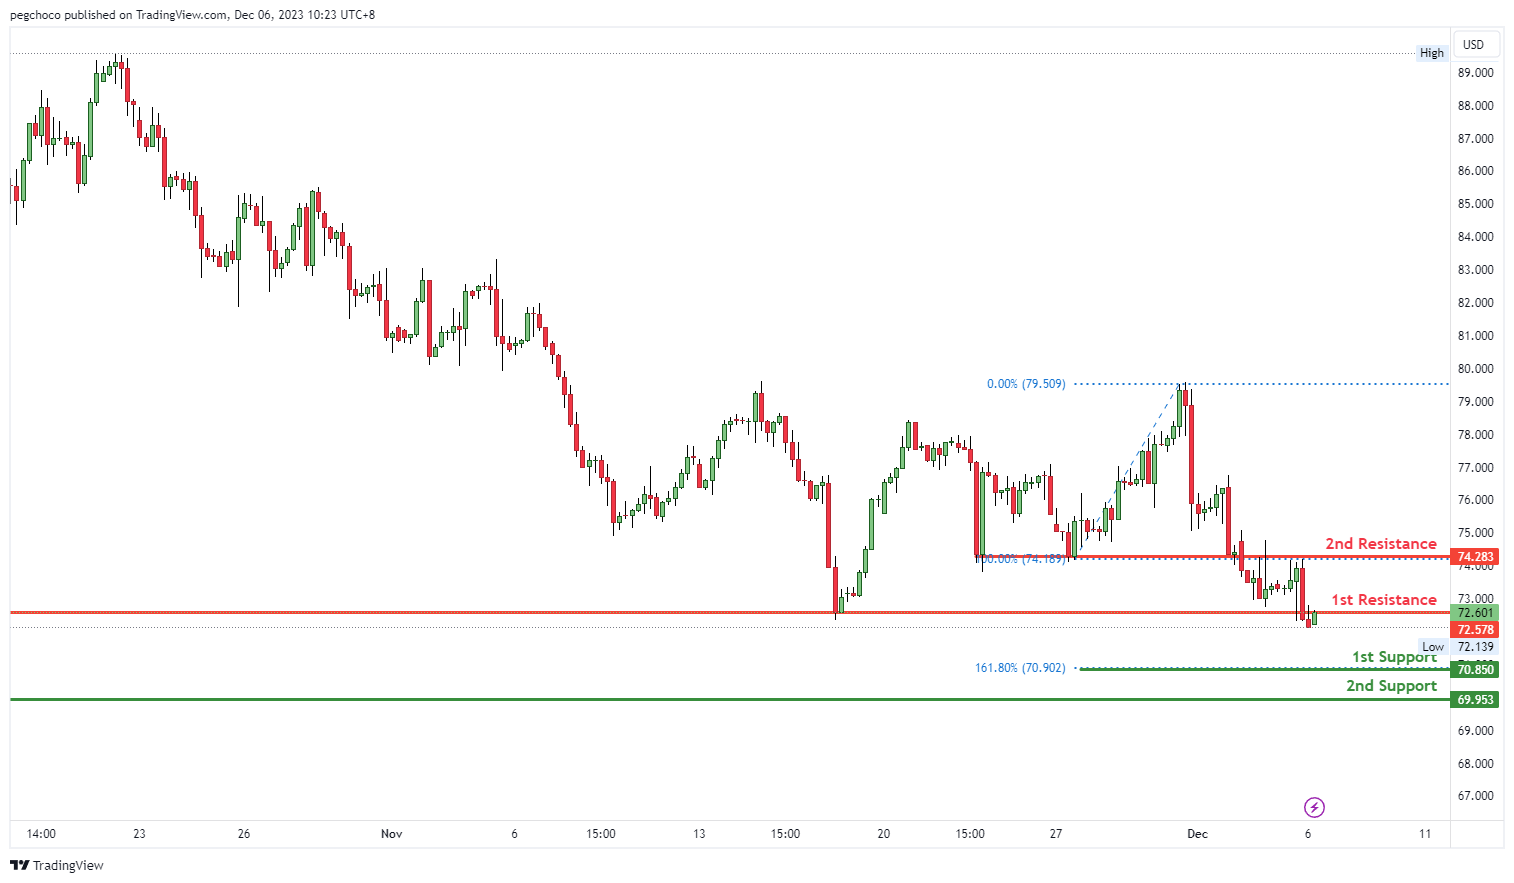
WTI/USD:
The WTI chart currently exhibits a bearish overall momentum, and there’s potential for a bearish reaction off the 1st resistance level, potentially leading to a drop towards the 1st support.
On the support side, the 1st support at 70.85 is identified as a significant level, primarily due to the presence of a 161.80% Fibonacci Extension. This suggests that it could be a key area where buying interest might emerge. Further reinforcing this support, there is a 2nd support at 69.95, categorized as an overlap support, adding significance to this level.
On the resistance side, the 1st resistance at 72.57 is noted as an overlap resistance, indicating it’s a substantial barrier where selling interest could intensify. The 2nd resistance at 74.28 is also categorized as an overlap resistance, adding another level of potential selling pressure.
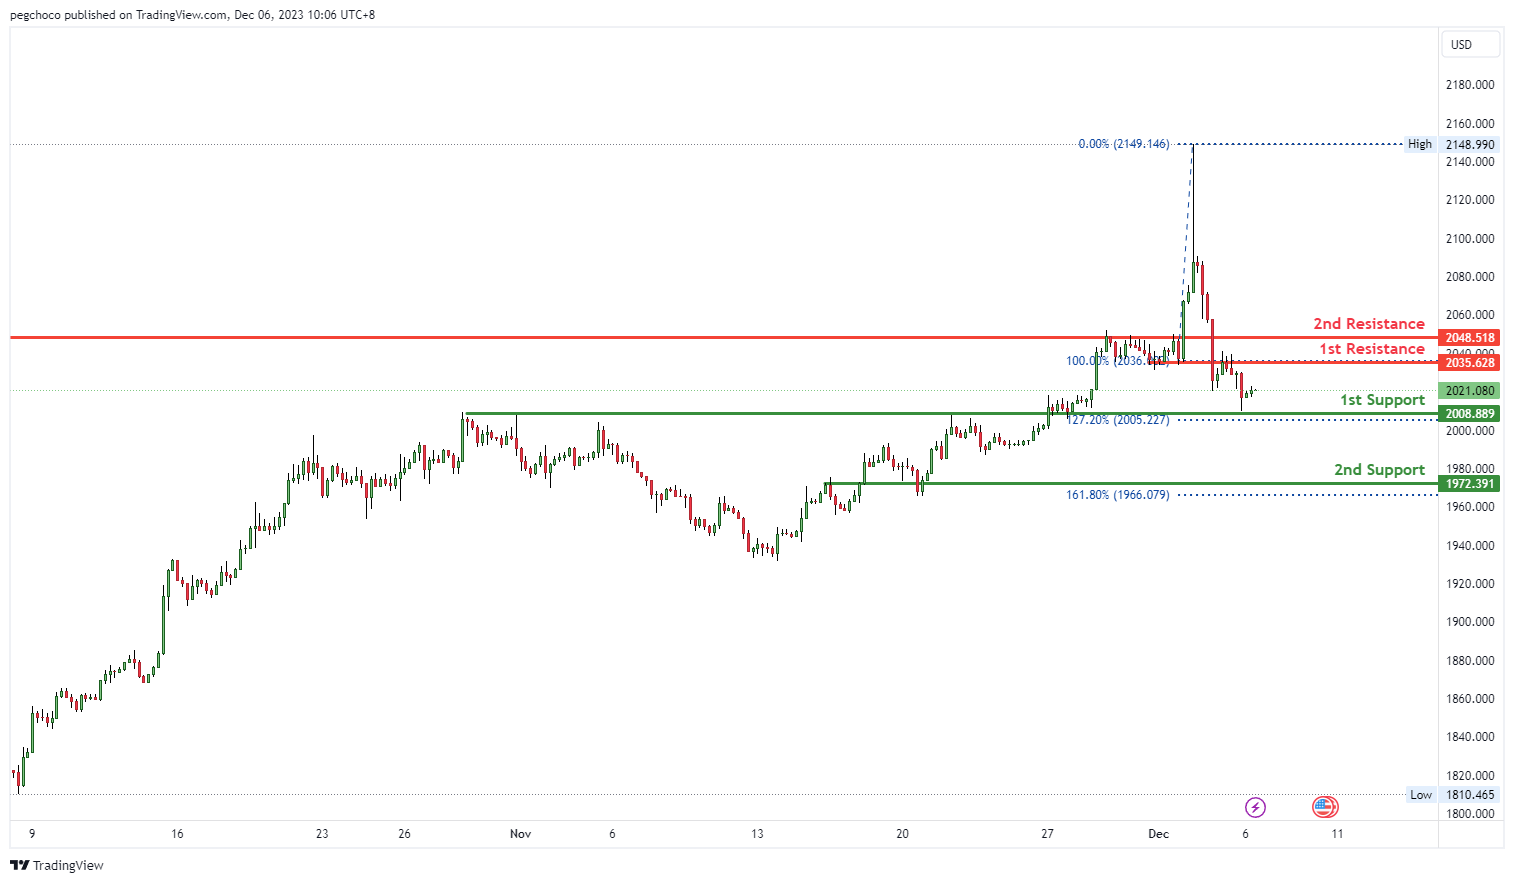
XAU/USD (GOLD):
The XAU/USD chart currently displays a bullish overall momentum, with potential for a bullish continuation towards the 1st resistance level.
On the support side, the 1st support at 2008.88 is categorized as a pullback support, indicating it’s a significant level where buying interest may emerge, potentially providing support for XAU/USD. Further reinforcing this support, there is a 2nd support at 1972.39, identified as another pullback support level.
On the resistance side, the 1st resistance at 2035.62 is noted as an overlap resistance, suggesting that it’s a substantial barrier where selling interest could intensify. The 2nd resistance at 2048.51 is categorized as a pullback resistance, indicating another level where selling pressure may increase.
BoJ’s Himino stresses patience in monetary easing to prevent return to “frozen state”
BoJ Deputy Governor Ryozo Himino, in a speech today, affirmed the central bank's commitment to continued monetary easing. He noted, "the Bank will patiently continue with monetary easing until sustainable and stable achievement of the price stability target, accompanied by wage increases, comes in sight."
He acknowledged the positive changes in firms' wage- and price-setting behavior, noting "solid progress" and "signs in the right direction." However, he warned of the risks of reverting to a deflationary state if a virtuous cycle between wages and prices is not established.
Explaining further, Himino commented on the longstanding norm in Japan where neither wages nor prices could rise significantly. "Japan had worked for many years to break free from this," he added, "and simply returning to such a frozen state after the current high inflation comes down would not be a desirable outcome either."
Himino highlighted the longstanding norm in Japan where "neither wages nor prices could rise". He stressed that Japan's efforts to break free from this stagnation, adding, "simply returning to such a frozen state after the current high inflation comes down would not be a desirable outcome".
He also outlined the multiple challenges facing Japanese monetary policy, including addressing current inflation, supporting moderate economic recovery, encouraging wage increases, and preventing a return to deflation. "The Bank is struggling to find a solution and this is by no means an easy task," he admitted.
First Impressions: Australian National Accounts, September Quarter
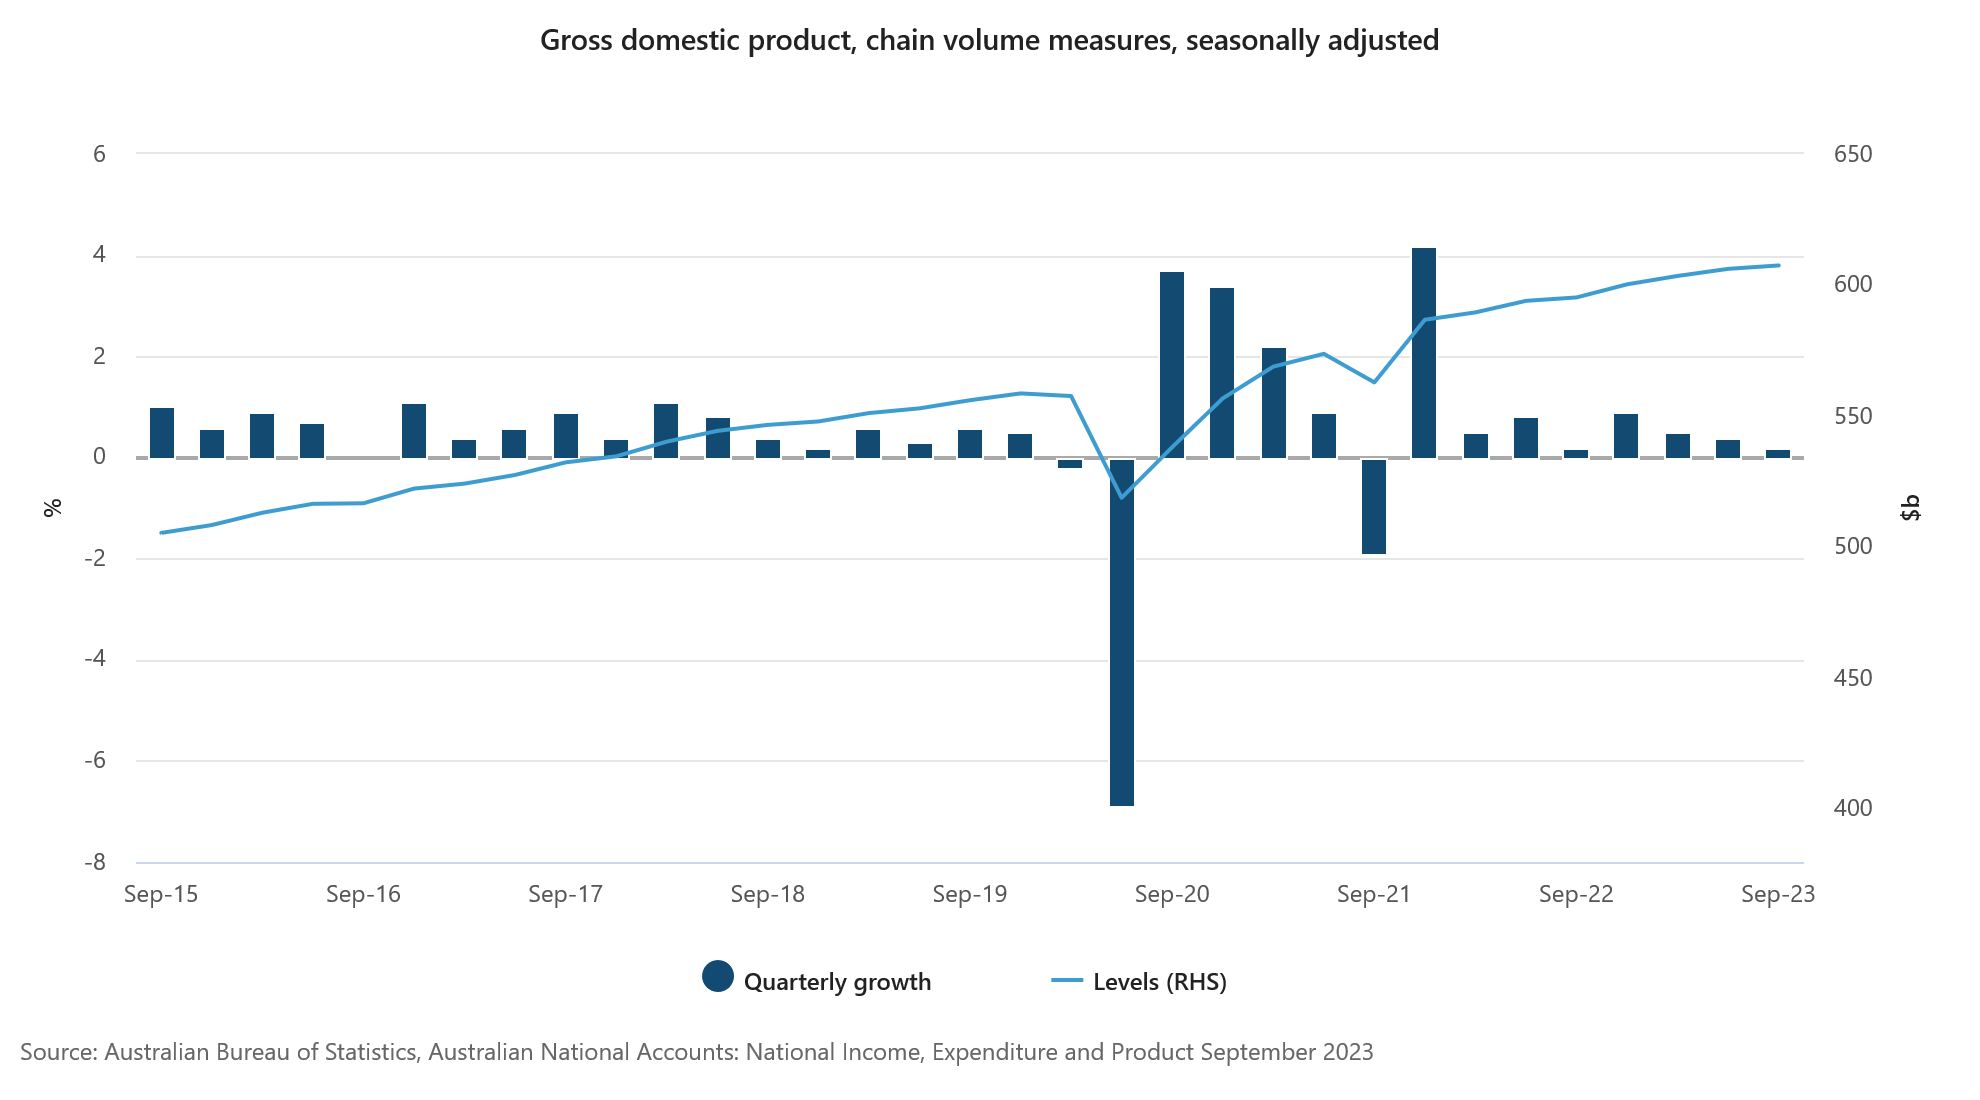
Australia’s economy hit the wall in the September quarter. Output growth was a very weak 0.2%, or a sharp contraction in per capita terms of -0.5%qtr. Strikingly, consumer spending stalled, with a flat result and a decline in per capita terms of -0.6%qtr, as real disposable income collapsed, contracting -1.3%qtr, -4.3%yr.
The Australian economy almost came to a stand still in the September quarter, with output up a very weak 0.2%.
That was materially weaker than expected, Westpac 0.5% and market median 0.5%, range (0.1% to 1.0%).
Annual growth printed 2.1%, or -0.3% in per capita terms.
Quarterly growth momentum has progressively slowed, from a 0.6% average through 2022, to 0.5% for Q1 2023, to 0.4% for Q2 and now the 0.2% for Q3.
Rapidly rising population, which increased by 0.7%qtr, 2.4%yr, is underpinning domestic spending and economic growth.
The intense headwinds of high inflation, sharply higher interest and additional tax obligations are having a significant impact, leading to a sharp decline in real household disposable income.
Key surprise: Consumer spending was the key surprise and the key takeout from the September quarter accounts.
Consumer spending came in materially below expectations, stalling flat in the quarter against expectations of a subdued 0.5% gain.
The detail showed a much weaker picture on services which look to have contracted about 1%qtr on a combined basis. With retail components flat and vehicle operations down in the quarter, the offset came from a bit 13% surge in vehicle spend – which is likely to be a temporary lift as backlogged orders clear.
The income picture for households in the period was, in summary: nominal gross income rose by 1.8%, including wage incomes up by 2.5%; while nominal disposable income was almost flat, up only 0.1% (squeezed by rising interest payments and due to another unexpectedly big jump in income tax payments); and real disposable income collapsed, contracting -1.3%qtr, -4.3%yr.
The household saving ratio slumped to only 1.1% from 2.8%x, which is well below the recent average of around 6%, as households draw down the additional savings accumulated during the pandemic.
Overall, the update is a bleak one for households with incomes under intense pressure, diminished scope for support from savings and some temporary timing effects around vehicles likely to drop out of the spend profile.
Hours worked: The National Accounts estimate that hours worked declined by -0.6%, while the Labour Force survey estimated that hours work declined by 0.8%.
Expenditure detail:
Domestic demand grew by 0.5% in the quarter, representing a decline in per capita terms of about -0.1%.
Net exports was a sizeable negative for activity, subtracting 0.6pppts. Imports increased by 2.1%, led by an 8.4% rise in services as more of us holidayed abroad. Exports slipped, declining by 0.7%, with a 1.9% rise in services more than offset by a 1.2% decline in goods centred on a reduction in resource shipments, down 3.7%.
Total inventories added 0.4ppts to activity, including: non-farm business inventories, +0.9ppts (on a rebuild of mining inventories); public authority inventories, -0.4ppts; and farm inventories, -0.1ppts.
Home building was little changed, up 0.2%.
Business investment increased by 0.6%, led by infrastructure, up 2.3%.
Public demand grew by a robust 1.4%, but note the large drag from public authorities of -0.4ppts.
Australia’s Q3 GDP growth slows to 0.2% qoq, per capita output declines
Australia's GDP for Q3 showed a modest increase of 0.2% qoq, falling short of the expected 0.5% qoq growth. On a year-on-year basis, GDP grew by 2.1%. However, a contrasting picture emerges when considering GDP on a per capita basis, which revealed a decline of -0.5% qoq and a -0.3% yoy.
Katherine Keenan, ABS head of national accounts, said: "This was the eighth straight rise in quarterly GDP, but growth has slowed over 2023." She pointed out that government spending and capital investment were the primary contributors to GDP growth in this quarter.
Specifically, government final consumption expenditure rose by 1.1%. Additionally, gross fixed capital formation also saw a 1.1% rise.
An interesting aspect of the September quarter's GDP was the contribution of 0.4% points from changes in inventories. Notably, mining inventories increased by AUD 2.4B, a reflection of the larger fall in exports compared to production volumes.
On the other hand, trade in services had a negative impact on growth. Imports of services surged by 8.4%, significantly outpacing the 1.9% growth in services exports.
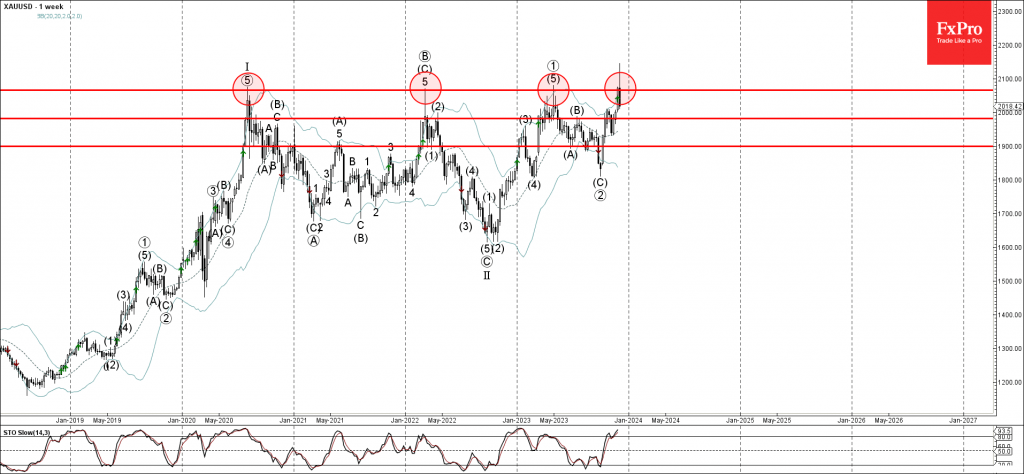
Gold Wave Analysis
- Gold reversed from multi-year resistance level 2065.00
- Likely to fall to support level 1.7000
Gold recently reversed down from the major multi-year resistance level 2065.00, which has been reversing the price from the middle of 2020, as can be seen below.
The resistance level 2065.00 was strengthened by the upper daily and the weekly Bollinger Bands.
Given the strength of the resistance level 2065.00 (which was never broken on a closing basis over the last few years) and the overbought weekly Stochastic, Gold can be expected to fall further to the next round support level 2000.00 – the breakout of which can lead to further losses to 1900.00.
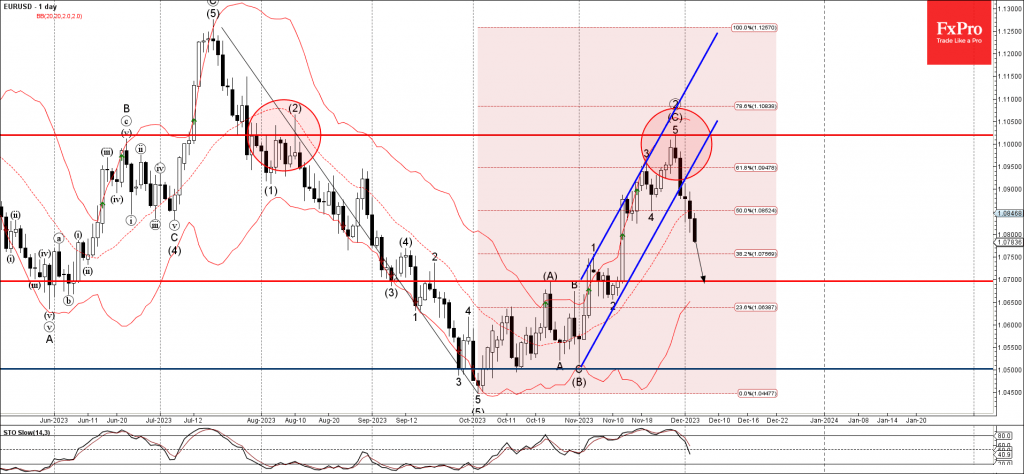
EURUSD Wave Analysis
- EURUSD broke daily up channel
- Likely to fall to support level 1.7000
EURUSD currency pair under the bearish pressure after the earlier breakout of the support trendline of the daily up channel, which enclosed the previous impulse wave (C) from the start of November.
The breakout of this daily up channel accelerated the active impulse wave 1.
Given the clear daily downtrend and the strong USD bullish sentiment seen today, EURUSD can be expected to fall further to the next support level 1.7000 (former monthly high from October).
Nasdaq – How Sustainable is the Stock Market Rally? PMIs a Positive Surprise
- Are interest rate expectations too optimistic?
- PMI revisions positive but the outlook is broadly unchanged
- NAS100 nears all-time highs
Equity markets in Europe and the US continued to edge higher on Tuesday despite many now questioning whether investors are getting too carried away.
The rally appears to be based on the view that central banks from the Fed to the ECB and BoC will start cutting interest rates in March and then do so another three times over the rest of 2024. That’s quite the difference from what policymakers have insisted on for many months but there has undoubtedly been a change in tone recently.
Whether that’s been enough to warrant such optimism is what many are now questioning and what, I’m guessing policymakers will address at the December meeting. Regardless of whether they push back against the scale of cuts next year, it’s clear now that there’ll be quite a shift from central banks at their meetings this month, based on recent commentary.
Whether that will be enough to constitute the pivot that’s been so talked about this year may well determine whether markets continue to price in a March cut as a u-turn of that magnitude will have to be clear from the meeting. The Fed in September indicated it expected to raise rates again, after all.
Services PMIs revised higher but outlook remains relatively unchanged
There were a lot of upward revisions to the PMI surveys from Europe and the US today and in the all-important services sector. While the revisions don’t really change the outlook in any considerable way – euro area still facing a mild recession, UK flat growth, US resilient – it is encouraging that a soft landing is still attainable.
Nasdaq nears all-time highs
The NAS100 appears to have stalled around 16,000 over the last couple of weeks which may be what’s making investors a little nervous.
NAS100 Daily
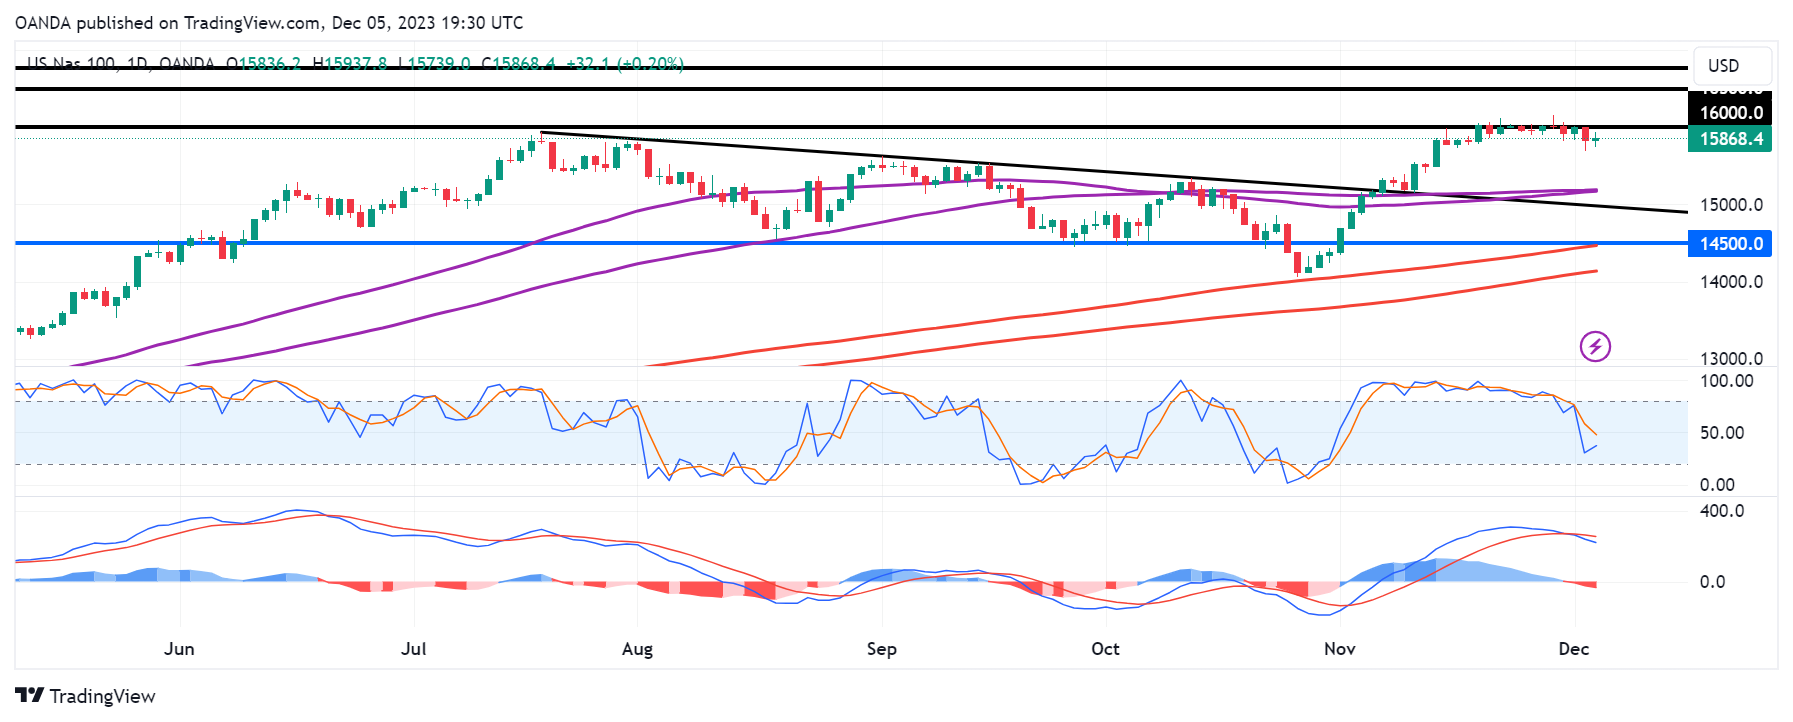
Source – OANDA on Trading View
The momentum indicators don’t look particularly healthy either, with both the stochastic and MACD making lower highs during the recent new peak in the price. A negative divergence doesn’t necessarily mean the price has peaked but it may suggest the rally is running on fumes.
Will US NFP Report Come to Dollar’s Rescue?
- Data and Fed rhetoric prompt investors to increase rate cut bets
- Dollar’s next major test comes in the form of the US jobs report
- The data comes out on Friday at 13:30 GMT
Dollar bleeds as investors ramp up bets of massive rate cuts
The US dollar has been bleeding lately as the market keeps adding to its Fed rate cut bets on every opportunity. Following the disappointing jobs data for October and the larger-than-expected inflation slowdown for the same month, it was Fed Governor Waller’s turn to add fuel to expectations of massive rate cuts next year. Early last week, Waller said that if the decline in inflation continues for several more months, they could start lowering the policy rate, marking the first time a Fed official discussed the possibility of lower rates. The latest hit for the dollar came from Fed Chair Powell, who said that the risks of the Fed slowing the economy more than necessary have become more balanced with the risks of not moving interest rates high enough to control inflation.
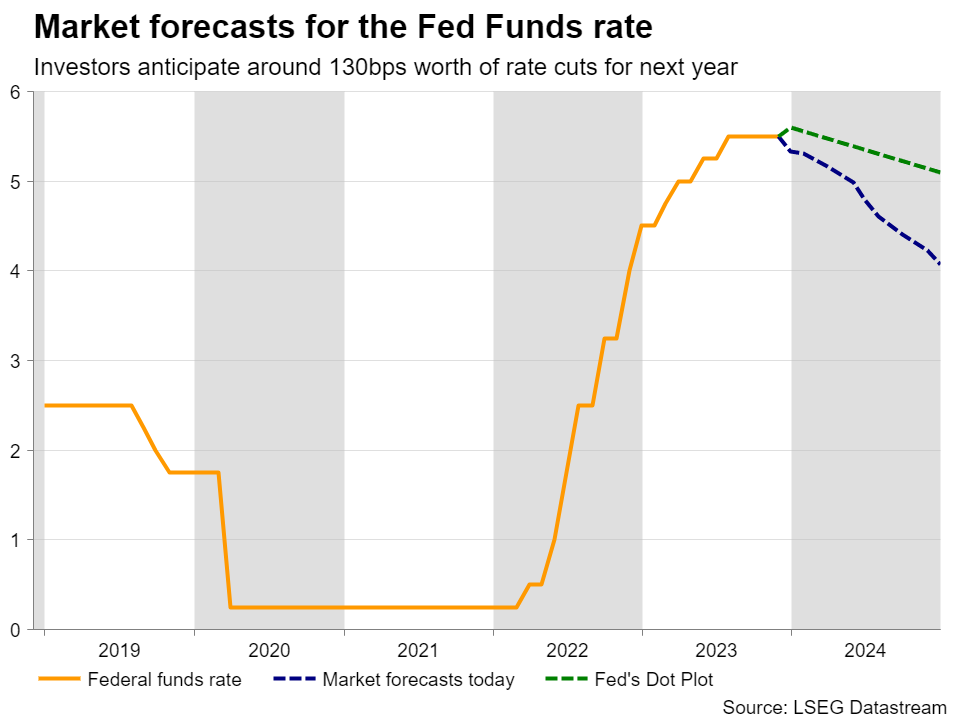
Although he did not shut the door to more increases if deemed necessary and was clearly more hawkish than Waller, the market may have interpreted his comments on balanced risks as validating the end of this tightening crusade and was encouraged to bring forth its rate-cut bets. According to Fed funds futures, a quarter point rate cut is more-than-fully priced in for May, with the probability of it being delivered in March rising to nearly 70%. What’s more, the total number of basis points worth of rate reductions expected by the end of 2024 has gone up to around 130.
Spotlight turns to the US employment numbers for November
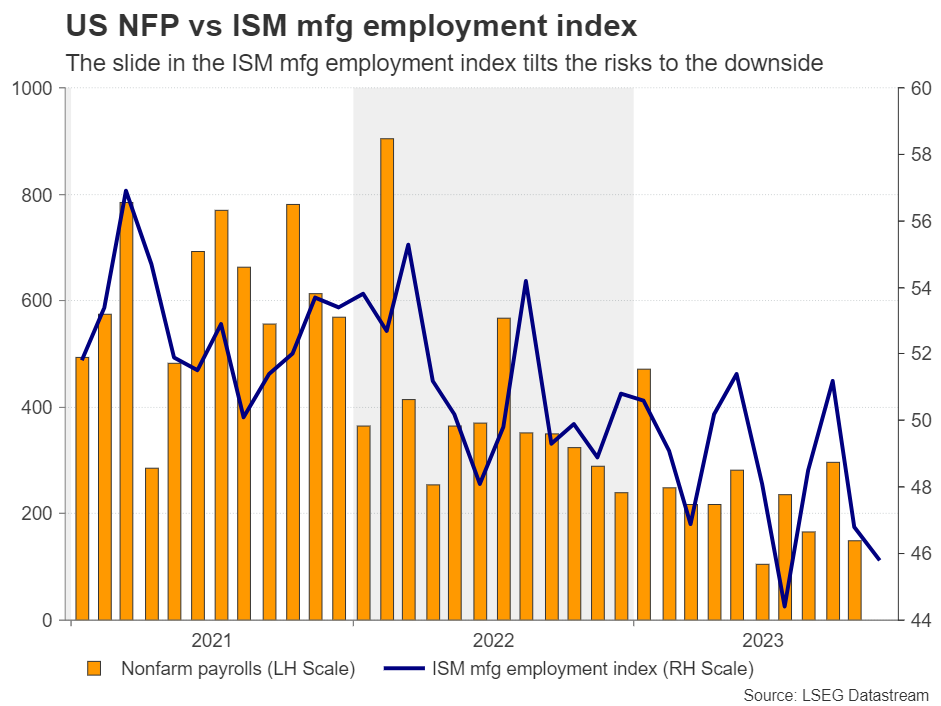
After Powell, investors will turn their attention back to economic data as Fed policymakers have entered the blackout period before next week’s policy decision. Following the ISM manufacturing PMI for November last week, which stayed below the boom-or-bust zone of 50 for the 13th consecutive month, Tuesday’s non-manufacturing index may attract special attention. However, the highlight of the week will most likely be the US employment report for November on Friday.
The unemployment rate is expected to have remained unchanged at 3.9% and nonfarm payrolls to have accelerated to 180k from 150k in October. That said, the ISM manufacturing PMI revealed that factory employment declined further as hiring slowed and layoffs increased. Thus, if the non-manufacturing survey paints a similar picture, then the risks surrounding the NFP print could be tilted to the downside.
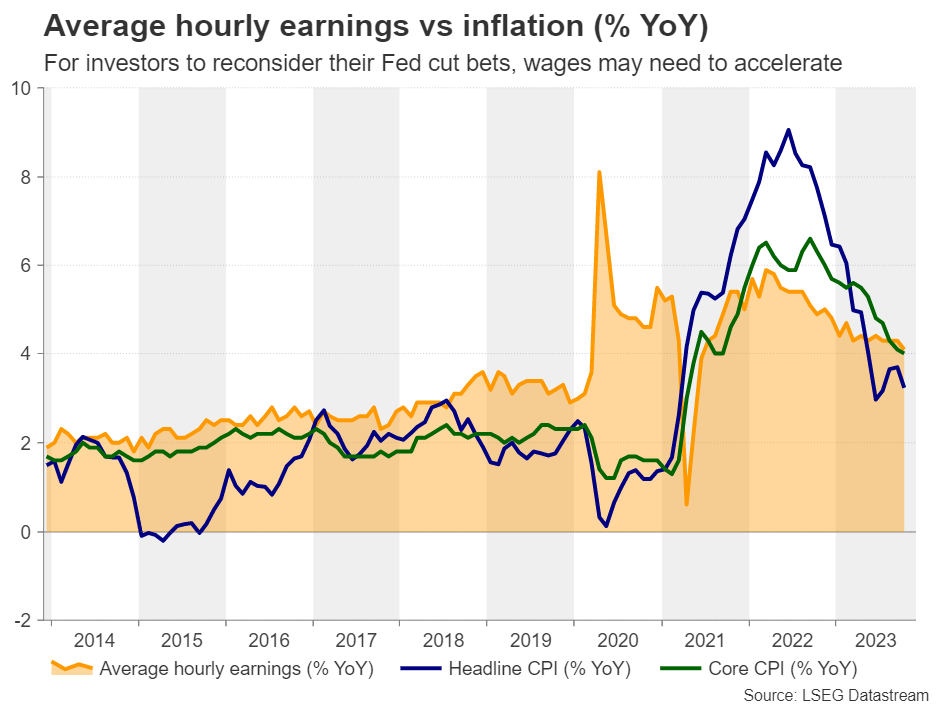
But, even if the forecasts are met, for investors to scale back some rate-cut bets for next year, these numbers may need to be accompanied by a reacceleration in wages. This could spark some fear that inflation could pick up steam in the months to come, thereby prompting the Fed to keep interest rates high for a longer period than currently anticipated. That said, the forecast for average hourly earnings is for a further slowdown to 4.0% y/y from 4.1%, which could solidify investors’ belief and push the dollar lower. After all, lately, market moves suggest that investors are selling the dollar more aggressively when data or headlines corroborate their view, rather than buying it when there are indications supporting the opposing ‘higher for longer’ case.
Aussie and kiwi may continue outperforming the dollar
Expectations of several rate cuts by the Fed do not only translate into dollar weakness and sliding Treasury yields, but also into improving risk appetite and rallying stocks, as lower yields mean higher present values for high-growth firms that are usually valued by discounting expected future cash flows. Ergo, the risk-linked currencies, like the aussie and the kiwi, are getting an extra boost against the US dollar compared to other major currencies.
On top of that, the RBNZ appeared hawkish at its latest gathering, and although the RBA adopted a softer tone this week, investors are still assigning a 20% probability for another hike at the Bank’s February gathering. So, the divergence in policy expectations between those two Banks and the Fed also supports more gains in aussie/dollar and kiwi/dollar.
From a technical standpoint, following last week’s hawkish hold by the RBNZ, kiwi/dollar extended its recovery against its US counterpart, breaking above the key barrier of 0.6130, marked by the high of August 4. Although the pair pulled back after hitting 0.6220, the price structure still consists of higher highs and higher lows above a short-term uptrend line, and thus, should investors continue to believe that the Fed will cut rates sharply next year, the bulls may be tempted to challenge the peak of July 27 at 0.6270 soon. A break higher could carry extensions towards the important area of 0.6385, which acted as a ceiling between February and July.
For the bullish picture to be dismissed, the pair may need to slide all the way back below the crossroads of the 200-day exponential moving average and the very important 0.6060 area. Such a dip may turn the near-term outlook back to neutral.