Sample Category Title
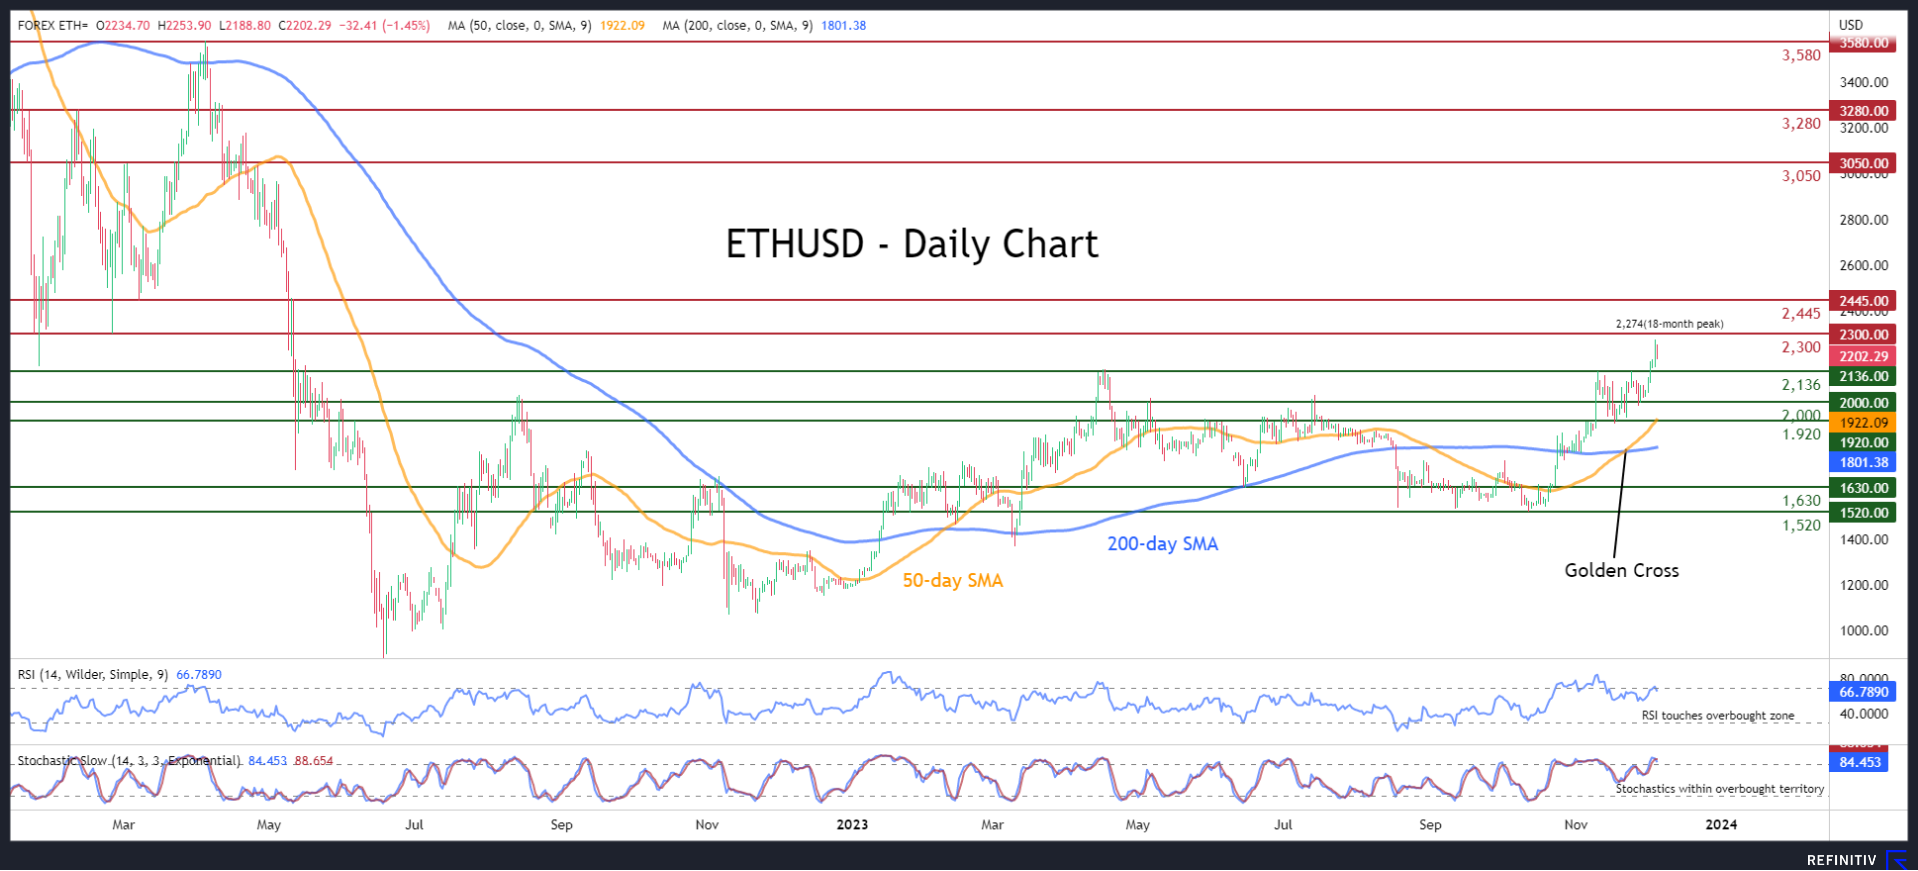
ETHUSD Posts a Fresh 18-month High
- Ethereum jumps to its highest since May 2022
- Advance eases as oscillators point at overbought conditions
ETHUSD (Ethereum) has experienced a strong rally since late October, which propelled the price to a fresh 18-month peak of 2,274 on Monday. However, the uptrend seems to be losing some steam, with both the RSI and stochastics touching their overbought territories.
Should the rally extend, the price could initially test the February 2022 support of 2,300, which could now serve as resistance. Conquering this barricade, the bulls could attack the March 2022 bottom of 2,445. If that barricade also fails, there is no prominent resistance until the March 2022 hurdle of 3,050.
On the flipside, bearish actions could send the price to challenge the November resistance of 2,136, which also held strong in April. Sliding beneath that floor, the leading altcoin could descend towards the 2,000 psychological mark. A break below the latter may pave the way for the November support of 1,920, which overlaps with the 50-day simple moving average (SMA).
Overall, ETHUSD has been constantly gaining ground in the short-term, posting consecutive 2023 highs. Nevertheless, traders should not rule out a pullback as there are emerging signs that the advance has been overstretched.
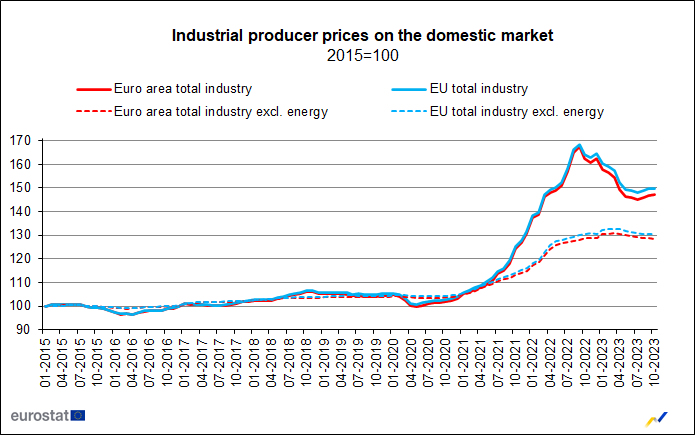
Eurozone PPI at 0.2% mom, -9.4% yoy in Nov, matches expectations
Eurozone PPI came in at 0.2% mom, -9.4% yoy in November, matched expectations. For the month, industrial producer prices increased by 1.0% mom in the energy sector and by 0.1% mom for durable consumer goods, while prices remained stable for capital goods, and prices decreased by -0.1% mom for non-durable consumer goods and by -0.3% mom for intermediate goods. Prices in total industry excluding energy decreased by -0.2% mom.
EU PPI was at 0.2% mom, -8.7% yoy. The biggest monthly increases in industrial producer prices were observed in Ireland (+4.9%), Italy (+2.2%) and the Netherlands (+0.7%), while the largest decreases were recorded in Luxembourg (-3.7%), Latvia (-2.7%) and Greece (-1.9%).
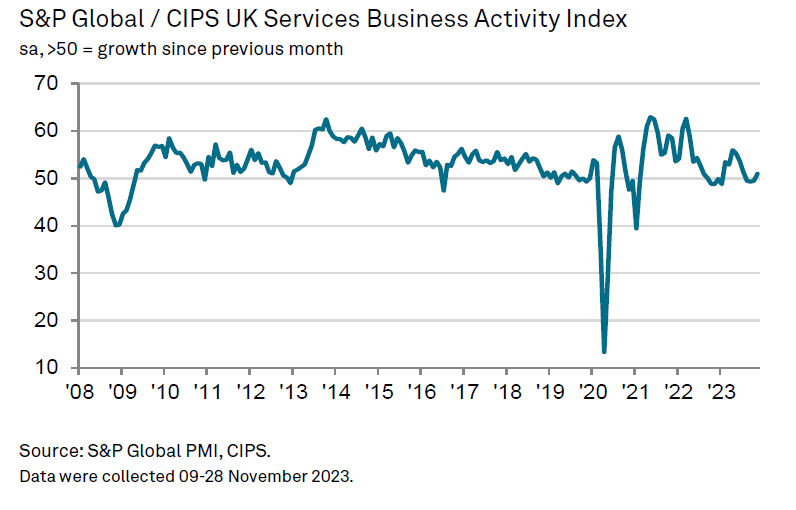
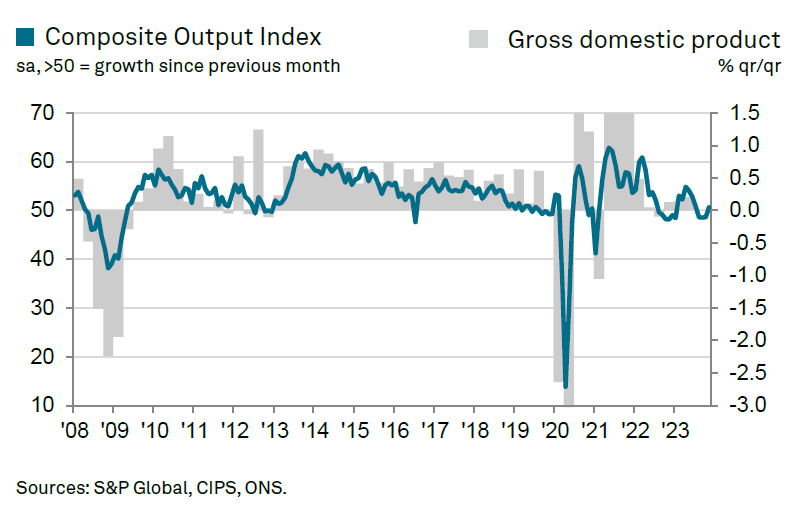
UK PMI services finalized at 50.9, composite at 50.7
UK's PMI Services for November improved to 50.9 from October's 49.5, indicating expansion for the first time in four months. PMI Composite also rose to 50.7, crossing the critical 50 mark for the first time since July.
Tim Moore of S&P Global Market Intelligence remarked on the positive shift: "UK service providers moved back into expansion mode" However, he cautioned about inflation, noting "another round of strong input cost pressures" mainly due to rising staff wages. This improvement in the service sector, although positive, is shadowed by ongoing inflationary challenges.
Gold Falls from Record High by $100 in 1 Day
The record high of about USD 2,130 an ounce was set just after the weekend in low-liquid Asian markets. By the nature of the movement, it looked more like a cascading triggering of sellers’ stop losses, rather than finding a stable balance between supply and demand, since after the candle with a long upper tail, the quote began to fall. During the European session it fell to 2,060, and during the American session it fell to 2,030. So in less than a day, the price of gold fell about USD 100, making Monday's close further from the record top than Friday's close — essentially similar to a change in market sentiment, in which a bearish engulfing pattern is formed.
From a fundamental point of view, the gold market is influenced by:
→ Jerome Powell's words that expectations of a rate cut may be “premature”;
→ positioning traders at the beginning of the working week. Important news on the US labor market is expected on Friday.
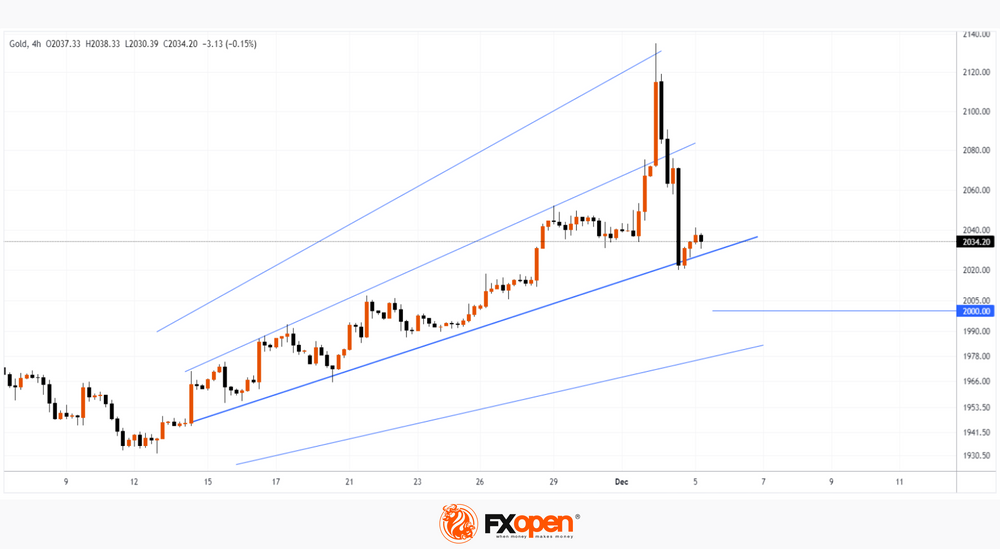
From a technical point of view, the gold price chart has a structure of trend lines that resemble a Gann fan. The price found support near one of them (shown in double thickness), thereby stopping Monday's fall. It is possible that if the bounces from this line are weak, the downward momentum may resume. In this case, the bears may try to break through the psychological level of USD 2,000 to test the next line from the mentioned structure.
This article represents the opinion of the Companies operating under the FXOpen brand only. It is not to be construed as an offer, solicitation, or recommendation with respect to products and services provided by the Companies operating under the FXOpen brand, nor is it to be considered financial advice.
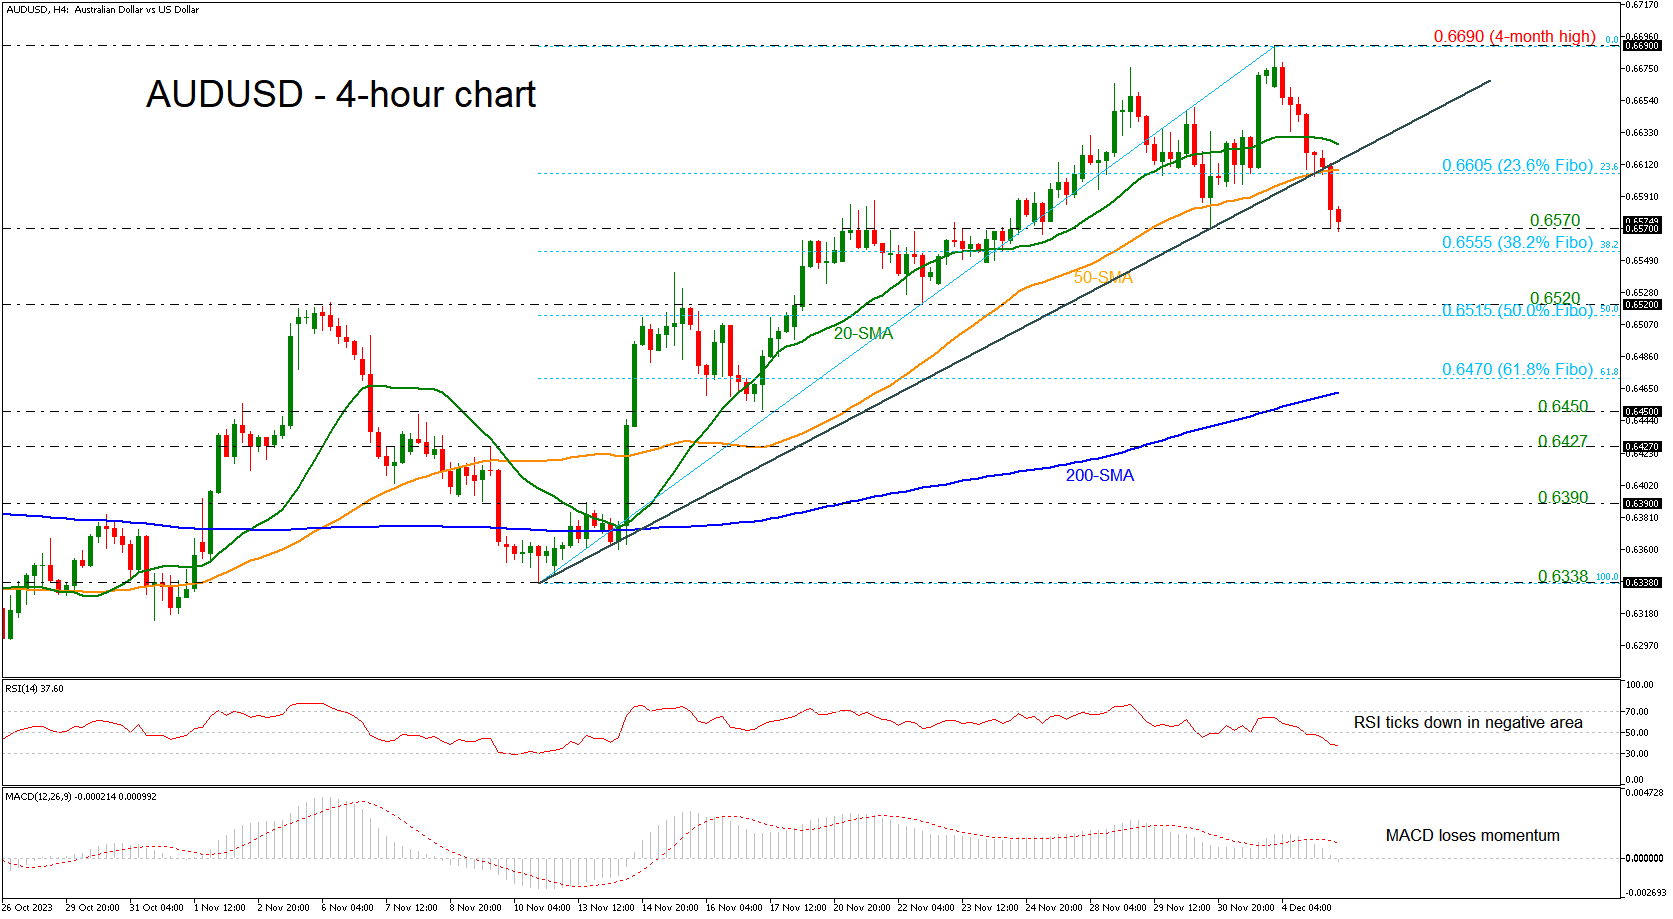
AUDUSD Plummets Below Uptrend Line
- AUDUSD posts several red candles
- Holds below the SMAs
- Technical oscillators hold in negative areas
AUDUSD has been in a bearish corrective mode during the week, penetrating the short-term uptrend line to the downside with strong momentum.
Entering the 0.6570 area has been a struggle over the past three days, and there might be another tough obstacle within the 38.2% Fibonacci retracement level of the up leg from 0.6338 to 0.6690 at 0.6555, but the bears may not give the battle yet according to the technical indicators. Specifically, the RSI is plunging below the 50 neutral mark and the MACD oscillator is diving beneath the zero level.
In the event the pair re-activates its uptrend above the 23.6% Fibonacci of 0.6605, which overlaps with the 50-period simple moving average (SMA) in the 4-hour chart, ahead of the 20-period SMA at 0.6625, which would shift the bias back to positive. Even higher, the bulls might head for the four-month high of 0.6690.
On the downside, the 38.2% Fibonacci of 0.6555 could come in focus before the market continues the selling interest towards the 0.6515-0.6520 support region, which encapsulates the 50.0% Fibonacci.
Overall, AUDUSD is changing the bullish bias to bearish in the near-term and only a climb back above the ascending trend line could resume the positive outlook.
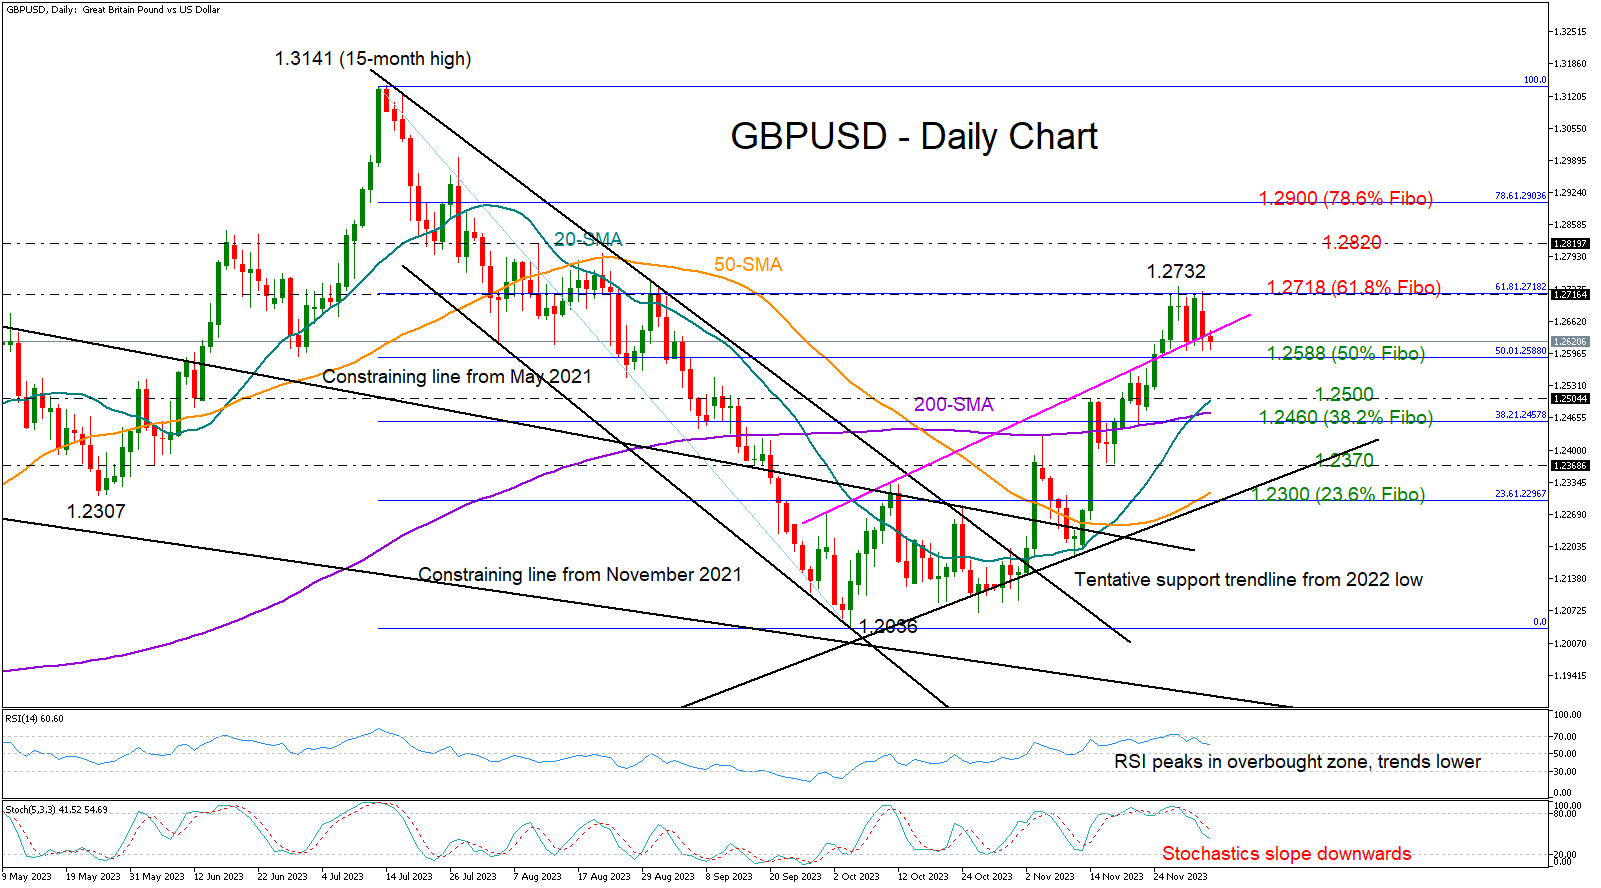
GBPUSD Bulls Hit a Wall; Support Nearby
- GBPUSD reaches overbought area near key resistance
- Sellers could take control of the market below 1.2588
GBPUSD flatlined around the familiar 1.2720 resistance region, which was last tested at the end of August, after three constructive bullish weeks. The area also overlaps with the 61.8% Fibonacci retracement of the July-October downleg.
The ongoing consolidation phase could develop into a bearish wave according to the technical indicators. Both the RSI and the stochastic oscillators have peaked near their overbought levels and are trending southwards at the moment.
Nevertheless, sellers might stay patient until the price drops below the 23.6% Fibonacci level of 1.2588. If that floor collapses, the decline could pick up pace towards the 20-day simple moving averages (SMA) at 1.2500. The 38.2% Fibonacci mark of 1.2457 could also be on guard, protecting the market from a deep downfall to 1.2370. Should the bearish sentiment hold up, the price could next stall somewhere between the 50-day SMA and the support trendline from the 2022 low at 1.2300.
In the event upside forces resume above the nearby resistance of 1.2640, buyers will eagerly look for a sustainable move above the 1.2720 ceiling. A victory there could prompt an advance towards the 1.2820 barrier, while a steeper increase could battle the 23.6% Fibonacci of 1.2900.
Overall, GBPUSD is expected to switch into a corrective mode, with selling pressures likely intensifying below 1.2588. Otherwise, the pair might push for an uptrend resumption above the 1.2720 bar.
Japanese Yen Steady, Tokyo CPI Falls
- Tokyo Core CPI eases to 2.3%
- US to release ISM Services PMI later today
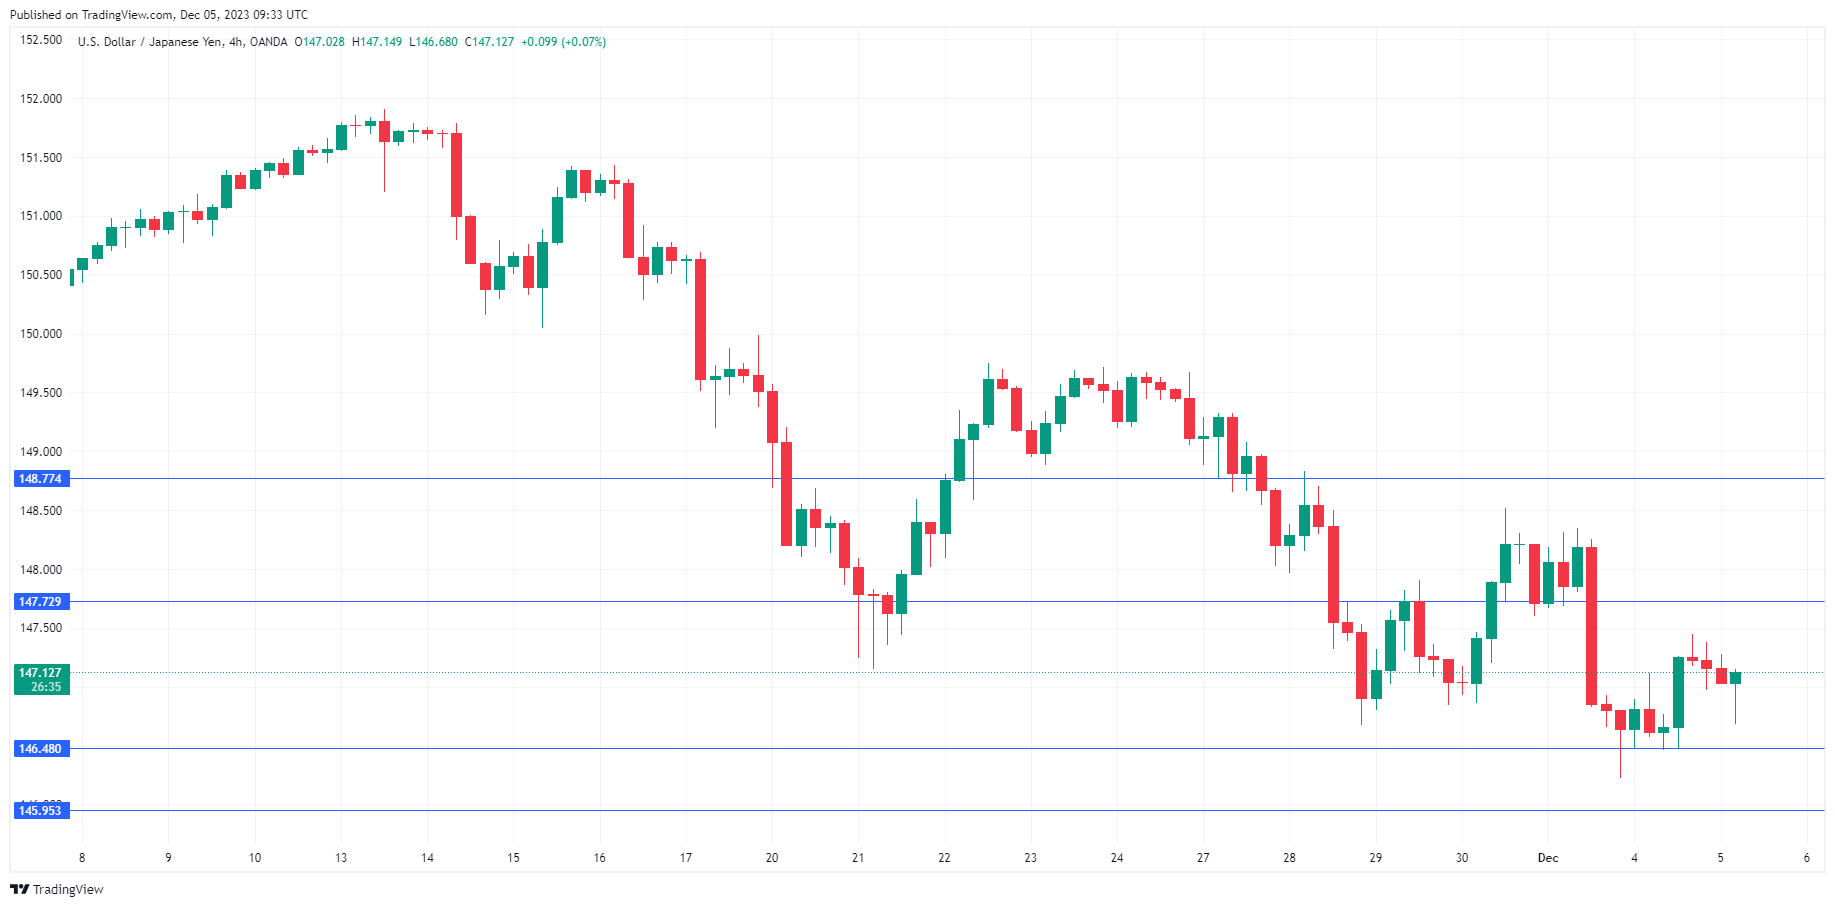
The Japanese yen has edged lower on Tuesday. In the European session, USD/JPY is trading at 147.08, down 0.10%.
Tokyo Core CPI softer than expected
Tokyo Core CPI, a leading indicator for nationwide inflation, climbed 2.3% y/y in November. This was down from 2.7% in October and below the consensus estimate of 2.4%. This marked the 18th consecutive month that Tokyo Core CPI has hovered above the 2% target, indicating persistent inflationary pressures. Tokyo’s headline inflation also slowed in November to 2.6%, down from 3.3%.
With inflation persistently above the 2% target, speculation is high that the Bank of Japan will have to tighten its ultra-loose monetary policy. The BoJ has pushed back against these expectations, insisting that the rise in inflation is due to cost-push factors and that higher wages are needed to ensure inflation is sustainable. This message was echoed on the weekend by Bank of Japan board member Asahi Noguchi, who said that sustained wage increases were needed to reach the 2% inflation target.
The Japanese recovery has been slow and that will provide a strong argument for the central bank to continue its massive stimulus, which is aimed at boosting economic growth. The BoJ holds its next meeting on December 18-19. The meetings have been garnering a great deal of attention, as investors await a shift in policy. I don’t expect any significant moves at the December meeting but the BoJ is not known for its transparency and likes to surprise the markets, which means that a change in policy, although unlikely, cannot be completely discounted.
The US releases the ISM Services PMI later today. The October print fell to 51.8, down from 53.6 and the lowest in five months. The PMI isn’t expected to show much change in November, with a consensus estimate of 52.0.
USD/JPY Technical
- 148.77 and 147.72 are the next resistance lines
- 146.48 and 145.96 are providing support
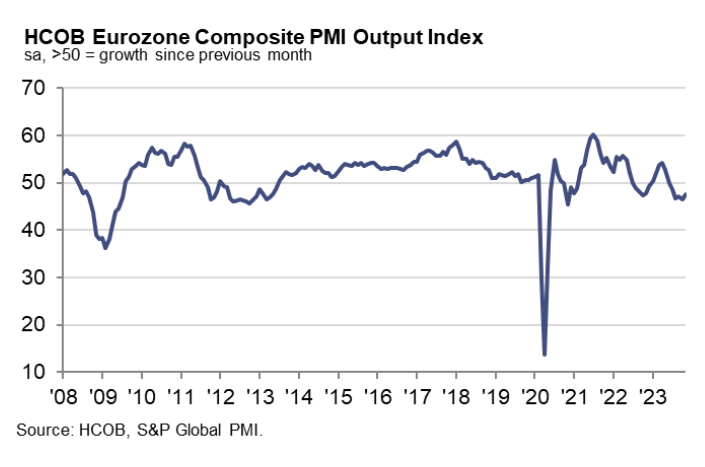
Eurozone PMI composite finalized at 47.5, on the brink of recession
Eurozone's PMI Services for November showed a slight improvement, finalizing at 48.7, up from 47.8 in October. PMI Composite also experienced an uptick, reaching 47.5 from the previous month's 46.5.
Looking at individual member states, PMI composite revealed mixed results. Ireland registered a three-month high at 52.3, while Spain hit a three-month low at 49.8. Italy reported a two-month high at 48.1, and Germany saw a four-month high at 47.8. France remained unchanged, with its PMI holding steady at 44.6.
Cyrus de la Rubia, Chief Economist at Hamburg Commercial Bank, stated, "The service sector maintained its downward slide in November." He noted that the modest improvement in the activity index offers little optimism for a swift recovery in the immediate future. De la Rubia also highlighted concerning trends, such as the fifth consecutive monthly decline in new business and subdued business expectations, which remain "well below the long-term average."
Outlook for Eurozone's economy, as inferred from these PMI indicators, is not encouraging. De la Rubia mentioned, "As per our GDP nowcast, factoring in the latest PMI indicators, a fall in GDP is on the cards for the fourth quarter." He warned that if two consecutive quarters of negative growth define a recession, the Eurozone is currently "on the brink" of one.
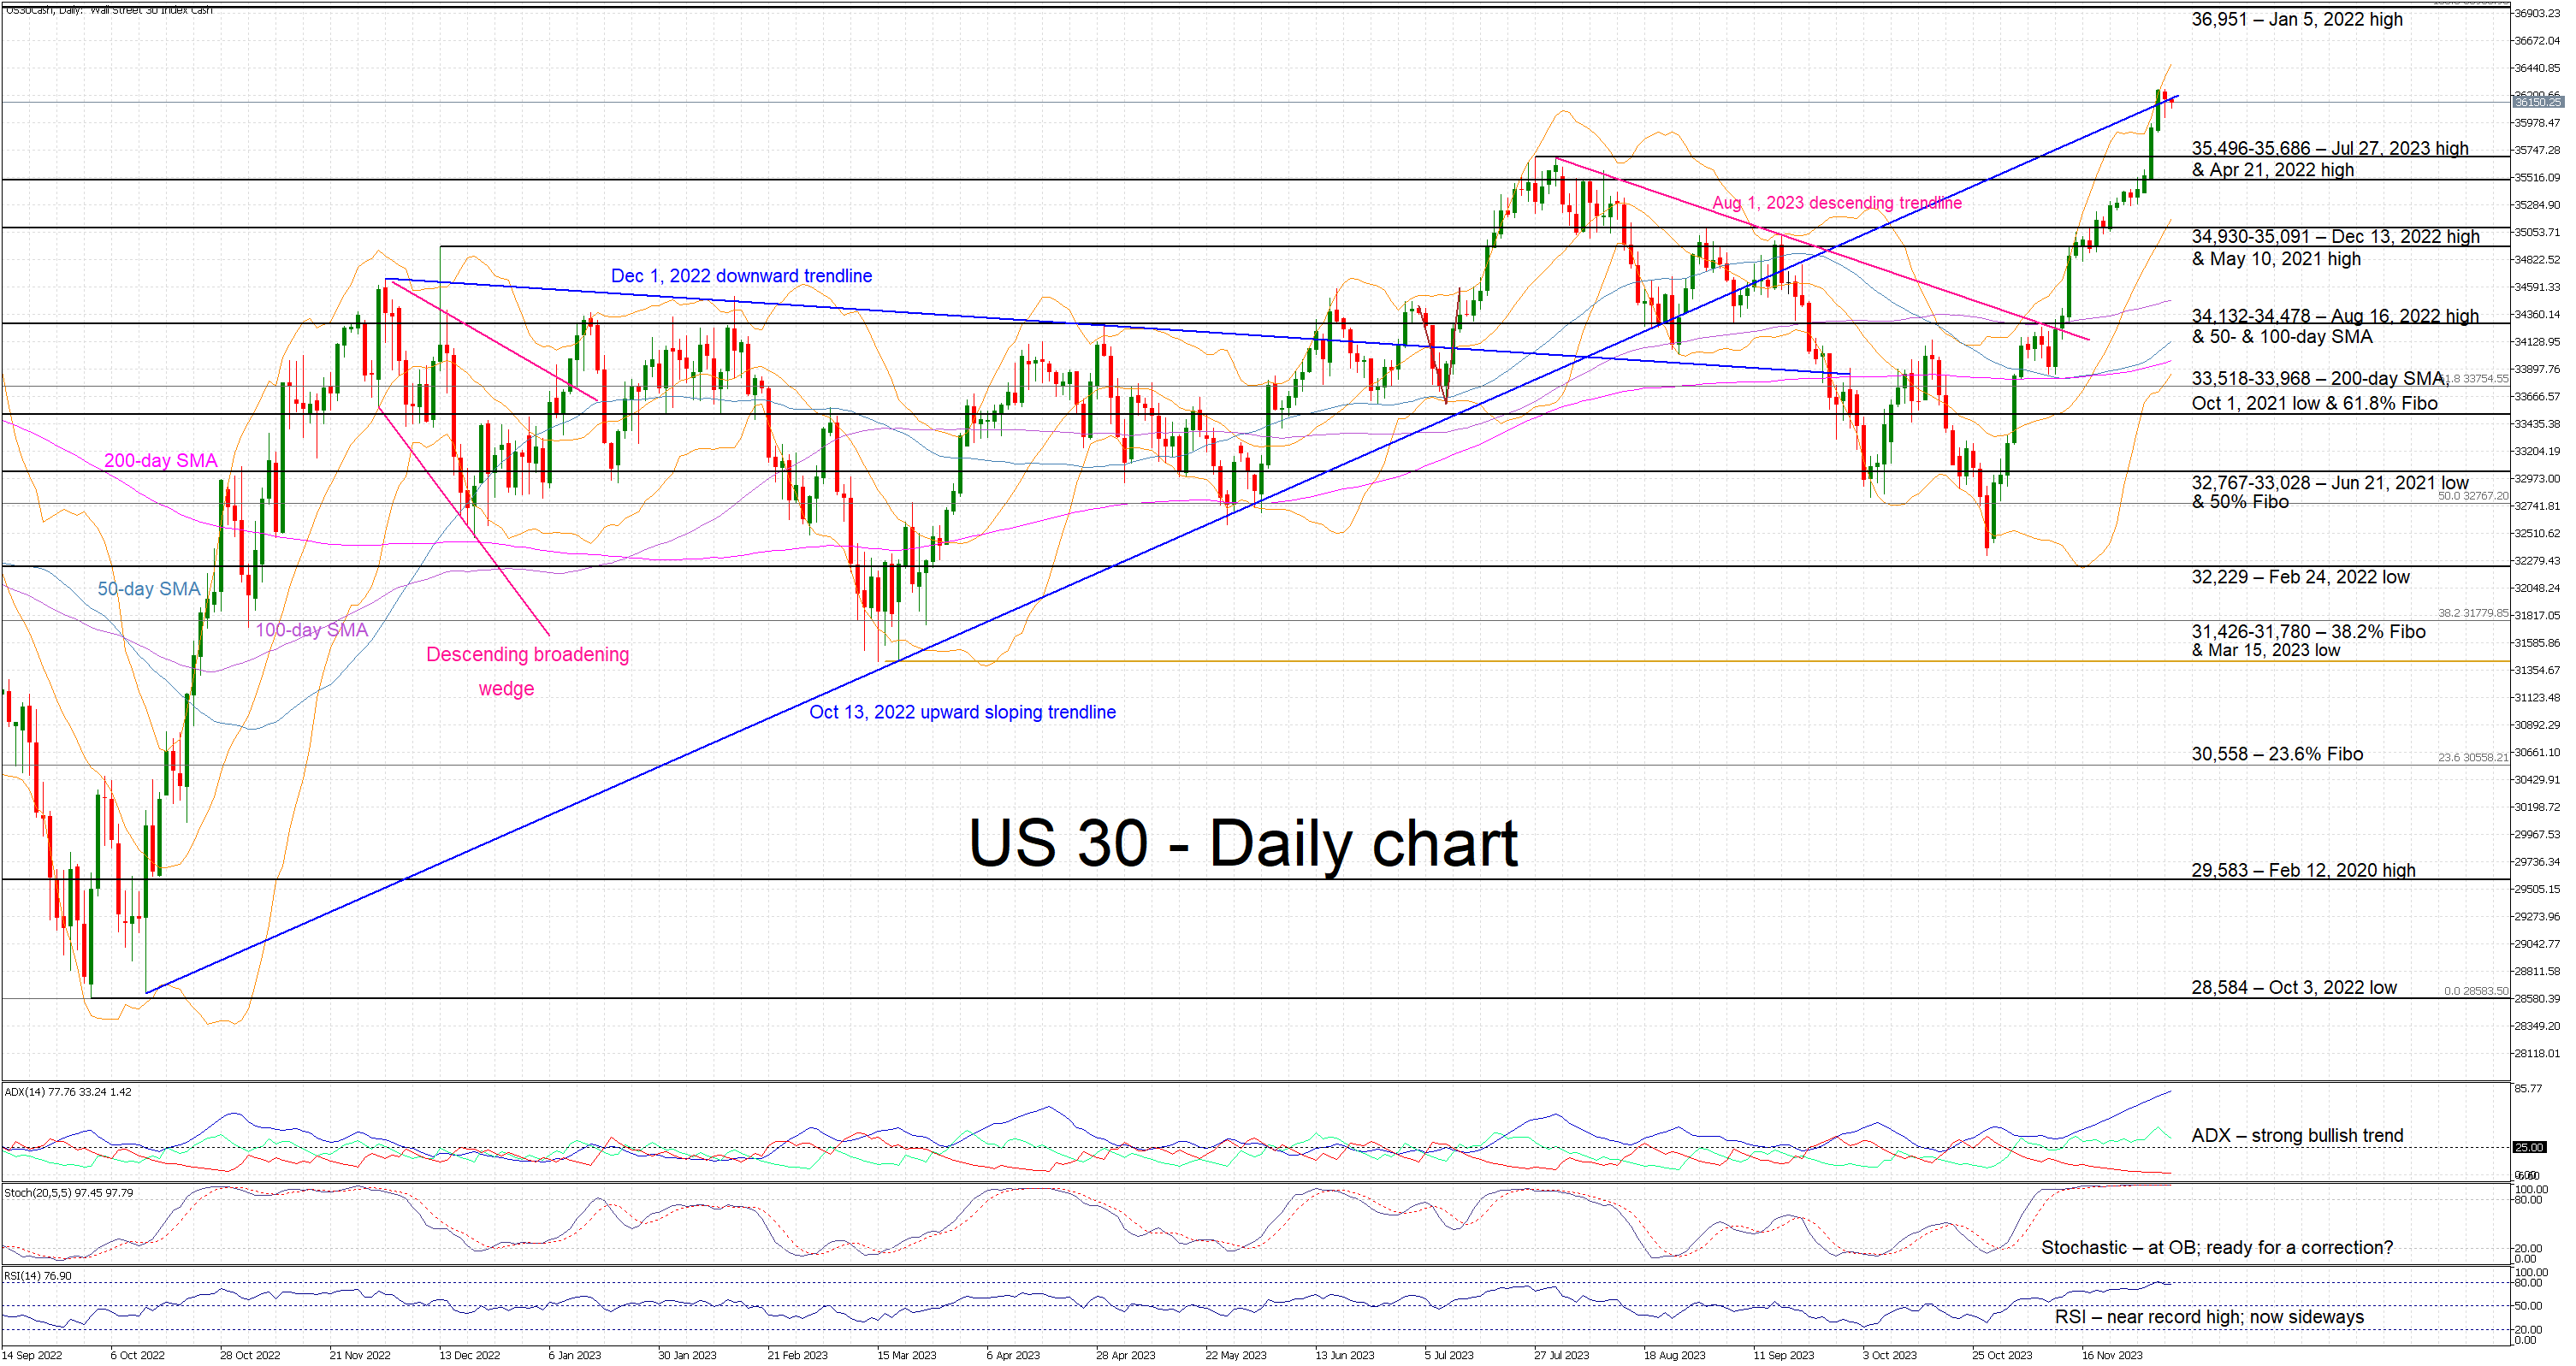
US 30 Cash Index Battles With Key Trendline
- US 30 index in the red after recording a new 22-month high
- Aggressive move higher from the October lows
- Some early signs of rally exhaustion from the momentum indicators
The US 30 cash index is trying to record its second consecutive red candle after registering a new 22-month high, 12% higher from the late October lows. It is currently battling with the October 13, 2022 upward sloping trendline with the bulls possibly taking a breather and preparing for the next eventful trading period ahead of the seasonal break.
In the meantime, the momentum indicators are possibly preparing to send some rally exhaustion signals. The RSI has probably peaked, and it is now trading sideways. Similarly, the stochastic oscillator continues to scratch the upper end of its overbought territory, potentially revealing a lack of fresh buying momentum. On the other hand, the ADX has reached a new higher high, confirming the very strong bullish trend in the US 30 index.
Should the bulls remain hungry, they could try to overcome the resistance set by the October 13, 2022 upward sloping trendline. This might not prove an easy task, but, if successful, the bulls could then have the chance to push the US 30 index towards the January 5, 2022 high at 36,951.
On the flip side, the bears are desperately trying to make a stand and could choose to defend the October 13, 2022 trendline. They could then stage a move lower towards the busy 35,496-35,686 range, which is defined by the July 27, 2023 and the April, 2022 highs. Even lower, the 34,930-35,091 area, populated by the December 13, 2022 and May 2021 highs, has proved in the recent past to be a strong support area.
To sum up, US 30 cash index bulls are probably taking a breather ahead of some key market events. The bears could try to take advantage of the situation, but they need help from the momentum indicators to stage decent correction.
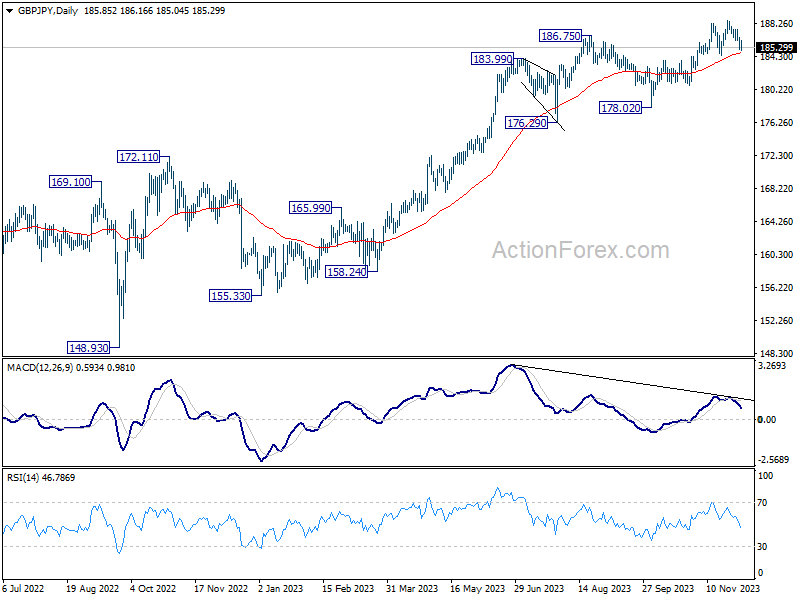
GBP/JPY Daily Outlook
Daily Pivots: (S1) 185.18; (P) 185.87; (R1) 186.68; More...
Intraday bias in GBP/JPY remains neutral at this point. Price actions from 188.63 short term top is seen as a near term consolidation pattern for now. As long as 184.44 support holds, further rally is expected. Decisive break of 188.63 will resume larger up trend. However, firm break of 184.44 will turn bias to the downside for deeper correction back to 178.02 support instead.
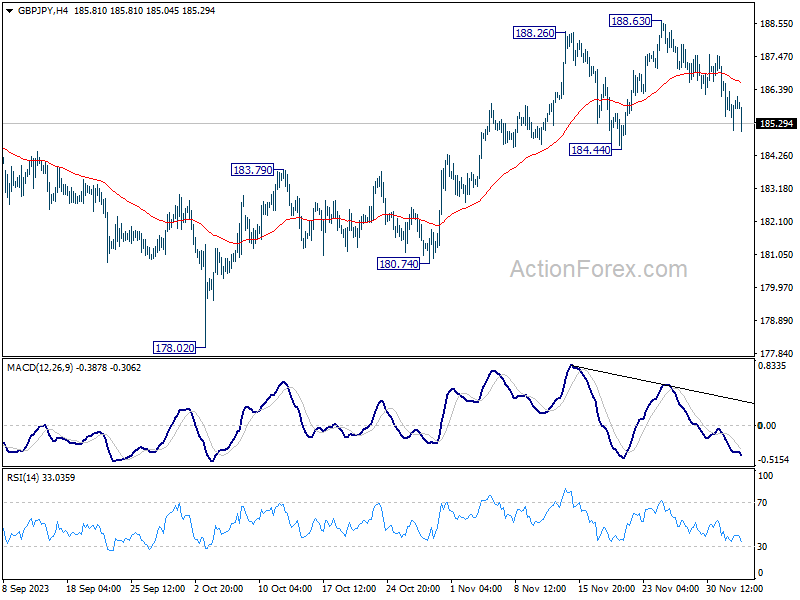
In the bigger picture, as long as 184.44 support holds, larger up trend from 123.94 (202 low) should still be in progress, next target is 195.86 (2015 high). However, firm break of 184.44 will now argue that a medium term top is formed, possibly in bearish divergence condition in D MACD, and bring deeper fall back to 178.02 support.