Sample Category Title
Forex and Cryptocurrencies Forecast
EUR/USD: December – A Formidable Month for the Dollar
Who will start loosening the grip on their monetary policies earlier, the Federal Reserve (FRS) or the European Central Bank (ECB)? The discussion on this topic remains active, as clearly seen in the quotes' charts. The statistics from the past week did not allow EUR/USD to solidify above the significant level of 1.1000. It all began on Wednesday, November 29, with the publication of inflation data in Germany. The preliminary Consumer Price Index (CPI) in annual terms amounted to 3.2%, which is lower than both the forecast of 3.5% and the previous value of 3.8%. In monthly terms, the German CPI went even deeper into the negative territory, reaching -0.4% (against a forecast of -0.2% and 0.0% the previous month).
These data marked the beginning of the euro's retreat. EUR/USD continued its decline after the release of the Harmonized Index of Consumer Prices (HICP) for the Eurozone. Eurostat reported that, according to preliminary data, the HICP fell to the lowest level since June 2021, amounting to 2.4% (y/y), which is lower than both the 2.9% in October and the expected 2.7%. The monthly indicator was -0.5%, decreasing from 0.1% in the previous month.
All these data have shown that deflation in the Eurozone significantly outpaces the American one. As a result, many market participants, including strategists at the largest banking group in the Netherlands, ING, have started talking about the imminent victory of the ECB over inflation. They have concluded that the European Central Bank will be the first to ease its monetary policy, including lowering interest rates and engaging in monetary expansion. According to forecasts, this process may begin in April, and with a 50% probability, even a month earlier, in March. The likelihood that the key interest rate will be reduced by 125 basis points (bps) during 2024, from 4.50% to 3.25%, is estimated at 70%. Indirectly, the move towards a more dovish policy was recently confirmed by a member of the ECB's Executive Board and the head of the Bank of Italy, Fabio Panetta, who spoke about the "unnecessary harm" that can be caused by persistently high-interest rates.
As for the United States, FOMC officials speak not of harm but, on the contrary, of the benefits of high-interest rates. For instance, John C. Williams, the President of the Federal Reserve Bank of New York, stated that it is appropriate to keep borrowing costs on a plateau for an extended period. According to him, this would allow for a complete restoration of the balance between demand and supply and bring inflation back to 2.0%. Williams predicts that the Personal Consumption Expenditures (PCE) Index will decrease to 2.25% by the end of 2024 and stabilize near the target level only in 2025.
Therefore, it is unlikely that we should expect the hawks of the Federal Reserve to turn into doves in the near future. Especially considering that the U.S. economy allows maintaining such a position: stock indices are rising, and the GDP data published on November 29 showed a growth of 5.2% in Q3, surpassing both market expectations of 5.0% and the previous value of 4.9%.
Given this situation, it's not surprising that EUR/USD experienced a decline.
On Friday afternoon, it reached a local low at the level of 1.0828 and would have continued to decline further if it were not for the head of the Federal Reserve. Jerome Powell spoke at the very end of the workweek and stated that he considers premature the discussion of when the U.S. central bank can begin to ease its monetary policy. He hinted that the Fed will keep the interest rate unchanged at the current level of 5.50% at the December meeting. Powell also noted that the core inflation in the U.S. is still significantly higher than the target of 2.0%, and the Federal Reserve is ready to continue tightening its policy if necessary. In general, he said the same things as John Williams. However, if the words of the President of the New York Fed strengthened the dollar, somehow similar words from the Fed Chair weakened it: during Powell's speech, the DXY Index lost about 0.12%. Market reactions are truly unpredictable! As a result, the final chord of the week sounded at the level of 1.0882.
What awaits us in December? Following the logic mentioned above, the dollar should continue its advance against the euro. However, a seasonal factor may intervene, indicating a bearish movement for the dollar in December against a range of currencies. According to economists at Societe Generale, the average decline of the Dollar Index (DXY) over the last 10 years in December is 0.8%. Seasonally, the euro (EUR), Swedish krona (SEK), British pound (GBP), and Swiss franc (CHF) tend to rise, while the movements of the Australian dollar (AUD), Canadian dollar (CAD), Japanese yen (JPY), and Mexican peso (MXN) can be considered mixed.
Specialists at the Japanese MUFG Bank also confirm bullish indicators for EUR/USD in the last month of the year. "The seasonal tendency in December," they write, "is quite convincing: over the last 20 years, December has seen EUR/USD rise 14 times, with an impressive average gain of 2.6% over these 14 years. If we exclude December 2008 (+10.1%), the average gain in the other 13 cases was still significant at +2.0%. Moreover, in 8 out of 11 cases when EUR/USD rose in November, it was followed by a rise in December" (and it rose indeed!). "But this does not mean," caution MUFG, "that we can ignore fundamental factors." It is relevant to remind here that based on such factors, the Federal Reserve (FRS) and the European Central Bank (ECB) will make decisions at their meetings on December 13 and 14, respectively.
At the moment, experts' opinions on the near future of EUR/USD are divided as follows: 50% voted for the strengthening of the dollar, 30% sided with the euro, and 20% remained neutral. Regarding technical analysis, 50% of oscillators on the D1 chart are coloured green, 30% are in a neutral grey, and only 20% are red. Interestingly, half of these 20% are already signalling oversold conditions. Among trend indicators, 65% favour the bullish side, while 35% point in the opposite direction.
The nearest support for the pair is located in the area of 1.0830-1.0840, followed by 1.0740, 1.0620-1.0640, 1.0480-1.0520, 1.0450, 1.0375, 1.0200-1.0255, 1.0130, and 1.0000. Bulls will encounter resistance around 1.0900, 1.0965-1.0985, 1.1070-1.1110, 1.1150, 1.1230-1.1275, 1.1350, and 1.1475.
A substantial flow of data is anticipated from the American labour market in the upcoming week of December 5 to 8. The highlight will be on Friday, December 8, when crucial indicators such as the unemployment rate and the number of new non-farm jobs (NFP) will be published. Additionally, on Tuesday, December 5, we will learn about business activity (PMI) in the U.S. service sector. Data on retail sales in the Eurozone will be available on Wednesday, December 6, and the following day, we will find out about GDP. Finally, on Friday, December 8, revised data on consumer inflation (CPI) in Germany will be released.
GBP/USD: Three Reasons in Favor of the Pound
The likelihood that the US Federal Reserve has likely concluded its cycle of monetary restriction and interest rates have plateaued has been mentioned earlier. Similar sentiments were expressed regarding the historical seasonal advantages of the British pound over the dollar in December.
Verbal support for the British currency was provided by the rhetoric of the Bank of England (BoE) leadership, which currently has no plans to adjust its current monetary policy trajectory. As known, this trajectory is aimed at tightening. Deputy Governor of the BoE, Dave Ramsden, stated that monetary policy should continue to be restrictive to curb inflation. A similar hawkish position was taken by BoE Governor Andrew Bailey, who emphasized that rates should rise for longer, even if it negatively affects the economy.
Currently, the key interest rate for the pound is at a 15-year high of 5.25%. Its last increase occurred on August 3, after which the Bank of England took a pause. However, this does not necessarily mean that they won't resume and increase the rate by 25 basis points at their December or January meeting.
Similar hawkish statements from the leaders of the Bank of England contribute to bullish sentiments for the pound. Even despite the dollar's rise in the second half of the past week, GBP/USD couldn't breach the support at 1.2600. According to economists from the Singaporean United Overseas Bank (UOB), as long as this strong level remains unbroken, there is a possibility for the pair to move slightly higher in the next 1-3 weeks before an increased risk of a pullback. UOB believes that, at the moment, the likelihood of the pound rising to the resistance level of 1.2795 is not substantial.
Following Jerome Powell's remarks, GBP/USD settled at the level of 1.2710 at the conclusion of the past week. Regarding its immediate future, 20% are in favour of further ascent, while the majority of surveyed analysts (55%) have taken the opposite position, and the remaining 25% remain neutral. On the D1 chart, all trend indicators and oscillators unanimously point north, with the latter indicating overbought conditions at 15%.
In the event of a southward movement, the pair will encounter support levels and zones at 1.2600-1.2635, followed by 1.2570, 1.2500-1.2520, 1.2450, 1.2370, 1.2330, 1.2210, and 1.2040-1.2085. In case of an upward movement, resistance awaits at levels 1.2735-1.2755, then 1.2800-1.2820, 1.2940, 1.3000, and 1.3140.
No significant economic events related to the United Kingdom are anticipated for the upcoming week.
USD/JPY: Caution, More Caution, and Even More Caution
We mentioned in the previous overview that the dynamics of USD/JPY in the coming weeks would be almost entirely dependent on the dollar's performance. Additionally, its volatility would be influenced by the oversold condition of the yen: in mid-November, the pair reached a peak at 151.90, a level not seen since October 2022, and before that, 33 years ago in 1990. The result of the synergy between these two factors was observed last week. Following the Dollar Index (DXY), the pair initially dropped by 300 points, from 149.67 to 146.67, then rose in two waves to 148.51. On December 1, it responded with a significant red candle to the statement from the head of the Federal Reserve, finishing at 146.79.
The influence of the United States on the dynamics of USD/JPY is consistently evident. However, will the Bank of Japan (BoJ) impact the strength of its national currency? Hopes for this are diminishing. BoJ board member Toyoaki Nakamura made comments on Thursday, November 30, expressing his opinion on the possibility of transitioning from an ultra-easy monetary policy. He stated that tightening it prematurely is risky, and for now, it is necessary to patiently maintain the current course. As for the timing of when this can be done, according to the official, it is currently challenging to determine. 'We can change our policy when the Japanese economy sees sustainable growth in wages and inflation,' Nakamura explained. 'Now is the time to exercise caution in our policy.'
One might think, was the Bank of Japan not cautious before this? Judging by its monetary policy, BoJ can confidently contend for the title of the 'Most Cautious Central Bank in the World.'.
According to economists at the Singaporean United Overseas Bank (UOB), in the next 1-3 weeks, USD/JPY is likely to trade in a range between 146.65 and 149.30, then start declining. Regarding the median forecast, in the near term, only 20% of experts anticipate further strengthening of the dollar, while 60% are in favour of the yen, and 20% have refrained from making any predictions. As for trend indicators on D1, 85% favour the yen, recommending buying the pair in only 15% of cases. All oscillators are in the red, with 100%, and a quarter of them are in the oversold zone. The nearest support level is located in the 146.65 zone, followed by 145.90-146.10, 145.30, 144.45, 143.75-144.05, and 142.20. The closest resistance is at 147.25, then 147.65-147.85, 148.40, 149.20, 149.80-150.00, 150.80, 151.60, 151.90-152.15, 152.80-153.15, and 156.25.
Among the events in the upcoming week's calendar, it is worth noting Tuesday, December 5, when data on consumer inflation in the Tokyo region will be released, and Friday, December 8, when the GDP volume of Japan for Q3 2023 will be announced.
CRYPTOCURRENCIES: A Year Between a Bear Past and a Bull Future
December is upon us, making it a fitting time not only to review the week's outcomes but also to assess the entire passing year. Apparently, 2023 has the potential to serve as a transition between the bear 2022 and the bull 2023, supported by an impressive 11% growth in the leading cryptocurrency in November and a staggering 130% increase since the beginning of the year.
The share of potentially profitable bitcoins has reached 83.7% of the total supply, marking the highest level since November 2021. According to analysts at Bitfinex, the balance between short-term and long-term holders of digital gold is tilting in favour of the latter. The active supply of bitcoin has dropped to a five-year low, with only 30% of coins moving over the year. Consequently, approximately 70% of bitcoins, or an "unprecedented" 16.3 million BTC, remained stagnant throughout the year. Moreover, 60% of these coins have been motionless for two years. According to Bitfinex experts, these metrics indicate that the market is in a "relatively strong position" as coin holders are experiencing positive returns on their investments and are not rushing to liquidate assets in anticipation of even greater profits.
Positive sentiments have increased, especially among large investors (those with investments of $1 million or more). Over the first 11 months of 2023, they have increased their investments in crypto funds by 120%, bringing the total to $43.3 billion. Bitcoin remains the leader in this regard, with its volume growing to $32.3 billion, a 140% increase. Among altcoins, Solana has also attracted institutional interest. However, Ethereum had been showing negative dynamics for a while, although it has recently started to recover.
The rise in optimism in the market is attributed to: 1) the resolution of the issues between the U.S. authorities and the crypto exchange Binance, 2) the anticipation of the imminent launch of spot bitcoin ETFs, and 3) the upcoming bitcoin halving in April next year.
Regarding point 1, as a result of a settlement agreement between the U.S. authorities and Binance, bitcoin is now expected to exceed $40,000 by the end of the year, according to Matrixport. Various estimates suggested that Binance could face fines of up to $10 billion and might be accused of unauthorized appropriation of user funds or market manipulation. However, on November 21, an agreement was reached that Binance would pay a $4.3 billion fine, cease operations in the U.S., and its CEO, Changpeng Zhao, stepped down and posted a $175 million bail to remain free. This outcome is considered by Matrixport experts as a 'turning point in the crypto industry,' indicating that Binance will maintain its position among the largest crypto exchanges for at least the next two to three years.
In light of this news, bitcoin initially experienced a temporary correction but then bounced back from $36,000. This confirmed a strong trend, and according to Matrixport experts, a rise above $40,000 in December appears 'inevitable.' However, they assess the probability of this 'inevitable' outcome at 90%, acknowledging that unforeseen events could still impact the situation.
According to some experts, the "peaceful" withdrawal of Binance from the U.S. market should ease tensions and facilitate the approval by the Securities and Exchange Commission (SEC) of applications for the creation of exchange-traded funds (ETFs) for spot bitcoin. In November, the SEC held a series of meetings with applicants to allow them to edit their submissions in accordance with the regulator's requirements. The presence of this dialogue was viewed as a positive factor. It is not ruled out that by January 10, 2024, the Commission will approve a significant portion, if not all, of the applications for launching bitcoin ETFs. This date marks the deadline for approving the joint application from ARK Invest and 21Shares. If the regulator makes a negative decision, it risks getting involved in legal proceedings again. The SEC has already lost a legal battle with an investment giant like Grayscale, with the court deeming the SEC's actions "arbitrary and capricious." So, is it worth stepping on the same rake again and risking similar humiliations?
Trader, analyst, and founder of the venture company Eight, Michael Van De Poppe, expects the first bitcoin ETFs to be approved by the SEC in the next five to six weeks. Consequently, the price of BTC could rise in December as investors try to profit from the potential rally. The expert forecasts its growth to $48,000. However, after approval, according to Van De Poppe, BTC/USD could sharply decline. The lower target of this potential pullback is the 200-week exponential moving average (EMA) line, which is currently around $26,500. This downward trend may continue even after the upcoming halving, Van De Poppe believes. The analyst suspects that it is then that traders will actively accumulate coins, triggering the next bullish rally with a target ranging from $300,000 to $400,000.
The strategists at Standard Chartered believe that BTC could reach $50,000 by the end of this year and $120,000 by the end of 2024. The bank's initial forecast indicated a possible rise to $100,000 but was later increased. The price of $120,000 is three times higher than the current level. This optimism from Standard Chartered experts is linked to the increased profitability of mining when selling a smaller quantity of tokens to maintain the same cash flow volume, leading to price growth.
The Managing Partner and CEO of 10T Holdings, Dan Tapiero, is confident in the inevitable growth of the first cryptocurrency and believes that bitcoin is becoming an increasingly attractive means of savings. However, in his opinion, the next bullish trend will not occur in 2024 but in 2025. "And we will see bitcoin surpass $100,000," predicts Tapiero, adding that this is a rather conservative estimate. The businessman believes that negative interest rates on US Treasury bonds will be a special "mega-bull signal" for BTC.
(Note that the former CEO of the crypto exchange BitMEX, Arthur Hayes, intends to withdraw the funds he invested in US Treasury bonds and invest them in cryptocurrency in the near future, without waiting until 2025.)
We have repeatedly noted earlier that the leading cryptocurrency has "decoupled" from both stock indices and the dollar exchange rate, disrupting direct and inverse correlations. However, now analysts at the Santiment analytical company are observing an increase in the correlation between the crypto and stock markets. In November, bitcoin, Ethereum, and the S&P 500 index grew on average by 9.2%. The strengthening connection was recorded after bitcoin traded in a narrow price range in late October to early November, showing no significant fluctuations. "If bitcoin continues to grow, surpassing stocks," say the analysts at Santiment, "this will once again disrupt the correlation, which, according to historical data, is one of the factors for the formation of a bullish crypto market.
BTC/USD set a new high for 2023 on Friday, reaching $38,950, aided by the surge in risk assets, including cryptocurrencies, mentioned in this review by the Federal Reserve Chair Jerome Powell in his speech. As of the evening of December 1, BTC/USD is trading around $38,765. The overall market capitalization of the crypto market is $1.45 trillion ($1.44 trillion a week ago). The Crypto Fear and Greed Index rose from 66 to 71 points and still remains in the Greed zone.
So, December has arrived, and many members of the crypto community are once again talking about the "Bitcoin Santa Rally." This phenomenon mirrors the historical "Santa Claus Rally" in the stock market when stocks rise between Thanksgiving and Christmas. On the crypto market, a similar rally first occurred at the end of November 2013 when the price of BTC was less than $1,000. Throughout December, the price of bitcoin steadily rose, reaching a peak of $1,147 by December 23. The next significant surge happened four years later during the holiday season of 2017. Bitcoin embarked on a steep upward trajectory, surpassing $19,000 by mid-December and touching $20,000 for the first time. However, in 2021, Santa Claus didn't bring joy to traders; the result was the opposite. On November 10, the asset reached an all-time high, approaching $69,000, but in December, the price was influenced by volatility and low trading volumes during the holiday days. By the end of the year, bitcoin was trading in the $46,000 range.
Naturally, this year, members of the crypto community are hoping for a convincing rise in digital gold. It remains to be seen whether Santa Claus will fulfil these hopes.
Market Upturn as Inflation Cools; Stocks Climb, Euro and Dollar Falter
Financial markets were dominated by themes of cooling inflation, a slowing economy, and increasing expectations of policy easing by both ECB and Fed last week. This convergence of factors ignited a full risk-on mode among investors, propelling major US stock indexes and Germany's DAX to sharp gains. In tandem, benchmark treasury yields in both Europe and US experienced significant declines. Consequently, Euro and Dollar emerged as the week's worst performers, largely overwhelmed by these market movements.
Looking ahead, this risk-on sentiment is expected to persist, likely keeping Dollar under pressure generally, with the notable exception of its pairing with Euro. Technical developments in various Euro crosses suggest that the selling pressure on the Euro would persist for some time.
Conversely, New Zealand Dollar stood out as the strongest currency, largely due to the RBNZ's unexpectedly hawkish stance on interest rates. RBNZ's new economic projections hinted at the possibility of further rate hike next year. Additionally, Deputy Governor Christian Hawkesby highlighted the unforeseen impact of record net migration on boosting demand and inflating prices.
Other currencies displayed mixed performance. Yen ranked as the second strongest, buoyed by expectations of BoJ's exit from negative interest rates next year. However, Yen's gains were primarily against Dollar and Euro, failing to break through prior week's highs against others. Swiss Franc ranked third in strength, largely driven by buying against Euro.
On the other hand, Sterling was was comparatively weaker, and Canadian Dollar showed mixed performance despite strong job data. Australian Dollar also lacked clear direction, a lower-than-expected monthly CPI reading lessened the need of further interest rate hikes by RBA next year.
A trio of factors leads investors to embrace strong risk-on sentiment
Strong risk-on sentiment prevailed among investors in the US markets last week, fueling significant gains across major stock indices and treasuries. DOW surged to a new 2023 high, marking its fifth consecutive week of gains and bringing its total increase for the year to nearly 9.4%. Similarly, S&P 500 index closed at its highest level since March 2022, further underlining the bullish trend in the equity markets. NASDAQ Composite, while showing gains, lagged behind the other indices and remained capped below its July high. In the bond market, 10-year Treasury yield dropped significantly, breaking through an important support level around 4.33% to reach its lowest point since September.
This positive market development was fueled by a combination of factors related to inflation trends, Fed expectations, and the overall pace of economic cooling.
Inflation Trends: October's inflation data showed slowing in both the headline and core PCE price index, aligning with investor expectations. This easing of inflationary pressures is a welcome sign for the markets, as it affirms that the aggressive price increases experienced over the past year continues to abate.
Fed Policy Shift: The market is increasingly anticipating a shift in Fed's monetary policy. Fed fund futures market now indicates over 90% probability of a full percentage point rate cut in 2024. This expectation of a more dovish stance from Fed, moving from tightening to loosening policy, is buoying investor sentiment.
Goldilocks Cooling: The gradual cooling of the US economy, perceived as neither too rapid nor too slow, is being welcomed by the markets. This "Goldilocks" cooling phase is seen as ideal for mitigating inflation without triggering a significant economic downturn, creating a favorable environment for investment.
Meanwhile, some market participants interpreted Fed Chair Jerome Powell's comments last Friday as veering towards a dovish stance, Powell was actually quite balanced. He emphasized the premature nature of concluding that current monetary policy is "sufficiently restrictive" or speculating about policy easing. He also stated Fed's preparedness to tighten policy further if needed. However, markets seemed to focus more on Powell's acknowledgment that the risks of under- and over-tightening are becoming more balanced and the Fed's intention to proceed carefully. Stocks managed to extend gains and closed on a high note after Fed anyway.
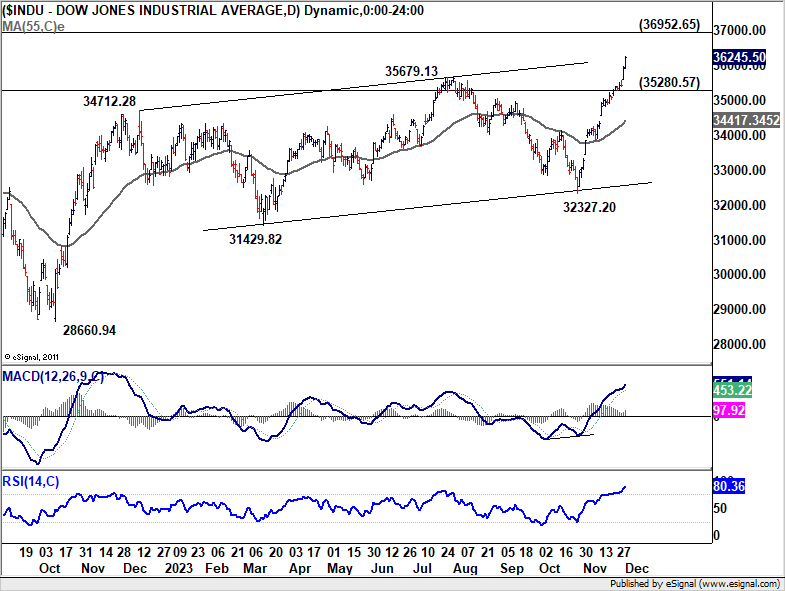
Technically, DOW powered through 35679.13 resistance to resume whole rise from 28660.94 last week. Near term outlook will stay bullish as long as last week's low at 25280.57 holds. Next target is 36952.65 high.
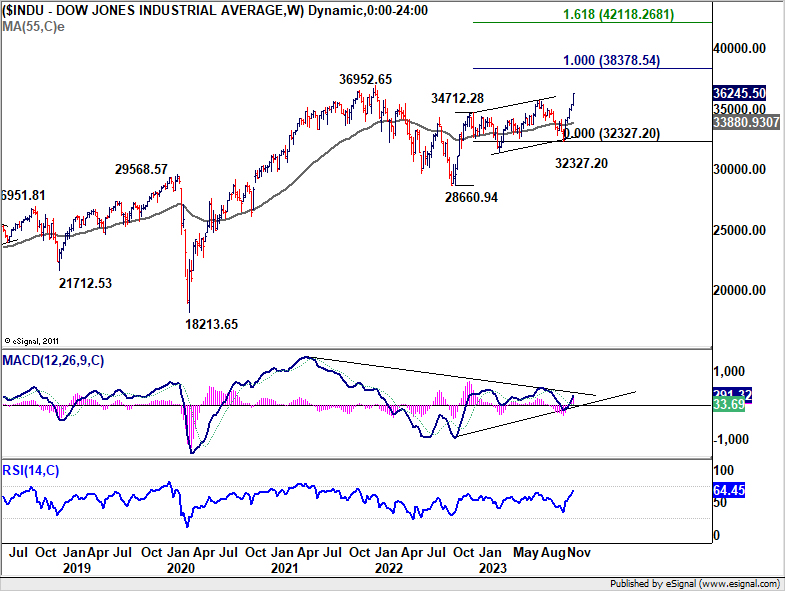
In the bigger picture, there are still various interpretations on the price actions from 28660.94. The most bullish one is that it's already resuming long term up trend. More importantly, price actions from 34712.28 to 32327.20 are a three wave consolidation pattern that's skewed upwards.
In this bullish case, 100% projection of 28660.94 to 34712.28 from 32327.20 at 38378.54 is a minium target, with prospect of even shooting through 40k handle.
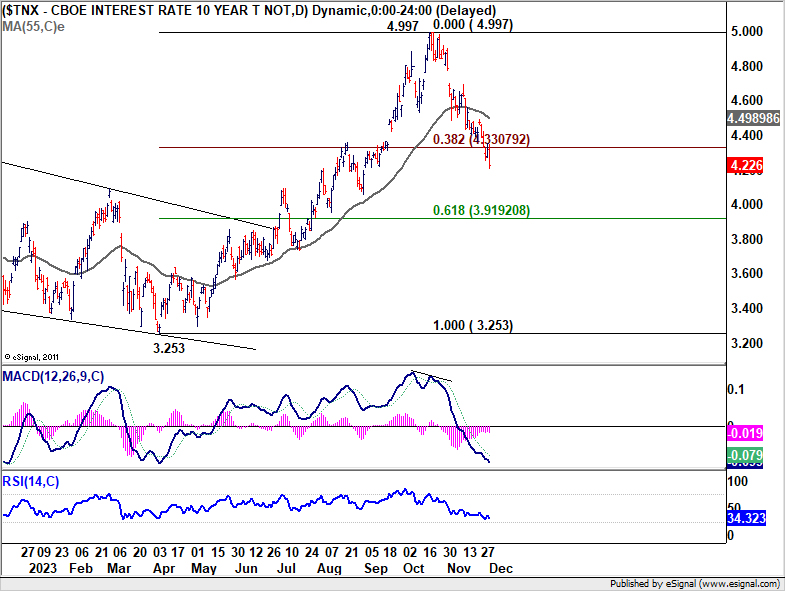
10-year yield extended the decline from 4.997 to close at 4.226, breaking through 38.2% retracement of 3.253 to 4.997 at 4.330. Near term outlook will stay bearish as long as 55 D EMA (now at 4.498) holds. Next target is 61.8% retracement at 3.919. As 55 W EMA is in proximity (now at 3.942), there could be some notable support between 3.9 and 4.0 psychological to contain downside on first attempt.
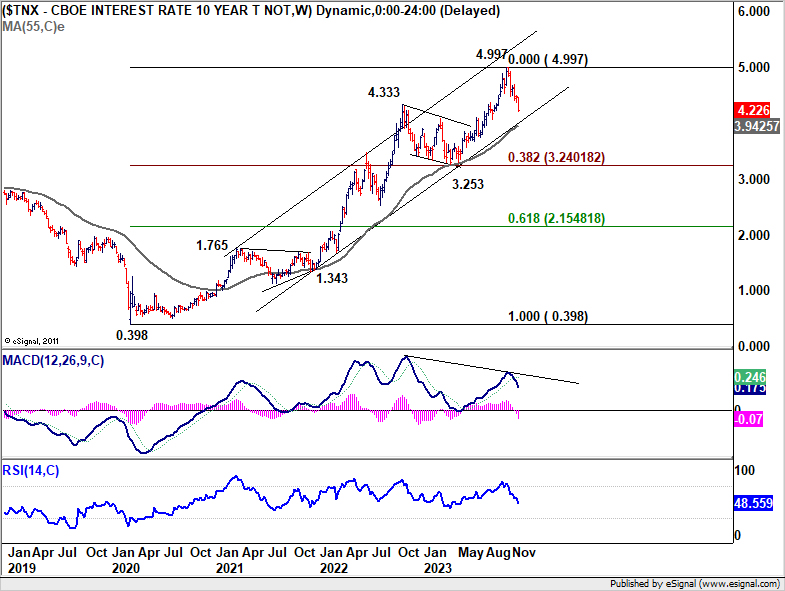
One important perspective is that 10-year yield has possibly completed a five-wave impulsive rally from 0.398 (2020 low already), on bearish divergence condition in W MACD. If that's the case, it's now in a medium correction to this up trend, and fall from 4.997 could eventually extend to 3.253 cluster support (38.2.% retracement of 0.398 to 4.997 at 3.240. With this in mind, TNX breaking through 4% in the medium term is indeed not a fantasy.
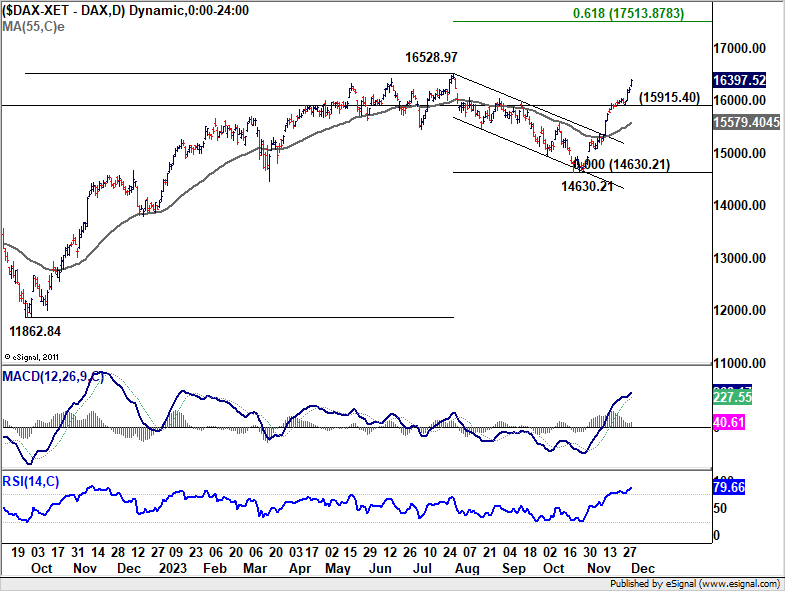
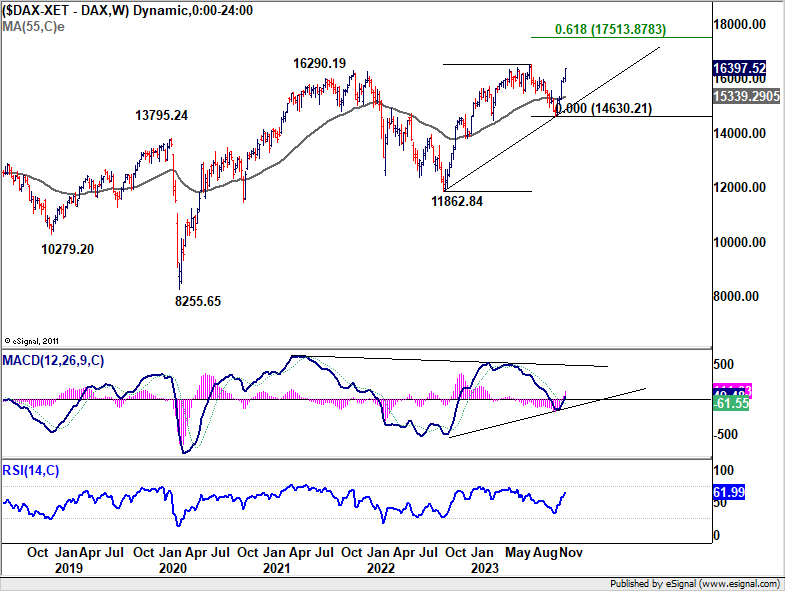
DAX eyes historical high on inflation slowdown and prospects of ECB rate cuts
In the Eurozone, investors have positively responded to faster-than-expected slowdown in inflation, leading to increased speculation about rate cuts by ECB. November a significant decline in Eurozone CPI, decreasing from 2.9% to 2.4%, bringing it closer to ECB's symmetric 2% target. Core CPI also showed notable progress, reducing from 4.2% to 3.6%. This trend aligns with the broader economic context, as Eurozone is experiencing a more severe economic slowdown compared to the US.
Despite this trend, ECB President Christine Lagarde has cautioned against premature celebration in the fight against inflation. She emphasized that it is "not the time to start declaring victory" and maintained a cautious stance. Echoing her sentiment, some ECB officials have also expressed that discussions about rate cuts are premature. Nevertheless, the market sentiment is increasingly leaning towards the possibility of ECB rate cuts, with some economists advancing their expectations for the first rate cut from the third to the second quarter of next year.
Investors in Germany cheered the development, even though stocks in France lagged behind. DAX accelerated higher to close at 16397.52 last week, within striking distance to 16528.97 historical high. For now, near term outlook will stay bullish as long as 15915.40 support holds. Decisive break of 16528.97 will pave the way to 61.8% projection of 11862.84 to 16528.97 from 14630.21 at 17513.87.
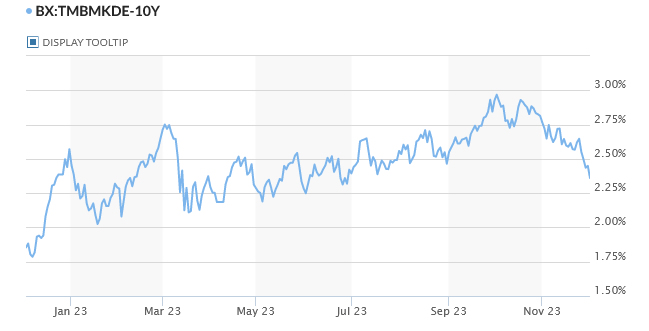
Concurrently, yield on 10-year German bund continued its down trend, closing at its lowest level since June at 2.360.
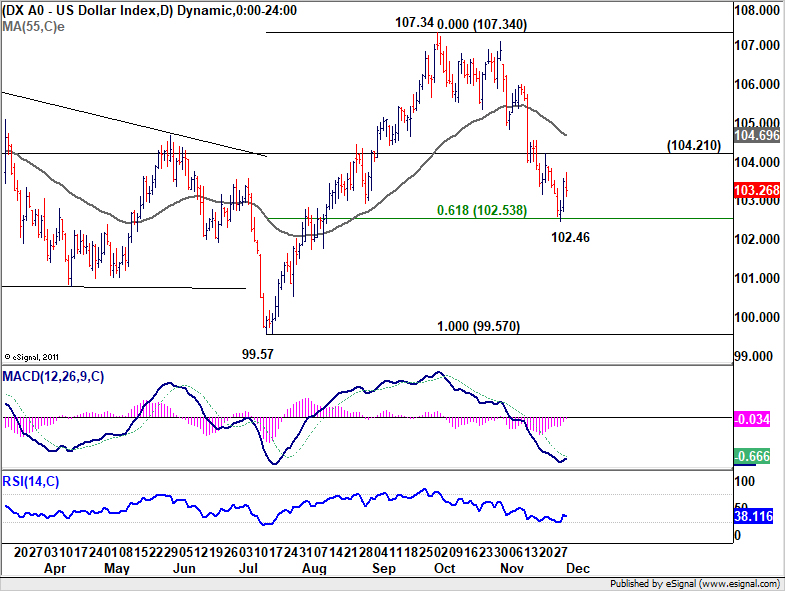
Dollar index bounces on Euro weakness, but capped below near term resistance
The net results of the above mentioned development is that Euro and Dollar ended as the worst, and second worst performers of the week, respectively. Hence, bounce seen in Dollar index was largely attributed to the weakness in Euro rather than inherent strength in the Dollar.
From a technical analysis standpoint, 61.8% retracement of 99.57 to 107.34 at 102.53 is an ideal level to provide support for DXY to form a short term bottom. However, a key condition for confirming this bottoming pattern is a break above 104.21 resistance. In this case, stronger rebound would be seen back to 55 D EMA (now at 104.69) and above.
For such a rebound to materialize, two key market movements would be necessary: Deeper selloff in EUR/USD and, ideally, a sustainable bounce in USD/JPY too. These movements would collectively support a bullish scenario for the Dollar Index.
Conversely, a firm break below the last week's low of 102.46, coupled with sustained trading below 102.53, would indicate continuation of the decline from 107.34 high. In this bearish scenario, DXY could extend its fall to retest 99.57 low.
Bearish developments in EUR/CHF, EUR/GBP and EUR/AUD
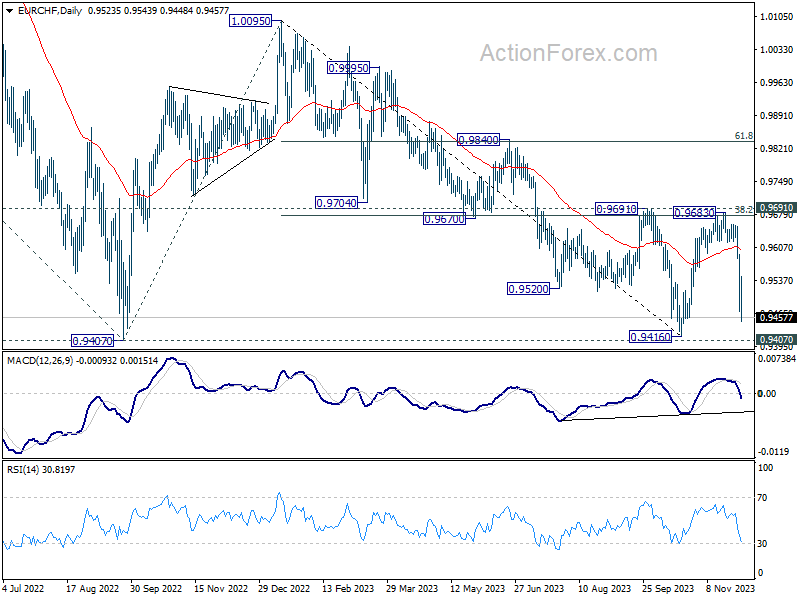
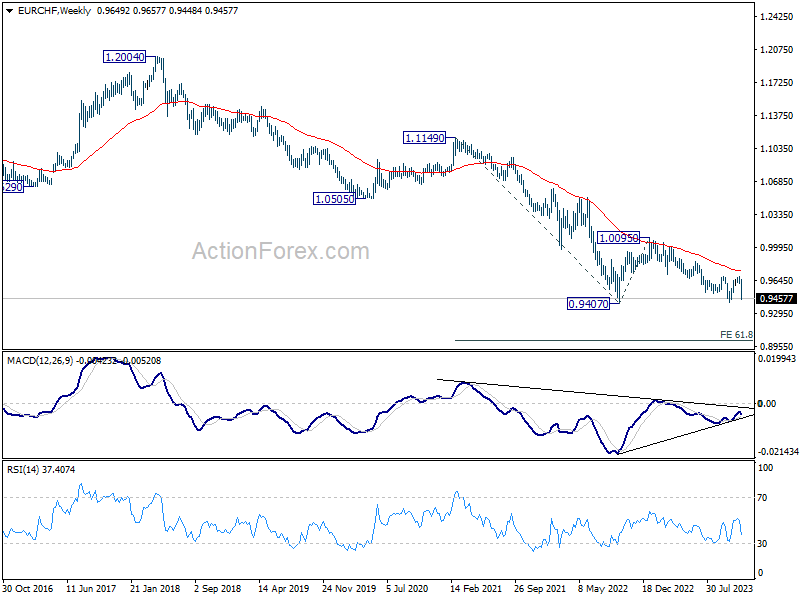
Some important technical developments in Euro are worth noting. EUR/CHF's steep decline should confirm rejection by 0.9691 cluster resistance (38.2% retracement of 1.0095 to 0.9416 at 0.9675). The fall from 1.0095 (2023 high) is still in progress. Based on the current strong momentum, EUR/CHF is possibly resuming the long term down trend too.
Retest of 0.9407 (2022 low) should be seen soon. Decisive break there will confirm the bearish case, and pave the way to 61.8% projection of 1.1149 to 0.9407 from 1.0095 at 0.9018, which is close to 0.9 psychological level.
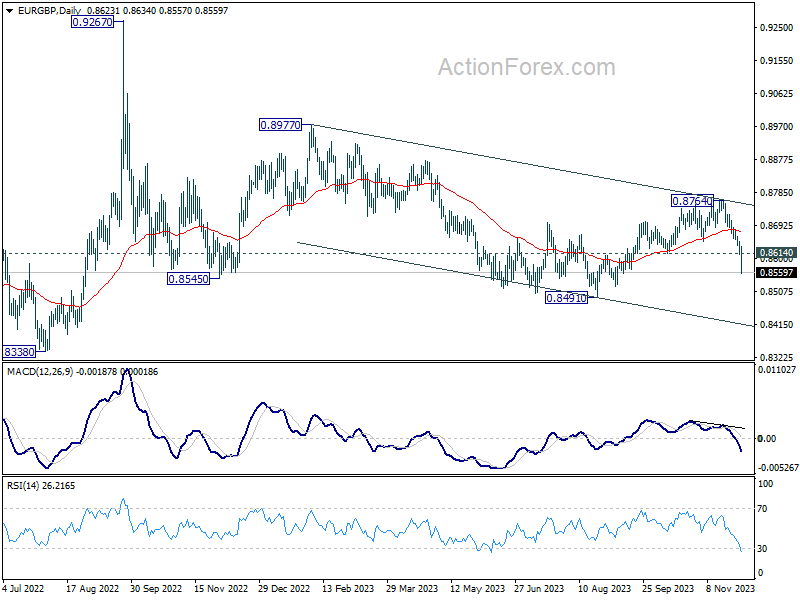
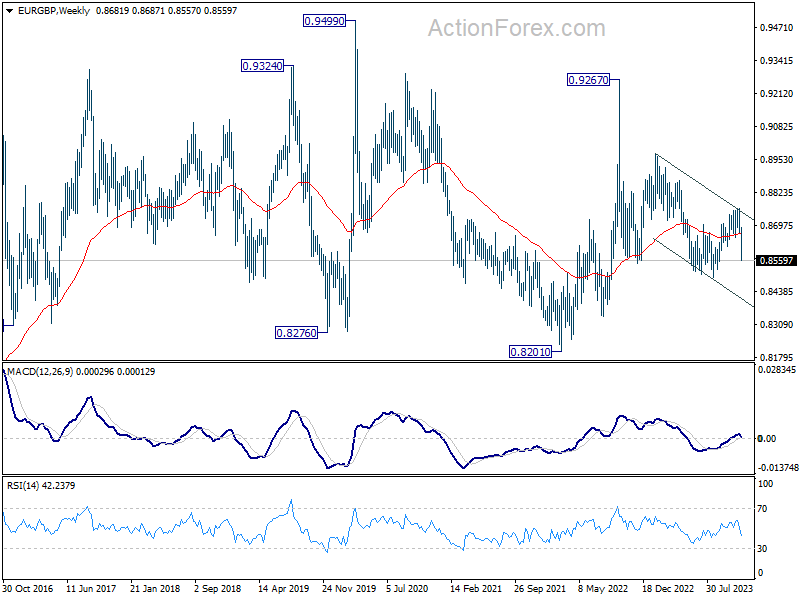
EUR/GBP's sharp fall also suggests that rebound from 0.8491 has completed as a corrective move to 0.8764. Down trend from 0.9267 is likely still in progress. Retest of 0.8491 support should be seen next. Decisive break there will confirm this bearish case and target medium term channel support at around 0.8413.
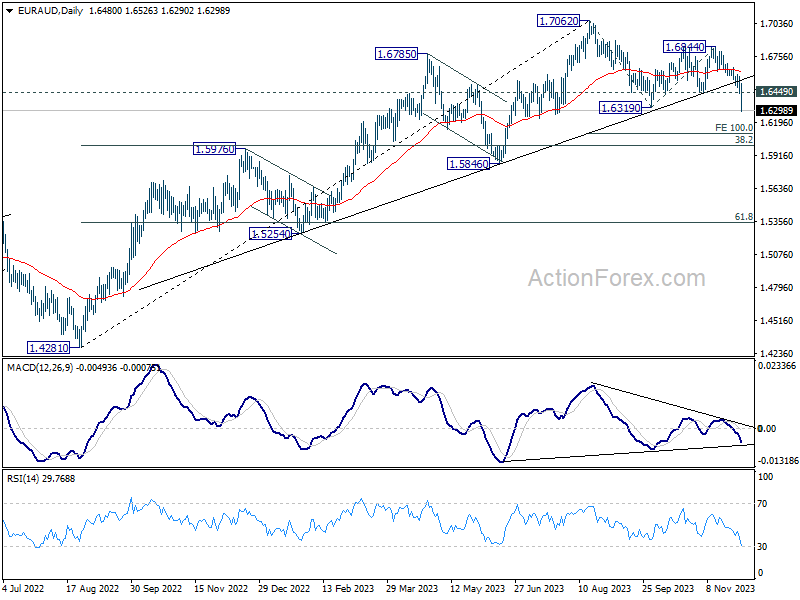
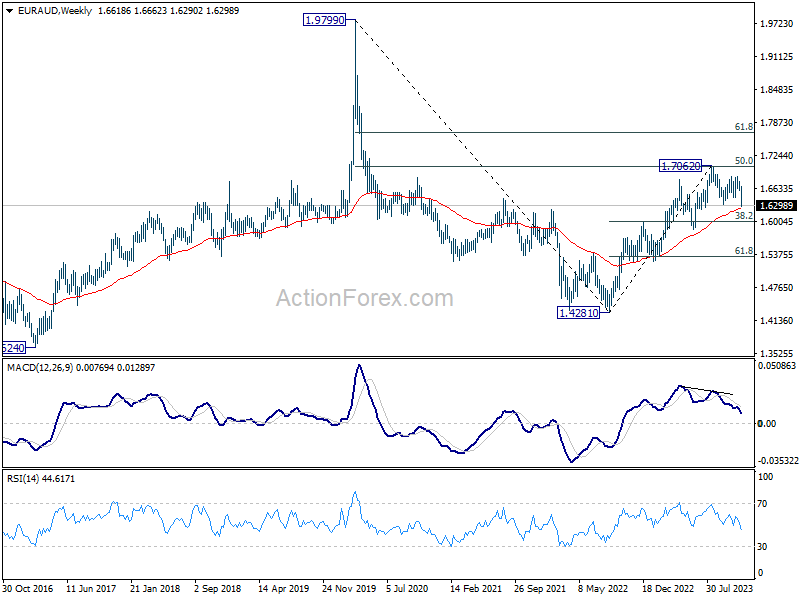
EUR/AUD's strong break of the medium term trend line support argues that's fall from 1.7062 is already correcting the whole up trend from 1.4281 (2022 low). Deeper fall should be seen to 38.2% retracement of 1.4281 to 1.7062 at 1.6000 in the near term. Strong support could be seen there to bring rebound. But firm break of this fibonacci level would pave the way to 61.8% retracement at 1.5343.
EUR/USD Weekly Outlook
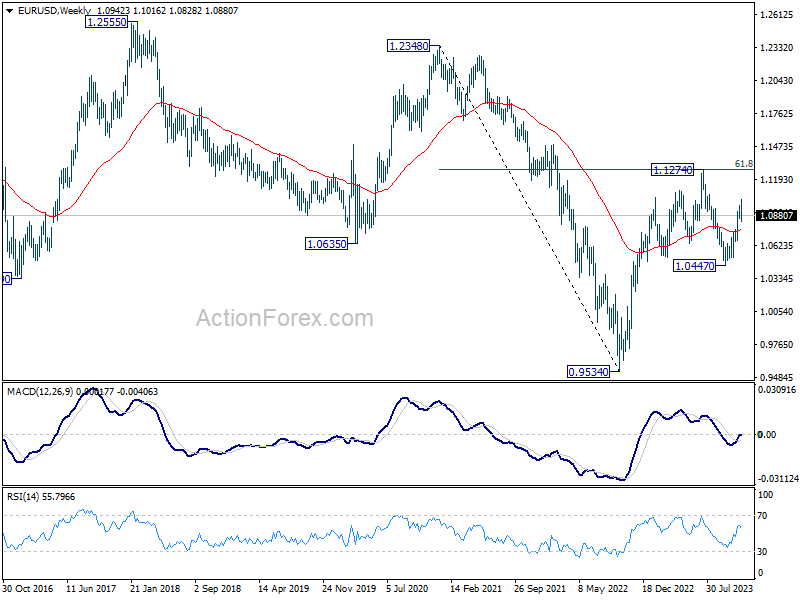
EUR/USD reversed after edging higher to 1.1016. With breach of 1.0851 support, a short term top should be in place on bearish divergence condition in 4H MACD. Initial bias is mildly on the downside this week for 55 D EMA (now at 1.0766). On the upside, however, break of 1.1016 will resume the rise from 1.0447 to retest 1.1274 high instead.
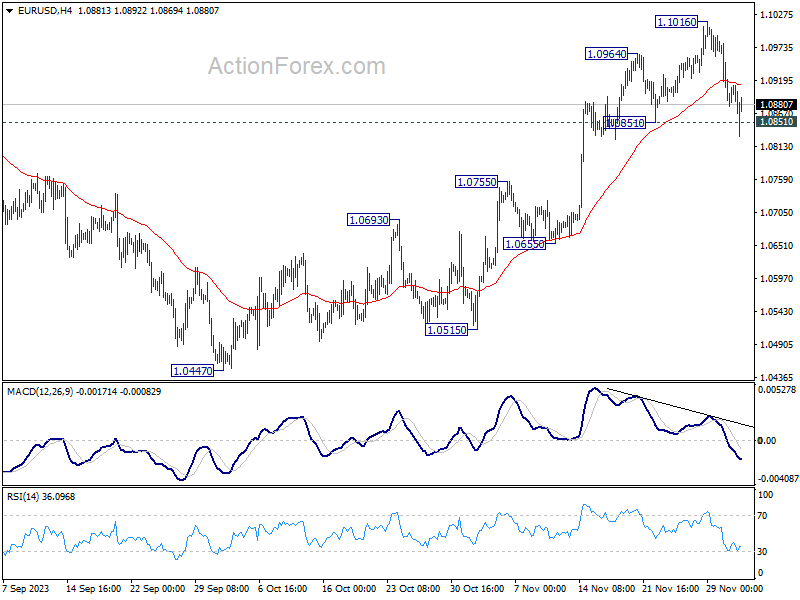
In the bigger picture, price actions from 1.1274 are viewed as a corrective pattern to rise from 0.9534 (2022 low). Rise from 1.0447 is tentatively seen as the second leg. Hence while further rally could be seen, upside should be limited by 1.1274 to bring the third leg of the pattern. Meanwhile, sustained break of 55 D EMA will argue that the third leg has already started for 1.0447 and below.
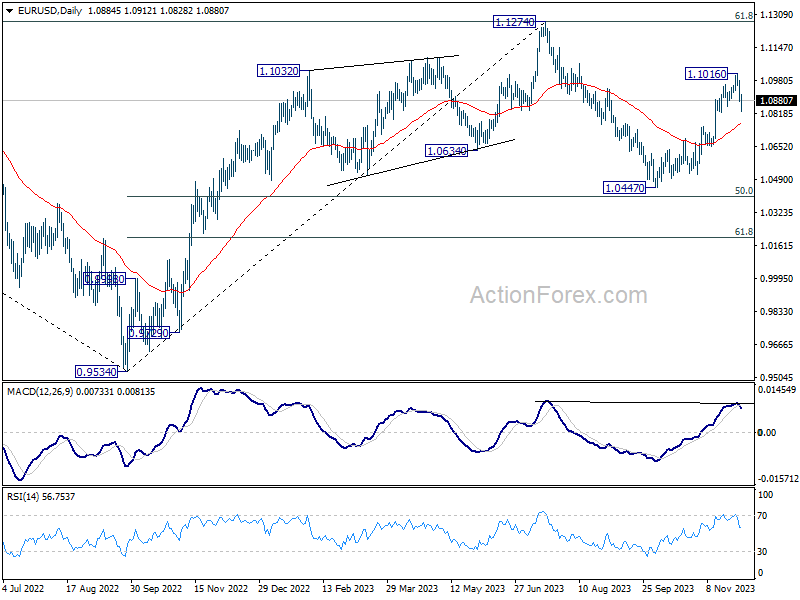
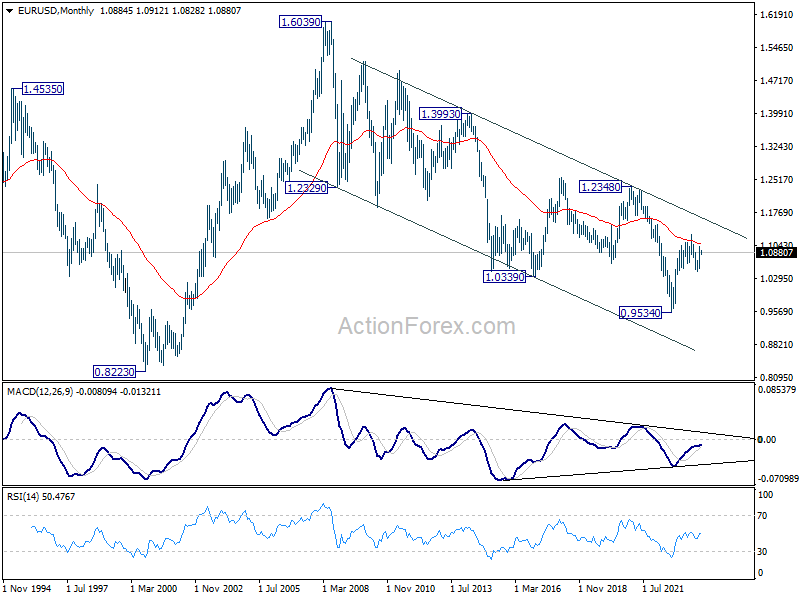
In the long term picture, a long term bottom is in place at 0.9534 on bullish convergence condition in M MACD. It's still early to call for bullish trend reversal with the pair staying inside falling channel. Nevertheless, sustained trading above 55 M EMA (now at 1.1081) and break of 1.1274 resistance will raise the chance of reversal and target 1.2348 resistance for confirmation.
EUR/USD Weekly Outlook
EUR/USD reversed after edging higher to 1.1016. With breach of 1.0851 support, a short term top should be in place on bearish divergence condition in 4H MACD. Initial bias is mildly on the downside this week for 55 D EMA (now at 1.0766). On the upside, however, break of 1.1016 will resume the rise from 1.0447 to retest 1.1274 high instead.
In the bigger picture, price actions from 1.1274 are viewed as a corrective pattern to rise from 0.9534 (2022 low). Rise from 1.0447 is tentatively seen as the second leg. Hence while further rally could be seen, upside should be limited by 1.1274 to bring the third leg of the pattern. Meanwhile, sustained break of 55 D EMA will argue that the third leg has already started for 1.0447 and below.
In the long term picture, a long term bottom is in place at 0.9534 on bullish convergence condition in M MACD. It's still early to call for bullish trend reversal with the pair staying inside falling channel. Nevertheless, sustained trading above 55 M EMA (now at 1.1081) and break of 1.1274 resistance will raise the chance of reversal and target 1.2348 resistance for confirmation.
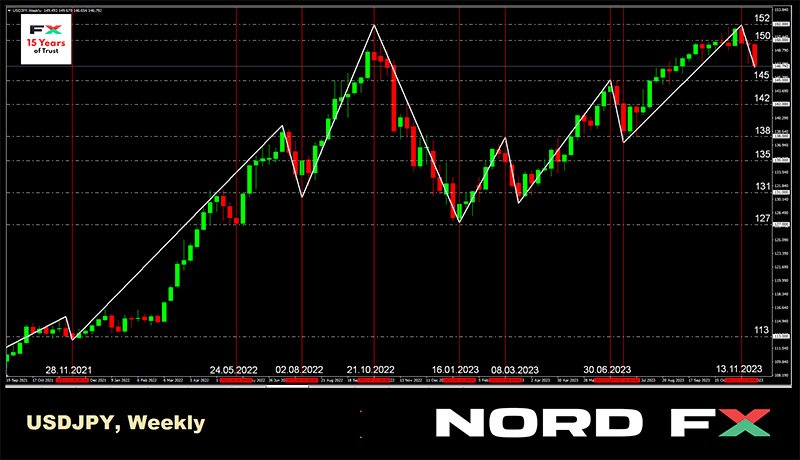
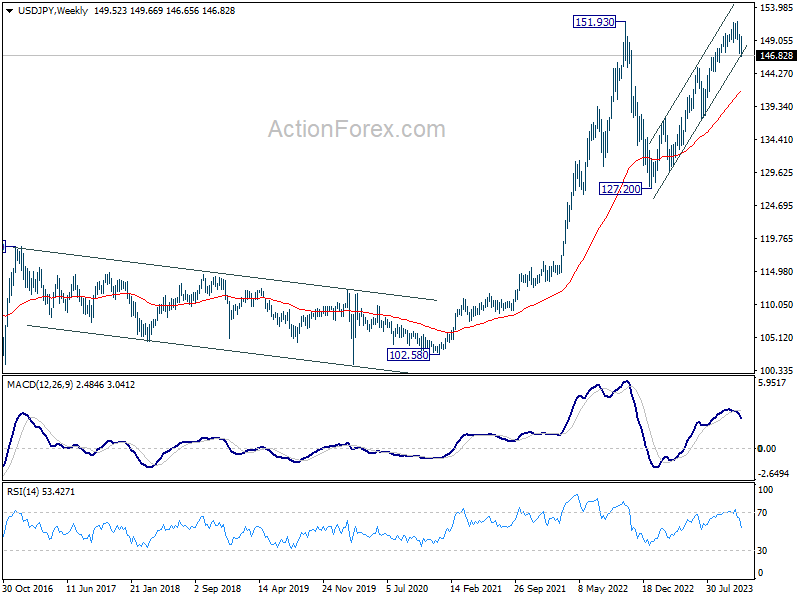
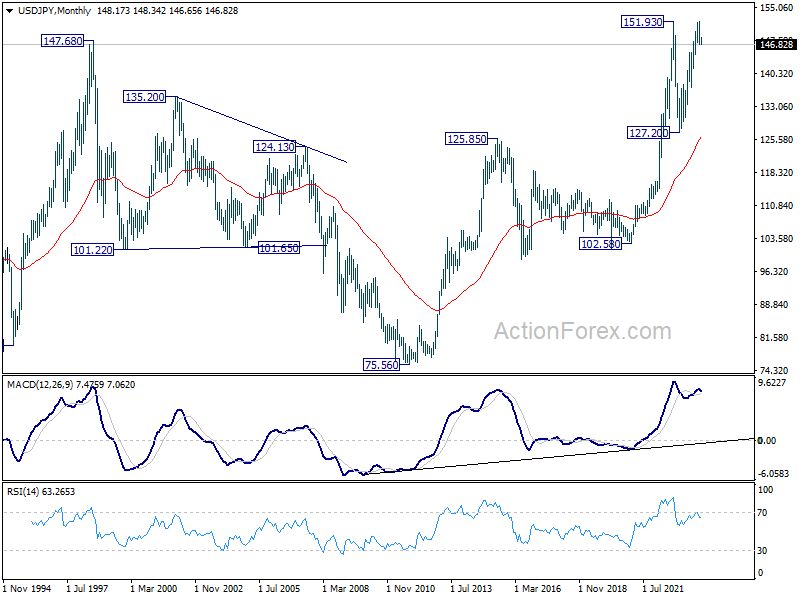
USD/JPY Weekly Outlook
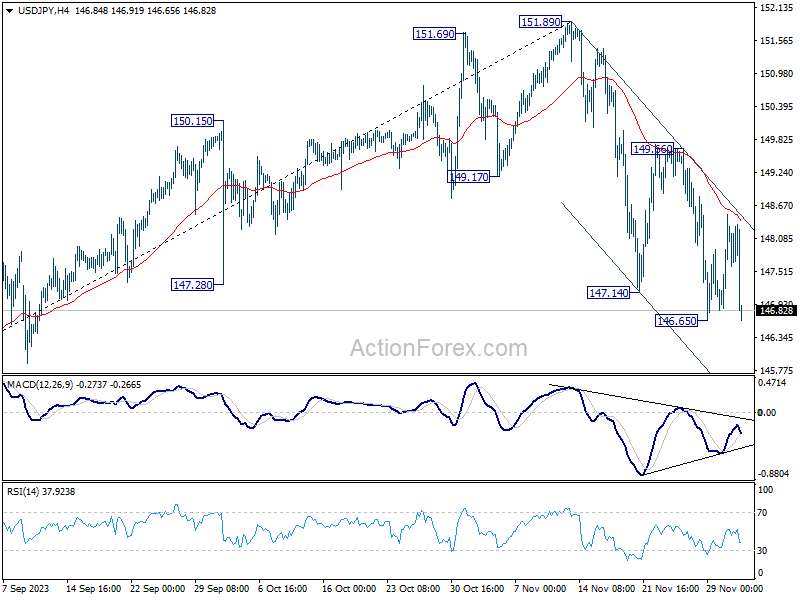
USD/JPY's fall from 151.89 resumed last week and edged lower to 146.65, but recovered again. Initial bias stays neutral this week first. Further fall is in favor with upside capped by 55 4H EMA (now at 148.38). Break of 146.65 will target 145.06 key support level.
In the bigger picture, rise from 127.20 (2023 low) is seen as the second leg of the pattern from 151.93 (2022 high). Decisive break of 145.06 resistance turned support will confirm that this second leg has completed, after rejection by 151.93. Deeper fall would be seen through 38.2% retracement of 127.20 to 151.89 at 142.45 to 61.8% retracement at 136.63. Nevertheless strong bounce from 145.06 will retain medium term bullishness for another test on 151.93 at a later stage.
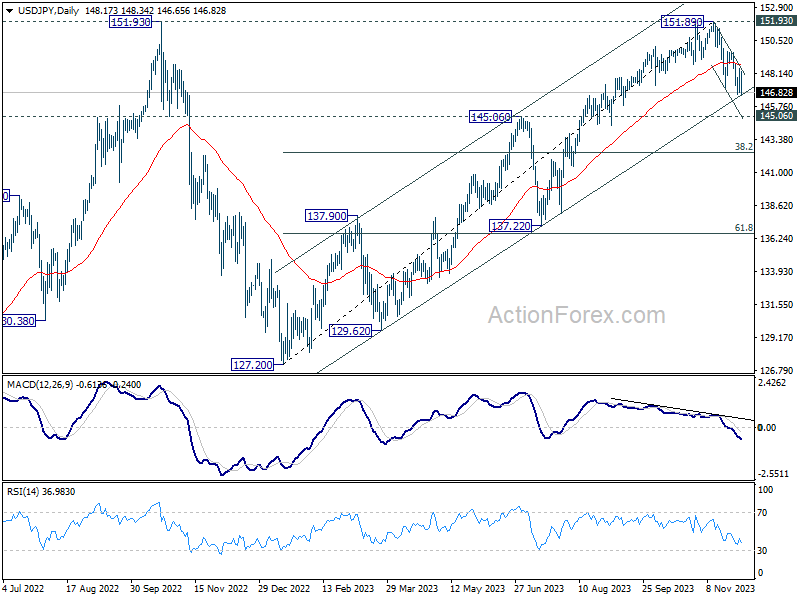
In the long term picture, up trend from 75.56 (2011 low) is still in progress and break of 151.93 is still in favor at a later stage. This will remain the favored case as long as 127.20 support holds.
GBP/USD Weekly Outlook
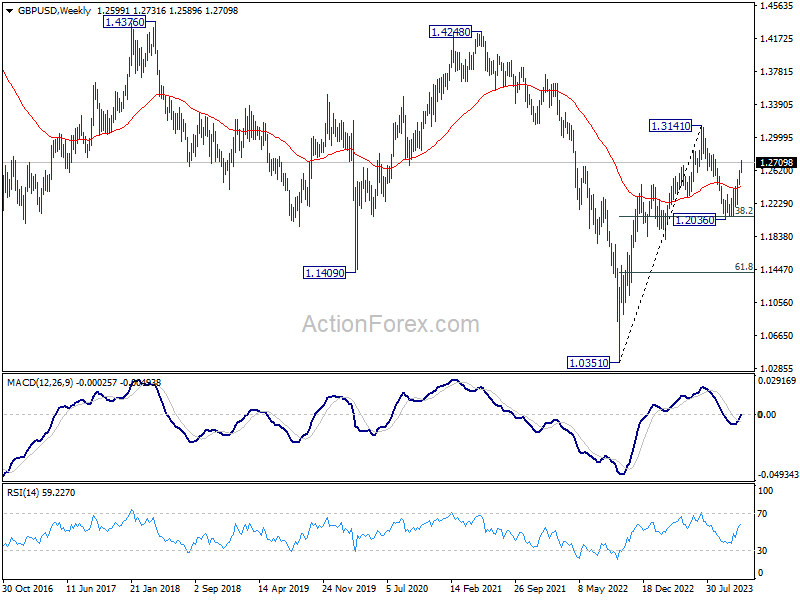
GBP/USD's rise from 1.2036 continued to 1.2731 last week but retreated after hitting 61.8% retracement of 1.3141 to 1.2036 at 1.2716. Initial bias stays neutral this week first. Some more consolidations could be seen but further rise is expected as long as 1.2590 minor support holds. On the upside, decisive break of 1.2731 will resume the rally for retesting 1.3141 high next.
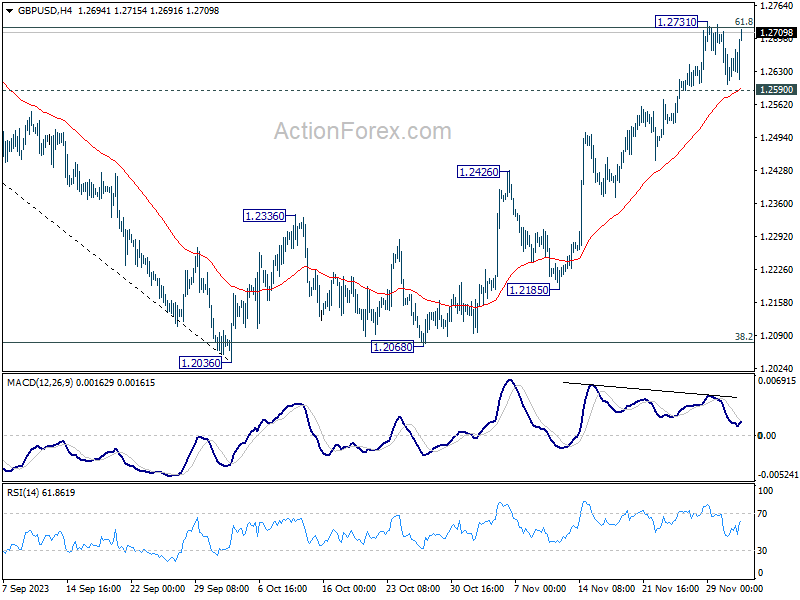
In the bigger picture, price actions from 1.3141 are seen as a corrective pattern to rise from 1.0351 (2022 low). Strong rebound from 38.2% retracement of 1.0351 (2022 low) to 1.3141 at 1.2075 suggests that current rise from 1.2036 is already the second leg. However, while further rally could be seen, upside should be limited by 1.3141 to bring the third leg of the pattern.
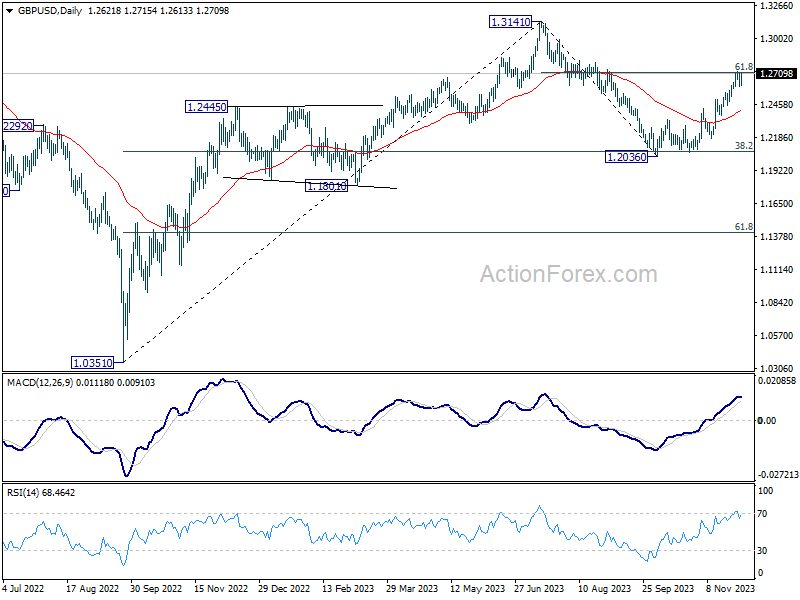
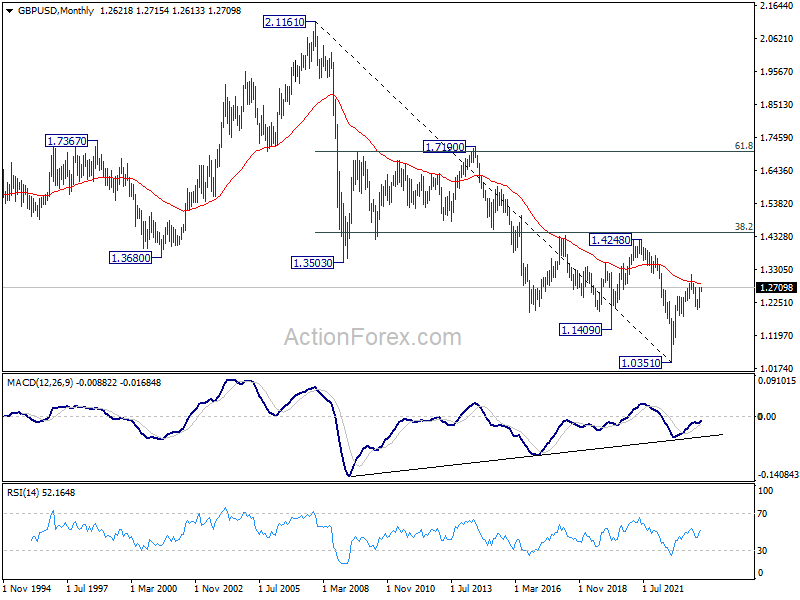
In the long term picture, a long term bottom should be in place at 1.0351 on bullish convergence condition in M MACD. But momentum of the rebound from 1.3051 argues GBP/USD is merely in consolidation, rather than trend reversal. Range trading is likely between 1.0351/4248 for some more time.
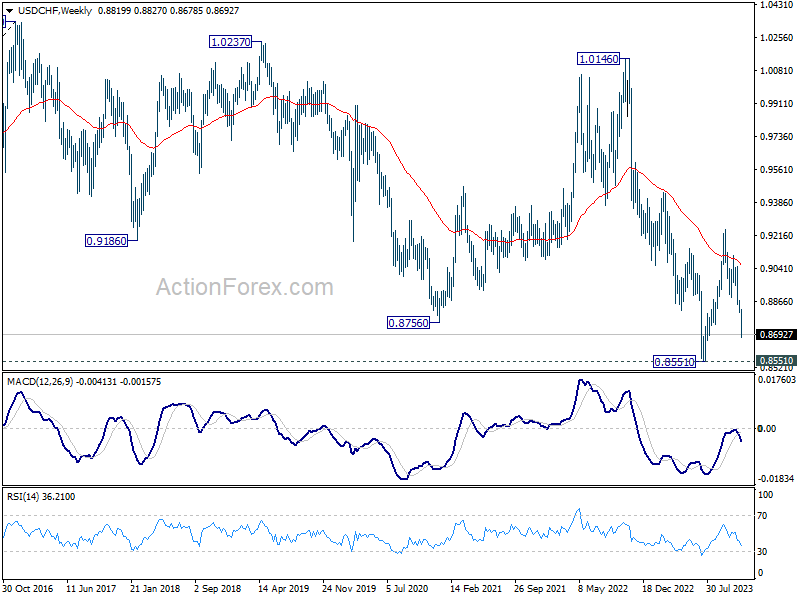
USD/CHF Weekly Outlook
USD/CHF's fall from 0.9243 continued to as low as 0.8675 last week, and there is no clear sign of bottoming yet. Initial bias remains on the downside this week for 161.8% projection of 0.9243 to 0.8886 from 0.9111 at 0.8533, which is close to 0.8551 low. Considering bullish convergence condition in 4H MACD, strong support could be seen there to bring rebound. Meanwhile, break of 0.8769 minor resistance should indicate short term bottoming, and turn bias back to the upside for stronger recovery.
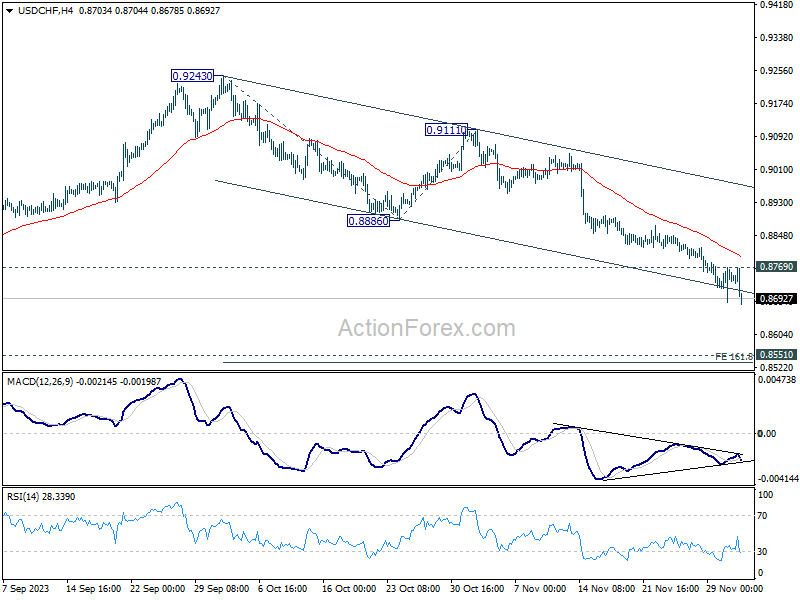
In the bigger picture, price actions from 0.8551 are currently seen as part of a corrective pattern to the decline from 1.0146 (2022 high). Fall from 0.9243 is seen as the second leg for now. Deeper decline could be seen to 0.8551 low but strong support should be seen there to bring rebound. For now, this will remain the favored case as long as 0.8886 support turned resistance holds.
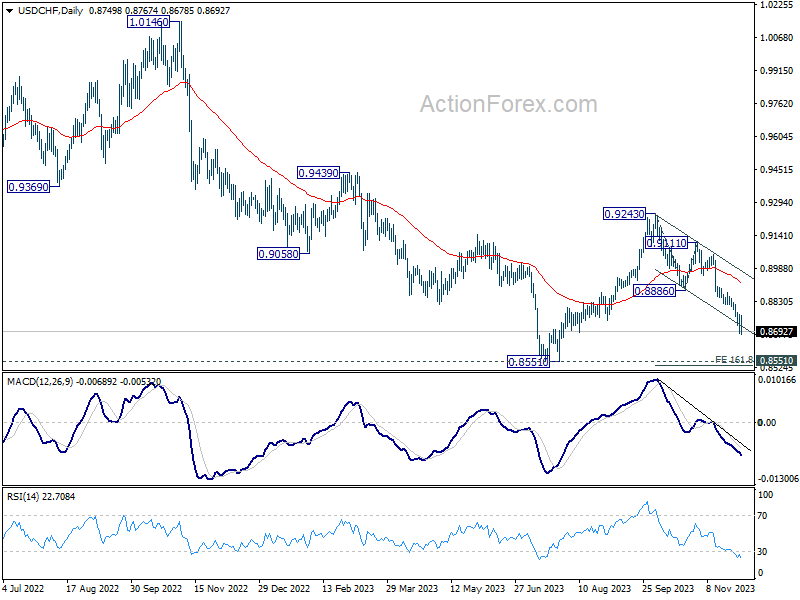
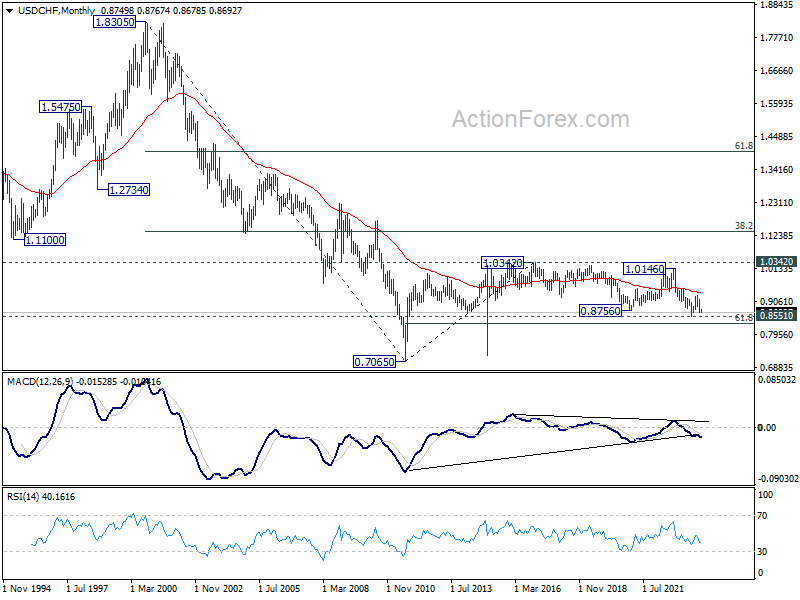
In the long term picture, there is no clear sign that down trend from 1.8305 (2000 high) has completed. With 38.2% retracement of 1.8305 to 0.7065 at 1.1359 intact, outlook is neutral at best.
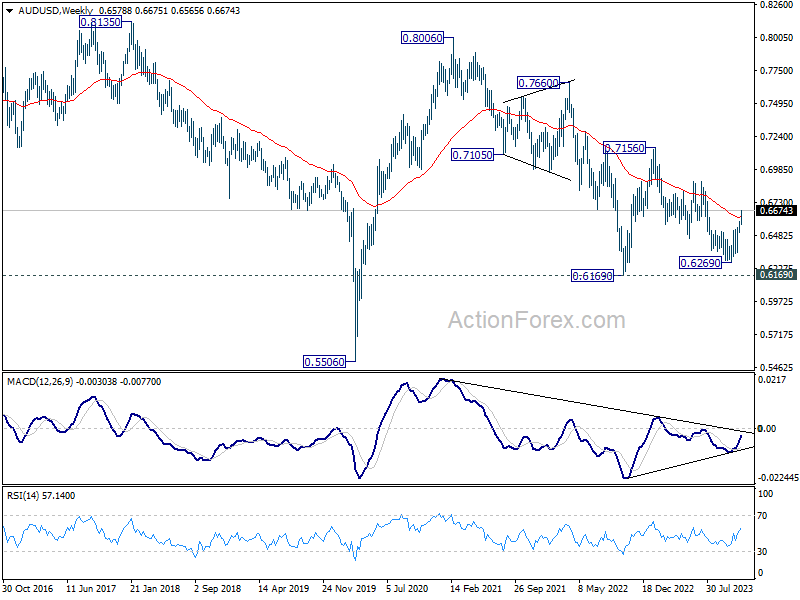
AUD/USD Weekly Report
AUD/USD's rebound from 0.6269 continued last week, and late breach of 0.6674 temporary top suggests that it's resuming after brief retreat. Initial bias is back on the upside this week. Sustained break break of channel resistance (now at 0.6661) will argue that whole decline from 0.7156 has completed with three waves down to 0.6269. Further rally should then be seen to 0.6894 resistance for confirmation. However, break of 0.6570 support will indicate rejection by the channel and turn bias back to the downside.
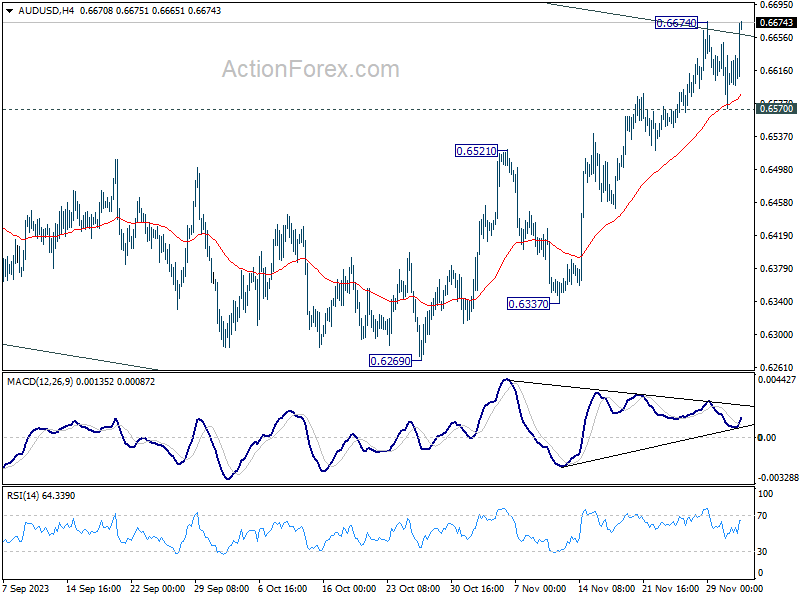
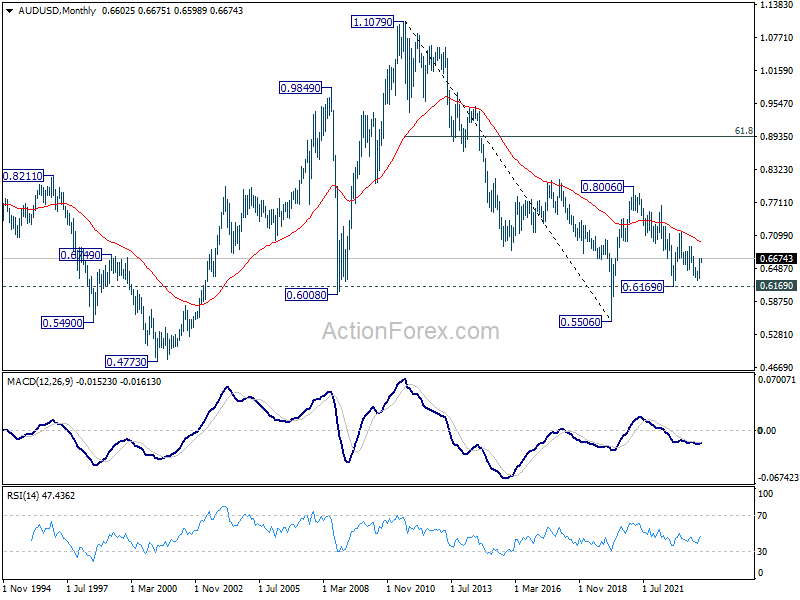
In the bigger picture, there is no confirmation that down trend from 0.8006 (2021 high) has completed. price actions from 0.6169 (2022 low) could be just a medium term corrective pattern, with rise from 0.6269 as the third leg. For now, range trading should be seen between 0.6169 and 0.7156 (2023 high), until further developments.
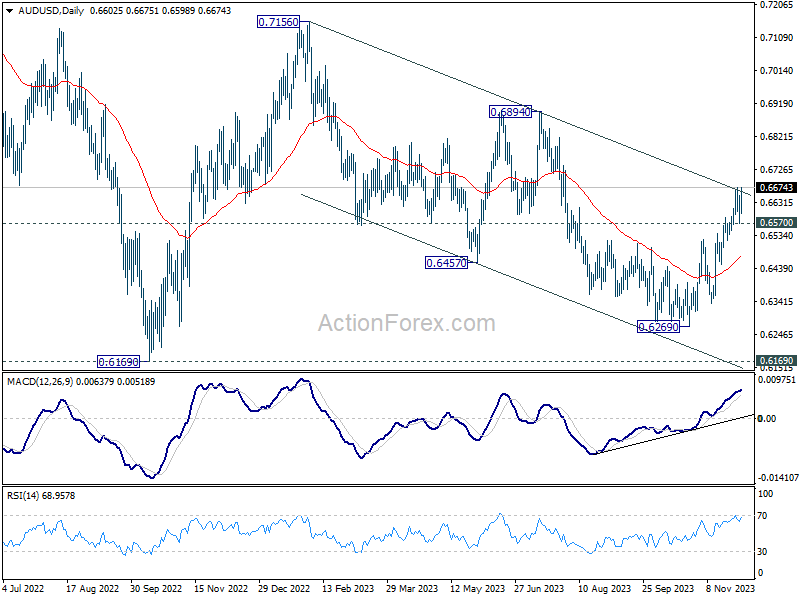
In the long term picture, the down trend from 1.1079 (2011 high) should have completed at 0.5506(2020 low) already. It's unsure yet whether price actions from 0.5506 are developing into a corrective pattern, or trend reversal. But in either case, fall from 0.8006 is seen the second leg of the pattern. Hence, in case of deeper decline, downside strong support should emerge above 0.5506 to bring reversal.
USD/CAD Weekly Outlook
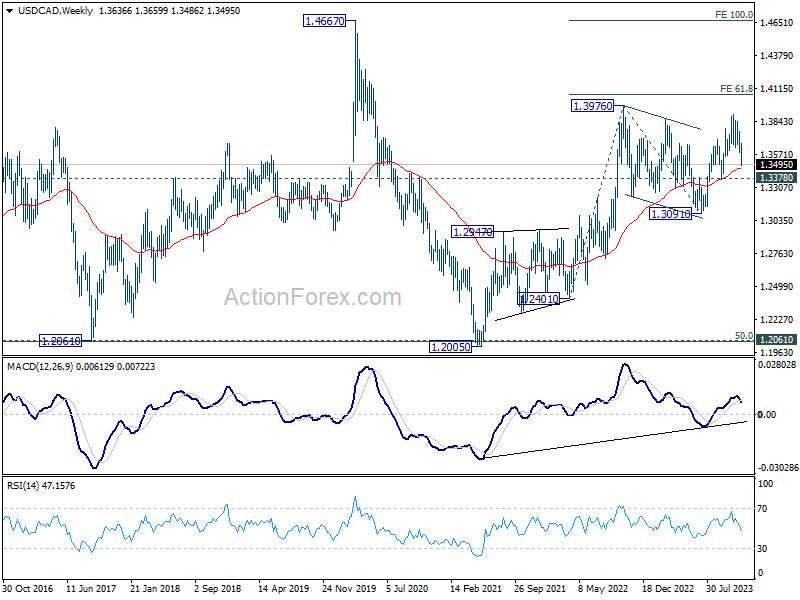
USD/CAD's decline from 1.3897 extend to as low as 1.3486 last week and there is no sign of bottoming yet. Initial bias stays on the downside this week for 1.3378 support next, which is close to 61.8% retracement of 1.3091 to 1.3897 at 1.3399. Strong support could be seen there to bring rebound. Meanwhile, on the upside, above 1.3625 minor resistance will turn intraday bias neutral again first.
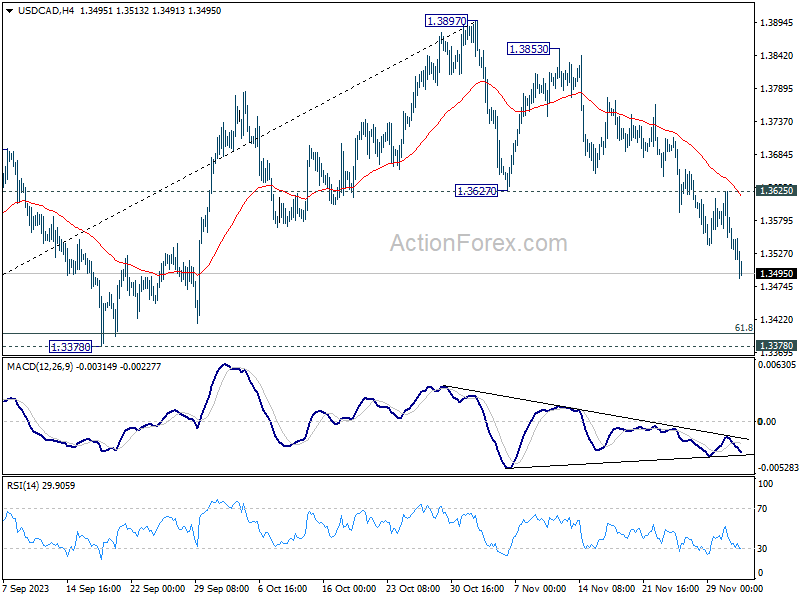
In the bigger picture, rise from 1.3091 is seen as the fifth leg of the whole rise from 1.2005 (2021 low). Further rally is expected as long as 1.3378 support holds, to 61.8% projection of 1.2401 to 1.3976 from 1.3091 at 1.4064. However, decisive break of 1.3378 will dampen this view and bring deeper fall back to 1.3091 instead.
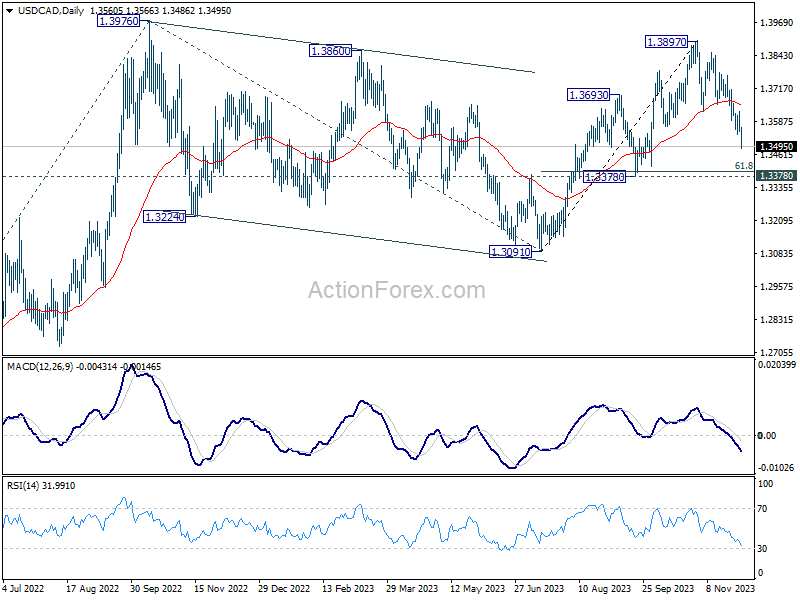
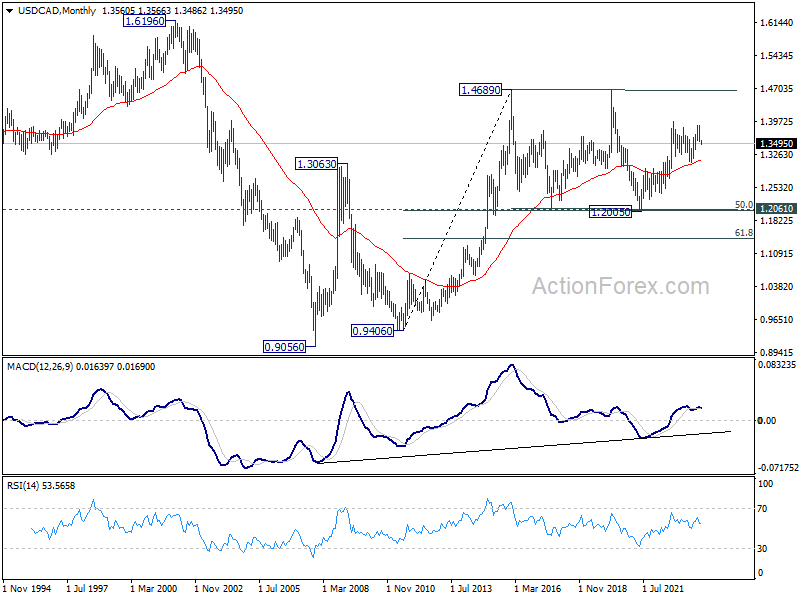
In the longer term picture, price actions from 1.4689 (2016 high) are seen as a consolidation pattern only, which might have completed at 1.2005. That is, up trend from 0.9506 (2007 low) is expected to resume at a later stage. This will remain the favored case as 55 M EMA (now at 1.3126) holds.
GBP/JPY Weekly Outlook
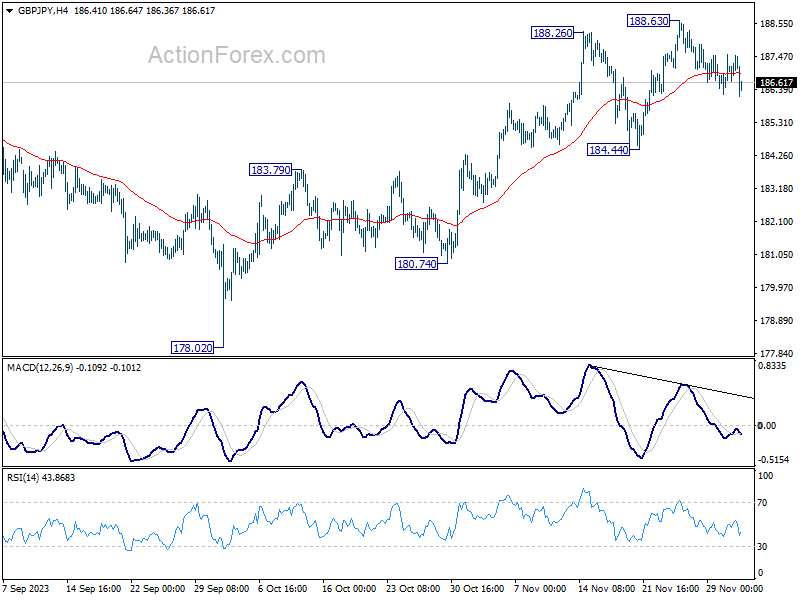
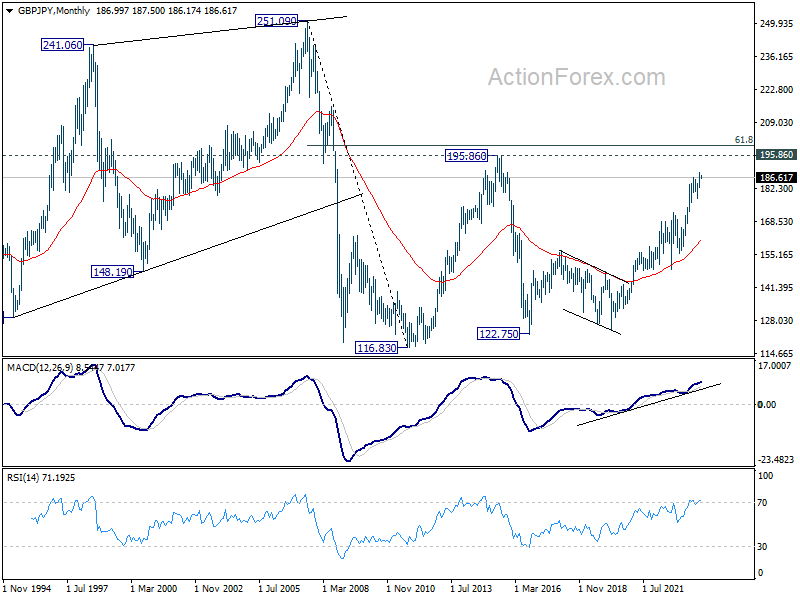
GBP/JPY retreated after edging higher to 188.26 last week. Initial bias stays neutral this week for consolidations first. But near term outlook will remain bullish as long as 184.44 support holds. Break of 188.63 will resume larger up trend.
In the bigger picture, as long as 184.44 support holds, larger up trend from 123.94 (202 low) should still be in progress, next target is 195.86 (2015 high). However, firm break of 184.44 will now argue that a medium term top is formed, possibly in bearish divergence condition in D MACD, and bring deeper fall back to 178.02 support.
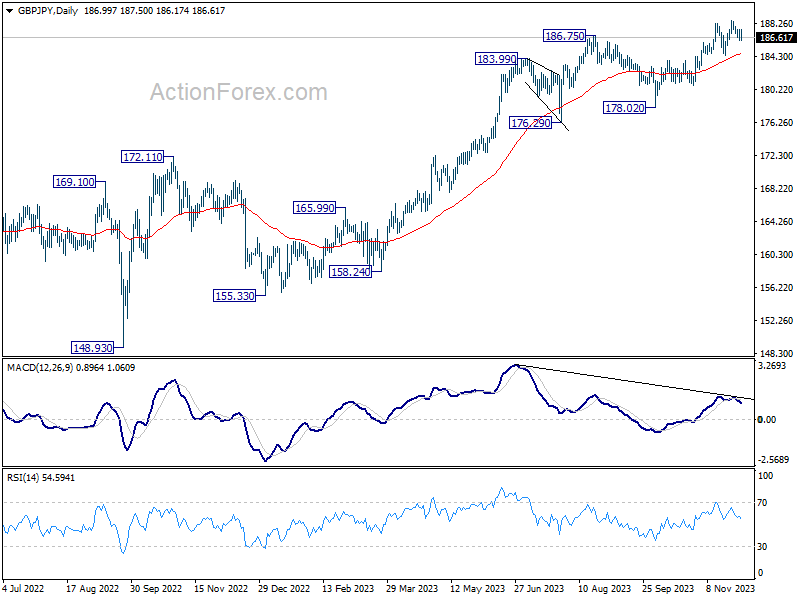
In the longer term picture, rise from 122.75 (2016 low) in still in progress but started losing upside momentum as seen in W MACD. Further rise will remain in favor, though, as long as 178.02 support holds, to retest 195.86 (2015 high).

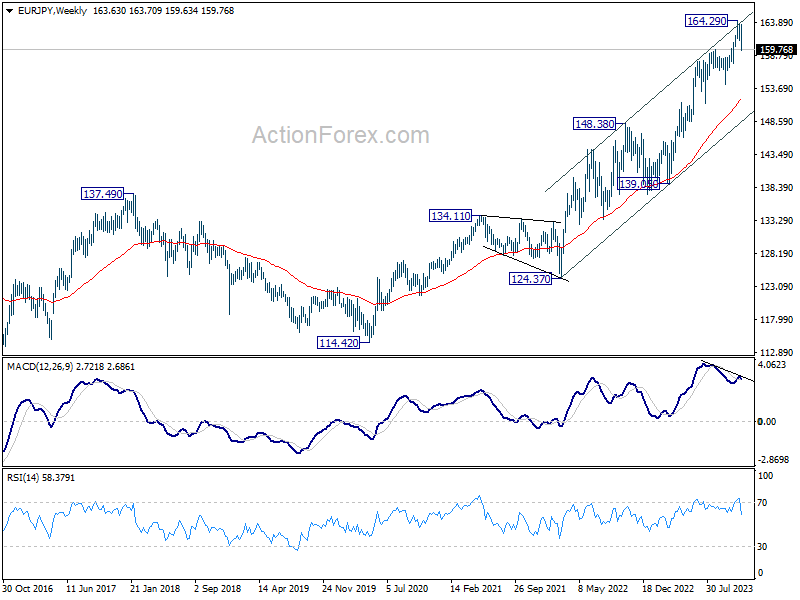
EUR/JPY Weekly Outlook
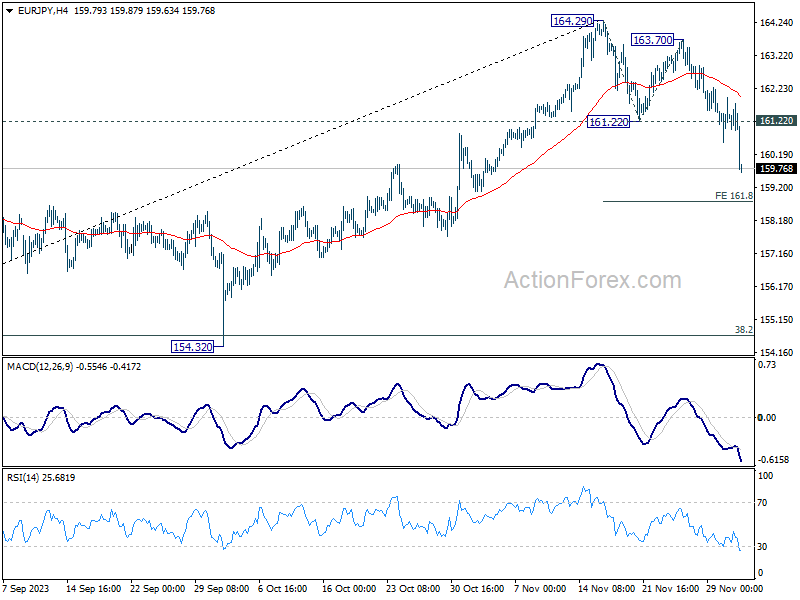
EUR/JPY's fall from 164.29 resumed last week and accelerated to as low as 159.63. Breach of 159.75 resistance turned support suggests that it's already corrective the whole rise from 139.05. Initial bias remains on the downside this week. Deeper fall wold be seen to 161.8% projection of 164.29 to 161.22 from 163.70 at 158.73 next. On the upside, above 161.22 support turned resistance will turn intraday bias neutral and bring consolidations first.
In the bigger picture, bearish divergence condition in 55 D EMA indicates that a medium term top could b formed at 164.29 already, after hitting rising channel resistance. But price actions from there are tentatively seen as a correction only. There is no clear sign that the up trend from 144.42 (2020 low) has completed yet. As long as 55 W EMA (now at 152.12) holds, another rally through 164.29 is still in favor as a later stage.
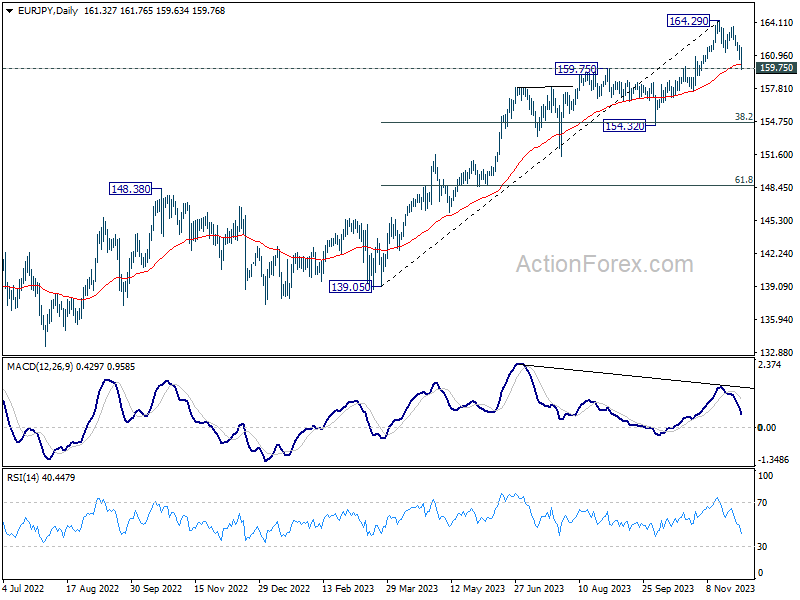
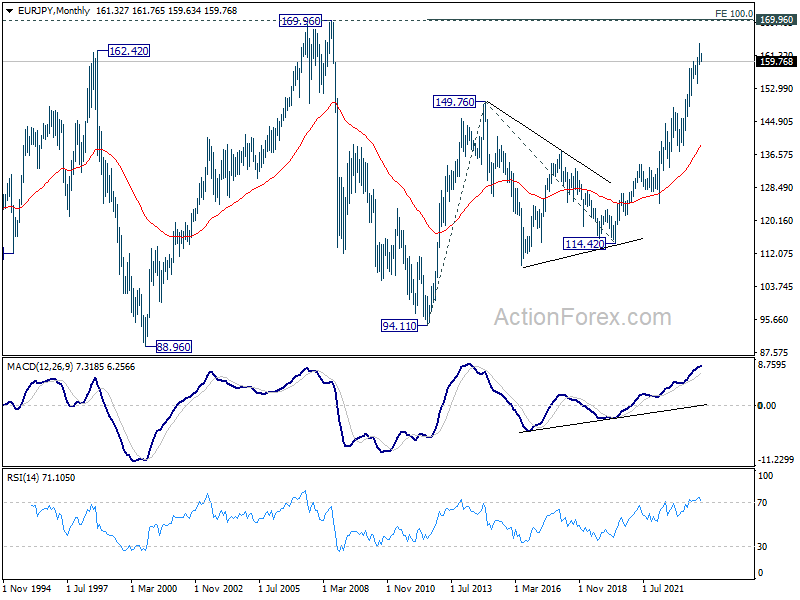
In the long term picture, rise from 109.03 (2016 low) is seen as the third leg of the whole up trend from 94.11 (2012 low). Next target is 100% projection of 94.11 to 149.76 from 114.42 at 170.07 which is close to 169.96 (2008 high).