Sample Category Title
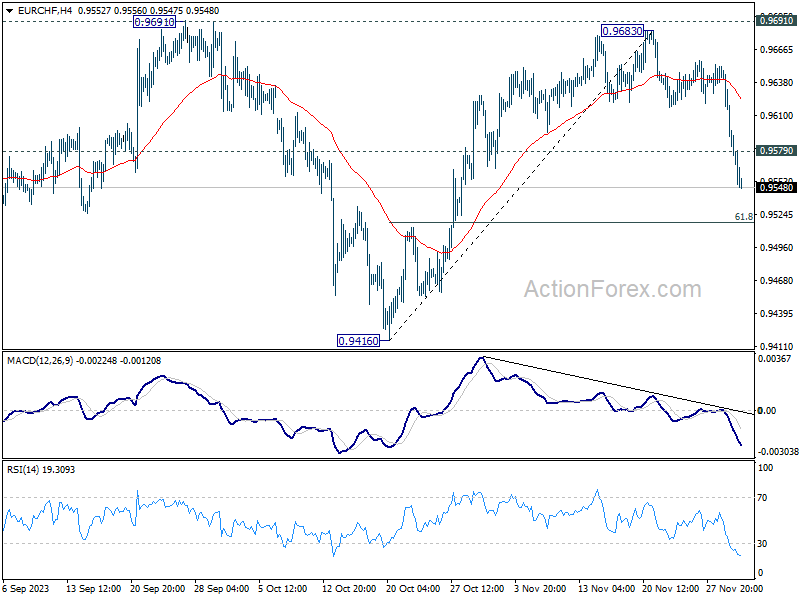
EUR/CHF Mid-Day Outlook
Daily Pivots: (S1) 0.9563; (P) 0.9608; (R1) 0.9632; More...
EUR/CHF's fall from 0.9683 accelerated to as low as 0.9547 so far today. The development confirms rejection by 0.9691 resistance, and dampened the case of larger bullish reversal. Intraday bias is now on the downside for 61.8% retracement level of 0.9416 to 0.9683 at 0.9518. Sustained break there will pave the way to retest 0.9416 low. On the upside, above 0.9579 minor resistance will turn intraday bias neutral first.
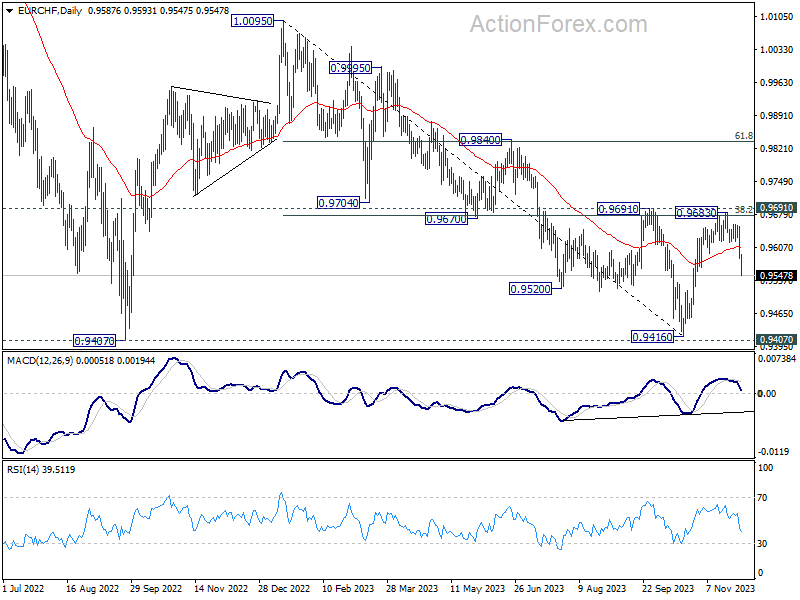
In the bigger picture, rejection by 0.9691 cluster resistance (38.2% retracement of 1.0095 to 0.9416 at 0.9675) maintains medium term bearishness in EUR/CHF. That is, down trend from (1.0095) might not be over yet. Deeper decline would be seen back to 0.9407.16 key support zone. Firm break there will resume long term down trend. For now, outlook will be neutral at best as long as 0.9691 holds.
Euro Sell-Off Intensifies Following CPI Miss, Spurring Broad-Based Dollar Rebound
Dollar is staging a broad-based rebound today, driven in part by the selloff in Euro. However, a more significant factor behind Dollar's recovery appears to be the exhaustion of selling momentum as the month draws to a close. This rebound continues after both headline and core PCE inflation data in US matched expectations, indicating that disinflation is underway, albeit not at a pace drastic enough to significantly alter Fed's policy stance. Despite these developments, it remains premature to declare a bullish reversal for the Dollar, and the market will be closely watching the extent of this rebound.
Euro's decline began early in the European session, triggered by surprising data from France showing a GDP contraction of -0.1% qoq in Q3. Additionally, consumer spending in France plummeted sharply by -0.9% mom in October, marking a weak start to Q4. Euro's selloff was further fueled by much lower than expected headline and core CPI data in the Eurozone for November. This economic data is likely to fuel increasing bets on an ECB rate cut next year, possibly as early as Q2.
As for this week's performance, Euro is emerging as the worst performer at this point, with Dollar ranking as the second worst despite today's rebound. Canadian Dollar is the third worst, receiving little support from Canadian GDP data. Conversely, Japanese Yen remains the strongest currency for the week, followed by New Zealand Dollar. Australian Dollar, however, is leaning towards the weaker side. Sterling and Swiss Franc are showing mixed performances, with the Franc currently appearing stronger.
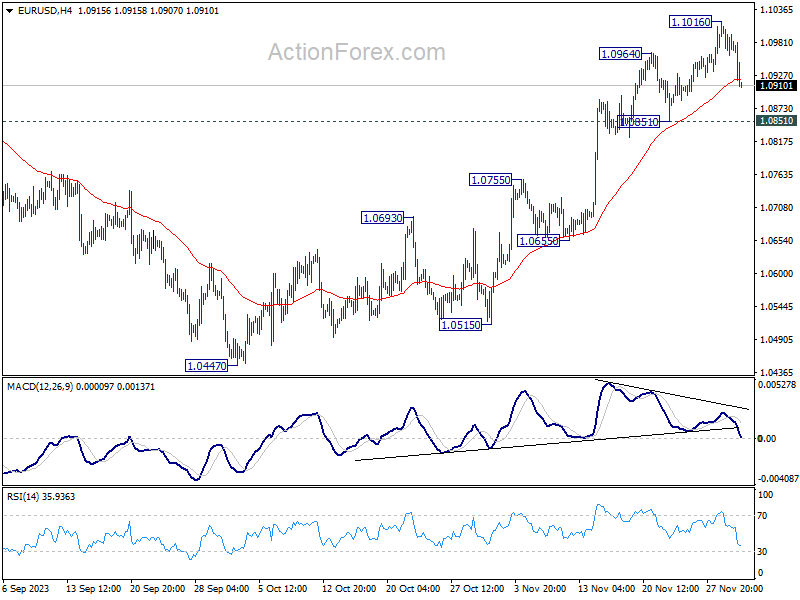
From technical analysis perspective, a major focus for early December is on EUR/USD's reaction to 1.0851 support. As long as this support holds, EUR/USD's rise from 1.0447 is still in favor to extend through 1.1016. However, firm break of 1.0851 will argue a short term top is at least formed, on bearish divergence condition in 4H MACD. Deeper decline would then be seen to 1.0755 resistance turned support next. Such a bearish development in EUR/USD could also signal a precursor to a more broad-based rally in Dollar.
In Europe, at the time of writing, FTSE is up 0.86%. DAX is up 0.42%. CAC is up 0.59%. Germany 10-year yield is up 0.022 at 2.457. Earlier in Asia, Nikkei rose 0.50%. Hong Kong HSI rose 0.29%. China Shanghai SSE rose 0.26%. Singapore Strait Times fell -0.38%. Japan 10-year JGB yield fell -0.0066 to 0.674.
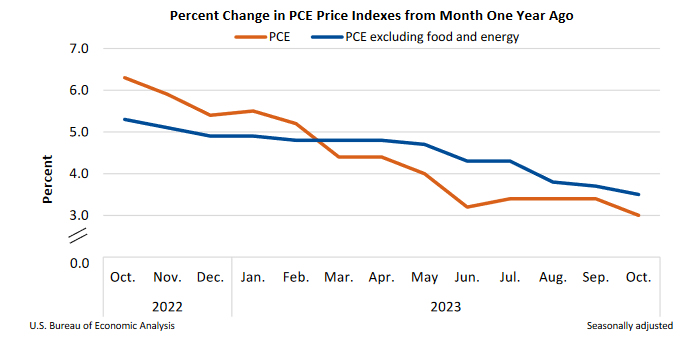
US PCE price index slows to 3%, core PCE down to 3.5%, match expectations
US personal income rose 0.2% mom or USD 57.1B in October, matched expectations. Persona spending rose 0.2% mom or USD 41.2B, matched expectations.
Headline PCE price index rose less than 0.1% mom. Excluding food and energy, core PCE price index rose 0.2% mom. Prices for goods fell -0.3% mom while prices for services rose 0.2% mom. Food prices rose 0.2% mom and energy prices fell -2.6% mom.
From the same month one year ago, headline PCE price index slowed from 3.4% yoy to 3.0% yoy, matched expectations. Core PCE price index slowed from 3.7% yoy to 3.5% yoy, matched expectations. Goods prices was up 0.2% yoy while services prices rose 4.4% yoy. Food prices rose 2.4% yoy and energy prices fell -4.8% yoy.
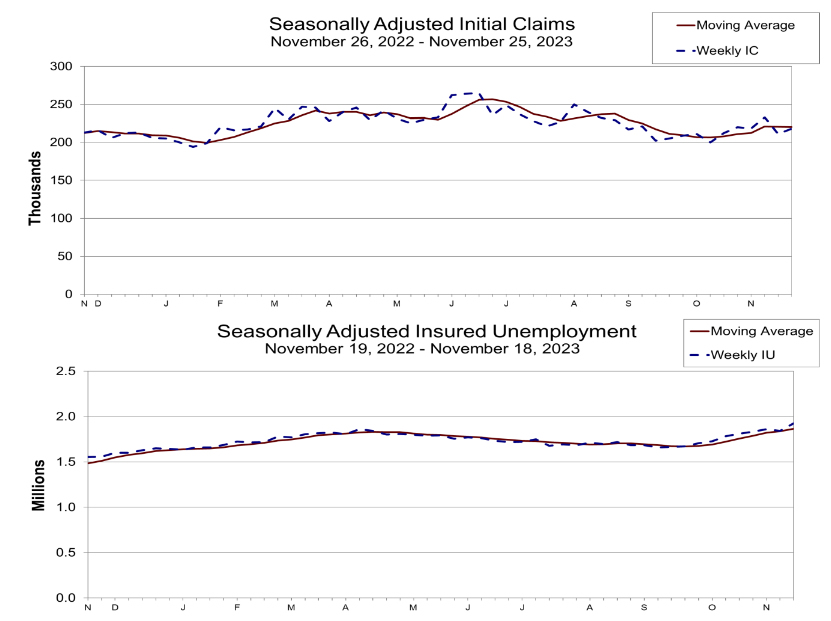
US initial jobless claims rose to 218k, continuing claims hits near 2-yr high
US initial jobless claims rose 7k to 218k in the week ending November 25, above expectation of 215k. Four-week moving average of initial claims fell -500 to 220k.
Continuing claims rose 86k to 1927k in the week ending November 18, highest since November 27, 2021. Four-week moving average of continuing claims rose 29k to 1866k, highest since December 11, 2021.
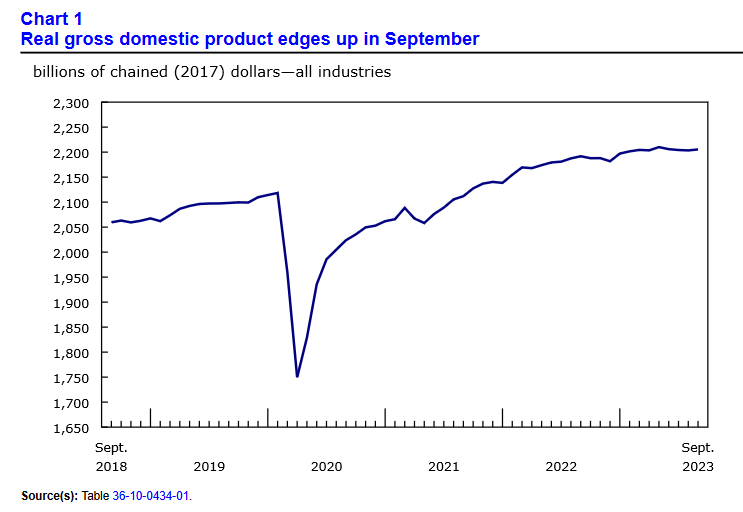
Canada's GDP up 0.1% mom in Sep, down -0.3% qoq in Q3
Canada's GDP rose 0.1% mom in September, matched expectations. Goods-producing industries grew 0.3% mom, leading the growth with a first increase in six months. Services-producing industries were essentially unchanged. Overall, 10 of 20 industrial sectors increased. Advance information indicates that GDP rose 0.2% mom in October.
In Q3, GDP fell -0.3% qoq, reversing Q2's 0.3% qoq growth. The decrease in international exports and slower inventory accumulation were partially offset by increases in government spending and housing investment. Final domestic demand increased 0.3%, following a similar increase in the second quarter.
Eurozone CPI falls more than expected to 2.4% in Nov, core CPI down to 3.6%
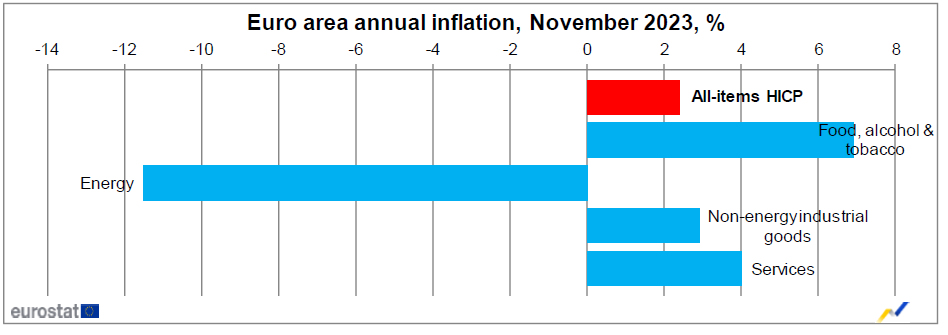
Eurozone CPI slowed notably from 2.9% yoy to 2.4% yoy in November, below expectation of 2.7% yoy. CPI core ( excluding energy, food, alcohol & tobacco) slowed from 4.2% yoy to 3.6% yoy, below expectation of 3.9% yoy.
Looking at the main components, food, alcohol & tobacco is expected to have the highest annual rate in November (6.9%, compared with 7.4% in October), followed by services (4.0%, compared with 4.6% in October), non-energy industrial goods (2.9%, compared with 3.5% in October) and energy (-11.5%, compared with -11.2% in October).
Swiss KOF rose to 96.7, moderate economic outlook
Swiss KOF Economic Barometer, a key indicator for forecasting the economy's direction, has shown a slight improvement in November, rising from 95.1 to 96.7. This rise slightly exceeded market expectations, which were set at 96.2.
According to KOF Swiss Economic Institute, since mid-2023, the barometer has stabilized, though it remains at a level below the historical average. This stabilization indicates moderate outlook for the Swiss economy in the near future.
The increase in the KOF Barometer can primarily be attributed to positive developments in manufacturing sector and other services sector.
However, not all sectors are signaling positive trends. Indicators for hospitality industry and finance and insurance sector are showing slightly negative signals.
BoJ's Nakamura : More time needed before altering ultra-easy monetary stance
BoJ board member Toyoaki Nakamura, in a speech to business leaders today, emphasized that Japan has not yet reached a point where it can confidently assert that the sustained and stable achievement of BoJ's 2% inflation target, along with corresponding wage growth, is within reach. He added that the current inflation in Japan is primarily driven by "cost-push factors".
In light of this assessment, he said BoJ "must patiently maintain current monetary easing for the time being." Some more time is needed before adjusting the policy.
Nevertheless, Nakamura expressed a positive outlook on Japan's economy, describing it as recovering moderately. He also anticipates that this moderate recovery will be accompanied by increases in wages, which could play a crucial role in sustaining economic growth and achieving the inflation target.
Japan's mixed economic signals: Industrial production up, retail sales growth slows
Japan's economy presents a mixed picture based on the latest data for October 2023. Industrial production saw a notable increase, rising 1.0% mom, exceeding expectations of a 0.7% increase.
However, manufacturers surveyed by Japan's Ministry of Economy, Trade and Industry have a mixed outlook. They expect industrial output to decrease by -0.3% mom in November but anticipate a significant climb of 3.2% mom in December. This forecast points to short-term fluctuations but overall optimism towards the year's end.
In contrast to the industrial sector, retail sales figures were less encouraging. Retail sales in October rose by 4.2% yoy, falling short of the expected 5.9% yoy increase. Despite this slower growth, retail sales have continued to mark annual gains for 20 consecutive months.
However, a month-over-month analysis reveals a downturn, with retail sales falling by -1.6% in October from September, ending a three-month streak of gains.
China's manufacturing PMI slips further to 49.4, indicating continued contraction
China's NBS Manufacturing PMI slightly declined from 49.5 to 49.4 in November, marking the weakest reading since December 2022 and falling below market expectation of 49.6. This decline indicates that China's manufacturing sector has been struggling to maintain consistent growth, having been in contraction for five consecutive months since April, briefly returning to expansion in September, and then slipping back into contraction in October.
NBS statistician Zhao Qinghe attributed this downturn to several factors, including "traditional off-season" effects in some manufacturing industries and "insufficient market demand". This explanation points to both cyclical and demand-driven challenges impacting the manufacturing sector.
Within manufacturing PMI, there was a drop in new-orders subindex to 49.4 from 49.5, further reflecting the demand-side struggles. Additionally, new-export-orders subindex fell to 46.3, down from 46.8, indicating challenges in external markets and potentially reflecting global economic conditions.
PMI Non-Manufacturing also witnessed a decrease, moving from 50.6 to 50.2, which was below expected 51.1. However, within the non-manufacturing PMI, construction subindex showed an improvement, rising to 55 from 53.5. The official composite PMI, which combines both manufacturing and services, fell to 50.4 from 50.7.
NZ ANZ business confidence jumps to 30.8, but inflation concerns remain
ANZ Business Confidence in New Zealand saw a significant increase in November, reaching its highest level since March 2015, as it rose from 23.4 to 30.8. Additionally, Own Activity Outlook improved from 23.1 to 26.3.
ANZ's analysis said the results support the idea of "soft landing" for New Zealand economy. However, ANZ points out that it's still uncertain if this slowdown will be adequate to reduce inflation to target level quickly enough.
The survey also revealed varied trends across different economic indicators. Export intentions saw an uptick from 6.1 to 9.2, indicating stronger future export plans. Investment intentions also increased marginally from 3.8 to 4.5. In contrast, employment intentions experienced a slight decrease from 5.6 to 5.4, suggesting a small dip in hiring plans.
Notably, cost expectations showed a decrease from 76.0 to 73.9, which could signal easing cost pressures. Profit expectations reversed from a negative -5.6 to a positive 1.5, reflecting an improved outlook for business profitability.
The report presented a mixed view of inflation indicators. Inflation expectations continued their downward trajectory, moving from 4.94% to 4.79%. However, pricing intentions rose slightly from 46.3 to 46.8.
ANZ also commented on the market's expectations for RBNZ's OCR. They noted that while there is market anticipation for rate cuts, the current economic indicators, particularly some stalling in inflation measures and the overall robust level of activity, suggest that the RBNZ may not be inclined to lower rates soon.
EUR/CHF Mid-Day Outlook
Daily Pivots: (S1) 0.9563; (P) 0.9608; (R1) 0.9632; More...
EUR/CHF's fall from 0.9683 accelerated to as low as 0.9547 so far today. The development confirms rejection by 0.9691 resistance, and dampened the case of larger bullish reversal. Intraday bias is now on the downside for 61.8% retracement level of 0.9416 to 0.9683 at 0.9518. Sustained break there will pave the way to retest 0.9416 low. On the upside, above 0.9579 minor resistance will turn intraday bias neutral first.
In the bigger picture, rejection by 0.9691 cluster resistance (38.2% retracement of 1.0095 to 0.9416 at 0.9675) maintains medium term bearishness in EUR/CHF. That is, down trend from (1.0095) might not be over yet. Deeper decline would be seen back to 0.9407.16 key support zone. Firm break there will resume long term down trend. For now, outlook will be neutral at best as long as 0.9691 holds.
Economic Indicators Update
| GMT | Ccy | Events | Actual | Forecast | Previous | Revised |
|---|---|---|---|---|---|---|
| 23:50 | JPY | Industrial Production M/M Oct P | 1.00% | 0.70% | 0.50% | |
| 23:50 | JPY | Retail Trade Y/Y Oct | 4.20% | 5.90% | 5.80% | 6.30% |
| 00:00 | NZD | ANZ Business Confidence Nov | 30.8 | 23.4 | ||
| 00:30 | AUD | Private Capital Expenditure Q3 | 0.60% | 1.00% | 2.80% | |
| 00:30 | AUD | Private Sector Credit M/M Oct | 0.30% | 0.40% | 0.50% | |
| 01:00 | CNY | NBS Manufacturing PMI Nov | 49.4 | 49.6 | 49.5 | |
| 01:00 | CNY | NBS Non-Manufacturing PMI Nov | 50.2 | 51.1 | 50.6 | |
| 05:00 | JPY | Housing Starts Y/Y Oct | -6.30% | -7.00% | -6.80% | |
| 07:00 | EUR | Germany Retail Sales M/M Oct | 1.10% | 0.50% | -0.80% | |
| 07:30 | CHF | Real Retail Sales Y/Y Oct | -0.10% | 0.20% | -0.60% | -1.20% |
| 08:00 | CHF | KOF Economic Barometer Nov | 96.7 | 96.2 | 95.8 | 95.1 |
| 08:55 | EUR | Germany Unemployment Change Nov | 22K | 25K | 30K | |
| 08:55 | EUR | Germany Unemployment Rate Nov | 5.90% | 5.80% | 5.80% | |
| 09:00 | EUR | Italy Unemployment Oct | 7.80% | 7.40% | 7.40% | |
| 10:00 | EUR | Eurozone Unemployment Rate Oct | 6.50% | 6.50% | 6.50% | |
| 10:00 | EUR | Eurozone CPI Y/Y Nov P | 2.40% | 2.70% | 2.90% | |
| 10:00 | EUR | Eurozone CPI Core Y/Y Nov P | 3.60% | 3.90% | 4.20% | |
| 13:30 | CAD | GDP M/M Sep | 0.10% | 0.10% | 0.00% | |
| 13:30 | USD | Personal Income M/M Oct | 0.20% | 0.20% | 0.30% | 0.40% |
| 13:30 | USD | Personal Spending Oct | 0.20% | 0.20% | 0.70% | |
| 13:30 | USD | PCE Price Index M/M Oct | 0.00% | 0.10% | 0.40% | |
| 13:30 | USD | PCE Price Index Y/Y Oct | 3.00% | 3.00% | 3.40% | |
| 13:30 | USD | Core PCE Price Index M/M Oct | 0.20% | 0.20% | 0.30% | |
| 13:30 | USD | Core PCE Price Index Y/Y Oct | 3.50% | 3.50% | 3.70% | |
| 13:30 | USD | Initial Jobless Claims (Nov 24) | 218K | 215K | 209K | 211K |
| 14:45 | USD | Chicago PMI Nov | 45.4 | 44 | ||
| 15:00 | USD | Pending Home Sales M/M Oct | -0.70% | 1.10% | ||
| 15:30 | USD | Natural Gas Storage | -8B | -7B |
Canada’s GDP up 0.1% mom in Sep, down -0.3% qoq in Q3
Canada's GDP rose 0.1% mom in September, matched expectations. Goods-producing industries grew 0.3% mom, leading the growth with a first increase in six months. Services-producing industries were essentially unchanged. Overall, 10 of 20 industrial sectors increased. Advance information indicates that GDP rose 0.2% mom in October.
In Q3, GDP fell -0.3% qoq, reversing Q2's 0.3% qoq growth. The decrease in international exports and slower inventory accumulation were partially offset by increases in government spending and housing investment. Final domestic demand increased 0.3%, following a similar increase in the second quarter.
US initial jobless claims rose to 218k, continuing claims hits near 2-yr high
US initial jobless claims rose 7k to 218k in the week ending November 25, above expectation of 215k. Four-week moving average of initial claims fell -500 to 220k.
Continuing claims rose 86k to 1927k in the week ending November 18, highest since November 27, 2021. Four-week moving average of continuing claims rose 29k to 1866k, highest since December 11, 2021.
US PCE price index slows to 3%, core PCE down to 3.5%, match expectations
US personal income rose 0.2% mom or USD 57.1B in October, matched expectations. Persona spending rose 0.2% mom or USD 41.2B, matched expectations.
Headline PCE price index rose less than 0.1% mom. Excluding food and energy, core PCE price index rose 0.2% mom. Prices for goods fell -0.3% mom while prices for services rose 0.2% mom. Food prices rose 0.2% mom and energy prices fell -2.6% mom.
From the same month one year ago, headline PCE price index slowed from 3.4% yoy to 3.0% yoy, matched expectations. Core PCE price index slowed from 3.7% yoy to 3.5% yoy, matched expectations. Goods prices was up 0.2% yoy while services prices rose 4.4% yoy. Food prices rose 2.4% yoy and energy prices fell -4.8% yoy.
Canadian Dollar Steady ahead of GDP
- Canada’s GDP expected to remain at 0.0%
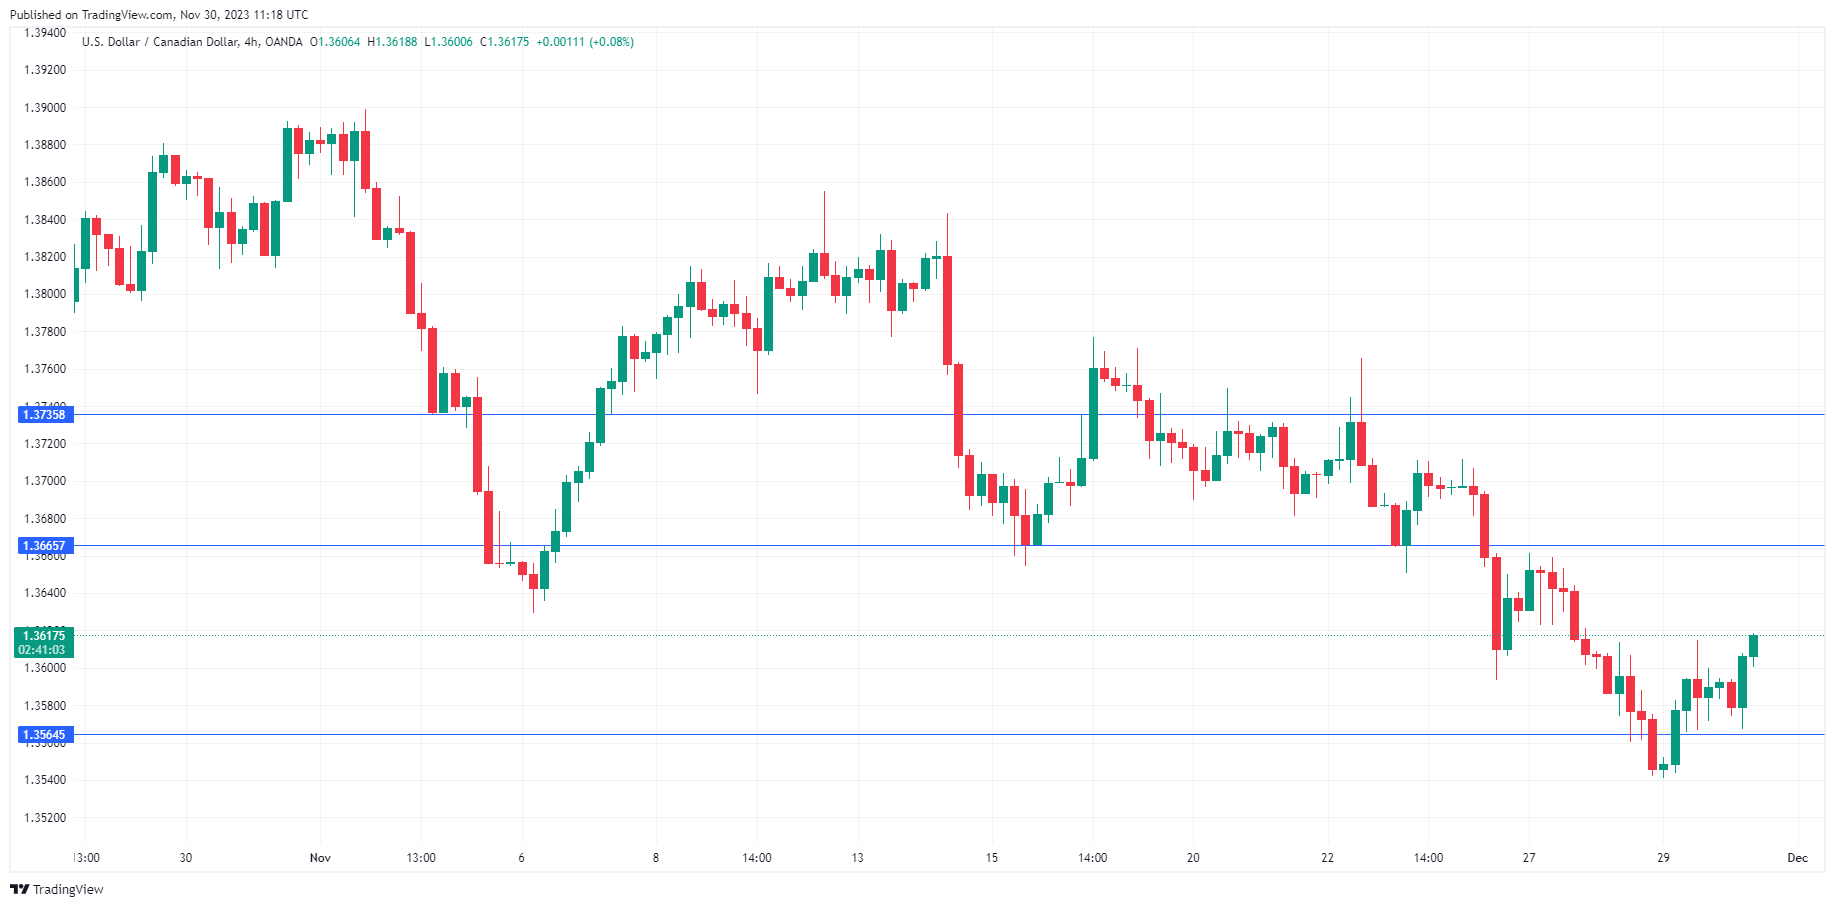
The Canadian dollar is steady on Thursday. In the North American session, USD/CAD is trading at 1.3602, up 0.11%.
Canada’s GDP expected to flatline
Canada’s economy has been stalling and today’s GDP release is expected to confirm that trend. August GDP came in at 0.0% and no change is expected for the September GDP release. The stagnation in growth fits the Bank of Canada’s view that elevated borrowing costs have dampened demand and growth. The economy recorded a modest contraction in the second quarter and the third quarter is expected to be flat. This backdrop makes a rate hike unlikely, as inflation has been dropping and eased to 3.1% in October, down from 3.8% a month earlier.
The lack of growth has not escaped the watchful eyes of rating agencies. Earlier this week, S&P cut Canada’s GDP growth for this year from 1.2% to 1.1% and from 1.2% to 0.8% in 2024. S&P said Canada would experience a “sluggish growth path for the next several quarters” due to higher interest rates and weak global demand. As a result, S&P says the Bank of Canada has wound up its tightening cycle and will start to cut rates in the second quarter of 2024, and expects the BoC to cut rates by 100 basis points in 2024.
In the US, second-estimate GDP for the third quarter was revised to 5.2%, up from the initial estimate of 4.9%. The sharp gain should ease fears of a recession in the US but also means that the Fed has little reason to trim rates while inflation remains well above the 2% target. The Fed has signalled a ‘higher for longer’ stance on rates but the markets are more dovish and have priced in a rate hike in March 2024 at 45%, according to the CME’s FedWatch tool.
USD/CAD Technical
- There is resistance at 1.3665 and 1.3735
- 1.3564 and 1.3494 are providing support
Crypto Market: Another Pullback Within the Framework of Growth
Market picture
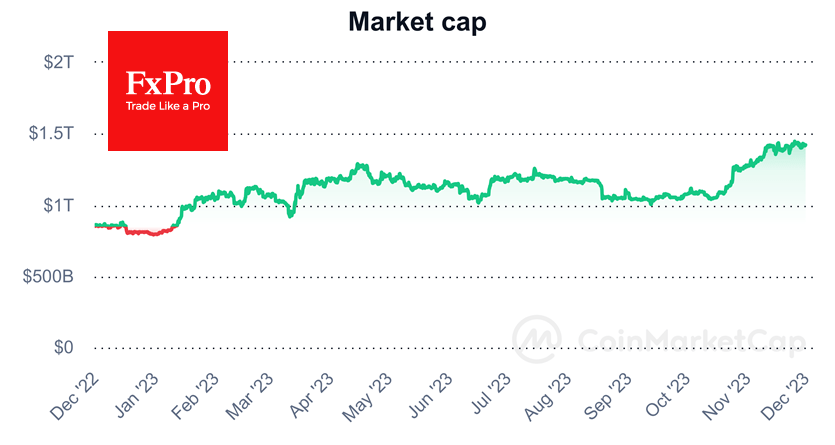
The crypto market cap fell 0.5% in 24 hours to $1.42 trillion, showing another pullback as part of a broader uptrend that started in mid-October but has slowed in the last couple of weeks.
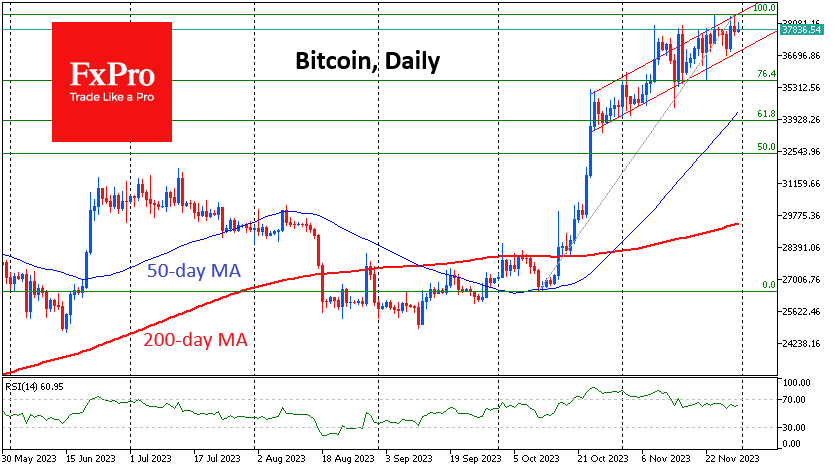
Bitcoin underwent a sell-off on Wednesday afternoon from the upper end of an upward range above $38.4K. Countless times, the market has proven that it’s not ready to accelerate, but it hasn’t found any reason to go deep down either. Only a failure below $36.7K will confirm that $38K is a solid horizontal resistance. Without this confirmation, the working scenario remains in the upward range.
News background
According to CryptoQuant, crypto whales are sending bitcoins to exchange wallets, which can be seen as a bearish signal.
Standard Chartered Bank confirmed its prediction that Bitcoin could reach $100K by the end of next year. Apart from halving, the catalyst for the rally will be the approval of several spot ETFs in the first quarter of 2024. This will pave the way for institutional investment in Bitcoin and Ethereum.
The US SEC has requested public comment on spot Bitcoin ETFs. Lawyer Scott Jonsson saw this as a signal of the regulator’s willingness to approve all applications for the instrument in a one-time manner by 10 January 2024.
Glassnode recorded Ethereum’s first post-Shanghai decline in staking, which is slowing issuance. Along with the increased rate of coin burn in light of increased network activity, inflation has been replaced by deflation.
Binance, the world’s largest crypto exchange, announced that it will delist its own BUSD stablecoin as part of a deal with US authorities and will stop supporting it starting on the 15th of December.
US presidential candidate Vivek Ramaswamy said that his ” policy will guarantee a bright future for cryptocurrencies”, which will give freedom to Americans.
GBP/USD: Bulls Loosen Grip Ahead of Key US Data
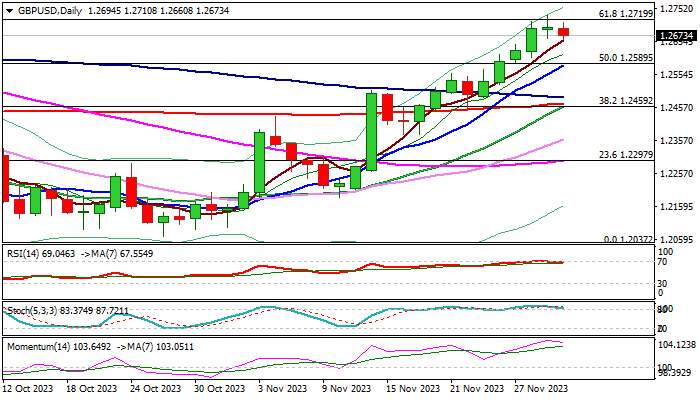
Cable eases from new three-month high in European trading on Thursday, as daily Doji candle on Wednesday signaled indecision and overbought daily studies prompted a partial profit-taking.
Failure to register a daily close above 1.2719 Fibo barrier (61.8% of 1.3141/1.2037) and subsequent weakness add to initial signals of bull trap and increases risk of pullback.
Initial support lays at 1.2655 (5DMA), followed by rising 10DMA (1.2581) which should ideally contain dips to keep larger bulls intact, with deeper correction to expose pivotal supports at 1.2466/58 (converging 200 and 20DMA’s / broken Fibo 38.2%).
Markets await release of key economic indicator today – US PCE price index – Fed’s preferred inflation gauge, which is expected to provide fresh direction signals.
Core PCE is forecasted to rise 3.5% y/y and 0.2% m/m in October, down from September’s 3.7% y/y and 0.3% m/m, with dollar expected to remain under pressure on results in line with expectations but may accelerate lower if inflation in October falls more than expected.
In such scenario, Cable may rally through1.2700/19 pivots for test of 1.2800/18 (Aug 10/22 tops) and 1.2881 (Fibo 76.4% of 1.3141/1.2037) in extension.
Res: 1.2719; 1.2733; 1.2800; 1.2818.
Sup: 1.2655; 1.2581; 1.2500; 1.2485.
Eurozone CPI falls more than expected to 2.4% in Nov, core CPI down to 3.6%
Eurozone CPI slowed notably from 2.9% yoy to 2.4% yoy in November, below expectation of 2.7% yoy. CPI core ( excluding energy, food, alcohol & tobacco) slowed from 4.2% yoy to 3.6% yoy, below expectation of 3.9% yoy.
Looking at the main components, food, alcohol & tobacco is expected to have the highest annual rate in November (6.9%, compared with 7.4% in October), followed by services (4.0%, compared with 4.6% in October), non-energy industrial goods (2.9%, compared with 3.5% in October) and energy (-11.5%, compared with -11.2% in October).
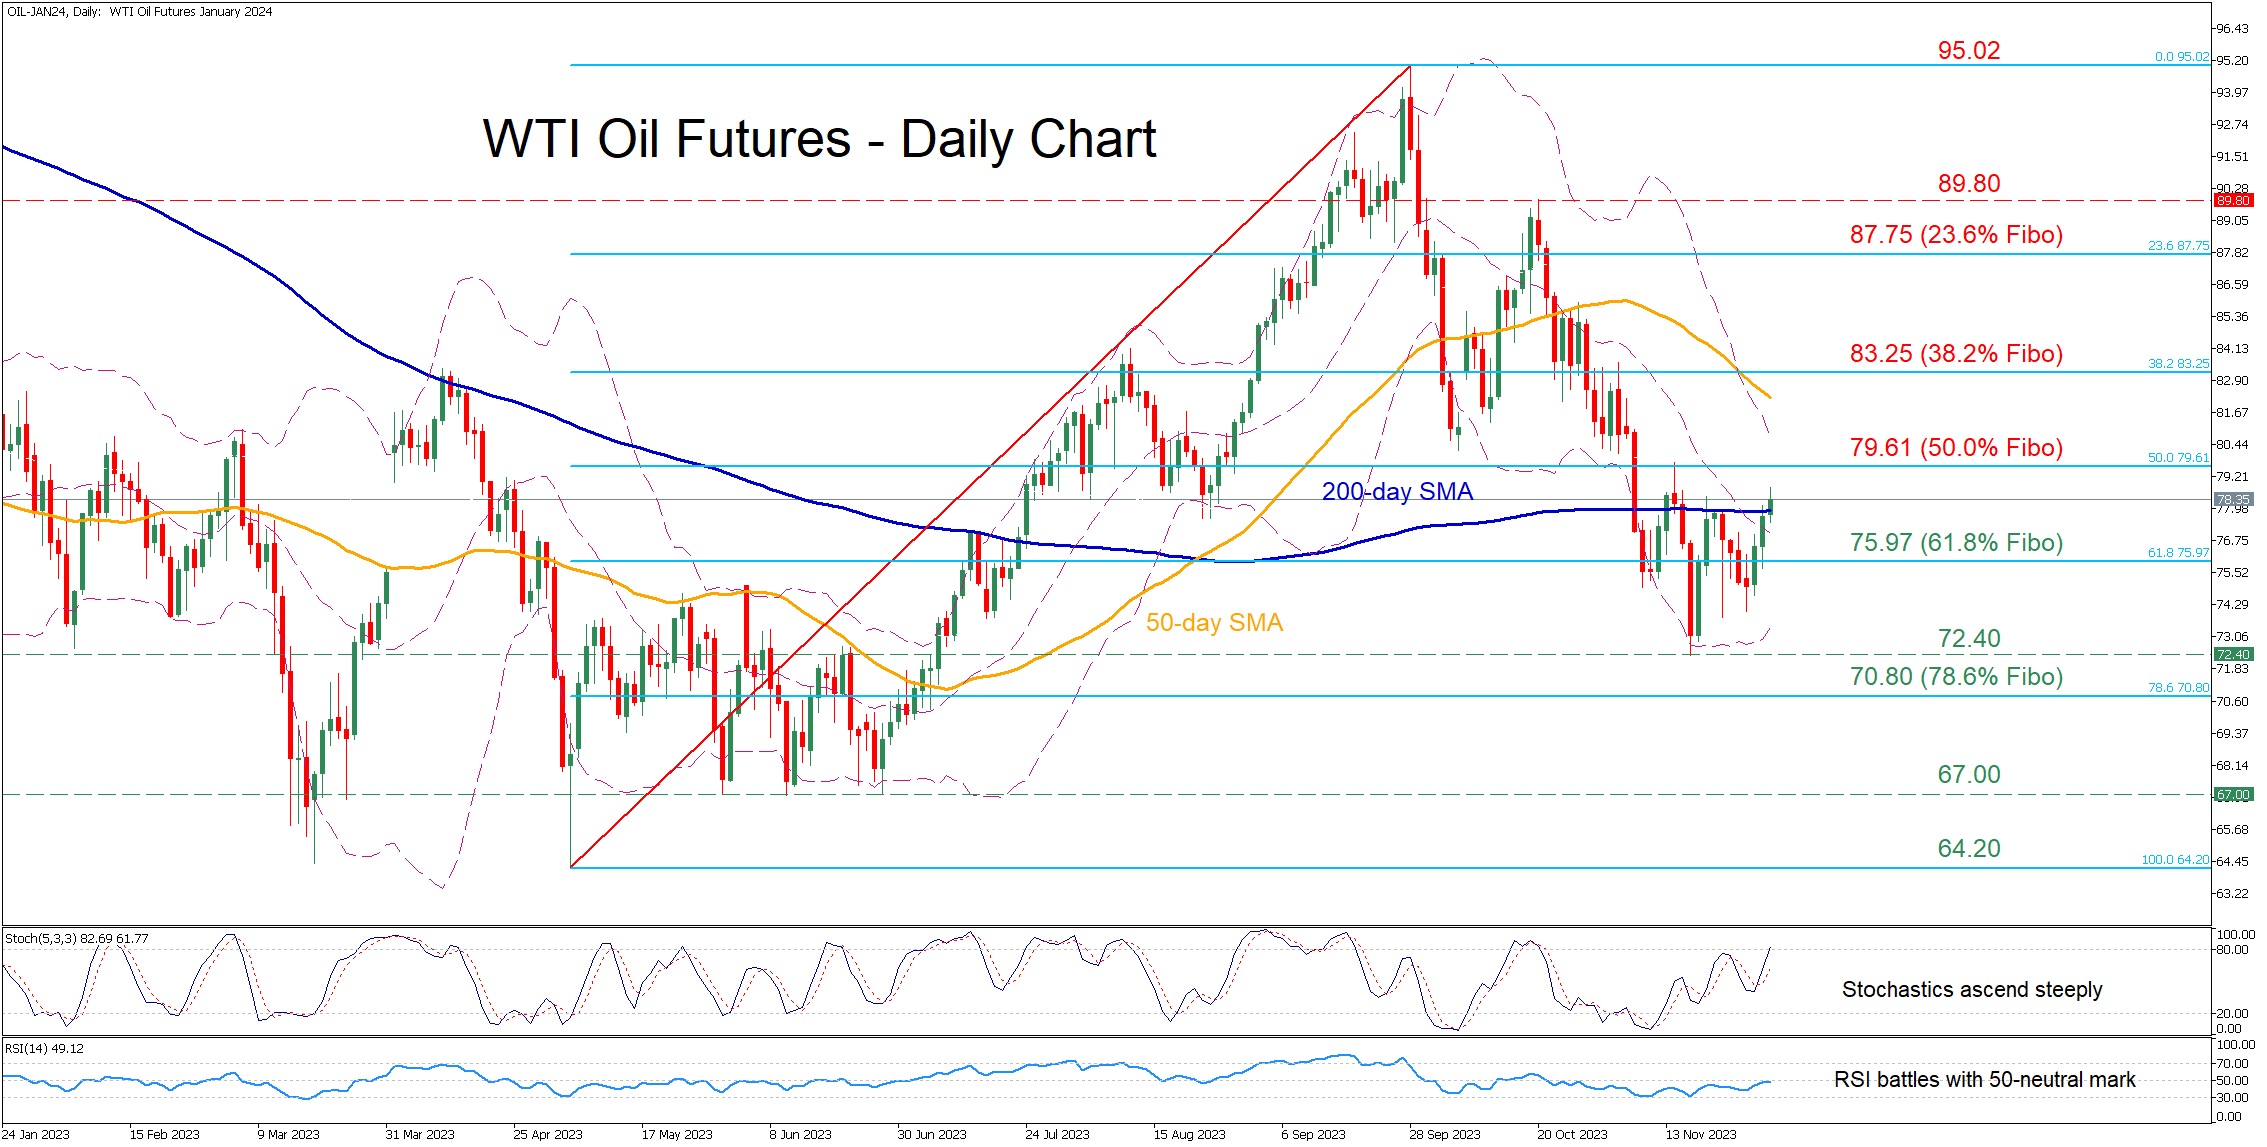
WTI Oil Futures in a Fierce Battle With 200-day SMA
- WTI futures fall to a 4-month low before attempting a recovery
- But their rebound is being held down by the 200-day SMA
- Momentum indicators suggest that positive momentum is picking up
WTI oil futures (January delivery) have been on the retreat since their October peak of 89.85, breaking aggressively below historical support zones. Although the price managed to find its feet at the four-month low of 72.40, the 200-day simple moving average (SMA) has been repeatedly curbing its upside.
If the bulls manage to conquer the 200-day SMA, immediate resistance could be met at 79.61, which is the 50.0% Fibonacci retracement of the 64.20-95.02 upleg. Piercing through that area, the price could advance towards the 38.2% Fibo of 83.25. Further upside attempts could then stall around the 23.6% Fibo of 87.75.
On the flipside, should the 200-day SMA hold its ground, the price might reverse lower towards the 61.8% Fibo of 75.97. A break beneath that region could pave the way for the recent four-month bottom of 72.40. Even lower, the 78.6% Fibo of 70.80 could provide downside protection.
In brief, WTI oil futures are stuck in a bearish short-term pattern, appearing unable to stage a solid rebound. However, a clear jump above the 200-day SMA could shift the short-term picture back to bullish.