
Sample Category Title
USDJPY Shows Incomplete Elliott Wave Bearish Sequence
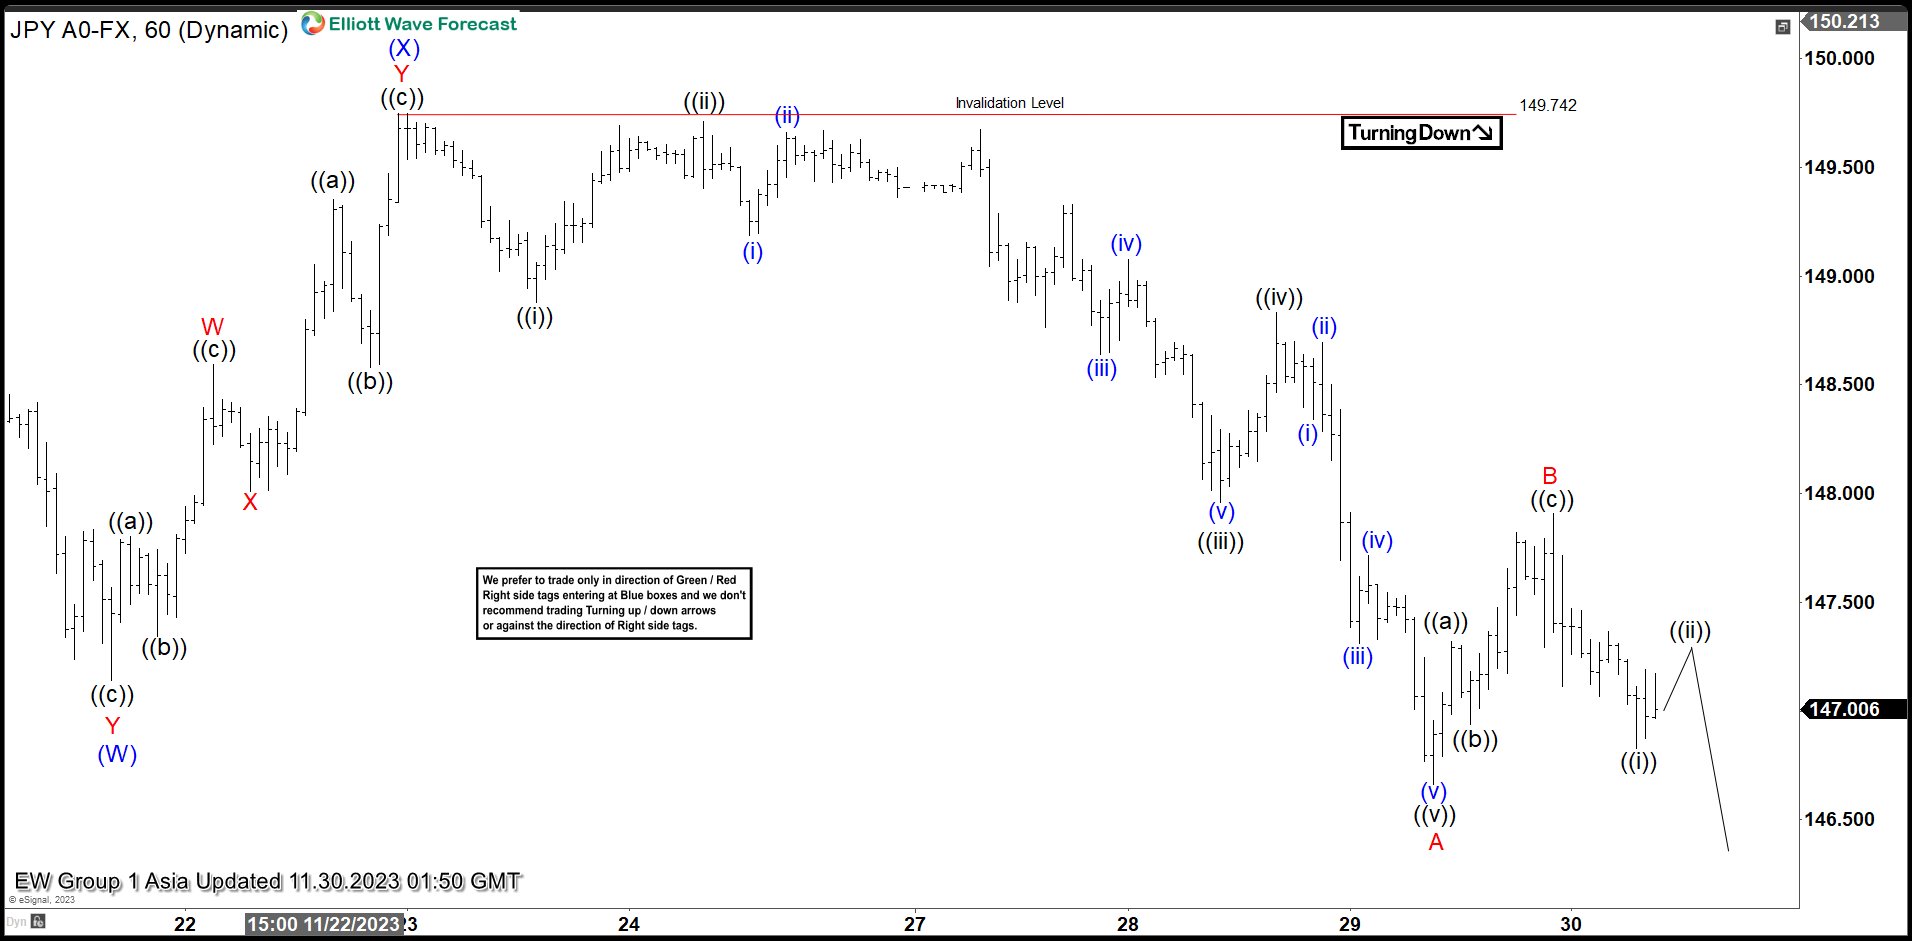
USDJPY shows incomplete bearish sequence from 11.13.2023 suggesting further downside. Down from 11.13.2023 high, decline is unfolding as a double three Elliott Wave structure. Down from 11.13.2023 high, wave (W) ended at 147.15. Wave (X) ended at 149.78 with internal subdivision as a double three in lesser degree. Up from wave (W), wave W ended at 148.59 and dips in wave X ended at 148. Wave Y higher ended at 149.78 which completed wave (X).
Wave (Y) lower is in progress with internal subdivision as a zigzag structure. Down from wave (X), wave ((i)) ended at 148.87 and wave ((ii)) rally ended at 149.71. Pair extended lower in wave ((iii)) towards 147.96 and rally in wave ((iv)) ended at 148.83. Final leg wave ((v)) ended at 146.66 which completed wave A. Rally in wave B ended at 147.9 with internal subdivision as a zigzag. Up from wave A, wave ((a)) ended at 147.32, and wave ((b)) pullback ended at 146.94. Wave ((c)) higher ended at 147.9 which completed wave B. Near term, as far as pivot at 149.78 high stays intact, expect rally to fail in 3, 7, or 11 swing for further downside in wave C.
USDJPY 60 Minutes Elliott Wave Chart
USDJPY Elliott Wave Video
https://www.youtube.com/watch?v=2zjpxgbcmZM
Technical Outlook and Review
DXY:
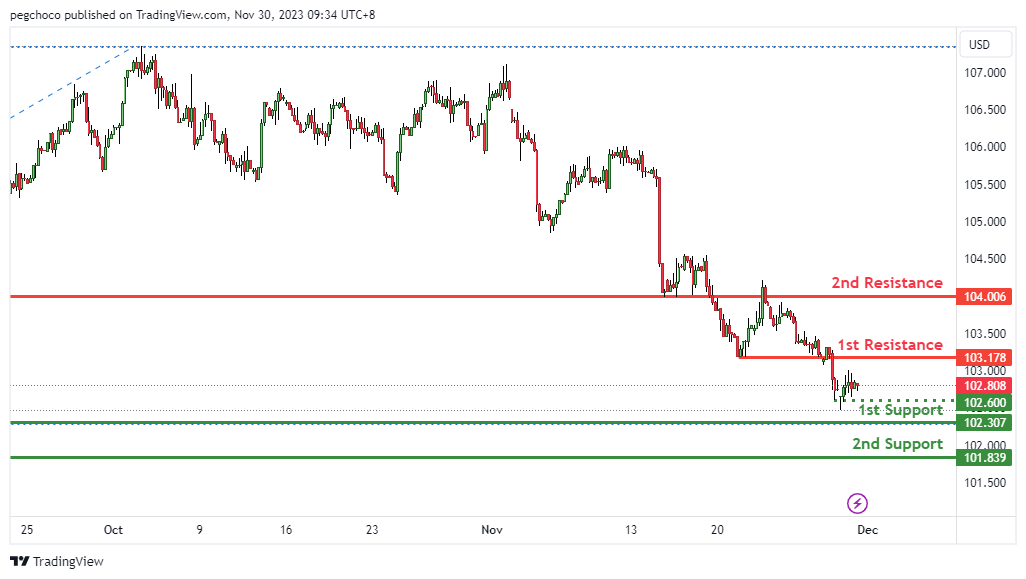
The DXY (US Dollar Index), the overall momentum of the chart is bearish, suggesting a potential download movement in price. In this scenario could potentially make a Bearish continuation towards the 1st support.
The 1st support at 102.30 is identified as a pullback support. This suggests that it’s a significant level where buying interest may emerge, potentially providing some support for the US Dollar Index.
The 2nd support at 101.83 is another overlap support level. This adds further significance to this support level, indicating it as a potential area where buyers might become active.
On the resistance side, the 1st resistance at 102.79 is categorized as a pullback resistance. This implies that it’s a level where selling pressure may increase, acting as a potential barrier to further upward price movement for the US Dollar Index.
The 2nd resistance at 103.17 is also noted as a pullback resistance, suggesting it’s another significant level where selling interest could intensify.
Additionally, there is an intermediate support at 102.60, identified as a swing low support. This reinforces the potential support factors for the currency index.
EUR/USD:
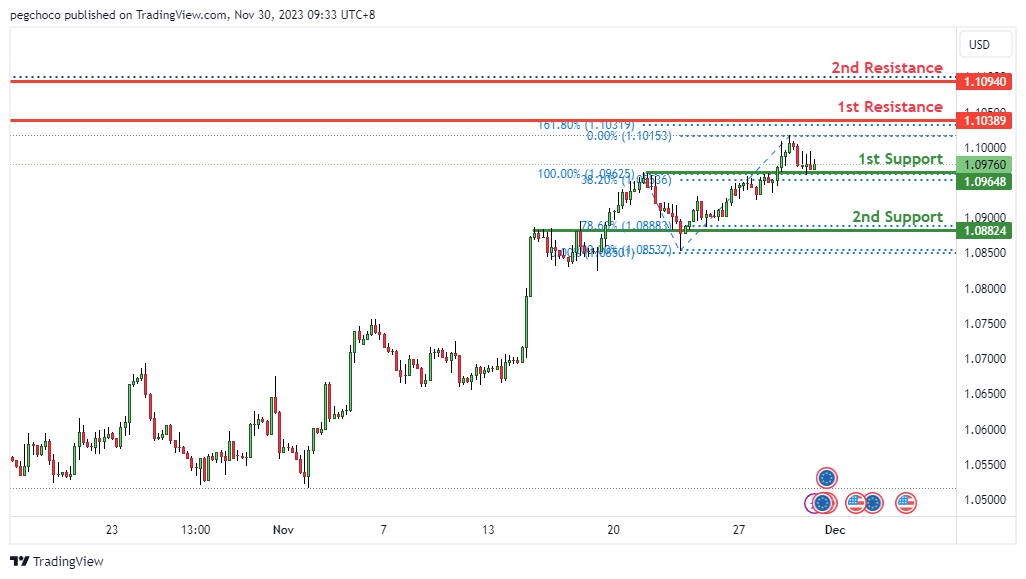
The EUR/USD, the overall momentum of the chart is bullish, suggesting a potential upward movement in price. In this scenario, there is a possibility that the price could potentially make a bullish bounce off the 1st support and head towards the 1st resistance.
The 1st support at 1.0964 is identified as a pullback support, and it also coincides with the 38.20% Fibonacci Retracement level. This suggests that it’s a significant level where buying interest may emerge, potentially leading to a bullish bounce for the EUR/USD currency pair.
The 2nd support at 1.08824 is another overlap support level, and it aligns with the 78.60% Fibonacci Retracement. This adds further significance to this support level, indicating it as a potential area where buyers might become active.
On the resistance side, the 1st resistance at 1.1038 is categorized as an overlap resistance, and it also coincides with the 161.80% Fibonacci Extension level. This dual significance suggests that it’s a significant barrier where selling interest could intensify, potentially limiting the upward movement for EUR/USD.
The 2nd resistance at 1.1094 is noted as a pullback resistance, indicating that it’s a level where selling pressure may increase, acting as another potential obstacle to the currency pair’s upward price movement.
EUR/JPY:
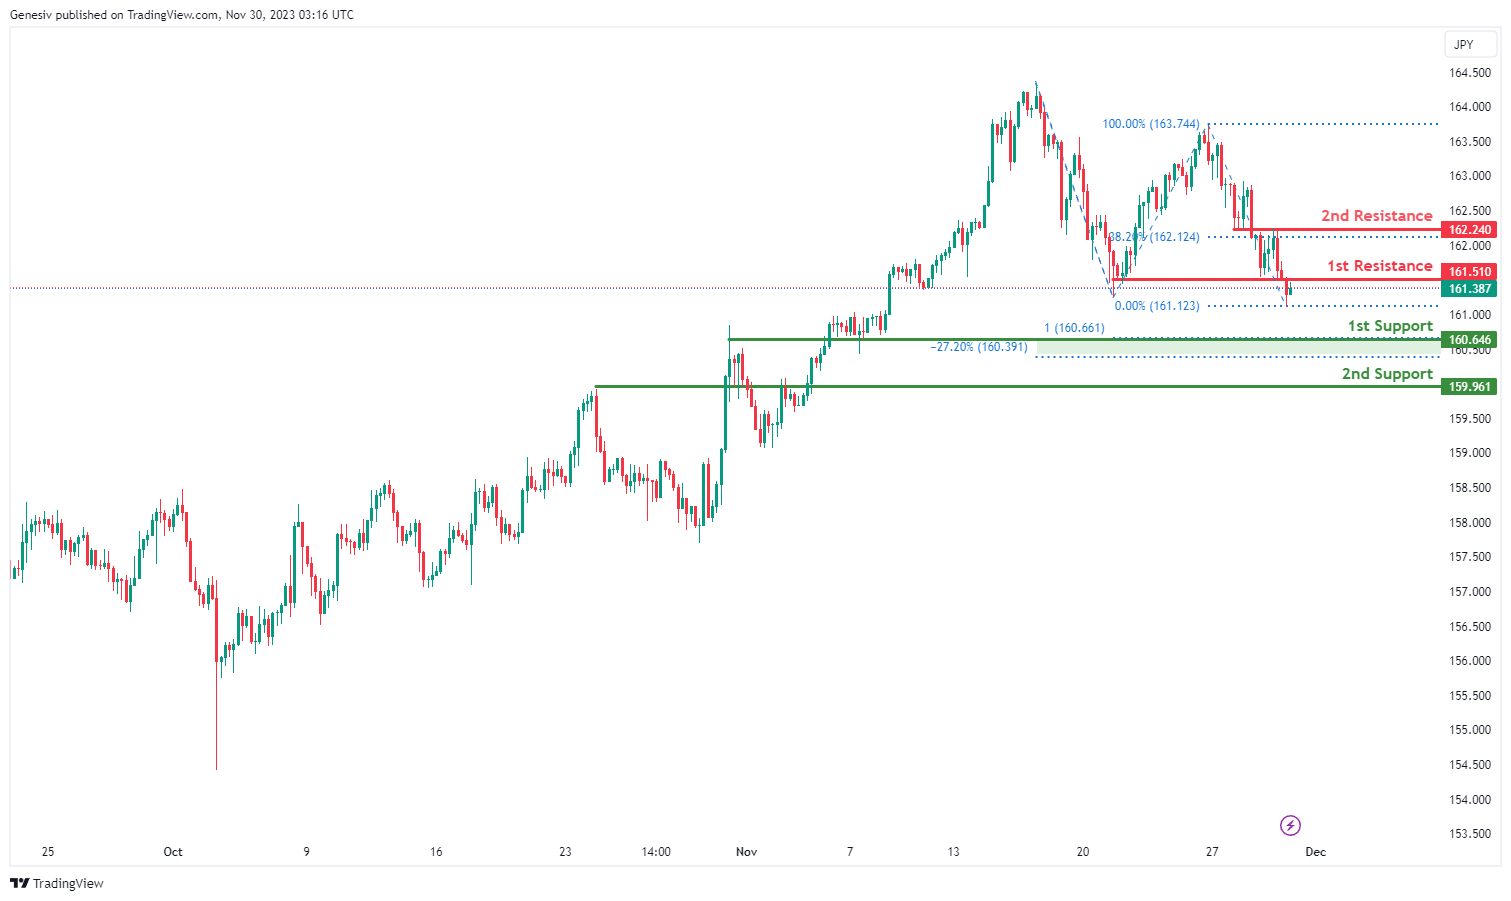
The analyzed instrument is EUR/JPY, and the overall momentum of the chart is currently bearish.
There is a potential for the price to make a bearish reaction off the 1st resistance and drop to the 1st support.
The 1st support level is identified at 160.64, and its favorable characteristics include being an overlap support, coinciding with the -27% Fibonacci Expansion, and aligning with the 100% Fibonacci Projection, indicating Fibonacci confluence.
The 2nd support level is situated at 159.96, and its favorable aspect is derived from being a pullback support.
On the resistance side, the 1st resistance is positioned at 161.51, and it is considered significant due to being a pullback resistance.
The 2nd resistance is located at 162.24, and its significance is derived from being an overlap resistance and coinciding with the 38.20% Fibonacci Retracement.
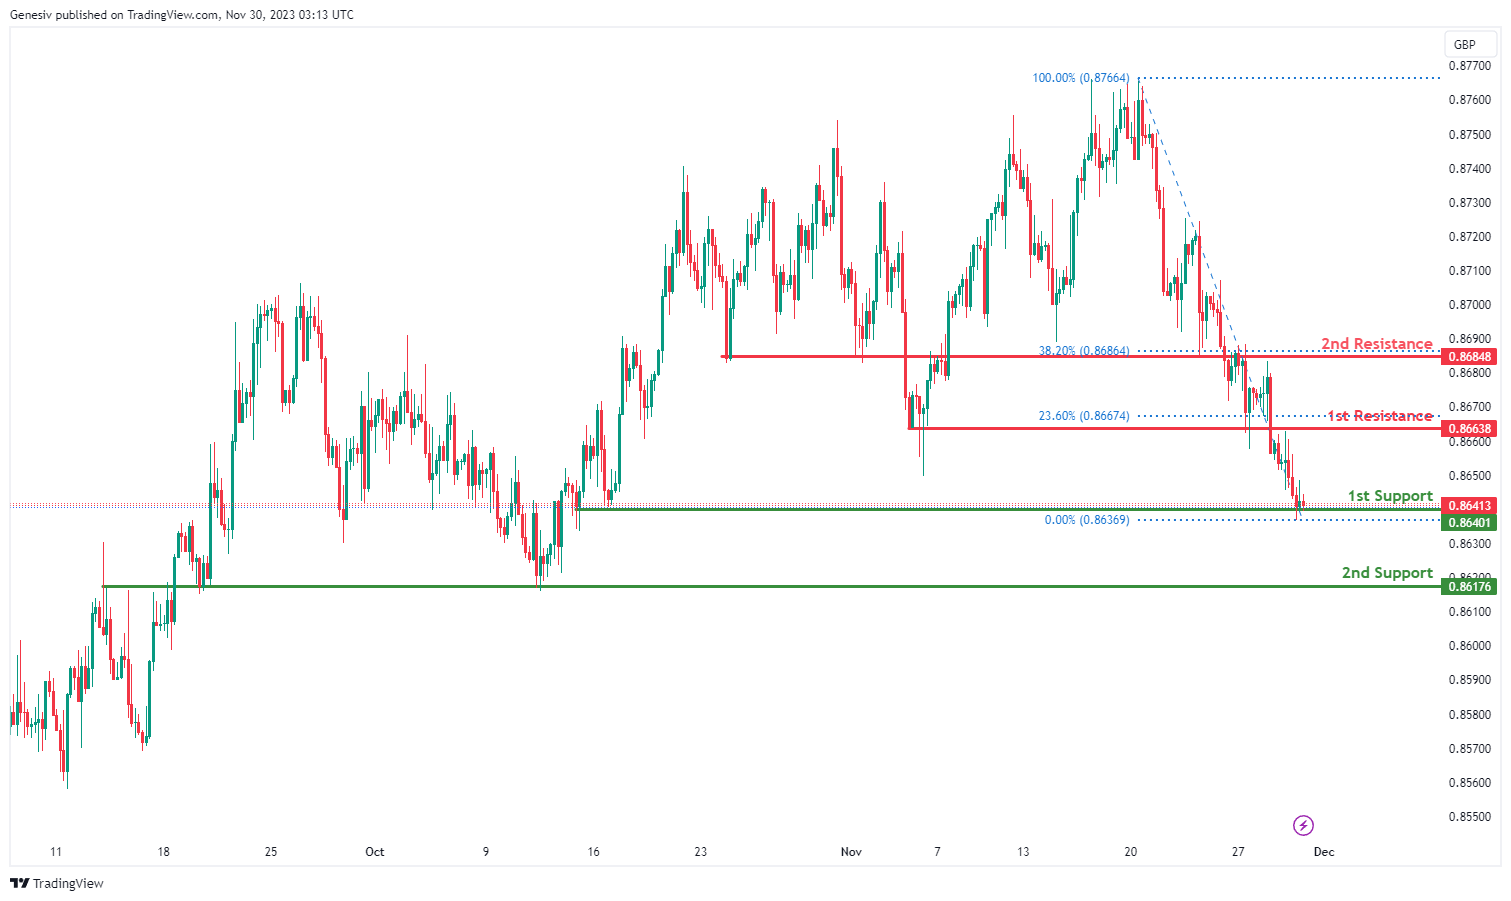
EUR/GBP:
The analyzed instrument is EUR/GBP, and the overall momentum of the chart is currently bullish.
There is a potential for the price to make a bullish bounce off the 1st support and head towards the 1st resistance.
The 1st support level is identified at 0.8640, and its favorable characteristic is attributed to being a multi-swing low support.
The 2nd support level is situated at 0.8617, and its favorable aspect is derived from being an overlap support.
On the resistance side, the 1st resistance is positioned at 0.8663, and it is considered significant due to being a pullback resistance.
The 2nd resistance is located at 0.8684, and its significance is derived from being an overlap resistance.
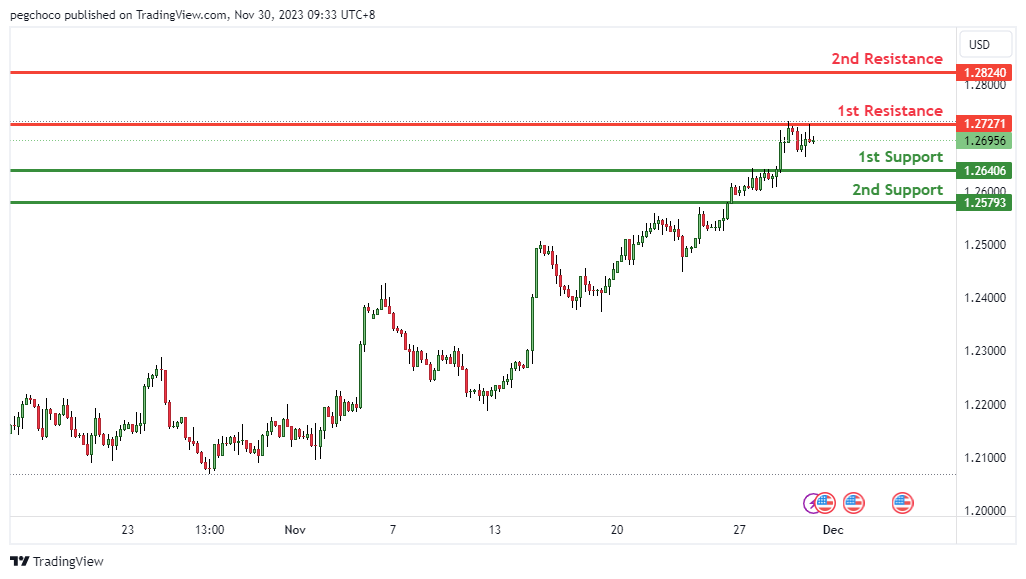
GBP/USD:
The GBP/USD, the overall momentum of the chart is neutral. In this scenario, there is a possibility that the Price could potentially fluctuate between the 1st resistance and 1st support level.
The 1st support at 1.264 is identified as a pullback support. This suggests that it’s a significant level where buying interest may emerge, providing support for the GBP/USD currency pair.
The 2nd support at 1.2579 is another overlap support level. This adds further significance to this support level, indicating it as a potential area where buyers might become active.
On the resistance side, the 1st resistance at 1.2727 is categorized as an overlap resistance. This suggests that it’s a significant barrier where selling interest could intensify, potentially limiting the upward movement for GBP/USD.
The 2nd resistance at 1.2824 is also noted as an overlap resistance, adding to the potential resistance factors for the currency pair.
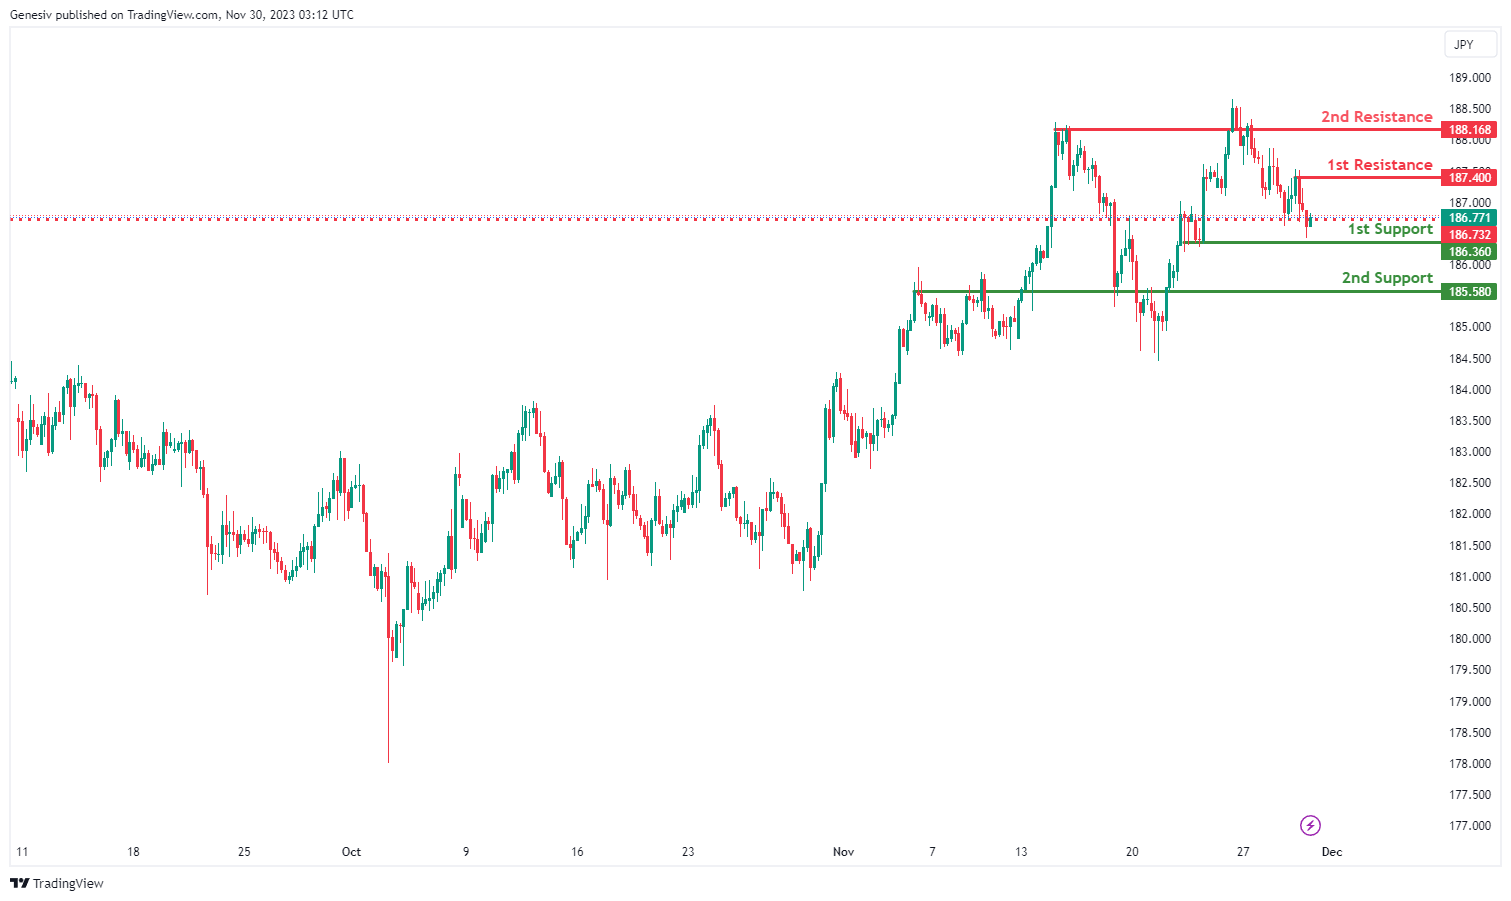
GBP/JPY:
The overall momentum of GBP/JPY is bearish, indicating a potential continuation of the downward movement in price. There is a possibility that the price could experience a bearish continuation towards the 1st support.
1st support at 186.78: This level is identified as a pullback support, suggesting that it has previously acted as a significant price level where buyers have shown interest. It’s a level to watch for potential bullish reactions or a temporary halt in the bearish momentum.
2nd support at 185.58: The 2nd support level is marked as multi-swing low support, indicating its importance as a potential area of buying interest. Traders may anticipate potential support around this level.
1st resistance at 187.40: This level is characterized as pullback resistance, suggesting that it could be a point where selling p
2nd resistance at 188.17: The 2nd resistance is also noted as pullback resistance, indicating that it’s a level where sellers might be more active in defending their positions.ressure may increase, potentially leading to a continuation of the bearish trend.
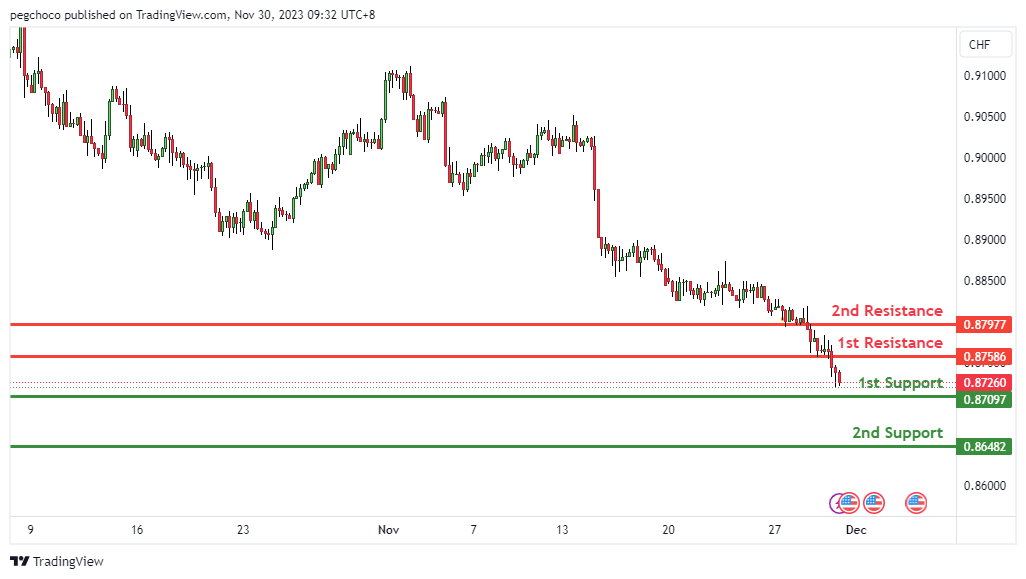
USD/CHF:
The USD/CHF, the overall momentum of the chart is bearish,suggesting a potential downward movement in price. In this scenario, there is a possibility that the price could potentially make a rise towards the 1st resistance in the short term before reversing off it and dropping towards the 1st support.
The 1st support at 0.8709 is identified as a multi-swing low support. This suggests that it’s a significant level where buying interest may emerge, providing support for the USD/CHF currency pair.
The 2nd support at 0.8709 is another support level identified as pullback support. This adds further significance to this support level, indicating it as a potential area where buyers might become active.
On the resistance side, the 1st resistance at 0.8758 is categorized as an overlap resistance. This suggests that it’s a significant barrier where selling interest could intensify, potentially acting as a barrier to further upward price movement for USD/CHF.
The 2nd resistance at 0.8797 is noted as a pullback resistance, indicating that it’s a level where selling pressure may increase, acting as another potential obstacle to the currency pair’s upward price movement.
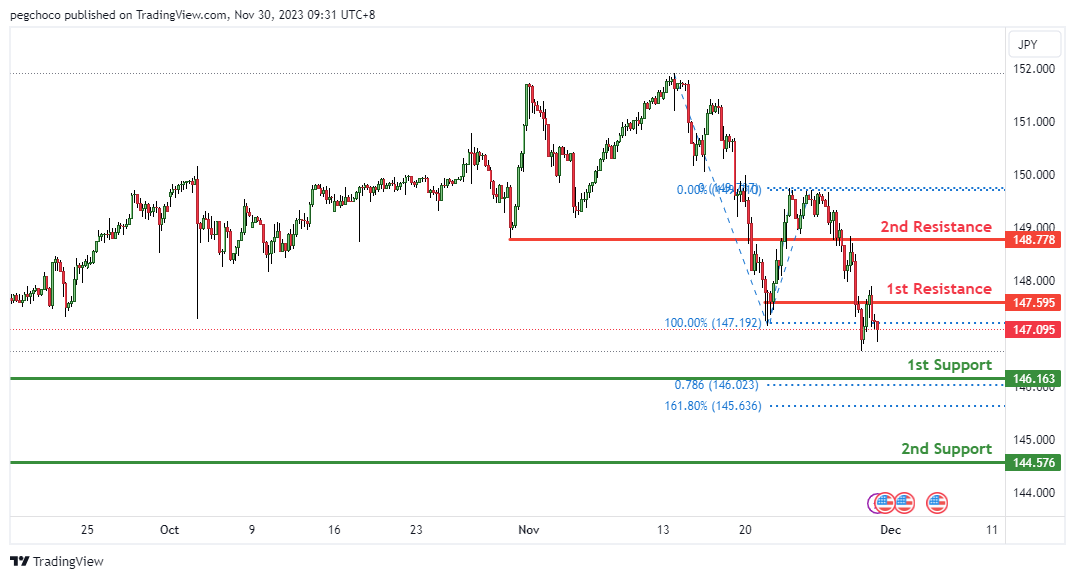
USD/JPY:
The USD/JPY, the overall momentum of the chart is bearish, indicating a downward trend, suggesting a potential downward movement in price. In this scenario, there is a possibility that the price could potentially make a bearish continuation towards the 1st support.
The 1st support at 146.16 is identified as a swing low support, and it also coincides with the 78.60% Fibonacci Projection. This suggests that it’s a significant level where buying interest may emerge, potentially providing support for the USD/JPY currency pair.
The 2nd support at 144.57 is another swing low support level. This adds further significance to this support level, indicating it as a potential area where buyers might become active.
On the resistance side, the 1st resistance at 147.59 is categorized as an overlap resistance. This suggests that it’s a significant barrier where selling interest could intensify, potentially limiting the upward movement for USD/JPY.
The 2nd resistance at 148.77 is also noted as an overlap resistance, adding to the potential resistance factors for the currency pair.
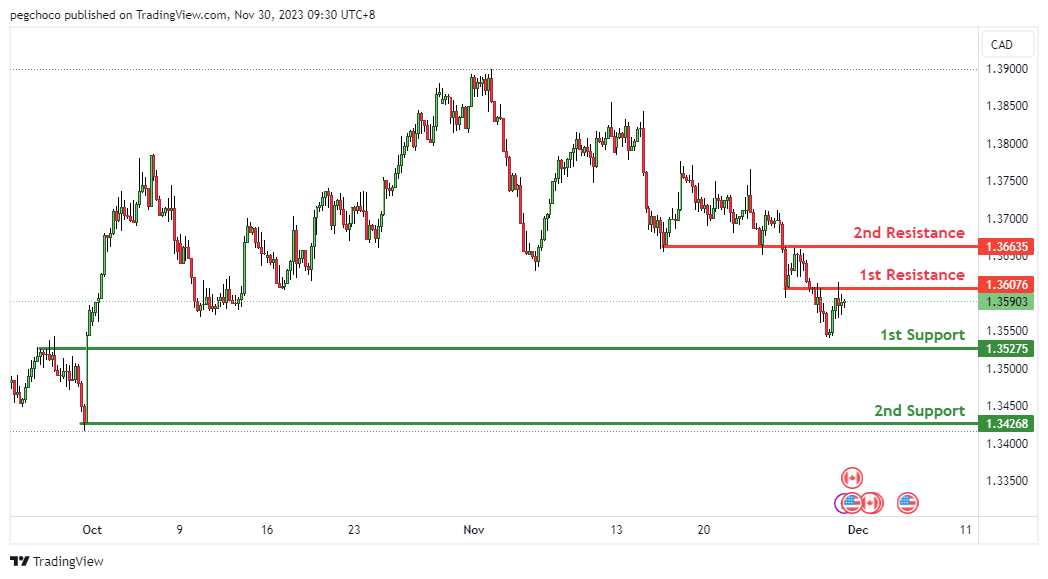
USD/CAD:
The USD/CAD, the overall momentum of the chart is currently bearish, suggesting a potential downward movement in price. In this scenario, there is a possibility that the price could potentially make a bearish continuation towards the 1st support.
The 1st support at 1.3527 is identified as a pullback support. This suggests that it’s a significant level where buying interest may emerge, providing support for the USD/CAD currency pair.
The 2nd support at 1.3426 is another support level identified as a swing low support. This adds further significance to this support level, indicating it as a potential area where buyers might become active.
On the resistance side, the 1st resistance at 1.3607 is categorized as an overlap resistance. This implies that it’s a significant barrier where selling interest could intensify, potentially limiting the upward movement for USD/CAD.
The 2nd resistance at 1.3663 is also noted as an overlap resistance, adding to the potential resistance factors for the currency pair.
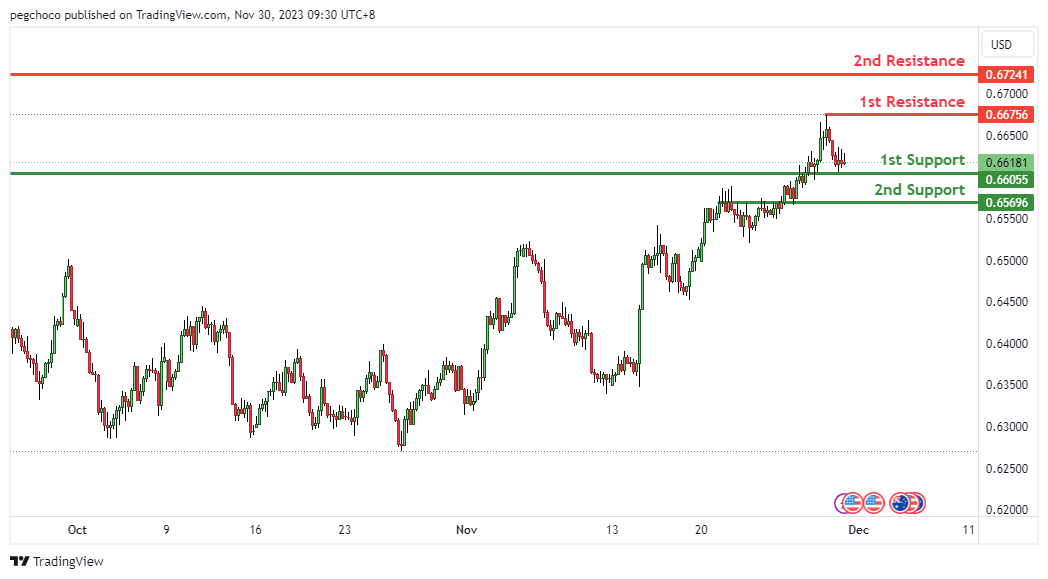
AUD/USD:
AUD/USD, the overall momentum of the chart is currently bullish, suggesting a potential upward movement in price. In this scenario, there is a possibility that the price could potentially make a bullish continuation towards the 1st resistance.
The 1st support at 0.6605 is identified as an overlap support. This suggests that it’s a significant level where buying interest may emerge, providing support for the AUD/USD currency pair.
The 2nd support at 0.6690 is another overlap support level. This adds further significance to this support level, indicating it as a potential area where buyers might become active.
On the resistance side, the 1st resistance at 0.6675 is categorized as a swing high resistance. This implies that it’s a significant barrier where selling interest could intensify, potentially limiting the upward movement for AUD/USD.
The 2nd resistance at 0.6724 is also noted as an overlap resistance, adding to the potential resistance factors for the currency pair.
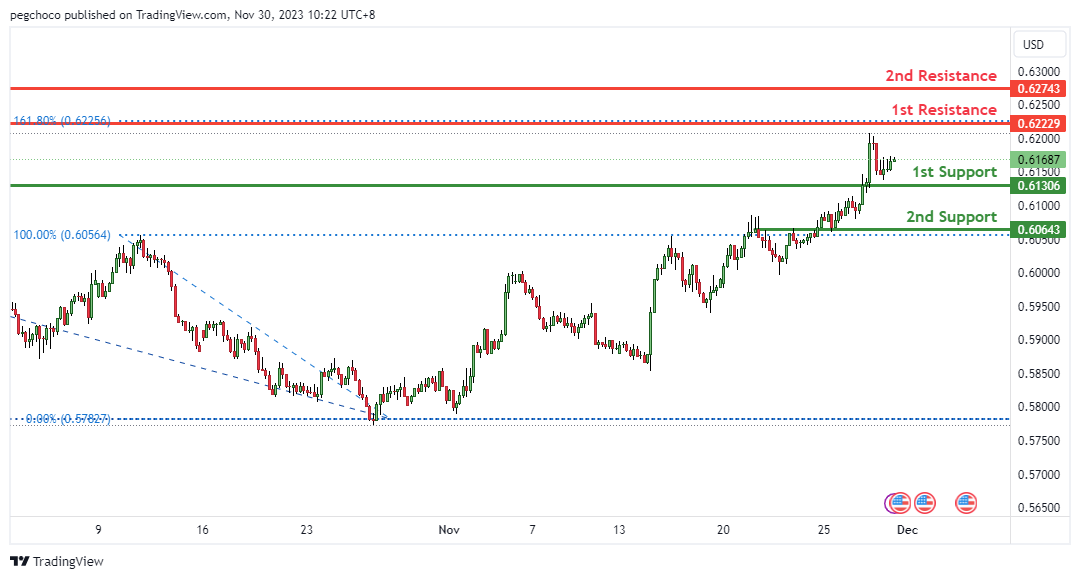
NZD/USD
The NZD/USD, the overall momentum of the chart is currently bullish, indicating a potential upward movement in the price. In this scenario, there is a possibility that the price could potentially make a bullish continuation towards the 1st resistance.
The 1st support at 0.6130 is identified as an overlap support. This suggests that it’s a significant level where buying interest may emerge, providing support for the NZD/USD currency pair.
The 2nd support at 0.6064 is another overlap support level. This adds further significance to this support level, indicating it as a potential area where buyers might become active.
On the resistance side, the 1st resistance at 0.6274 is categorized as a swing high resistance. This implies that it’s a significant barrier where selling interest could intensify, potentially limiting the upward movement for NZD/USD.
Additionally, there is a 2nd resistance at 0.6232, identified as an overlap resistance, further reinforcing the potential resistance factors for the currency pair.
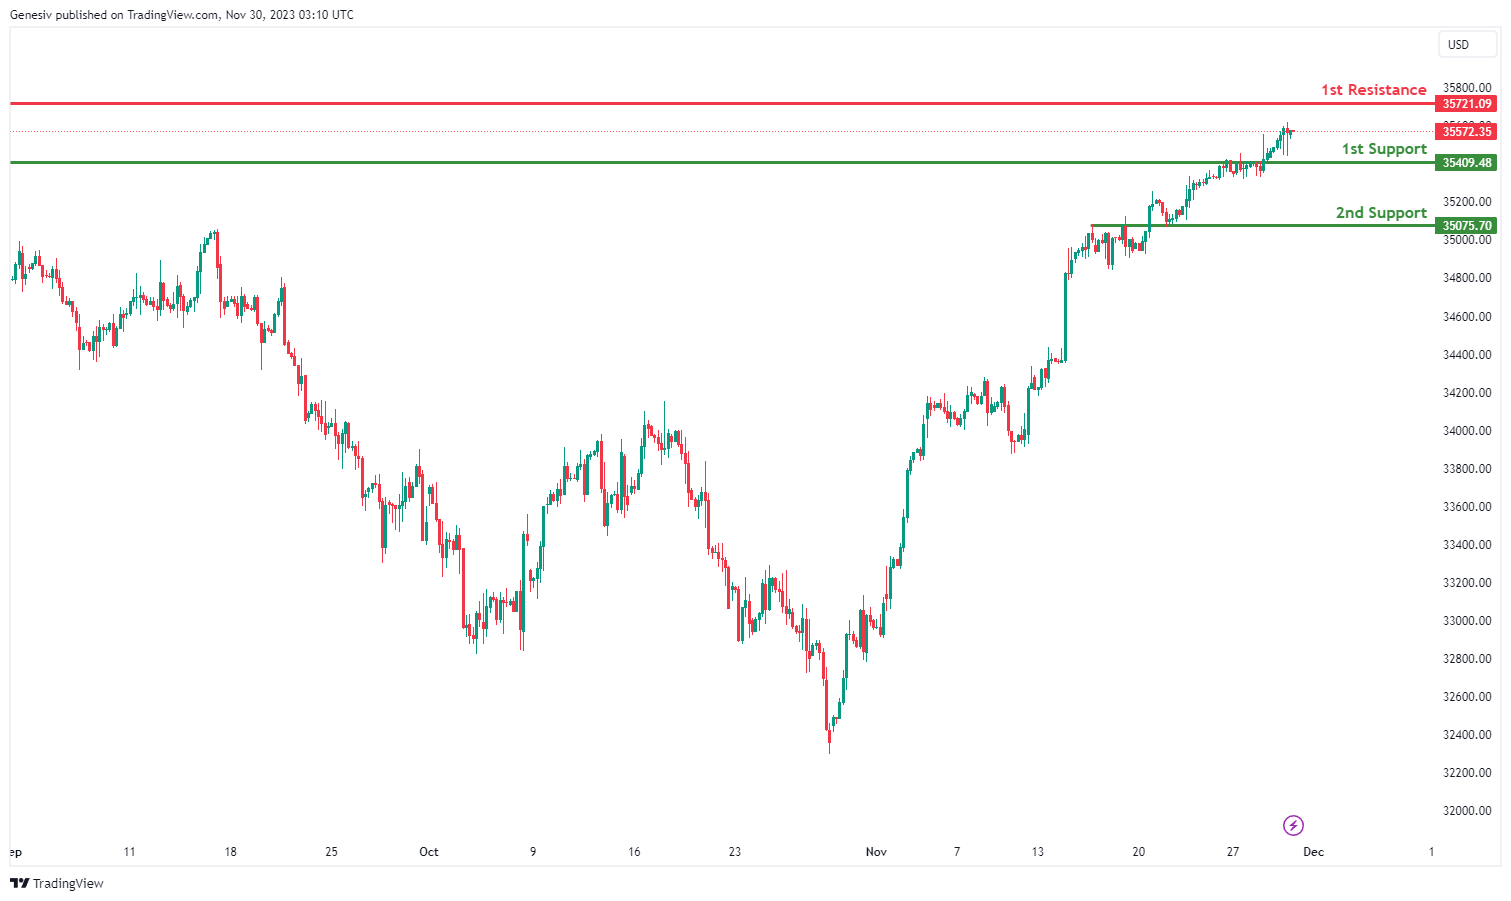
DJ30:
The DJ30,the momentum of the chart is bullish, suggesting a potential continuation of the upward movement in price. There is a possibility that the price could experience a bullish bounce off the 1st support level and head towards the 1st resistance.
1st support at 35409.48: This level is identified as a multi-swing low support, indicating that it has previously acted as a significant price level where buyers have stepped in. It is a level to watch for potential bullish reactions or a temporary pause in the upward momentum.
2nd support at 35075.70: The 2nd support level is marked as an overlap support, suggesting that it aligns with historical price data and is likely to be a strong support level. Traders may anticipate strong buying interest around this level.
1st resistance at 35721.09: This level is considered a pullback resistance, indicating that it could be a point where selling pressure may increase, potentially leading to a temporary halt or correction in the bullish trend.
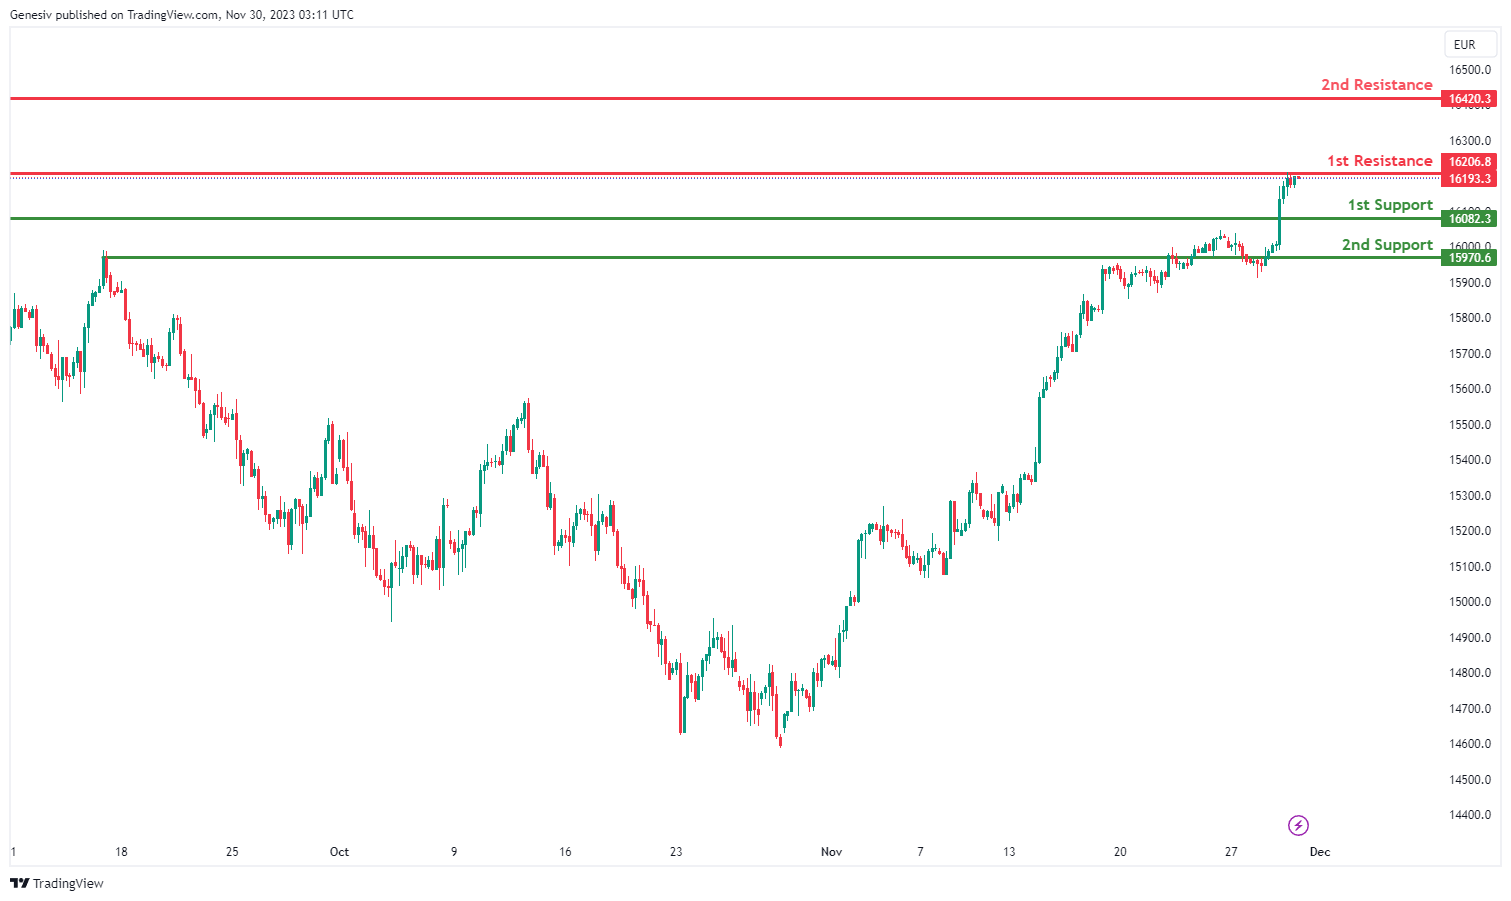
GER40:
The GER40 overall momentum is bearish, suggesting a potential continuation of the downward movement in price. There is a possibility that the price could experience a bearish continuation towards the 1st support.
1st support at 16082.3: This level is identified as a swing low support, indicating that it has previously acted as a significant price level where buyers have shown interest. Traders may anticipate potential buying interest or a temporary pause in the downward momentum around this level.
2nd support at 15970.6: The 2nd support level is marked as a multi-swing low support, suggesting that it aligns with historical price data and is likely to be a strong support level. It may serve as a critical level for traders to watch for potential rebounds or consolidation.
1st resistance at 16206.8: This level is considered a pullback resistance, indicating that it could be a point where selling pressure may increase, potentially leading to a temporary halt or correction in the bearish trend.
2nd resistance at 16420.3: The 2nd resistance level is marked as a swing high resistance, suggesting it has previously acted as a barrier to upward price movements. It could serve as a strong resistance level if the price attempts to move higher.
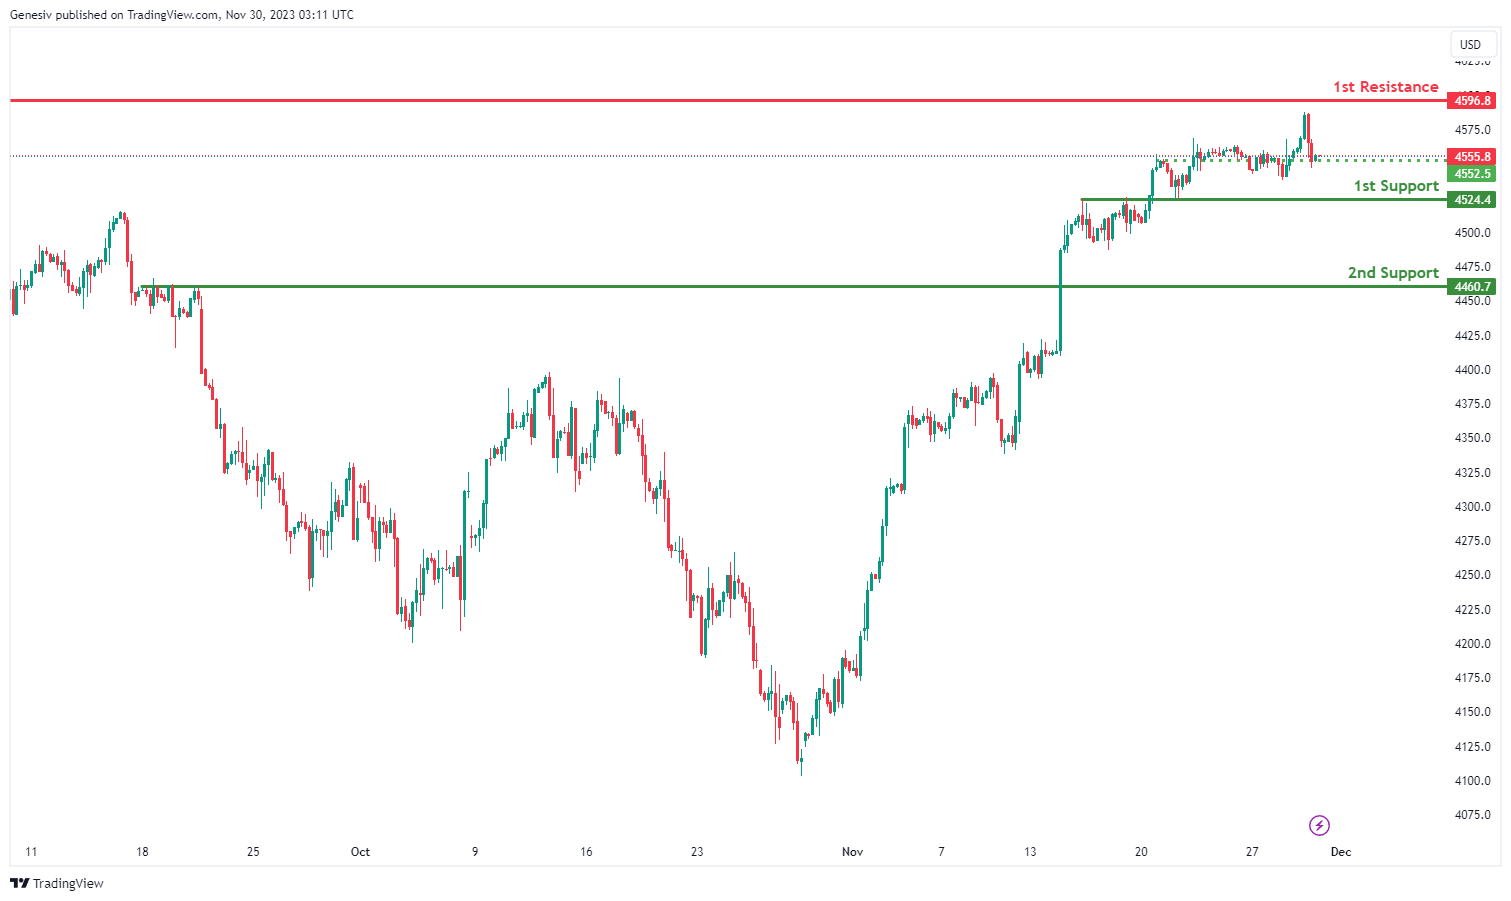
US500:
The overall momentum of US500 is weakly bearish with low confidence. There is a potential for a bearish continuation, but the confidence in this bearish move is low.
1st support at 4524.4: This level is identified as an overlap support, indicating that it has previously acted as a significant price level where buyers have shown interest. It may serve as a potential area of support where traders might look for buying opportunities or expect a temporary halt in the downward movement.
2nd support at 4460.7: The 2nd support level is marked as a multi-swing low support, suggesting that it aligns with historical price data and is likely to be a strong support level. It may be considered a critical level for traders to watch for potential rebounds or consolidation.
1st resistance at 4596.8: This level is considered a pullback resistance, indicating that it could be a point where selling pressure may increase, potentially leading to a temporary correction within the bearish trend.
Intermediate support at 4553.3: This level is marked as pullback support, indicating that it may provide support during a potential pullback or correction. Traders might monitor this level for potential buying opportunities.
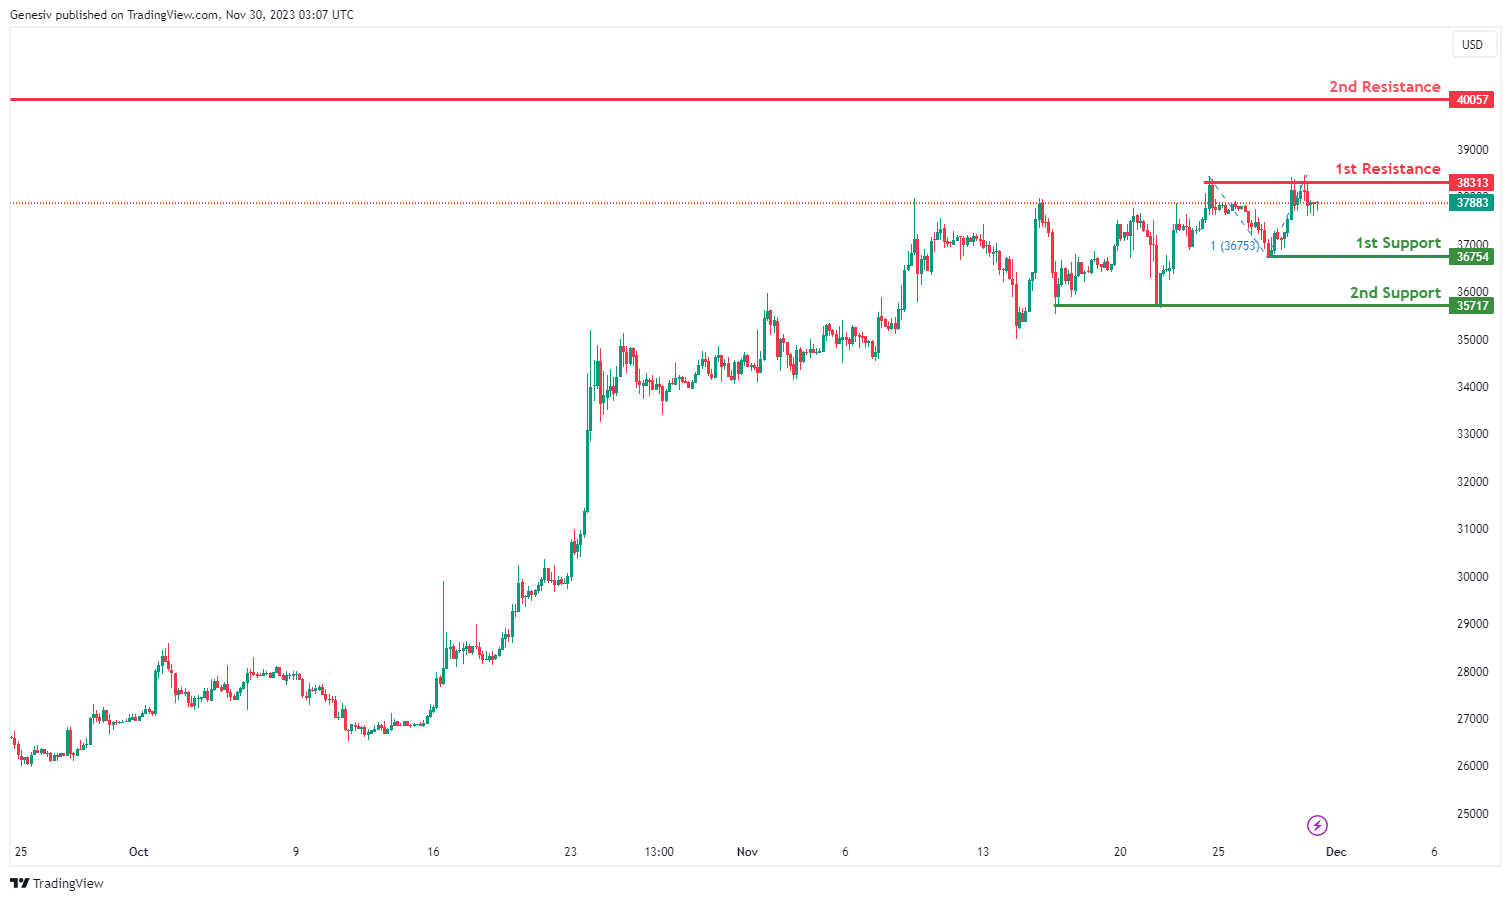
BTC/USD:
The analyzed instrument is BTC/USD, and the overall momentum of the chart is currently bearish.
There is a potential for the price to make a bearish continuation towards the 1st support.
The 1st support level is identified at 36754, and its favorable characteristic is attributed to being a swing low support, coinciding with the 100% Fibonacci Projection.
The 2nd support level is situated at 35717, and its favorable aspect is derived from being a multi-swing low support.
On the resistance side, the 1st resistance is positioned at 38313, and it is considered significant due to being a multi-swing high resistance.
The 2nd resistance is located at 40057, and its significance is derived from being a swing high resistance.
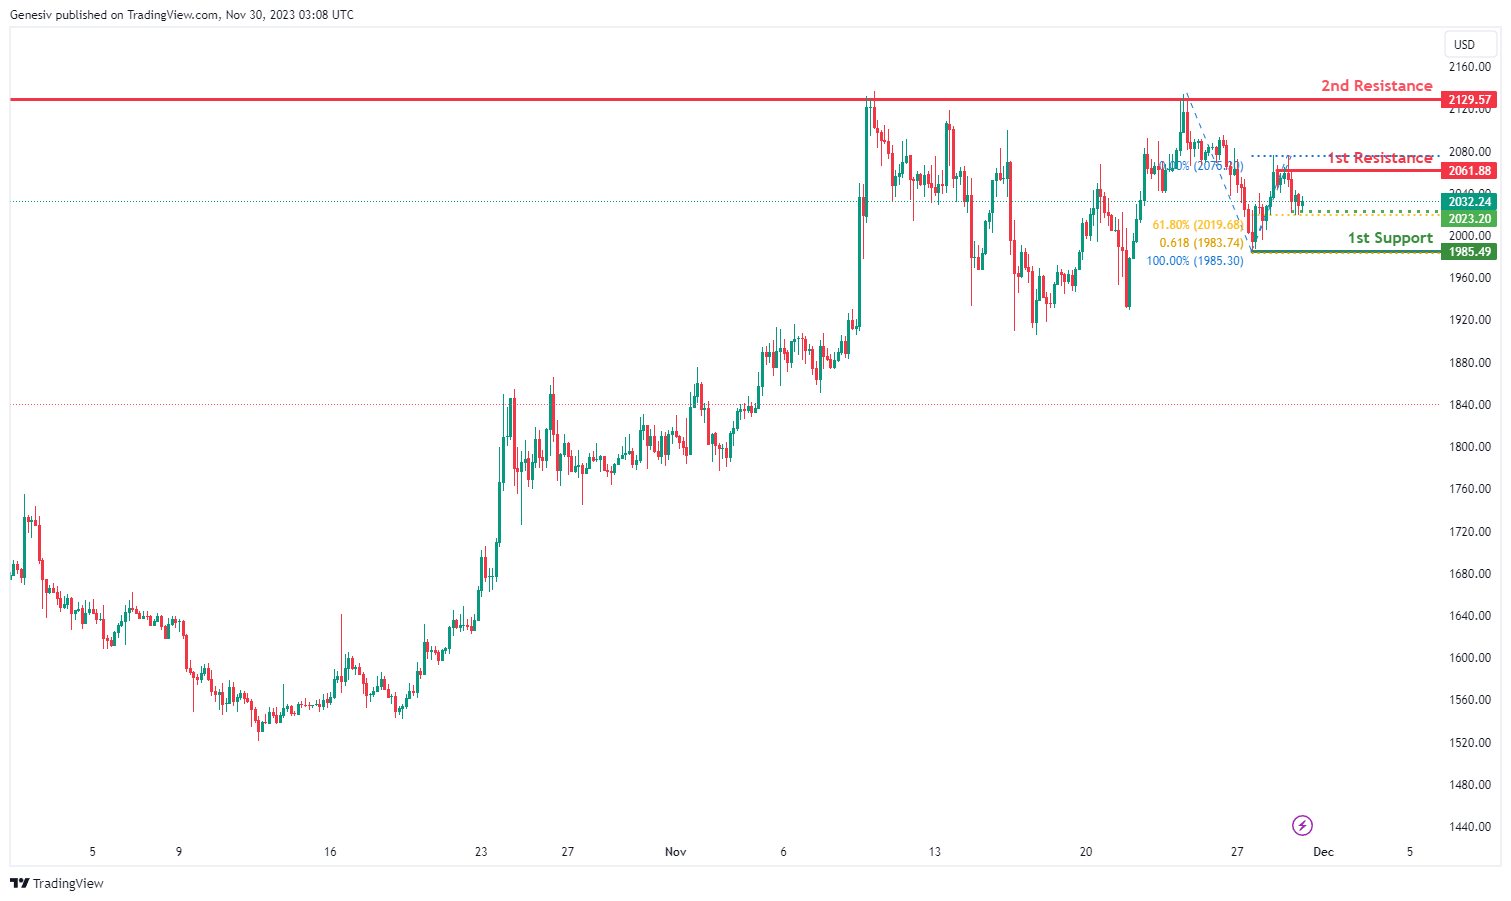
ETH/USD:
The analyzed instrument is ETH/USD, and the overall momentum of the chart is currently bearish.
There is a potential for the price to make a bearish continuation towards the 1st support.
The 1st support level is identified at 1985.49, and its favorable characteristic is attributed to being a swing low support, coinciding with the 61.80% Fibonacci Projection.
An intermediate support is also noted at 2023.20, and its significance is derived from being a swing low support, aligning with the 61.80% Fibonacci Retracement.
On the resistance side, the 1st resistance is positioned at 2061.88, and it is considered significant due to being a swing high resistance.
The 2nd resistance is located at 2129.57, and its significance is derived from being a multi-swing high resistance.
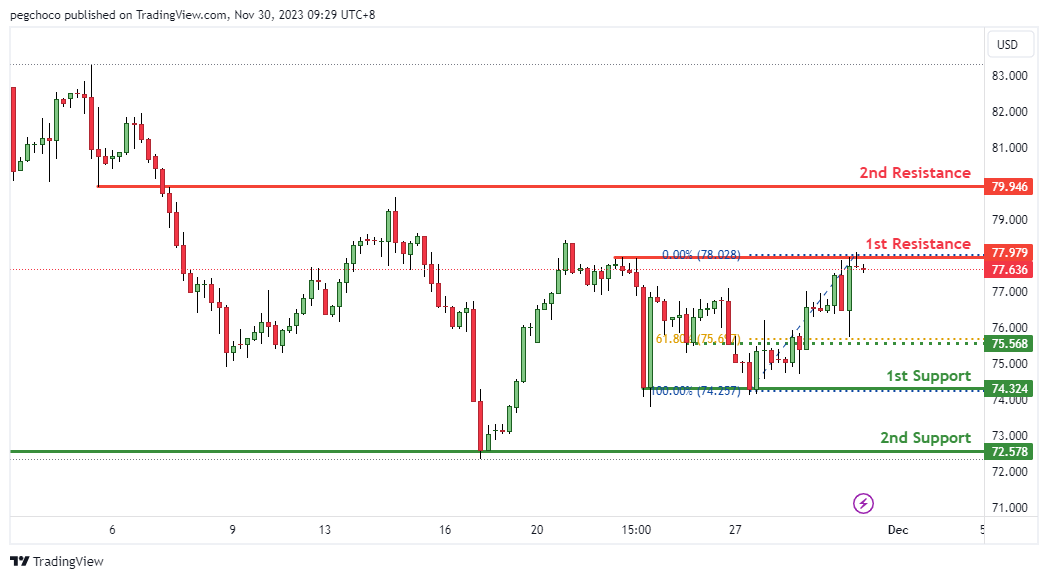
WTI/USD:
The WTI (West Texas Intermediate) crude oil, the overall momentum of the chart is bearish, In this scenario, there is a possibility that the price could potentially make a bearish continuation towards the 1st support.
The 1st support at 74.32 is identified as a multi-swing low support. This suggests that it’s a significant level where buying interest may emerge, potentially providing support for the WTI crude oil market.
The 2nd support at 72.57 is another support level identified as an overlap support. This adds further significance to this support level, indicating it as a potential area where buyers might become active.
On the resistance side, the 1st resistance at 77.97 is categorized as a multi-swing high resistance. This implies that it’s a level where selling pressure may increase, acting as a potential barrier to further upward price movement for WTI crude oil.
The 2nd resistance at 79.94 is noted as a pullback resistance, indicating that it’s a level where selling interest could intensify, potentially limiting the upward movement for the commodity.
Additionally, there is an intermediate support at 75.56, identified as an overlap support and coinciding with the 61.80% Fibonacci Retracement. This reinforces the potential support factors for the commodity.
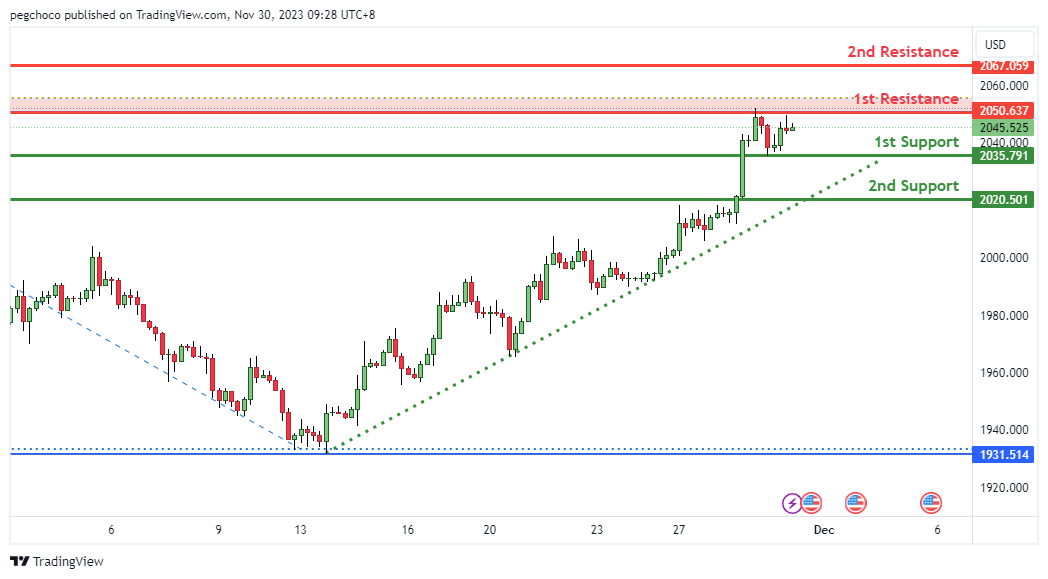
XAU/USD (GOLD):
The XAU/USD, the overall momentum of the chart is neutrall, In this scenario, there is a possibility that the price could potentially fluctuate between the 1st resistance and 1st support level.
The 1st support at 2035.79 is identified as an overlap support. This suggests that it’s a significant level where buying interest may emerge, providing support for the Gold market.
The 2nd support at 2020.50 is another support level identified as pullback support. This adds further significance to this support level, indicating it as a potential area where buyers might become active.
On the resistance side, the 1st resistance at 2050.63 is categorized as a swing high resistance, and it also coincides with the 61.80% Fibonacci Projection. This dual significance suggests that it’s a significant barrier where selling interest could intensify, potentially limiting the upward movement for Gold.
The 2nd resistance at 2067.05 is noted as a multi-swing high resistance, indicating another potential obstacle for the precious metal’s upward price movement.
Gold Price Rally Pauses But Not Likely Over
Key Highlights
- Gold prices rallied over the $2,000 and $2,020 resistance levels.
- A key bullish trend line is forming with support near $2,025 on the 4-hour chart.
- Crude oil prices are attempting a recovery wave from the $72.00 zone.
- EUR/USD climbed above the 1.1000 level before the bears appeared.
Gold Price Technical Analysis
Gold remained in a positive zone above the $1,965 level. There was a steady increase above the $1,980 and $1,985 resistance levels to start a fresh rally.
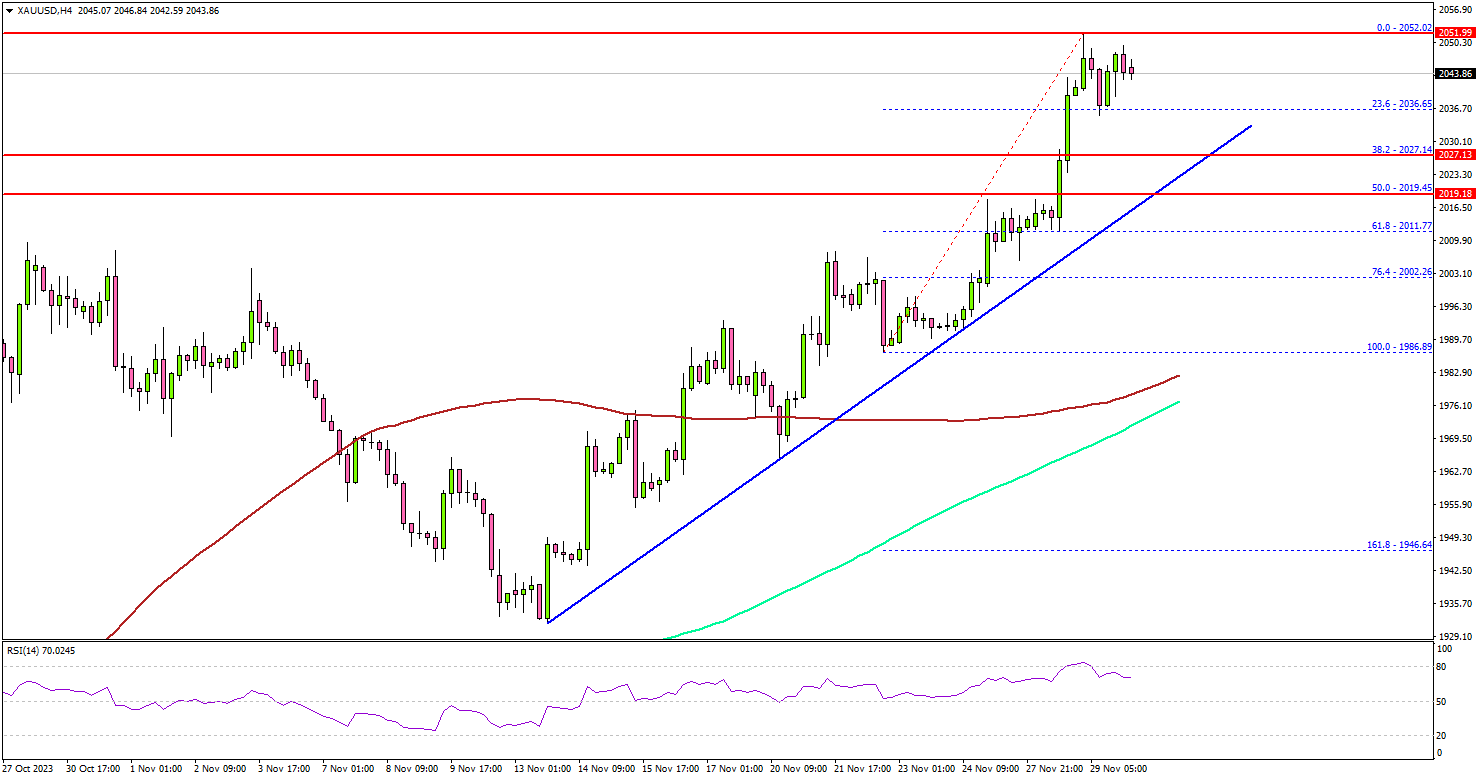
The 4-hour chart of XAU/USD indicates that the price surged above the $2,000 and $2,020 resistance levels. The price even settled above $2,000, the 100 Simple Moving Average (red, 4 hours), and 200 Simple Moving Average (green, 4 hours).
Finally, the price tested the $2,050 resistance zone. If the bulls remain in action, the price could rise further toward the $2,062 level.
An upside break above the $2,062 level could send the price soaring toward the $2,080 resistance. The next major resistance is near the $2,088 level, above which Gold could test $2,100.
On the downside, the first major support is near the $2,032 level. The main support sits near the $2,025 level. There is also a key bullish trend line forming with support near $2,025 on the same chart. Any more losses might call for a move toward the $2,000 level.
Looking at crude oil prices, the bulls appeared near the $72 zone and the price is now attempting a recovery wave.
Economic Releases to Watch Today
- US Initial Jobless Claims - Forecast 220K, versus 209K previous.
- US Pending Home Sales for Oct 2023 (YoY) - Forecast -2.0%, versus 1.1% previous.
- Canadian GDP for Q3 2023 (Annualized) – Forecast +0.2%, versus -0.2% previous.
BoJ’s Nakamura: More time needed before altering ultra-easy monetary stance
BoJ board member Toyoaki Nakamura, in a speech to business leaders today, emphasized that Japan has not yet reached a point where it can confidently assert that the sustained and stable achievement of BoJ's 2% inflation target, along with corresponding wage growth, is within reach. He added that the current inflation in Japan is primarily driven by "cost-push factors".
In light of this assessment, he said BoJ "must patiently maintain current monetary easing for the time being." Some more time is needed before adjusting the policy.
Nevertheless, Nakamura expressed a positive outlook on Japan's economy, describing it as recovering moderately. He also anticipates that this moderate recovery will be accompanied by increases in wages, which could play a crucial role in sustaining economic growth and achieving the inflation target.
China’s manufacturing PMI slips further to 49.4, indicating continued contraction
China's NBS Manufacturing PMI slightly declined from 49.5 to 49.4 in November, marking the weakest reading since December 2022 and falling below market expectation of 49.6. This decline indicates that China's manufacturing sector has been struggling to maintain consistent growth, having been in contraction for five consecutive months since April, briefly returning to expansion in September, and then slipping back into contraction in October.
NBS statistician Zhao Qinghe attributed this downturn to several factors, including "traditional off-season" effects in some manufacturing industries and "insufficient market demand". This explanation points to both cyclical and demand-driven challenges impacting the manufacturing sector.
Within manufacturing PMI, there was a drop in new-orders subindex to 49.4 from 49.5, further reflecting the demand-side struggles. Additionally, new-export-orders subindex fell to 46.3, down from 46.8, indicating challenges in external markets and potentially reflecting global economic conditions.
PMI Non-Manufacturing also witnessed a decrease, moving from 50.6 to 50.2, which was below expected 51.1. However, within the non-manufacturing PMI, construction subindex showed an improvement, rising to 55 from 53.5. The official composite PMI, which combines both manufacturing and services, fell to 50.4 from 50.7.
Japan’s mixed economic signals: Industrial production up, retail sales growth slows
Japan's economy presents a mixed picture based on the latest data for October 2023. Industrial production saw a notable increase, rising 1.0% mom, exceeding expectations of a 0.7% increase.
However, manufacturers surveyed by Japan's Ministry of Economy, Trade and Industry have a mixed outlook. They expect industrial output to decrease by -0.3% mom in November but anticipate a significant climb of 3.2% mom in December. This forecast points to short-term fluctuations but overall optimism towards the year's end.
In contrast to the industrial sector, retail sales figures were less encouraging. Retail sales in October rose by 4.2% yoy, falling short of the expected 5.9% yoy increase. Despite this slower growth, retail sales have continued to mark annual gains for 20 consecutive months.
However, a month-over-month analysis reveals a downturn, with retail sales falling by -1.6% in October from September, ending a three-month streak of gains.
NZ ANZ business confidence jumps to 30.8, but inflation concerns remain
ANZ Business Confidence in New Zealand saw a significant increase in November, reaching its highest level since March 2015, as it rose from 23.4 to 30.8. Additionally, Own Activity Outlook improved from 23.1 to 26.3.
ANZ's analysis said the results support the idea of "soft landing" for New Zealand economy. However, ANZ points out that it's still uncertain if this slowdown will be adequate to reduce inflation to target level quickly enough.
The survey also revealed varied trends across different economic indicators. Export intentions saw an uptick from 6.1 to 9.2, indicating stronger future export plans. Investment intentions also increased marginally from 3.8 to 4.5. In contrast, employment intentions experienced a slight decrease from 5.6 to 5.4, suggesting a small dip in hiring plans.
Notably, cost expectations showed a decrease from 76.0 to 73.9, which could signal easing cost pressures. Profit expectations reversed from a negative -5.6 to a positive 1.5, reflecting an improved outlook for business profitability.
The report presented a mixed view of inflation indicators. Inflation expectations continued their downward trajectory, moving from 4.94% to 4.79%. However, pricing intentions rose slightly from 46.3 to 46.8.
ANZ also commented on the market's expectations for RBNZ's OCR. They noted that while there is market anticipation for rate cuts, the current economic indicators, particularly some stalling in inflation measures and the overall robust level of activity, suggest that the RBNZ may not be inclined to lower rates soon.
Fed’s Beige Book: Activity slowdown, easing labor demand, moderating price pressures
The latest Fed's Beige Book report indicates general slowdown in economic activity, with variations across different regions. Specifically, four districts reported "modest growth", two districts experienced "flat to slightly down", and six districts observed "slight declines" in activity.
This mixed picture reflects the diverse economic conditions across the country and points to a cautious economic outlook for the next six to twelve months, which is perceived to have "diminished" during the reporting period.
In terms of labor market dynamics, demand for labor "continued to ease". Most districts reported either flat or modest increases in overall employment. Wage growth across most districts was characterized as "modest to moderate". Notably, the report highlights "easing in wage pressures", with several districts even reporting declines in starting wages. This trend could be a response to the overall economic slowdown and a signal of less competition for labor.
Regarding prices, the report notes a general moderation in price increases across districts, although prices remain at elevated levels. The expectation is for "moderate price increases to continue into next year".
Fed’s Mester: Monetary policy well-positioned following discernible progress on inflation
Cleveland Fed President Loretta Mester, in her remarks at a conference overnight, acknowledged that while inflation remains above Fed's 2% target, there has been "discernible progress" in controlling it, even as the "overall economy has remained relatively strong".
Mester expressed confidence in the current stance of monetary policy, stating, "Monetary policy is in a good place for policymakers to assess incoming information on the economy and financial conditions."
Highlighting the need for flexibility, Mester described the central bank's rate policy as needing to be "nimble," and she believes that "the current level of the funds rate positions us well to do that."
Mester did not rule out the possibility of further rate hikes, emphasizing that the decision to increase rates further and the duration for which the rate target remains high "will depend importantly on whether the economy is evolving as expected, how the risks are changing, and the progress being made on our dual mandate goals of price stability and maximum employment."
We Reaffirm Our View RBA Will hold in December, But February 2024 Meeting Still Live
The RBA revised up its near-term inflation forecast in November and delivered one of the “one to two” rate increases assumed in their forecasts. Not enough new information has come to hand since then to warrant delivering a second increase just yet. The monthly CPI indicator is volatile, but the October reading was a bit below expectations. The RBA is still ready to raise rates further if it sees further upside surprises on inflation. It has no tolerance for more delays in the return to the inflation target. So February is still live, but we don’t see them moving in December.
Today we reaffirm our view that the RBA is unlikely to raise the cash rate at its December meeting.
As described in the minutes of the November meeting, the staff forecasts were “predicated on there being an additional one to two increases in the cash rate over coming quarters”. The peak in rates assumed in the forecasts is “around 4½ per cent” according to the RBA’s latest Statement on Monetary Policy (SMP). One of these increases was already delivered following the November meeting. The question the RBA will be grappling with in coming months is what they need to see to turn one-and-a-half into two.
As outlined in Senior Economist Justin Smirk’s note on the monthly CPI indicator yesterday, inflation in October in fact surprised a little on the downside. These data are noisy and neither the RBA nor we take full signal from a single monthly reading. Some of the biggest downside misses, such as for holiday travel, could reverse out. Moreover, most of the services components – which have been such a source of concern to the RBA – are not included in the first month of the quarter. We will not know how these are tracking until the November and December releases.
That said, there were some pleasing signs in prices of some goods. While the RBA has characterised the disinflation in goods prices as in line with its expectations, it is worth noting that the Bank’s forecasts assume that global goods inflation declines as supply chains recover, but that global goods prices do not fall much in absolute terms. Indeed, the SMP has for the past several quarters briefly outlined a scenario where one-third of the pandemic-era run-up in prices does reverse. In that scenario, inflation returns to target next year, not in 2025. Given that producer price indices are in fact falling in a range of economies, there is a reasonable chance that this downside scenario plays out to some extent. The appreciation in the Australian dollar since the November meeting is also helpful in tempering the material upside risks to domestic inflation with a bit of downside risk around imported price inflation.
The other data released since the November Board meeting have also not provided enough of an upside signal to warrant moving in December. October retail sales were soft; unemployment and underemployment are drifting up as expected; and business surveys are pointing to price pressures easing from high levels. While employment growth was strong in the month, it has been volatile and affected by the rapid cycle in population growth. Measures expressed as ratios, such as the unemployment rate, participation rate and employment-to-population ratio, provide a better signal in these circumstances. These data have been playing out broadly in line with the RBA’s forecasts. Together with the downward revision in the RBA’s wages forecasts, we do not see an upside surprise on inflation – and so a reason for the RBA Board to move again this month – coming from this source.
Ahead of the October CPI release, RBA Governor Bullock had been strengthening the rhetoric about inflation risks. This could be construed as softening the public up for planned future rate increases. A more likely interpretation is that the Governor has been both seeking to explain the rate increase that has already occurred and signalling that further increases would occur if inflation were to decline more slowly than the RBA intends. As we have noted earlier, the RBA has been surprised on the high side by recent inflation data. If the Board really thought that further increases beyond November were a certainty, though, they would not have agreed to changing the language in the November media release, SMP and minutes to read “Whether further tightening of monetary policy is required…”. This was a notable shift from the previous phrasing of “Some further tightening of monetary policy may be required”.
By the time of the February meeting, the RBA will have the full December quarter inflation data as well as the September quarter national accounts and other key data. We reaffirm our view that the RBA Board would raise the cash rate at that meeting if it sees further upside surprises to inflation or fresh evidence suggesting that inflation will decline more slowly than it intends. If things play out broadly in line with their forecasts, though, further moves would be harder to justify. In that case, it would be likely that the RBA would hold the cash rate steady. Currently we believe this is the more likely outcome.