
Sample Category Title
GBP/USD Mid-Day Outlook
Daily Pivots: (S1) 1.2631; (P) 1.2673; (R1) 1.2739; More...
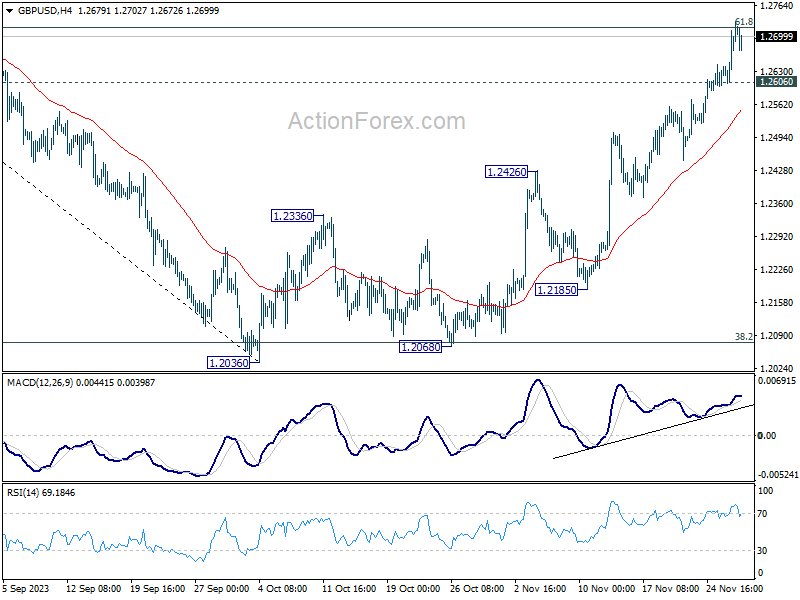
Intraday bias in GBP/USD remains on the upside at this point. Sustained trading above 61.8% retracement of 1.3141 to 1.2036 at 1.2716 will pave the way to retest 1.3141 high. On the downside, below 1.2606 minor support will turn bias neutral and bring consolidations first. But further rally will remain in favor as long as 1.2426 resistance turned support holds.
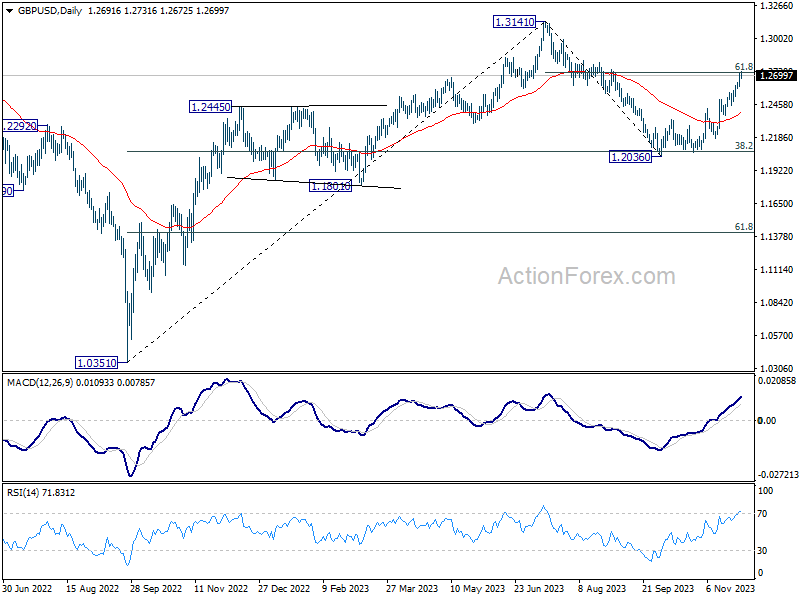
In the bigger picture, price actions from 1.3141 are seen as a corrective pattern to rise from 1.0351 (2022 low). Strong rebound from 38.2% retracement of 1.0351 (2022 low) to 1.3141 at 1.2075 suggests that current rise from 1.2036 is already the second leg. However, while further rally could be seen, upside should be limited by 1.3141 to bring the third leg of the pattern.
USD/CHF Mid-Day Outlook
Daily Pivots: (S1) 0.8756; (P) 0.8787; (R1) 0.8813; More....
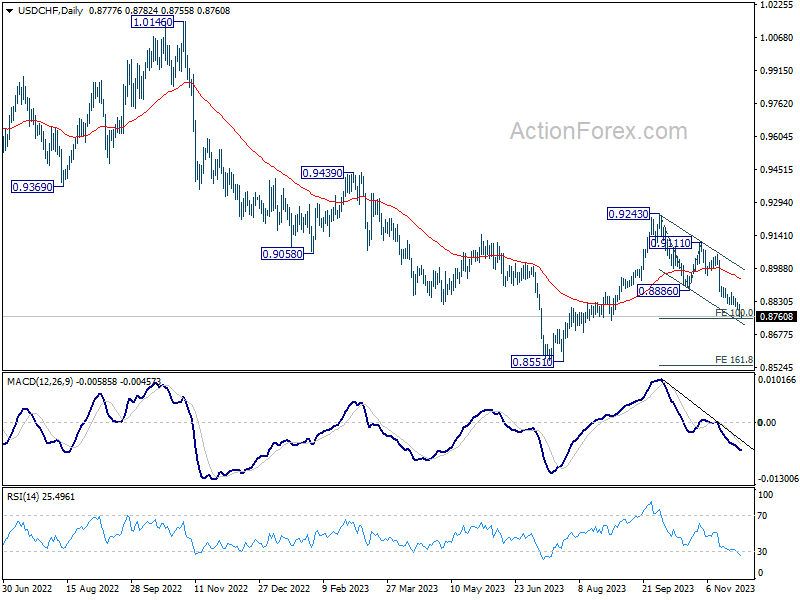
Intraday bias in USD/CHF stays on the downside and outlook is unchanged. Firm break of 100% projection of 0.9243 to 0.8886 from 0.9111 at 0.8754 will target 161.8% projection at 0.8533, which is close to 0.8551 low. On the upside, above 0.8817 minor resistance will turn intraday bias neutral first. But risk will stay on the downside as long as 0.8886 support turned resistance holds.
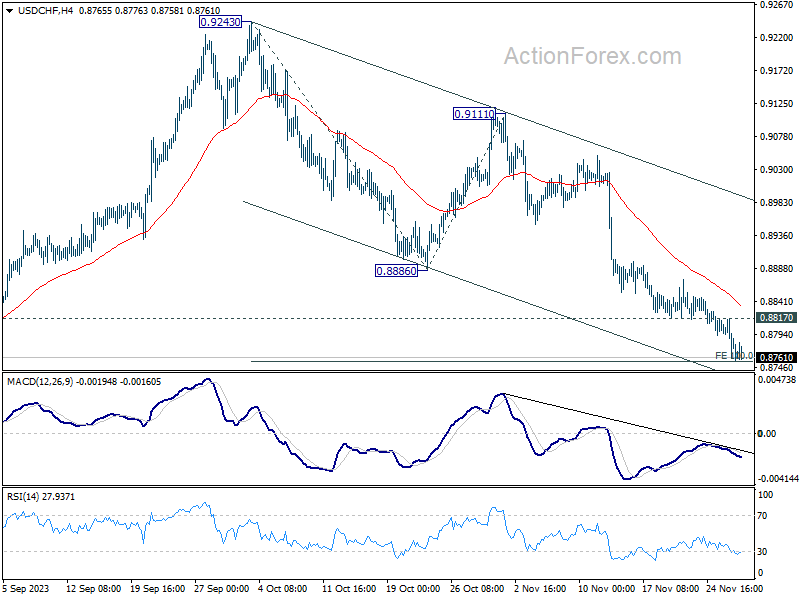
In the bigger picture, price actions from 0.8551 are currently seen as part of a corrective pattern to the decline from 1.0146 (2022 high). Fall from 0.9243 is seen as the second leg for now. Deeper decline could be seen to 0.8551 low but strong support should be seen there to bring rebound. For now, this will remain the favored case as long as 0.8886 resistance holds.
USD/JPY Mid-Day Outlook
Daily Pivots: (S1) 146.92; (P) 147.87; (R1) 148.43; More...
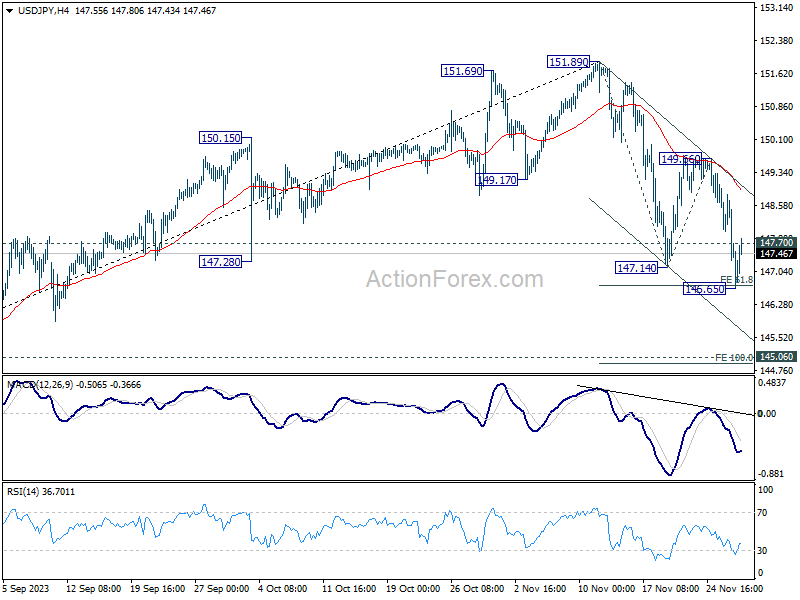
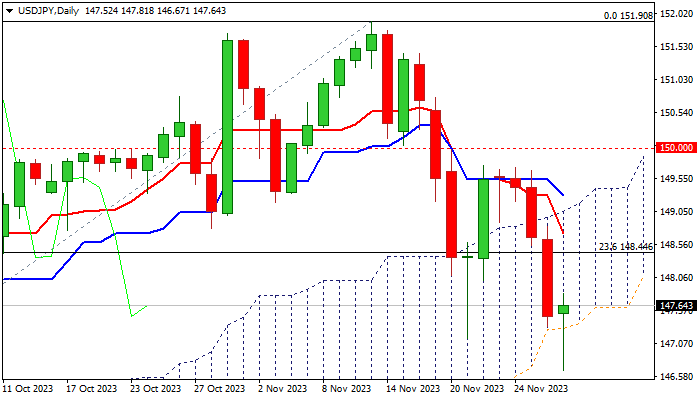
Intraday bias in USD/JPY is turned neutral with breach of 147.70 minor resistance. Some consolidations could be seen, but risk will stay on the downside as long as 149.66 resistance holds. Below 146.65 will resume the fall from 151.89 to 100% projection of 151.89 to 147.14 from 149.66 at 144.91, which is close to 145.06 key resistance turned support.
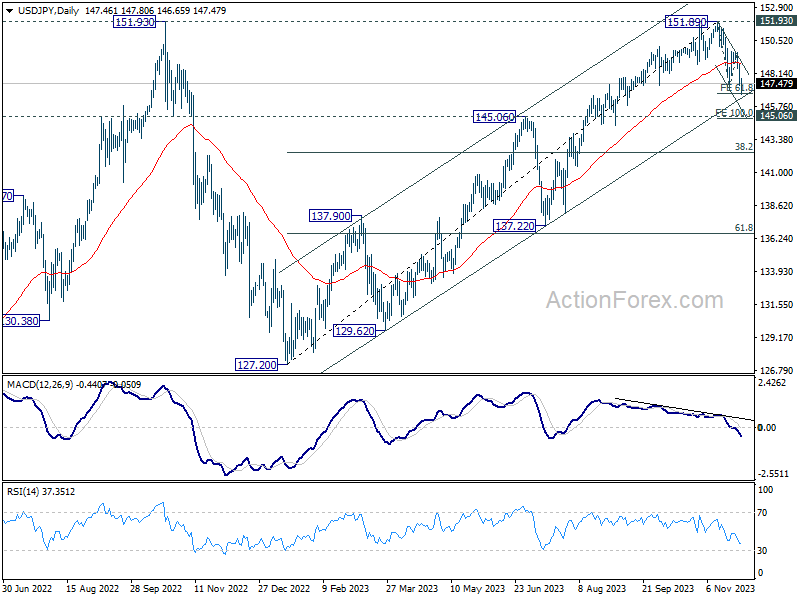
In the bigger picture, rise from 127.20 (2023 low) is seen as the second leg of the pattern from 151.93 (2022 high). Decisive break of 145.06 resistance turned support will confirm that this second leg has completed, after rejection by 151.93. Deeper fall would be seen through 38.2% retracement of 127.20 to 151.89 at 142.45 to 61.8% retracement at 136.63. Nevertheless strong bounce from 145.06 will retain medium term bullishness for another test on 151.93 at a later stage.
US DJIA Technical: Bullish Impulsive Upmove Remains Intact
- Shaped four consecutive weeks of positive higher closes since 27 Oct 2023 low of 32,310.
- Potential start of a major uptrend phase with next major resistance at 39,515.
- Watch 35,175 key short-term support to maintain minor uptrend phase from 10 November 2023 low.
The price actions of the US Wall St 30 Index (proxy of the Dow Jones Industrial Average futures) have shaped four consecutive weeks of positive higher closes since its recent October 2023 low of 32,310.
The current price level of 35,446 at this time of the writing is just a whisker of 4.3% away from its all-time high level of 36,971 printed on 5 January 2022.
Start of a potential major uptrend phase
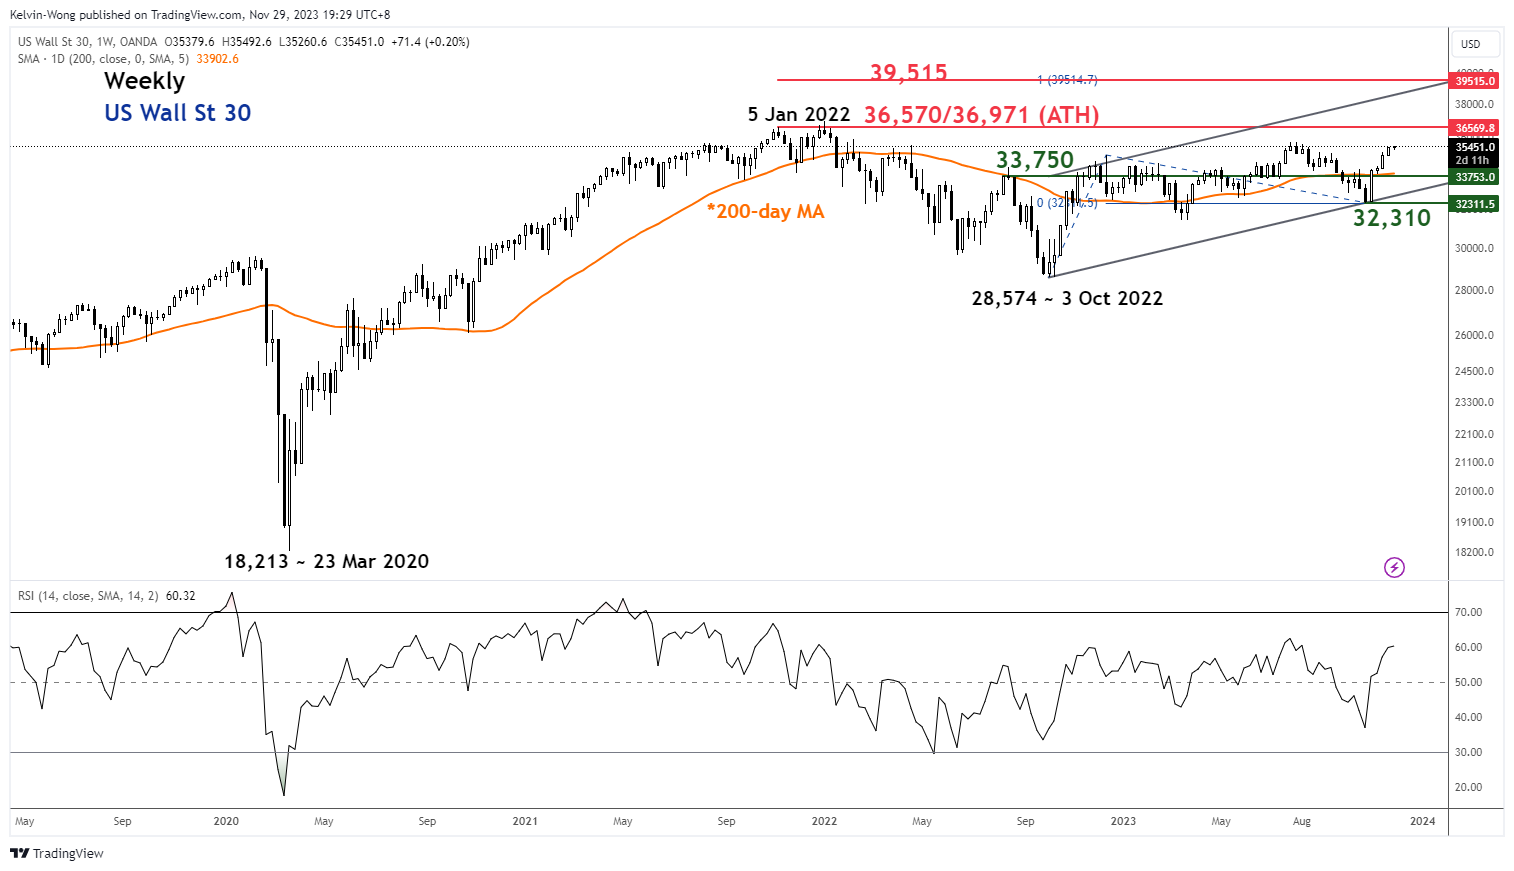
Fig 1: US Wall St 30 long-term secular and major trends as of 29 Nov 2023 (Source: TradingView, click to enlarge chart)
The long-term weekly chart of the US Wall St 30 Index has exhibited several positive elements; oscillating within a newly formed major ascending channel from the 3 October 2022 low of 28,574, cleared above the 200-day moving average, and weekly RSI momentum indicator inched back up above 50 level.
These observations suggest that the Index has printed two major higher swing low areas on 3 October 2022 and 27 Oct 2023 (around a year apart) that advocate the start of a new major uptrend phase within its long-term secular uptrend in progress since the Great Financial Criss low of March 2009.
The major resistance after its current all-time high of 36,971 stands at 39,515 (upper boundary of the major ascending channel & 1.00 Fibonacci extension from 3 October 2022 low).
Watch the 35,175 key short-term support
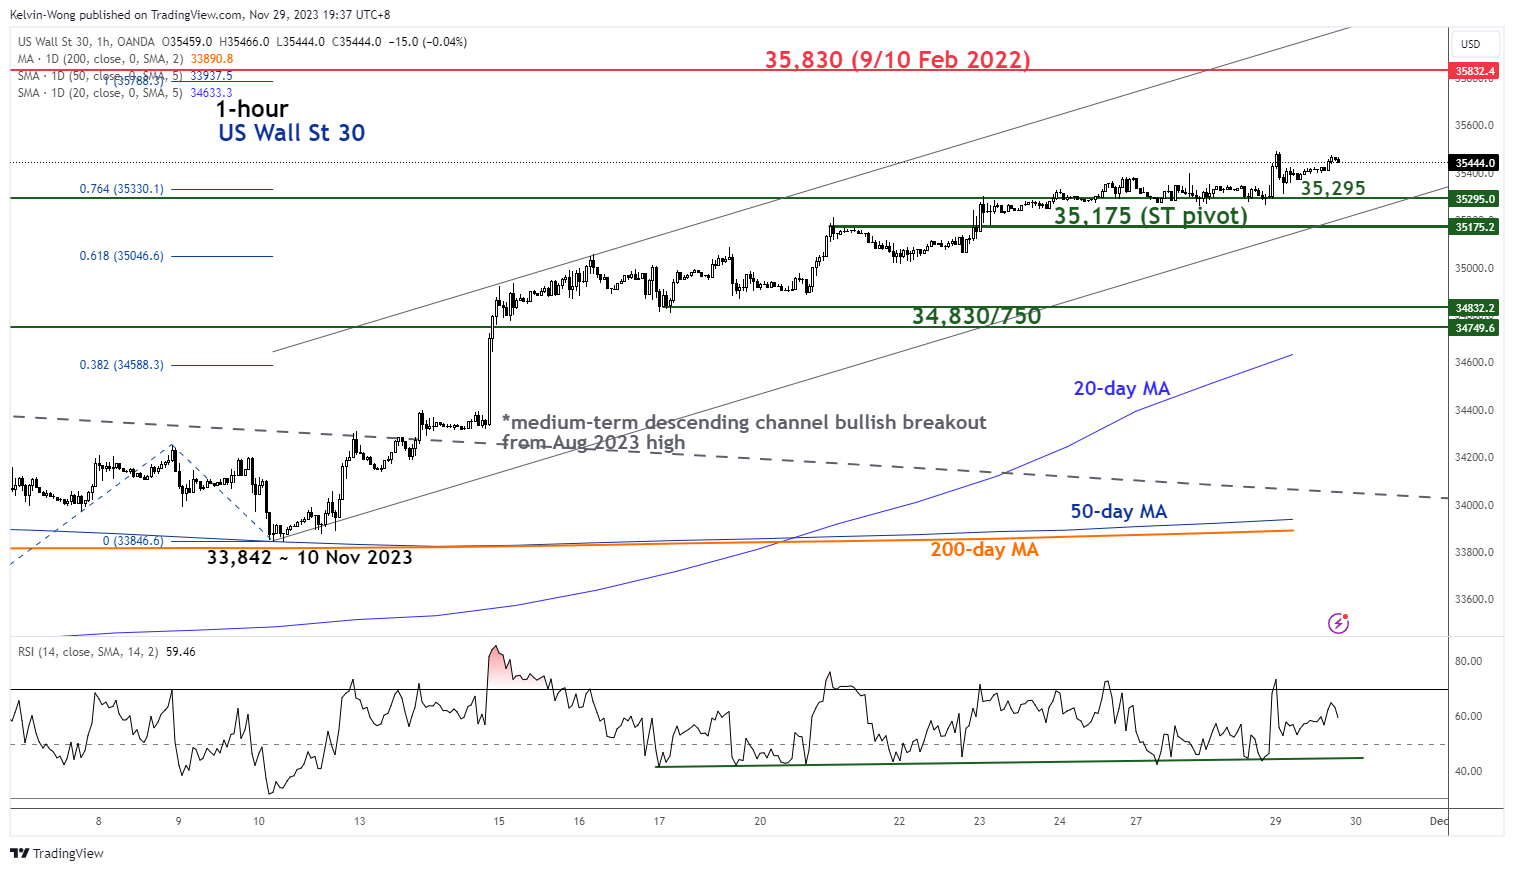
Fig 2: US Wall St 30 minor short-term trend as of 29 Nov 2023 (Source: TradingView, click to enlarge chart)
Since its bullish breakout from the former medium-term descending channel resistance in place since the August 2023 high, the price actions of the Index have continued to evolve within a minor ascending channel from the 10 November 2023 low of 33,842.
In addition, the hourly RSI momentum indicator has continued to hover above a parallel support at the 45 level which suggests that short-term bullish momentum is likely to be intact.
If the 35,175 key short-term pivotal support holds, the Index may continue its ongoing impulsive up move sequence within its minor uptrend phase with the next intermediate resistance coming in at 35,830 (also the 9/10 February 2022 swing high) in the first step.
However, a break below 35,175 negates the bullish tone for a minor corrective decline to expose the next intermediate support zone of 34,830/750 (also the upward-sloping 20-day moving average).
USD/JPY: Bears Consolidating for Fresh Push Through Daily Cloud Base
USDJPY bounces from new ten-week low on Wednesday, as bears faced headwinds on probe through the base of daily cloud (147.38) and from 100DMA (146.97).
Fresh jump was sparked by dovish comments from BoJ policymaker, who said that it is still early to talk about exiting from negative rate policy.
However, bounce is likely to be limited and short-lived as dollar remains under pressure from talks of an end of Fed tightening cycle and beginning to cut interest rates, probably in the second quarter of 2024 (growing bets for the first rate cut in May).
Broken Fibo 23.6% of 137.23/151.90 (148.44) should ideally cap upticks and keep near-term bias with bears.
Close below cloud base to reinforce negative near-term stance for extension towards 146.30 (Fibo 38.2) and possible further acceleration on break.
Only lift and close above daily cloud top (149.05) would defer.
Res: 147.81; 148.44; 148.93; 149.05.
Sup: 147.38; 146.67; 146.30; 145.90.
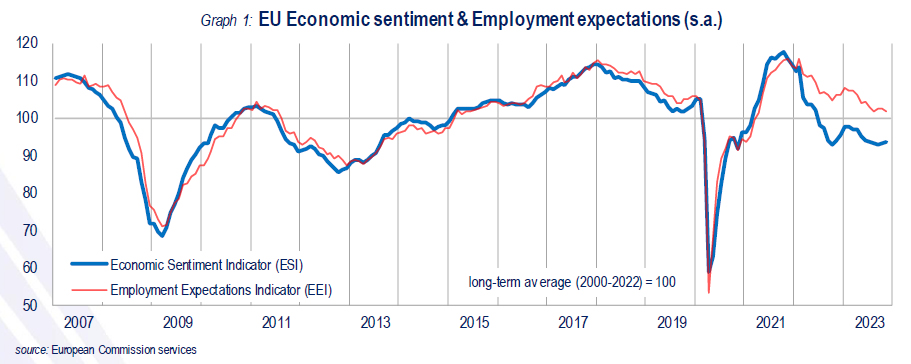
Eurozone economic sentiment rose to 93.8, EU rose to 93.7
Eurozone Economic Sentiment Indicator ticked up from 93.5 to 938 in November. Employment Expectations Indication fell from 102.8 to 102.1 Economic Uncertainty Indicator fell from 22.7 to 22.4.
Eurozone industry confidence fell from -9.2 to -9.5. Services confidence rose from 4.6 to 4.9. Consumer confidence rose from -17.8 to -16.9. Retail trade confidence rose from -7.4 to -7.0. Construction confidence rose from -5.5 to -4.8.
EU Economic Sentiment Indicator rose from 93.2 to 93.7. Employment Expectations Indicator fell from 102.3 to 101.8. Economic Uncertainty Indicator fell from 22.2 to 21.8.
Amongst the largest EU economies, the ESI improved in the Netherlands (+2.9), France (+2.0) and Poland (+1.7), while it eased in Spain (-1.5) and, to a lesser extent, in Germany (-0.5) and Italy (-0.3).
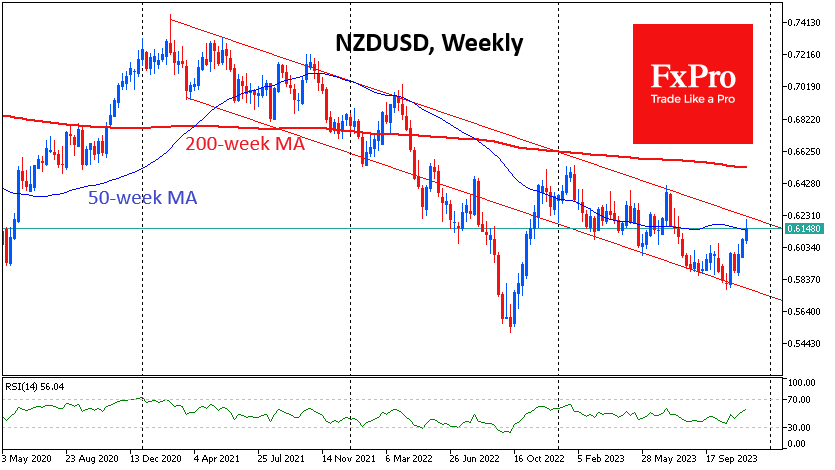
NZD Tired of Flying
The Reserve Bank of New Zealand left its key rate unchanged at 5.5%, the highest in 15 years, but on hold for six months now. The decision was in line with market expectations. However, the NZDUSD rallied, adding over 1.2% at one point and touching 0.6200, a 4-month high. The buying impulse came from the CB’s vocal preparedness to raise rates if needed.
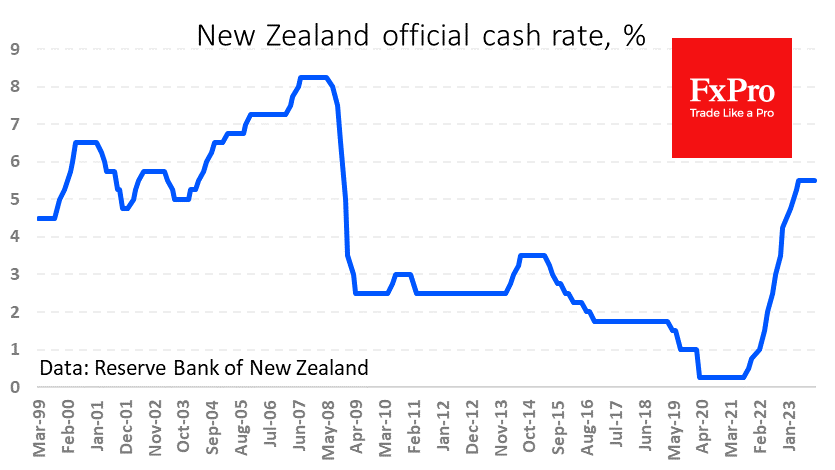
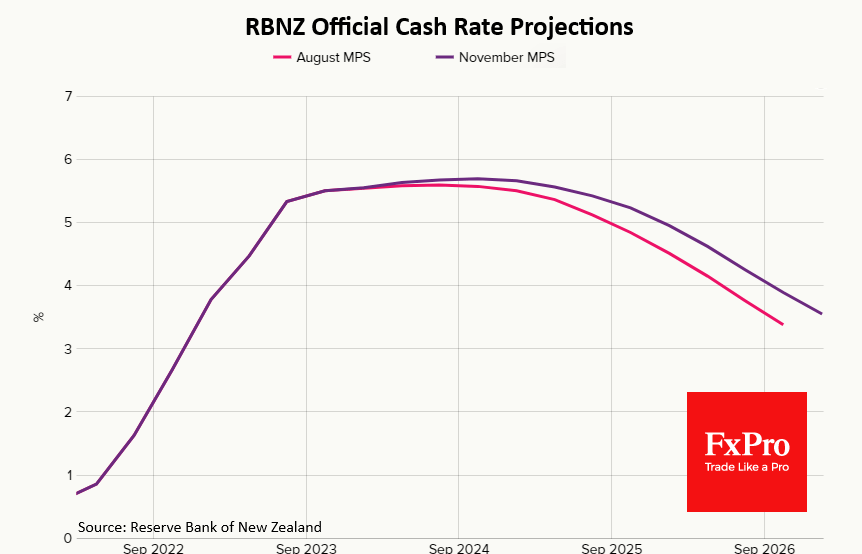
The RBNZ’s rate forecasts became more hawkish, confirming a willingness to act. The committee revised its August forecast expecting a higher rate in a year than it does now, fitting in with the latest Central Bank’s mantra “higher for longer”.
But intraday, the Kiwi’s dynamics changed dramatically. At the height of morning trading in Europe, NZDUSD erased all gains following the publication of the RBNZ decision, pulling back to 0.6150. The New Zealand dollar sell-off so far looks like profit-taking after rallying 5.8% in a fortnight following a weak US inflation report. Sellers showed up after the NZDUSD entered the overbought area on RSI on daily charts.
On the higher timeframes, NZDUSD almost touched the upper boundary of the descending corridor, which the pair has mainly followed since March 2021. This year, the pair have spent a lot of time near the lower boundary, while reversals down from the upper boundary have been swift. During the period of this channel, it took only 5-6 weeks to move from the upper boundary of the range to the lower boundary. If the pattern repeats for the sixth time, NZDUSD could reach the 0.5750 level in early January.
The alternative bullish scenario will become mainstream only if NZDUSD can stay within the short-term growth momentum and overcome the previous local top at 0.6400.
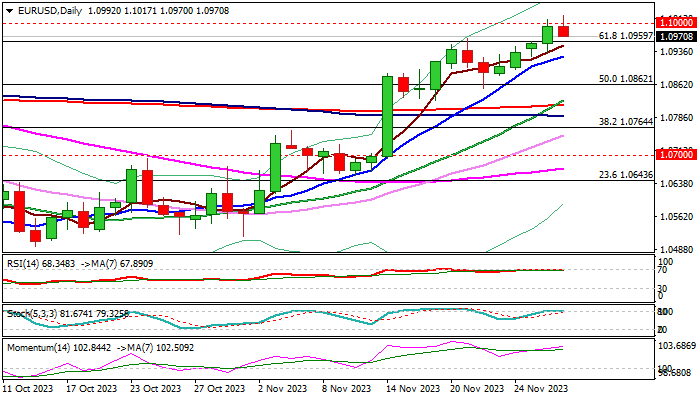
EUR/USD: Bulls Taking Breather After Cracking Psychological 1.1000 Barrier
EURUSD is consolidating under new multi-week high on Wednesday, after bulls cleared pivotal Fibo resistance at 1.0959 (61.8% of 1.1275/1.0448 downtrend) and cracked psychological 1.10 barrier.
The Euro received fresh support from expectations that the Fed is done with rate hikes and rising bets for start of cutting interest rates in the first half of 2024.
As expected, bulls faced increased headwinds at 1.10 zone, with overbought conditions on daily chart, prompting traders to collect some profits.
Technical picture on daily chart is increasingly bullish and supports the pair for further advance, as close above 1.0959 and probe through 1.10, generated fresh positive signals.
Dips should be limited and positioning for fresh push higher, with rising 10DMA (1.0926) to ideally contain and offer better levels to re-enter bullish market for acceleration through 1.10 pivot at test of next target at 1.1080 (Fibo 76.4% of 1.1275/1.0448).
Caution on break and close below 10DMA which would put larger bulls on hold for deeper correction.
German and EU inflation data, due today and Thursday, will be focused for fresh direction signals.
Res: 1.1000; 1.1017; 1.1065; 1.1080.
Sup: 1.0959; 1.0926; 1.0882; 1.0852.
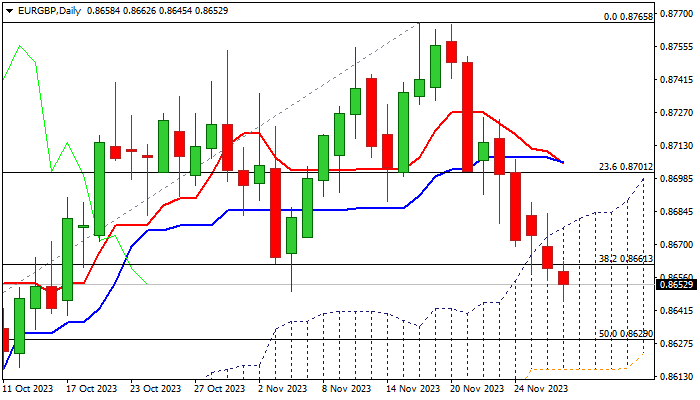
EUR/GBP: Falls to Six-Week Low
EUR/GBP remains in red for the fifth consecutive day and fell to the lowest I six weeks on Wednesday.
The pair is trending lower within thick daily cloud, as break of pivotal supports at 0.8661 (Fibo 38.2% of 0.8492/0.8765) and 0.8650 (Nov 6 former higher low) generated fresh bearish signals and added to negative stance.
Bears eye next targets at 0.8637/29 (100DMA / 50% retracement) which guard more significant daily cloud base (0.8616).
Meanwhile, bears may pause after recent fall as daily studies are oversold, with upticks to be capped by significant barriers at 0.8677 (daily cloud top / 200DMA) and offer better selling opportunities.
Only return and close above cloud top would sideline bears for stronger bounce.
Res: 0.8765; 0.8792; 0.8808; 0.8863.
Sup: 0.8735; 0.8713; 0.8705; 0.8688.
BoE’s Bailey dismisses rate cut speculations again
BoE Governor Andrew Bailey, in an interview, emphasized, "Two percent is our (inflation) target and we will do what it takes to get there."
Bailey also addressed the speculation around interest rate cuts, categorically stating, "We are not in a place now where we can discuss cutting interest rates – that is not happening."
He noted, "We need to see how the final part of the journey down to 2% inflation plays out; we have not seen enough of that journey yet to be confident."
He acknowledged the ongoing economic challenges, including some weakening in economic activity. However, he described this observation as a "realist view" rather than an "ultra-pessimist" outlook, as some critics have suggested.