
Sample Category Title
EUR/USD Analysis: Price Reaches the Level of 1.1000
Before yesterday's trading session, the last time 1 euro was 1.1 USD was in the first half of August.
The growth of the rate was facilitated by the weakening of the dollar, which occurred against the background of the words of Christopher Waller, a member of the Fed Board of Governors, who is known for his hawkish policies. But he has already softened his position.
"I am increasingly confident that policy is currently well positioned to slow the economy and get inflation back to 2 percent," he said yesterday, however, adding that if the decline in inflation continues “for a few more months... three months, four months, five months... we can start reducing the discount rate just because inflation is lower.”
The expected rate cut could mark the beginning of a new period of looser monetary policy. Therefore, financial markets reacted by increasing the prices of currencies relative to the dollar — in particular, the euro reached a psychological level.
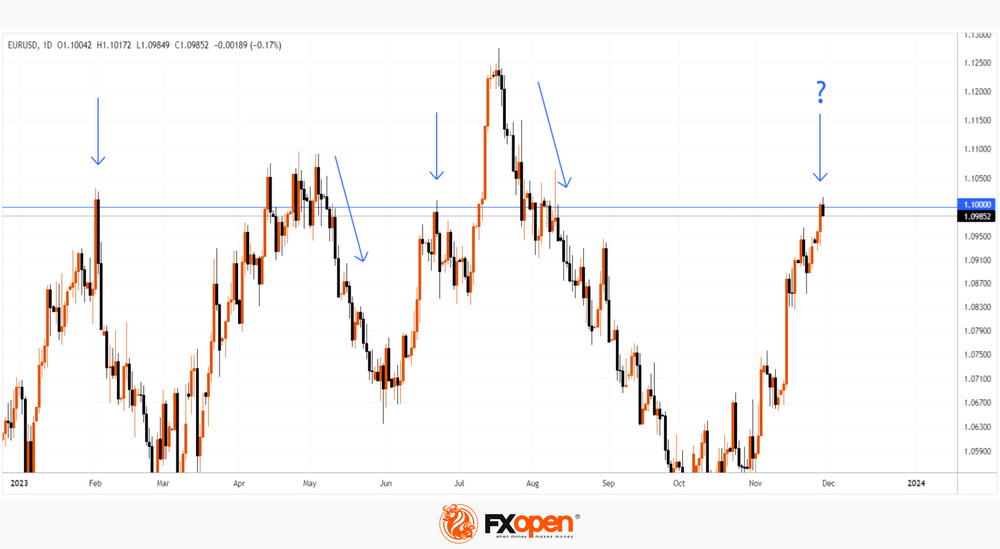
The chart shows that in 2023 the price of EUR/USD interacted with it several times, which caused, among other things, trend reversals. As the arrows show:
→ a bearish reversal took place in February;
→ in May the price entered consolidation, but exited it in a downward direction;
→ the level worked as a resistance in June.
The sharp rise in July above the 1.100 level turned into an equally rapid fall.
Taking into account the above facts, there is reason to assume a scenario in which the level of 1.100 will once again in 2023 resist the appreciation of the euro. Moreover, this is already noticeable, since on Wednesday the price exceeded Tuesday’s high and turned down (a sign of a false bullish breakout).
This article represents the opinion of the Companies operating under the FXOpen brand only. It is not to be construed as an offer, solicitation, or recommendation with respect to products and services provided by the Companies operating under the FXOpen brand, nor is it to be considered financial advice.
EUR/USD Extends Rally While USD/JPY Nosedives
EUR/USD gained bullish momentum above the 1.0930 resistance. USD/JPY is declining and showing bearish signs below the 148.20 level.
Important Takeaways for EUR/USD and USD/JPY Analysis Today
- The Euro remained in a bullish zone and climbed above the 1.0965 resistance zone.
- There is a key bullish trend line forming with support near 1.0975 on the hourly chart of EUR/USD at FXOpen.
- USD/JPY is trading in a bearish zone below the 148.20 and 147.40 levels.
- There is a major bearish trend line forming with resistance near 147.40 on the hourly chart at FXOpen.
EUR/USD Technical Analysis
On the hourly chart of EUR/USD at FXOpen, the pair started fresh above the 1.0900 zone. The Euro climbed above the 1.0930 resistance zone against the US Dollar, as mentioned in the previous analysis.
The pair even settled above the 1.0965 resistance and the 50-hour simple moving average. Finally, it tested the 1.1020 resistance. A high is formed near 1.1017 and the pair is now consolidating gains.
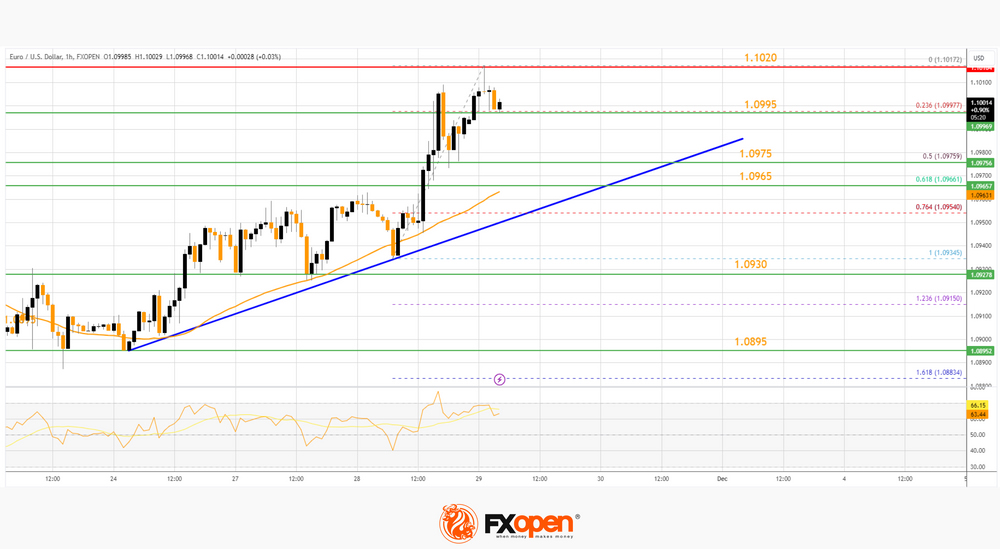
If there is a downside correction, the pair might test the 50% Fib retracement level of the upward move from the 1.0935 swing low to the 1.1017 high at 1.0975. There is also a key bullish trend line forming with support near 1.0975.
The next major support is near the 61.8% Fib retracement level of the upward move from the 1.0935 swing low to the 1.1017 high and the 50-hour simple moving average at 1.0965.
If there is a downside break below 1.0965, the pair could drop toward the 1.0930 support. The main support on the EUR/USD chart is near 1.0895, below which the pair could start a major decline.
On the upside, the pair is now facing resistance near 1.1020. The next major resistance is near the 1.1050 level. An upside break above 1.1050 could set the pace for another increase. In the stated case, the pair might rise toward 1.1140.
USD/JPY Technical Analysis
On the hourly chart of USD/JPY at FXOpen, the pair started a strong decline well above the 148.95 zone. The US Dollar gained bearish momentum below the 148.20 support against the Japanese Yen.
The pair even settled below the 147.40 level and the 50-hour simple moving average. Finally, it broke the 146.80 pivot level. A low is formed near 146.67 and the pair is now showing a lot of bearish signs. Immediate resistance on the USD/JPY chart is near 147.40.
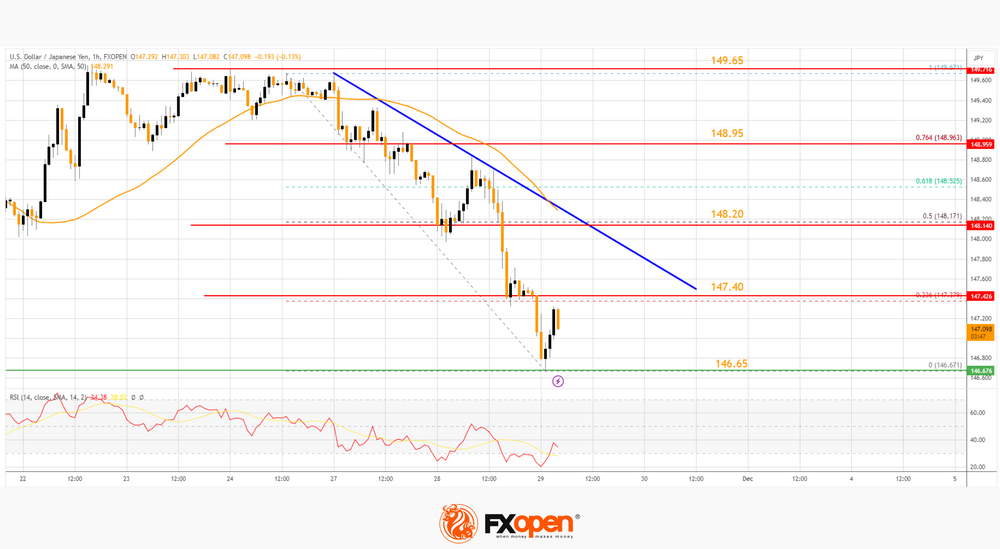
There is also a major bearish trend line forming with resistance near 147.40. The trend line is close to the 23.6% Fib retracement level of the downward move from the 149.67 swing high to the 146.67 low.
The first major resistance is near the 50% Fib retracement level of the downward move from the 149.67 swing high to the 146.67 low at 148.20 and the 50-hour simple moving average.
If there is a close above the 148.20 level and the hourly RSI moves above 50, the pair could rise toward 148.95. The next major resistance is near 149.65, above which the pair could test 150.00 in the coming days.
On the downside, the first major support is near 146.65. The next major support is near the 146.20 level. If there is a close below 146.20, the pair could decline steadily. In the stated case, the pair might drop toward the 145.00 support.
This article represents the opinion of the Companies operating under the FXOpen brand only. It is not to be construed as an offer, solicitation, or recommendation with respect to products and services provided by the Companies operating under the FXOpen brand, nor is it to be considered financial advice.
Crypto Market Back to Test Multi-month High
Market picture
The crypto market added 2.4% in 24 hours to $1.43 trillion and went back to test highs since May 2022. Bitcoin added 3% during this time, Ethereum 2.75%, and Solana was the top performer among the major coins, adding 8.4%. Toncoin was on a back foot with its 0.4% gain.
Bitcoin has been floundering inside the upward range for more than five weeks now. On Monday, the price reversed to the upside from the lower boundary at $36.7K. On Tuesday evening, Bitcoin’s price briefly exceeded $38.4K but pulled back down after failing to find solid ground to accelerate gains.
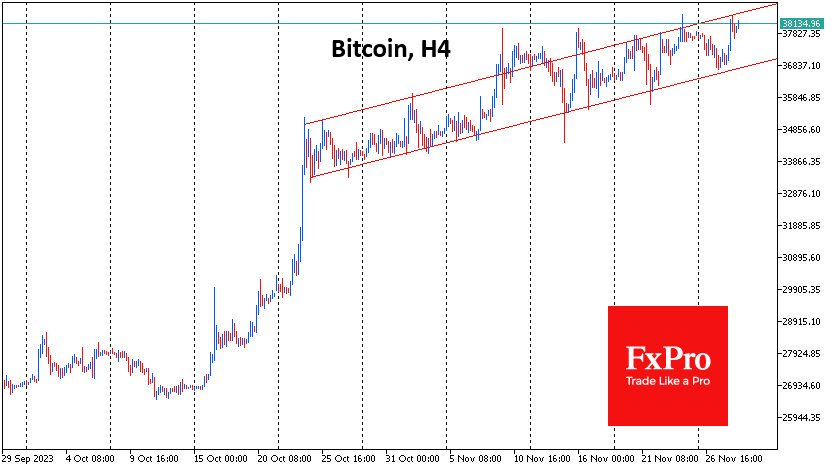
The positive sentiment extends well beyond the first cryptocurrency, as altcoins reversed to growth in a broad front on Tuesday. This could be investors’ reaction to a weakening dollar on expectations of an imminent Fed interest rate cut.
News background
The next bullish trend will come in 2025 when Bitcoin surpasses $100K. And that’s “a pretty conservative estimate,” said 10T Holdings CEO Dan Tapiero.
According to The Wall Street Journal, the SEC is searching hard for evidence that Binance executives may have or may still have a loophole to control assets stored on the Binance.US platform. Zhao has resigned from the Binance.US board of directors, the platform said.
Cardano founder Charles Hoskinson criticised the US SEC for the agency not treating Bitcoin as a security, thereby giving BTC “complete discretion” unlike other cryptocurrencies.
The collapse of cryptocurrency companies does not pose threats to the real economy, according to the Financial Stability Board at the G20.
US presidential candidate Robert Kennedy Jr. spoke out against central bank digital currencies, calling CBDC a threat to citizens’ financial freedom. He said bitcoin is “an elegant solution against CB digital currencies.”
Private cryptocurrencies have already failed fundamental tests for financial services and should eventually disappear, the Monetary Authority of Singapore said.
Gold Surges on the Back of Dovish Fed Comments
On Tuesday, gold (XAU) rose towards 2,050, reaching its highest point in almost seven months. The increase happened primarily due to a significant drop in the U.S. dollar following dovish comments from Federal Reserve (Fed) officials.
Possible effects for traders
The Federal Reserve (Fed) Governor Christopher Waller noted that the existing monetary policy is sufficiently restrictive, hinting at a potential rate cut in the upcoming months. Chicago Fed President Austan Goolsbee also acknowledged progress in tackling inflation. The market now prices in a 44.7% chance that the Fed will begin to ease monetary policy in March 2024 and a 72.8% probability of a rate cut in May. It seems that the Fed sentiment is becoming increasingly dovish. However, XAUUSD may fall sharply if U.S. inflation reports show higher-than-expected numbers. In the short term, the gold market is excessively bullish, looking overextended. Thus, gold is highly sensitive to any negative news, which might have a more disproportional bearish effect on the XAUUSD price than positive data.
XAUUSD rose sharply during the Asian trading hours but pulled back during the early European session. Today, traders should focus on the U.S. GDP Growth Rate report at 1:30 p.m. UTC. Lower-than-expected figures will probably push XAUUSD towards 2,052. However, the bullish trend might pause if the numbers exceed expectations. 'Spot gold may extend gains into a range of $2,059–$2,069 per ounce, driven by a powerful wave 3,' said Reuters analyst Wang Tao.
Bullish Trend in AUDUSD Pauses But Remains Intact
The Australian dollar (AUD) gained 0.64% on Tuesday, as the U.S. dollar was weakening on fuelling expectations that the Federal Reserve (Fed) has finished hiking interest rates.
Possible effects for traders
AUD is a risk-sensitive currency. Therefore, AUDUSD tends to rise when the market expects the end of monetary policy tightening and turns optimistic on global growth prospects. Indeed, the pair has risen by almost 6% over the past month and is trading near a four-month high. Moreover, Reserve Bank of Australia (RBS) Governor Michele Bullock highlighted the growing influence of domestic demand on inflation, necessitating a response through increasing interest rates. Currently, markets are pricing in about a 50% chance of the central bank increasing the base rate next year. However, the bullish trend in AUDUSD has paused due to bulls closing their long positions ahead of a strong resistance near 0.66800 and a faster-than-expected slowing of domestic inflation.
AUDUSD fell during the Asian and European trading sessions as the latest Consumer Price Index (CPI) indicated a slowdown in inflation. CPI numbers were lower than expected in October as goods prices fell, and core inflation also declined. The data increases the chances of the RBA leaving the rates unchanged at next week's meeting. Today, traders should monitor the U.S. GDP Growth Rate report at 1:30 p.m. UTC. If the figures are higher than expected, AUDUSD will likely decline towards 0.66000. However, the upward trend could persist if numbers come out below the forecast.
RBNZ Review: Talking Tough and Maybe Doing Something
- The OCR remained at 5.5% as Westpac and the market had expected.
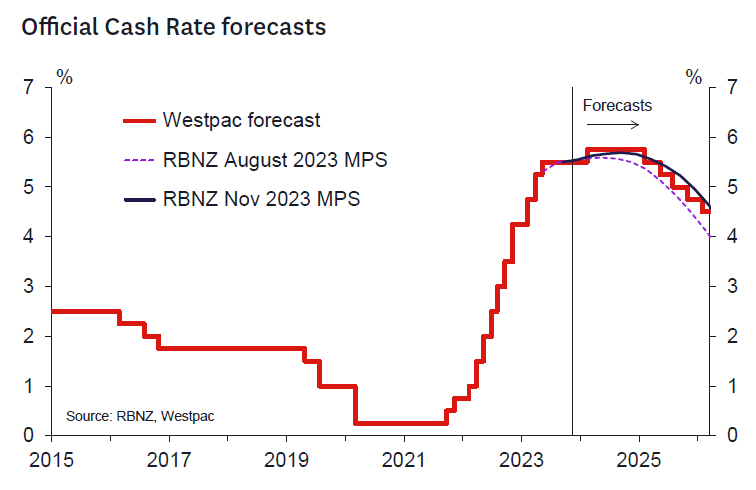
- The RBNZ's projections for the OCR were revised 10bp higher to a peak of 5.69% in September 2024, implying around a 75% chance of a further 25bp rate hike. The projections imply a gradual easing of policy from the first half of 2025. The long-run neutral OCR was also adjusted up 25bp to 2.5%.
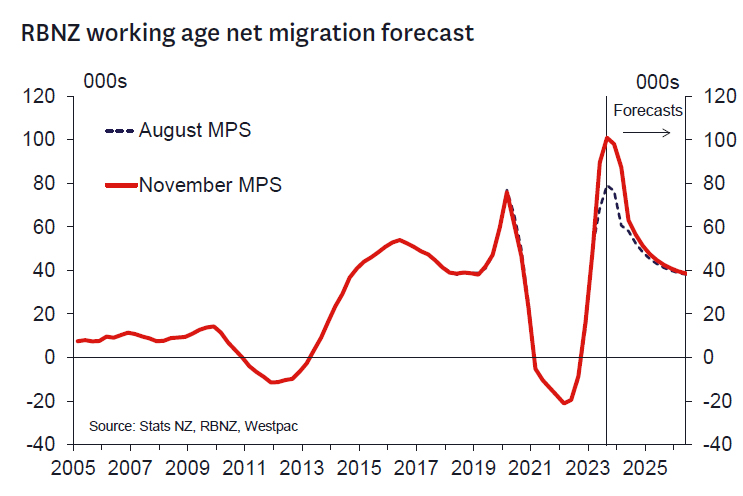
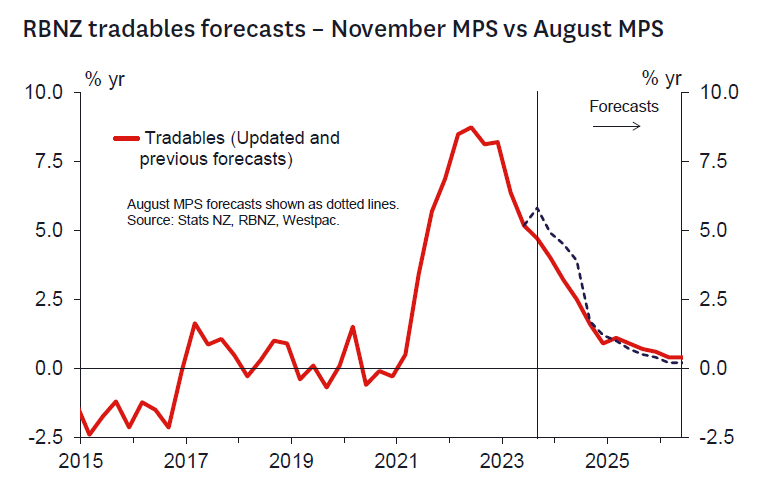
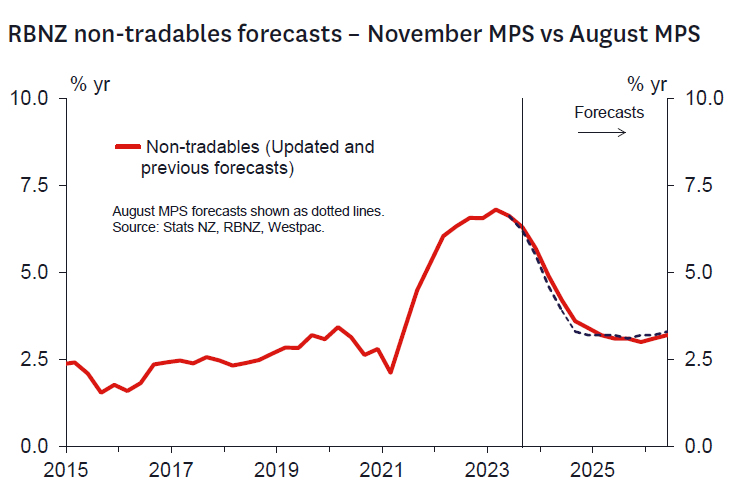
- The RBNZ's short term CPI forecasts have been revised down slightly in the near term. However, the forecast for inflation from mid- 2024 is slightly higher despite the upwards revision to the projection for the OCR. That reflects a concern that migration driven population growth will add to demand and the housing market. CPI inflation still gets back inside the range in Q3 2024, but the RBNZ sees upside risks here.
- The RBNZ's views of the inflation risks now align more closely with our own. We maintain our call for a 25bp hike in the OCR to 5.75% at the February 2024 Monetary Policy Statement.
As widely expected, the RBNZ left the OCR at 5.5% at its final policy review for this year. Of much greater interest to markets was what the Bank had to say about the outlook for the OCR next year and beyond.
The updated projections in the accompanying Monetary Policy Statement (MPS) contained significant revisions from those published back in August. A key change is that the RBNZ's projections reflect a heightened risk that a further 25bp OCR hike will be required in 2024. The probability of a further 25bp hike in 2024 is now estimated at around 75% compared with 36% previously (the peak OCR increased to 5.69% from 5.59% previously). Thereafter, the RBNZ's projections imply a modest easing cycle from mid-2025 – much later than implied by current market pricing. The RBNZ's revised OCR track now closely resembles our own – albeit with the tightening coming around 6 months later.
The key drivers of the more heightened perceptions of inflation risk stem from a reassessment of the mediumterm impact of very strong migration driven population growth. In addition, the RBNZ has become more cautious on the pace to which they expect core inflation pressures to moderate. That reassessment is reflected in a stronger housing market (and rents) profile, stronger near-term growth, and lower unemployment forecasts and a higher profile for government investment in the infrastructure required to support a growing population.
The bottom line is an upwards revision to the RBNZ's medium term inflation forecasts (from mid-2024 onwards and despite a lower short term inflation profile due to recent weaker than expected tradables inflation data) even with higher interest rates. On top of this, the RBNZ notes an asymmetric risk profile around medium-term inflation outcomes – with upside risks there.
The RBNZ seems more focused on ensuring that inflation hits the middle of the target range in the next 18 months to 2 years. Hence, given still persistent core inflation, strong population growth and an upwardly revised long-run neutral OCR (increased a further 25bp to 2.5%) the clear message is the balance of risks has shifted towards a need for further tightening. And certainly, there is reduced tolerance for upside surprises to inflation – which is also consistent with the new government's objectives when the new Monetary Policy Committee Remit (and perhaps new RBNZ Act) is promulgated.
We retain our view that the OCR will be increased by 25bps at the February MPS.
The RBNZ's message and core concerns now map more closely to our own. The relatively high probability of a hike in Q3 2024 indicates that all meetings from now should be considered "live". The Governor noted, the RBNZ is now "willing" to act if needed. That said, there is still plenty of water to flow under the bridge ahead of that meeting and so it's possible a hike in the OCR comes later than February (or not at all). The RBNZ MPC seems more focused on seeing inflation in the middle of the 1-3% target range and will not tolerate upside surprises. The RBNZ has not yet incorporated the new Remit or revised Act formally into their decision making and we should remember the composition of the MPC will change next year as two new members join the MPC. And these members will presumably reflect the desire of the Minister to see the RBNZ meeting the inflation target expeditiously.
Today's commentary sends a clear steer to the market that policy easings are very unlikely for the foreseeable future. All else equal, if the market heeds this message and financial conditions firm somewhat or at least don't significantly ease, then there might be a reduced likelihood of the RBNZ needing to lift the OCR further. Easings are going to need to be motivated by a much weaker run of data on future core inflation pressures, and housing market trends. Our recent analysis still seems very relevant here.
The other clear message is to the new Government: if delivered, the fiscal stance embodied in the forthcoming Pre-Election Economic and Fiscal Update (PREFU) forecasts would add inflation pressure (compared to the Budget forecasts). So, the Government will need to deliver a materially tighter fiscal policy stance in the forthcoming Half-Year Economic and Fiscal Update (HYEFU) if it wishes to help avert the need for a higher OCR.
What we will be watching.
As we look ahead to the RBNZ's February meeting, we will be watching the following key data and events:
- The Q3 GDP report on 14 December. Regarding the data flow, ahead of next week's key partial indicators, we currently think that the Q3 GDP report will reveal weaker growth than the 0.3% factored by the RBNZ, while revisions to historical data foreshadowed in the recently released annual national accounts point to a modest downward revision to the level of real GDP compared to that published previously.
- The Q4 labour market surveys on 7 February. The RBNZ seemed to take little comfort from the slightly weaker than expected Q3 labour market outcomes. Our current forecasts for Q4 are not materially different to those of the RBNZ.
- The Q4 CPI report on 24 January and monthly updates ahead of that time. We currently think that both headline and non-tradables inflation will print slightly below the RBNZ's updated forecast, but indicators over coming months could lead to a change in that view.
- Migration data and all housing-related data. Given the RBNZ's obvious concern about the impact of migrant inflows on domestic demand, including via the housing market, we will be closely monitoring both the size of future inflows (relative to RBNZ forecasts) and how they are impacting housing turnover, house prices and dwelling rentals over coming months.
- The HYEFU. When it compiles its next forecast update in February, the RBNZ will factor the new Government's fiscal stance, at least to the extent that this is built into the projection in the HYEFU. Therefore, we will be very interested in updated estimates of the "fiscal impulse" from the government's activities, and any other analysis of the economic impact of the new Government's policies.
The detail.
The RBNZ's economic projections.
The RBNZ has revised up its forecasts for GDP growth. A big part of the reason for that is the strength of net migration, which has risen much higher than the RBNZ had expected. That's offsetting a weak outlook for percapita spending and means that the RBNZ no longer expects a recession. Strong migration is adding to the outlook for demand and is also expected to provide a boost to the housing market (including rents). Migration also adds to the economy's productive capacity, but at least in the near term the RBNZ expects that the boost to domestic demand – and inflation – will be the bigger impact on economic conditions.
The RBNZ has revised down the near-term outlook for inflation. That's due to imported inflation (aka. tradables) which has been weaker than the RBNZ and other forecasters expected, including ourselves. However, even with that change, the RBNZ is still concerned about the upside risks for inflation more generally. In fact, the RBNZ's forecasts for inflation from mid-2024 have been revised slightly higher. That's despite an upward revision to the path for the OCR. Underpinning that higher outlook for the CPI, domestic inflation (aka non-tradables) has remained elevated. That's very important for the RBNZ as domestic inflation should have a strong relationship with monetary policy, but in most cases, we haven't seen inflation on this front easing two years after the RBNZ first hiked the OCR. In part, the RBNZ has ascribed this resilience in domestic price pressures to the strength in migration, which is adding to demand and the prices for services like housing rent. Both net migration and nontradables inflation will be important areas to watch ahead of the RBNZ's upcoming policy meetings.
Reflecting the stronger picture for domestic demand, and a forecast of a slightly less negative "output gap" than projected in August, the RBNZ also forecasts slight less deterioration in the labour market. The unemployment rate is now forecast to peak at 5.2% in Q2 2025, rather than the previous forecast of a peak of 5.3% in Q4 2024. Curiously, despite that revision, the RBNZ is now slightly more optimistic regarding a slowing in wage growth, with the private sector Labour Cost Index now expected to rise 3.5% in 2024 and 3.4% in 2025 – down from 3.8% per year in the August projection.
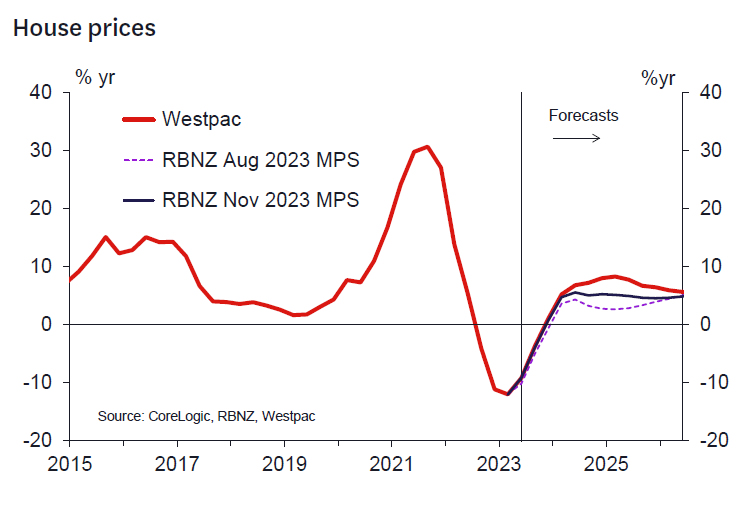
A notable adjustment to the RBNZ's projections was in their forward view of house prices which were revised up and are now closer to our own projections. The RBNZ now sees house price growth next year around 5% (our forecast is 8%). This adjustment principally reflects a changed assessment of the impact of historically strong migration induced population growth on the housing market and with the 12-month lag typically seen historically. We still see upside risks to the RBNZ's projections and will learn more in the next few months as the peak housing activity period is upon us. It's interesting that the RBNZ has made this adjustment now given the October Monetary Policy Review discussion suggested the RBNZ was not ready to reassess its housing market view until later in the summer. This perhaps suggests an elevated level of concern on the risks coming to medium term inflation from this area.
The MPS noted that the policies of the newly formed Government were unknown at the time of publication, so the fiscal projections were based on the PREFU. On this basis, the RBNZ noted that government investment looks set to be stronger (in line with PREFU), adding to medium term demand concerns. However, we expect that ultimately the new government's policies will be marginally more contractionary than assumed at PREFU. The HYEFU will hopefully provide more detail on the magnitude of any fiscal contraction as well as the nature of the proposed policies. The HYEFU is due ahead of Christmas and is likely to be a key focus for markets.
USDJPY Bears Face Their Most Crucial Test So Far
- USDJPY continues its decent downtrend
- It now tests the support set by the 100-day SMA
- Momentum indicators support the current move
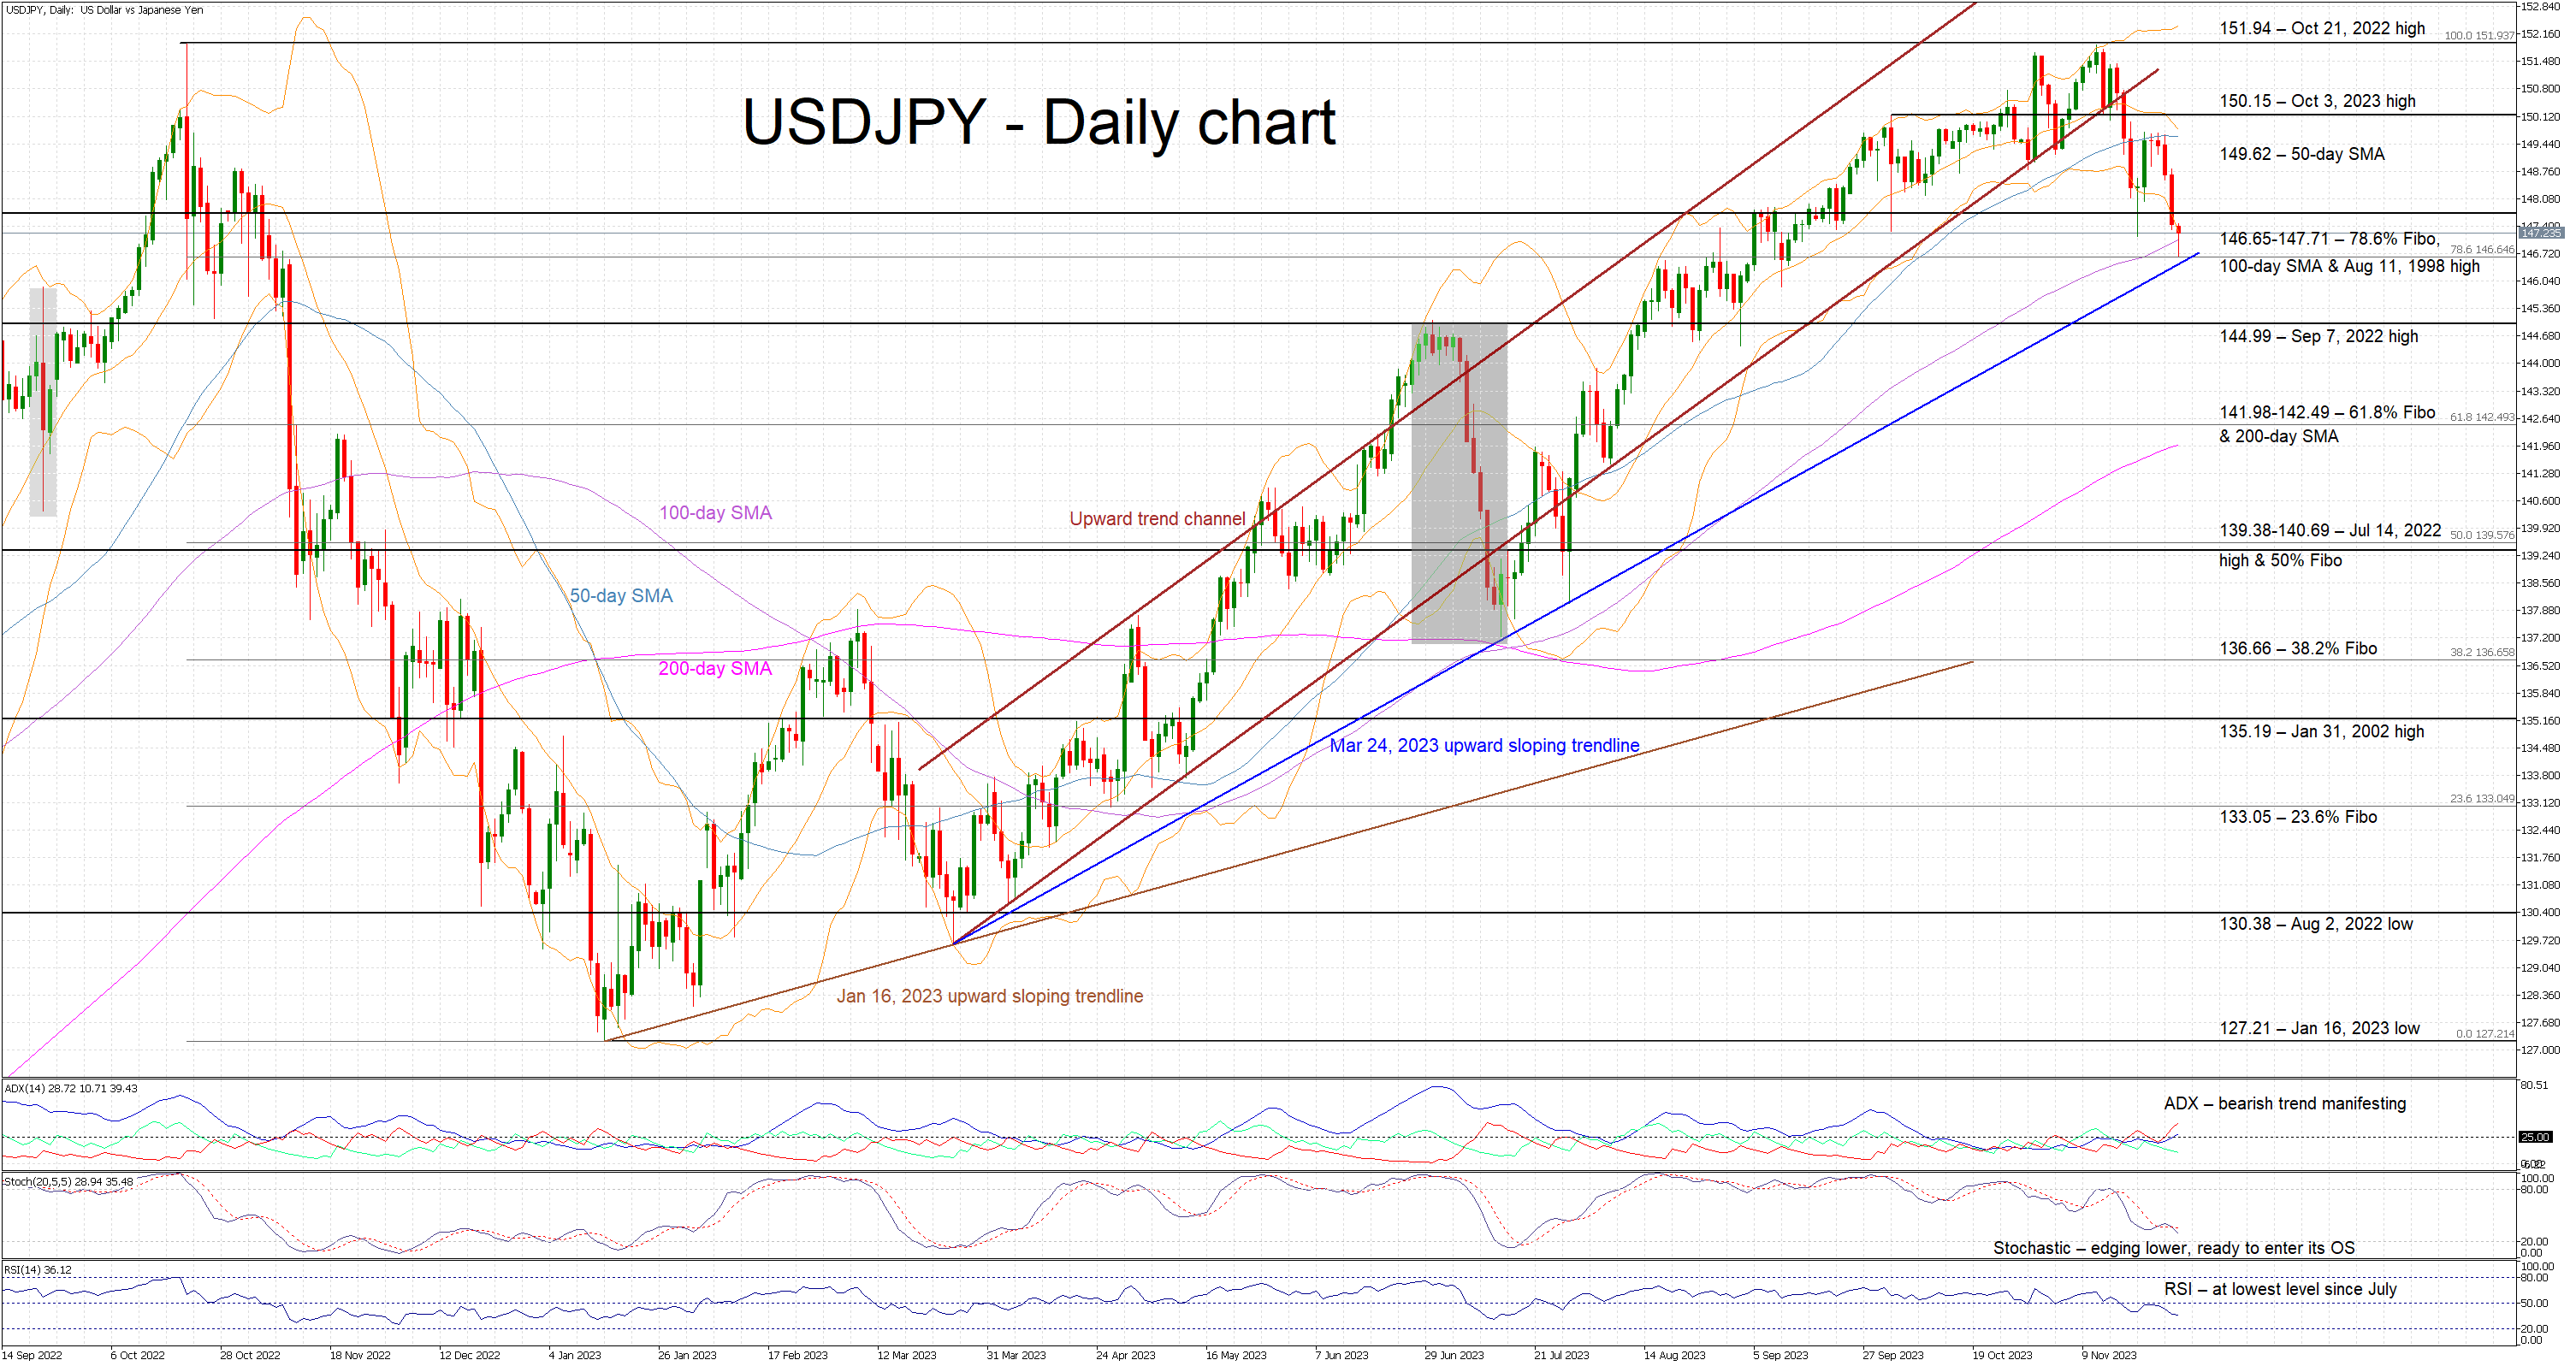
USDJPY is again lower today, recording its fifth consecutive red candle for the first time since the July correction. It is now testing the support set by the 100-day simple moving average (SMA) and the March 24, 2023 upward sloping trendline. Especially, in the case of the latter, USDJPY failed to trade below this trendline during July, thus raising the importance of this battle.
In the meantime, the momentum indicators are endorsing the current move. The Average Directional Movement Index (ADX) has managed to climb above its 25-threshold, thus signaling a bearish market trend. More importantly, the RSI has dropped below its 50-midpoint, reaching its lowest level since July and revealing strong bearish pressure. Crucially, the stochastic oscillator has edged below its moving average, restating its bearish tendency, and moving towards its oversold area.
Should the bears feel invigorated, they could try to break the strong support set by the 146.65-147.71 area that is populated by the 100-day SMA, the August 11, 1998 high, the 78.6% Fibonacci retracement of the October 21, 2023 - January 16, 2023 downtrend and the March 24, 2023 trendline. If successful, they could then have the chance for an even more protracted sell-off towards the next key area at 141.98-142.49 area, provided they overcome the September 7, 2022 high at 144.99.
On the flip side, the bulls appear ready to protect their gains and to defend the 146.65-147.71 area. They could then gradually push USDJPY towards the 50-day SMA at 149.62 and then test the resistance set by the October 3, 2023 high at 150.15. Even higher, their main target appears to be the October 21, 2022 high at 151.94.
To sum up, USDJPY bears have retaken control of the market but for the current move to have legs, they need to break the busy 146.65-147.71 area and the ascending trendline residing there.
NZDUSD Surges to Fresh Almost 4-month Peak
- NZDUSD posts aggressive bullish rally
- Price penetrates 200-day SMA to the upside
- Technical signals are strongly bullish
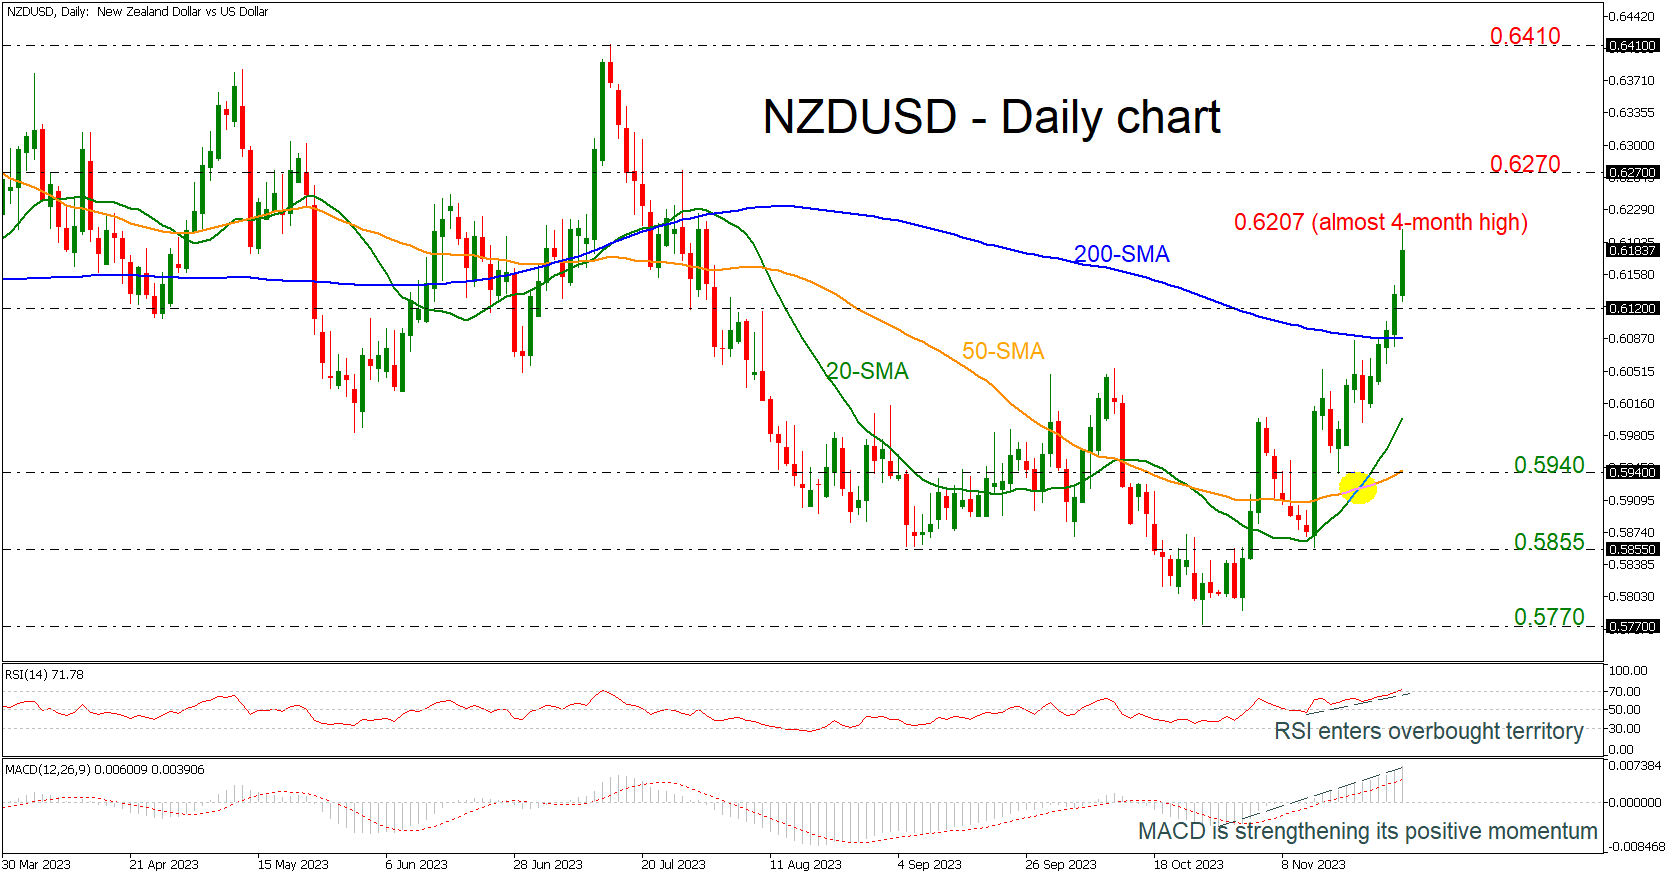
NZDUSD skyrocketed to a fresh almost four-month high above the 0.6200 round number earlier today. The strong rebound off the 0.5770 barrier took the market well above the short-term simple moving averages (SMAs) and more importantly above the 200-day SMA, which is a bullish sign.
Technically, the RSI indicator is travelling towards the overbought territory with strong momentum, while the MACD is stretching its positive momentum above its trigger and zero lines.
If buyers stay in play, the door will open for the 0.6270 resistance, taken from the peak on July 27 before rallying towards the 0.6410 barricade. A jump above this line could endorse the bullish scenario, shifting the long-term outlook to bullish.
Should the bears press the price below 0.6120, the 200-day SMA at 0.6090 may prevent an aggressive downfall towards the 20-day SMA at 0.6000 and the 50-day SMA, which coincides with the 0.5940 support level. If the latter gives way too, the decline could continue towards the 0.5855 support line.
In a nutshell, despite the latest exciting rebound in NZDUSD, there are some obstacles to consider before a real bullish trend reversal takes place. The 0.6270 mark is currently in a target ahead of the 0.6410 barrier.
US Yield Curve Impressively Bull Steepened
Markets
Higher bonds/lower yields was the ‘default’ trend so far this month and reinforced yesterday by comments from Fed’s Waller, usually one of the more hawkish members of the Fed MPC. Contrary to what was the case a month ago (strong US Q3 growth), he is becoming increasingly confident that Fed policy is well positioned to slow the economy in such a way that it can get inflation back to the 2% target. He of course warned that more evidence is needed that this trend can be sustained, but the conclusion for markets was straightforward. Fed’s Bowman is still prepared to raise the policy rate if progress on inflation stalls, but the tone of her comments was also more balanced/conditional. Especially the Waller interview was a good enough reason for markets to raise bets on an early Fed easing, with a first cut now discounted for the May meeting and a second one fully priced in for July. The US yield curve impressively bull steepened. The 2-y yield tumbled 15.4 bps. The 30-y yield eased 3.2 bps. The decline was fully due to a lower real yield (10-y -7.7 bps to 2.10%). The US 10-y yield dropped below 4.34 % support (38% on the April October rise). The 2-y also gave up several corrective lows in the 4.80/71% area. German yields followed the US at a distance, easing between 8.1 bps (2-y) and 2.5 bps (30-y). Remarkably, the sharp decline in yields hardly supported equites (S&P +0.1%). The dollar was hammered. DXY dropped from the 103.2 area to close near 102.75. EUR/USD pierced 1.0960/65 resistance to test the 1.10 big figure. USD/JPY is extensively testing the 147.15 correction low from earlier this month. Gold was a major beneficiary (close $2041/oz).
Yesterday’s trends firmly continue this morning. US yields are again ceding up to 6 bps. The dollar remains under pressure (DXY 102.62, EUR/USD 1.1005). Asian equities are trading mixed to modestly lower. Later today , the focus turns the first November CPI releases from EMU member states (Belgium, Spain and especially Germany). German HICP inflation is expected to slow to -0.5% M/M and 2.5% Y/Y (from 3.0%). Several technical issues/base effects might complicate the interpretation and might be ‘reversed’ over the next couple of months. Even so, soft German inflation data probably will only reinforce the ST downtrend in yields also in EMU. Such a scenario might bring some more balance between the euro and the dollar. Still after breaking several support levels (including the 1.0965 area), the technical picture (and lower rates globally) suggests ongoing USD weakness.
News headlines
It’s four unchanged policy outcomes and six months on the spin now for the Reserve Bank of New Zealand after keeping the policy rate steady at 5.5% this morning. A policy rate hike was discussed, but in the end the MPC agreed that it was appropriate to wait for further data and information to observe the speed and extent of easing in capacity pressures in the economy with rates currently already restrictive and remaining restrictive for a sustained period of time. Some members added that there should be a low tolerance for any increase in the time to return inflation to target. Currently, the RBNZ expects it to fall below the upper bound of the 1-3% tolerance band in H2 2024. The central bank is especially concerned on the impact of stronger net immigration and future (stimulative) fiscal policy. Migration effects are already becoming visible on aggregate demand and risk keeping (core) inflation amongst others via housing rents and construction costs. In another hawkish tilt, the Committee noted that the estimate of the long-run nominal neutral policy rate increased by 25 bps to 2.50% with new OCR projections showing a higher peak rate next year (just below 5.75%), a slower start to rate cuts (mid-2025) and a higher rate at the end of the policy horizon (end 2026: 3.5%). NZD strength added to USD weakness, propelling NZD/USD to 0.62 (from 0.6130) for the first time since early August. NZD swap rates add up to 10 bps at the front end of the curve.
The monthly Australian CPI index rose by 4.9% Y/Y in October (vs 5.2% consensus), down from 5.6% in September and compared to the 8.4% peak in December 2022. The most significant contributors to the October annual increase were Housing (+6.1%), Food and non-alcoholic beverages (+5.3%) and Transport (+5.9%).Core inflation rose by 5.1% Y/Y (from 5.5% Y/Y in September). The Aussie dollar underperforms slightly this morning (AUD/USD 0.6640).
NZD/USD: RBNZ Fired a Hawkish Missile
- RBNZ has maintained the OCR at 5.50% for the fourth consecutive time and matched market consensus.
- Hawkish forward guidance by RBNZ where its latest projected terminal rate of the OCR has been revised upwards to 5.69% (Sep 2024) from 5.57% projected earlier in the August 2023 MPS.
- The Kiwi rallied by +0.90% intraday against the US dollar and outperformed other major currencies.
- No clear signs of bullish exhaustion in NZD/USD from a technical analysis perspective, short to medium-term uptrend phases remain intact.
The Kiwi has staged a whopping intraday rally of +0.90% against the US dollar at this time of the writing during today’s (29 November) Asian session and outperformed the other major currencies; (JPY/USD +0.30%, GBP/USD +0.14%, EUR/USD +0.07%, AUD/USD -0.06%).
NZD has outperformed against other major currencies
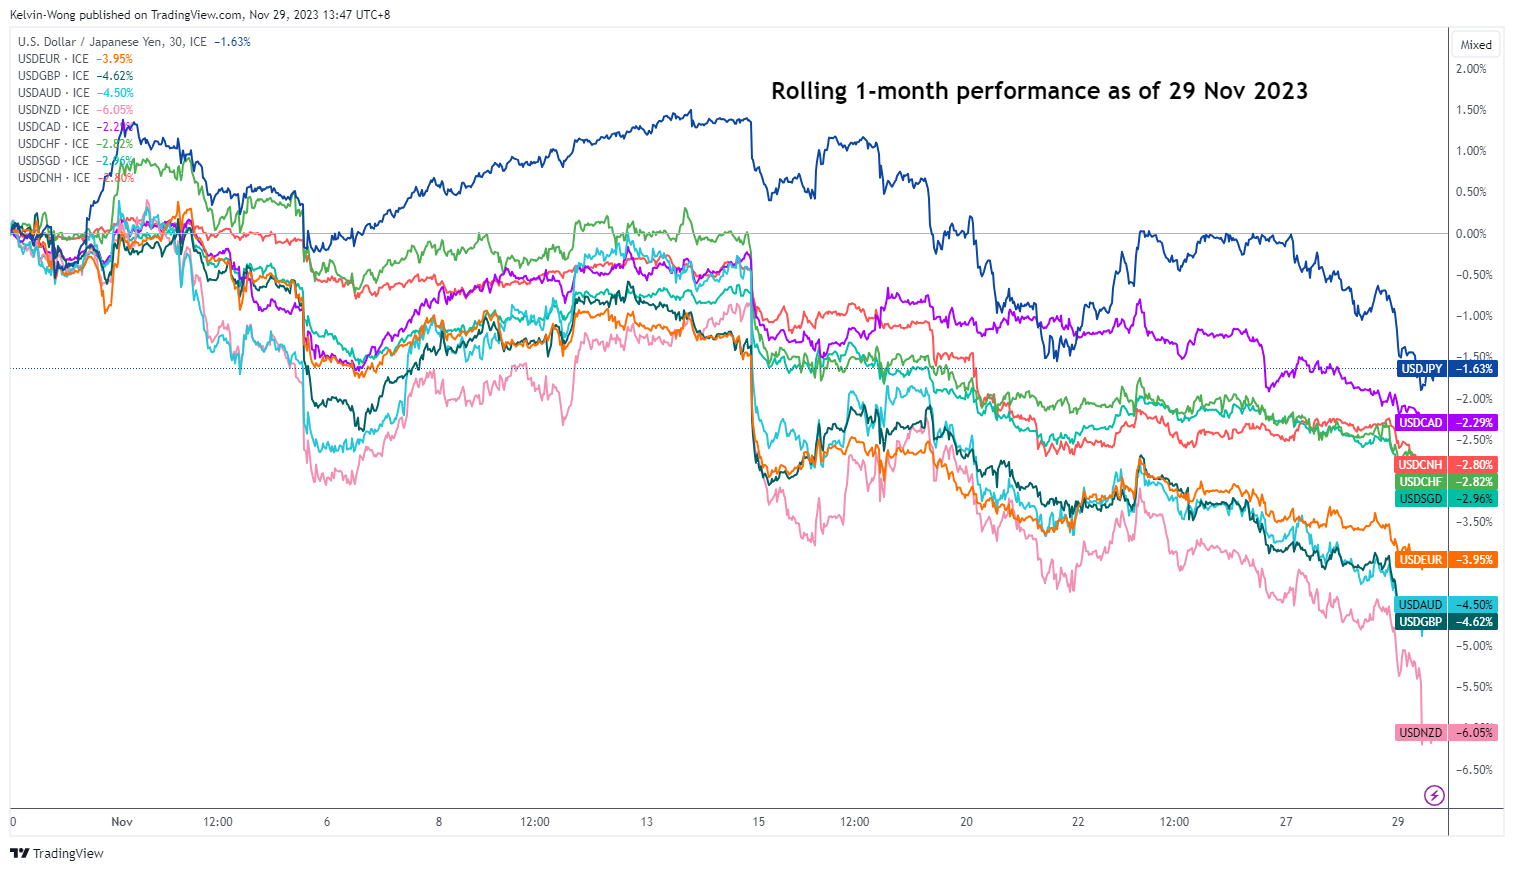
Fig 1: Rolling 1-month performance of US dollar against major currencies as of 29 Nov 2023 (Source: TradingView, click to enlarge chart)
Also based on a rolling one-month performance, the dollar has weakened the most against the Kiwi versus the other major currencies where the USD/NZD plummeted to -6.05%
Interestingly, the current resilient bullish tone seen in the NZD/USD has remained intact despite the New Zealand central bank, RBNZ maintaining its official cash rate (OCR) at 5.5% in today’s monetary policy meeting for the fourth consecutive time and in line with market consensus.
Hawkish press conference with upward OCR projection
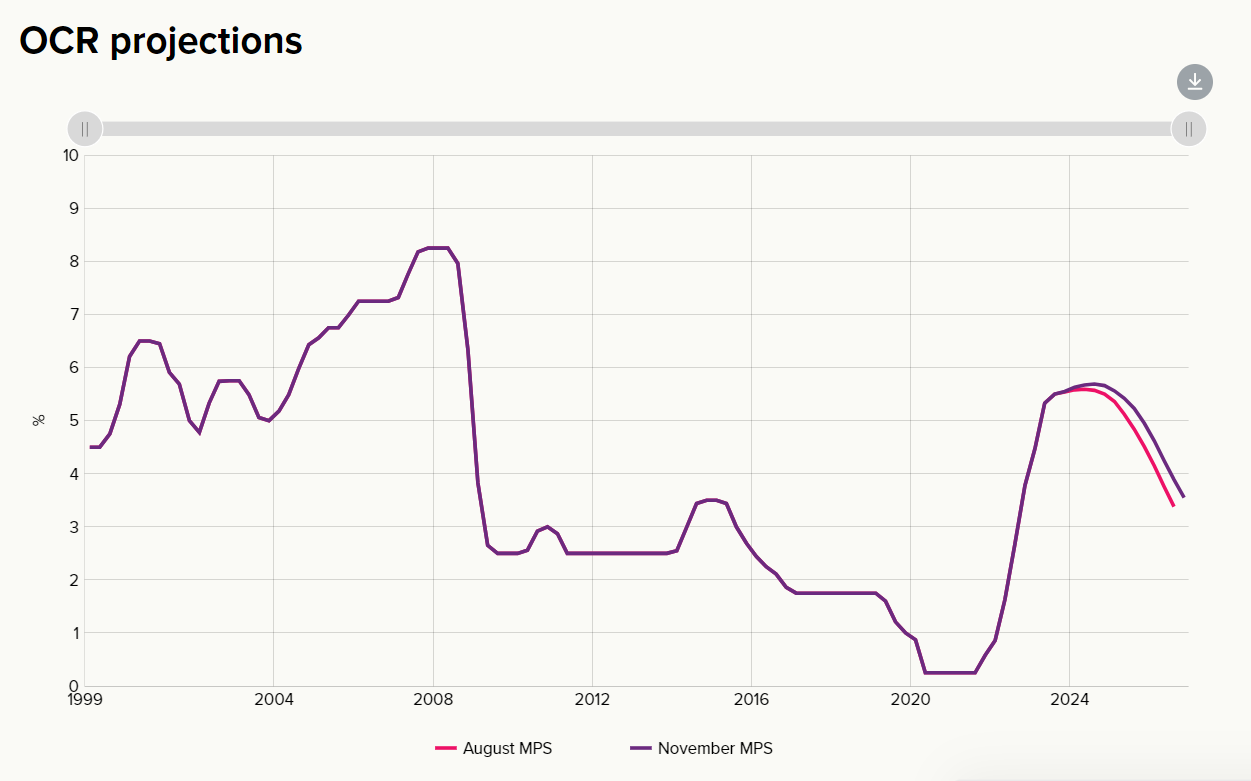
Fig 2: Latest RBNZ Official Cash Rate projection as of 29 November 2023 (Source: RBNZ website, click to enlarge chart)
RBNZ governor Orr has peppered his press conference speech with several hawkish vibes; officials discussed raising the OCR today, the risk to New Zealand’s inflation is still skewed towards the upside, expressed concerns that inflation has been outside the targeted band for a significant period and longer-term inflation expectations have remained on an upward trajectory.
Also, RBNZ has raised its latest expected peak OCR projection on its current interest rate hike cycle to hit 5.69% in September 2024, up from 5.57% projected earlier during the August 2023 monetary policy meeting. This latest set of projections suggests the OCR has not reached its terminal level, and another potential hike may come in the next meeting on 28 February 2024.
Bulls of NZD/USD eying the 0.6240 major resistance with a risk of minor pull-back
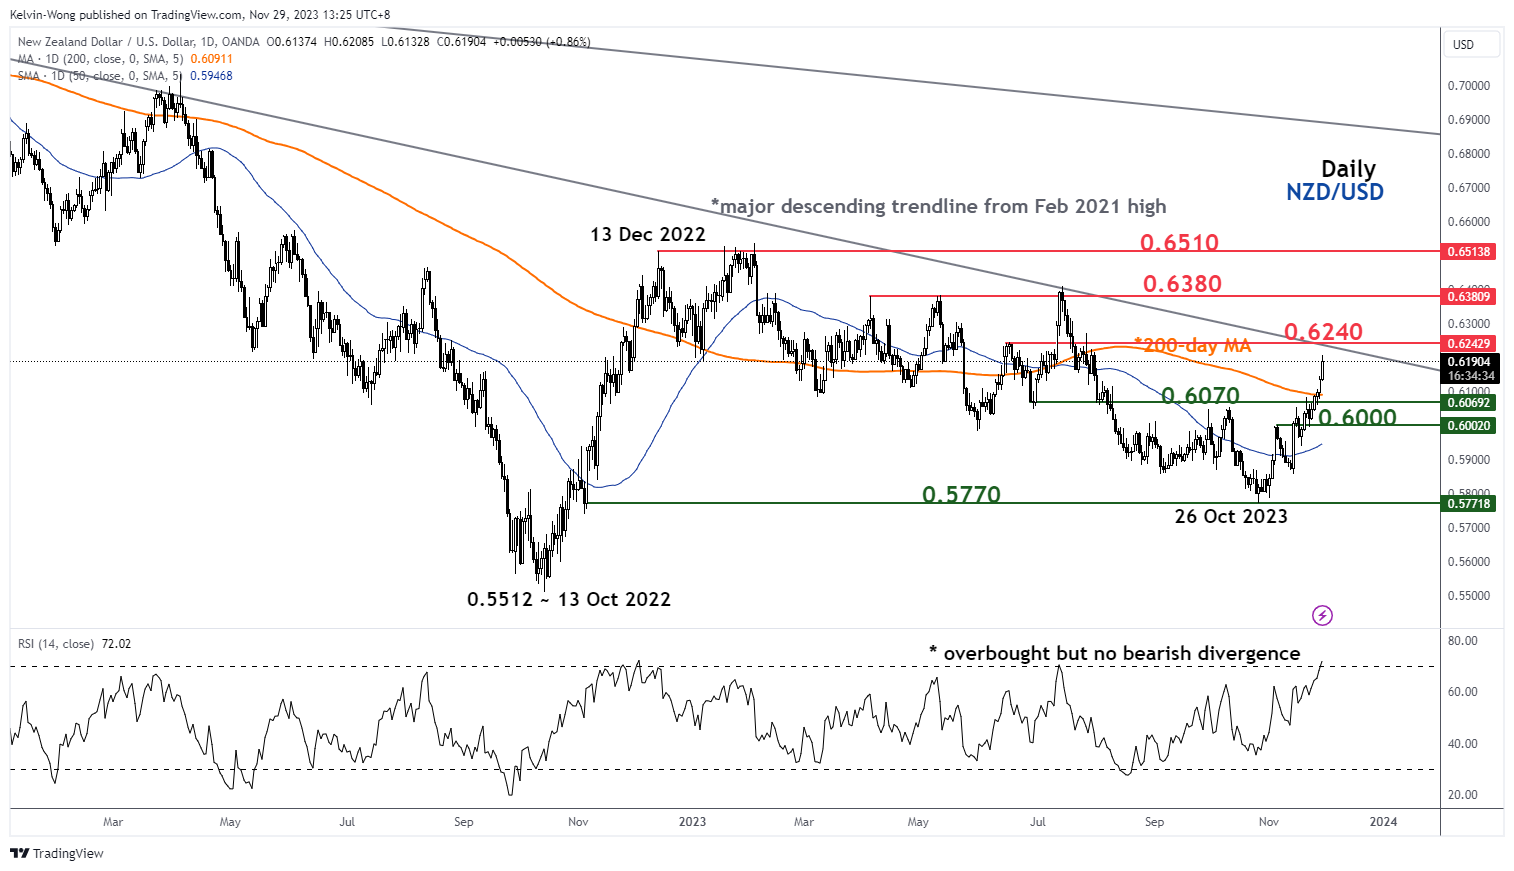
Fig 3: NZD/USD medium-term trend as of 29 Nov 2023 (Source: TradingView, click to enlarge chart)
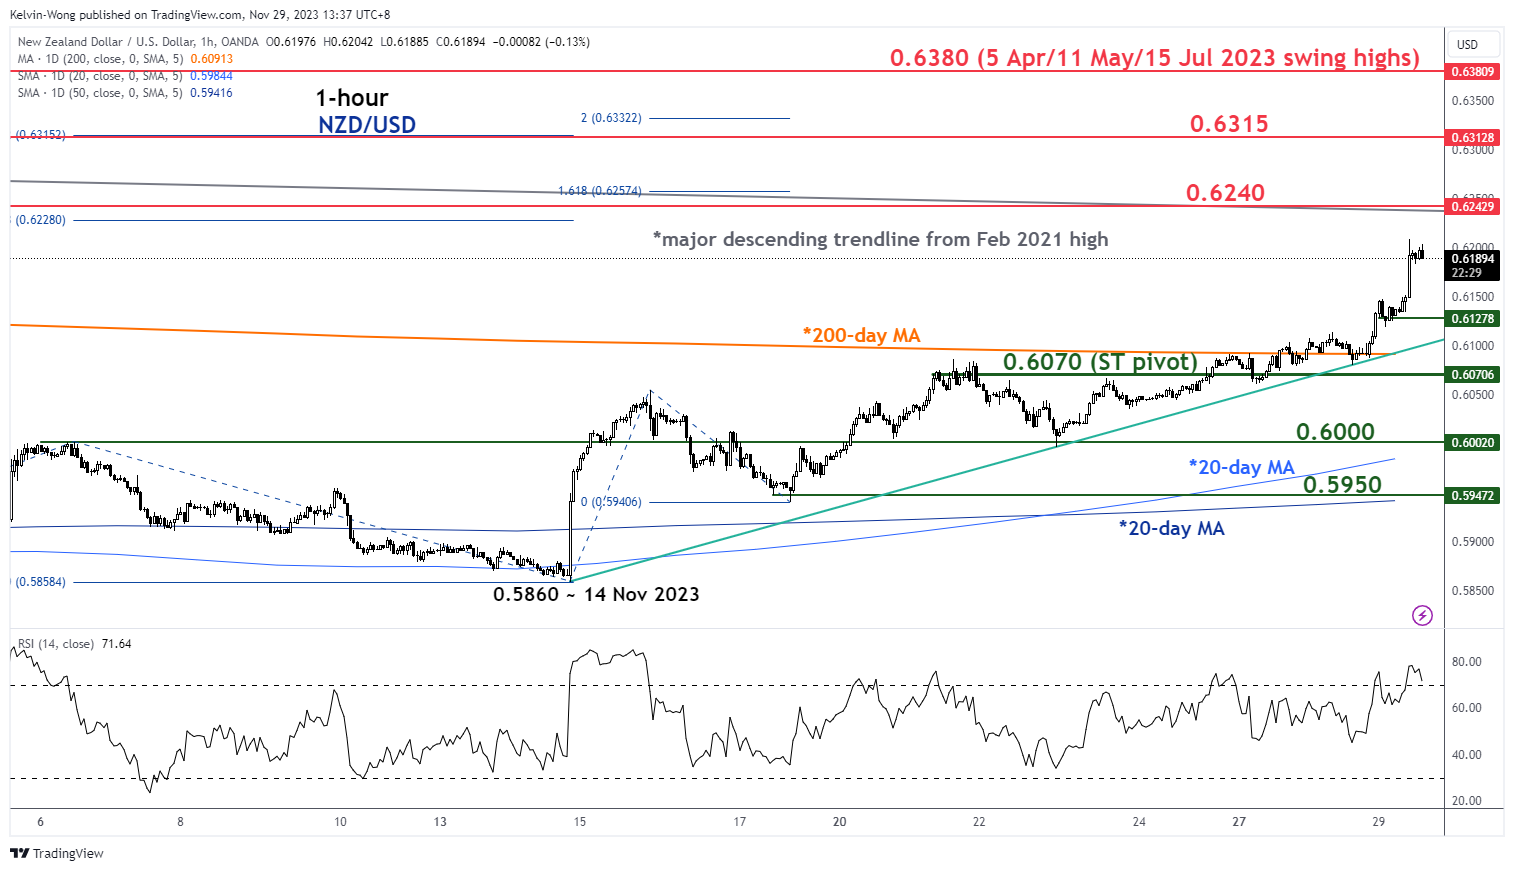
Fig 4: NZD/USD minor short-term trend as of 29 Nov 2023 (Source: TradingView, click to enlarge chart)
The current medium to short-term uptrend phases in place since the 26 October 2023 swing low of 0.5770 has led the daily RSI momentum indicator of the NZD/USD to reach an overbought level but no clear bearish divergence condition yet.
These observations suggest that medium-term upside momentum remains intact which reduces the risk of a multi-week bearish reversal.
In the shorter time frame as seen on the hourly chart, the current intraday rally from Tuesday, 28 November minor low to today’s 29 November current intraday high of 0.6208 has reached an overstretched condition, its steepest move since the 14 November 2023 low to the 15 November 2023 high upswing.
Therefore, the NZD/USD may see a minor pull-back towards 0.6130, and as long as the 0.6070 key short-term pivotal support holds (also the 200-day moving average), the minor short-term uptrend phase from the 14 November 2023 low remains intact.
A clearance above 0.6240 sees the next intermediate resistances coming in at 0.6315 and 0.6380.
On the other hand, failure to hold at 0.6070 may trigger a minor corrective decline towards the next immediate supports of 0.6000 and 0.5950 (also the upward slopping 20 and 50-day moving averages).