Sample Category Title
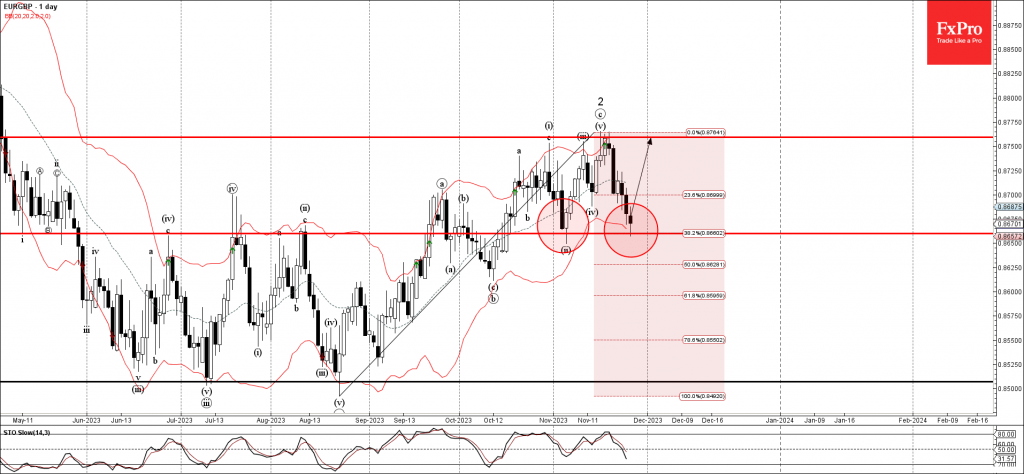
EURGBP Wave Analysis
- EURGBP reversed from support level 0.8660
- Likely to rise to resistance level 0.8760
EURGBP currency pair recently reversed up from the key support level 0.8660 (which stopped the previous minor correction ii, as can be seen below).
The support level 0.8660 was strengthened by the lower daily Bollinger Band and by the 38.2% Fibonacci correction of the upward impulse from August.
EURGBP currency pair can be expected to rise further to the next resistance level 0.8760, which stopped the previous minor correction ii.
Brent Crude – Oil Price Choppy ahead of Thursday’s OPEC+ Meeting
- OPEC+ decision made bigger by four-day delay
- Global economic outlook to impact the group’s cuts?
- Brent consolidating near recent lows
The OPEC+ meeting will be this week’s most impactful event in oil markets. Not just because any decision could have direct consequences for price and therefore inflation but also due to the meeting already being pushed back by four days, so there’s clearly some disagreement within the alliance.
The group has always found a way to get an agreement over the line before, even if that means the biggest producers taking on more of the additional commitments so it’s probably safe to say something similar will be achieved this week.
But the question is how far they’ll push it, given the recent trend in oil prices and increasing concerns around global growth next year.
Consolidation below 200-day SMA
Brent has fallen quite far over the last month but since breaking below the 200/233-day simple moving average band, it appears to have stabilized.
Brent Crude Daily
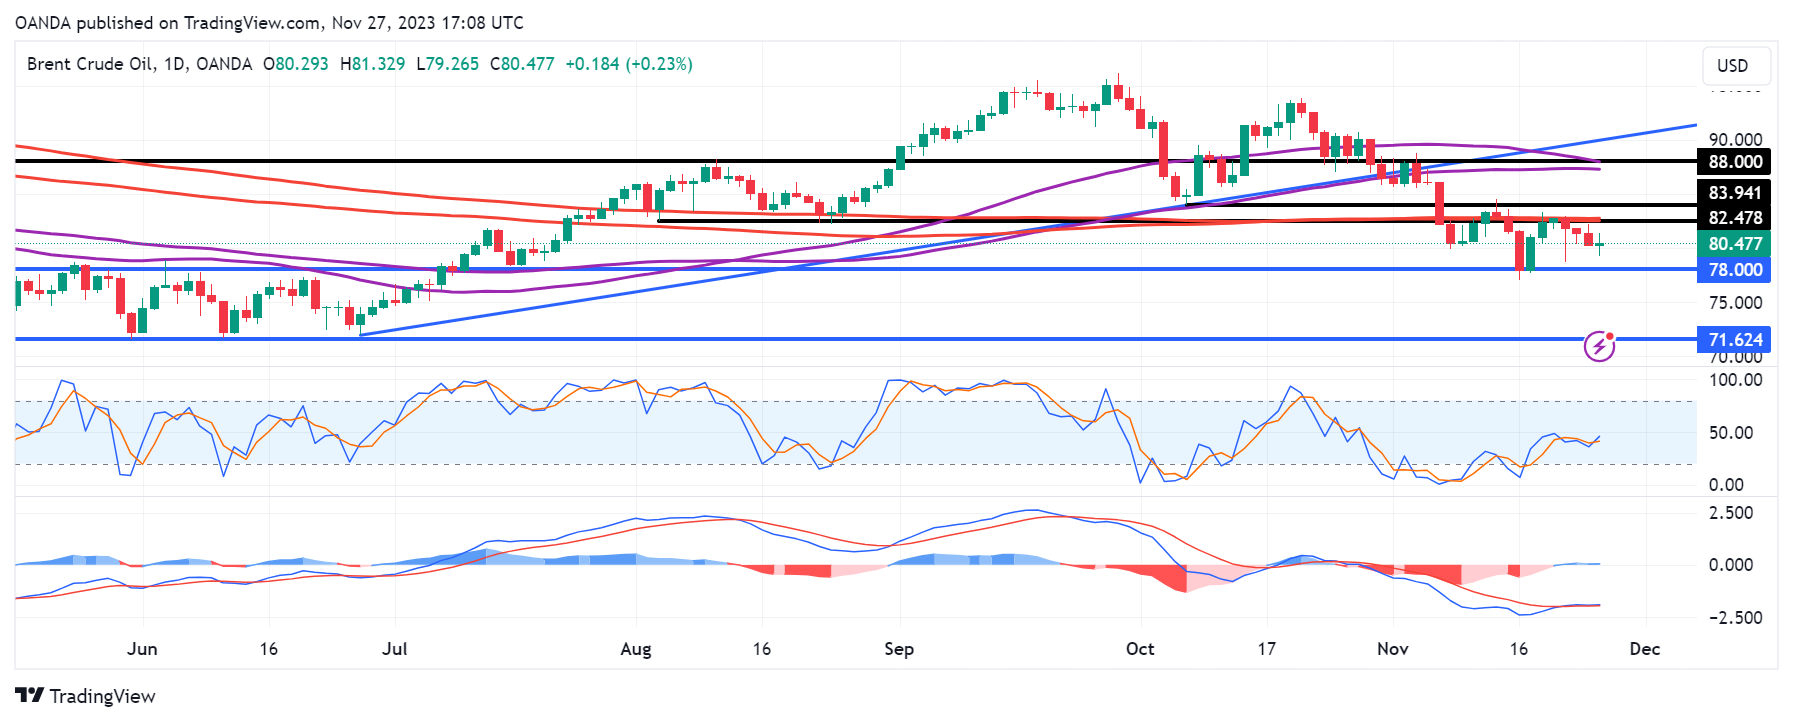
Source – OANDA on Trading View
Clearly, a lot now hangs on the outcome of the meeting and just how committed the alliance – Saudi Arabia and Russia, in particular – is to cutting output.
The most clear level of support below is $78, around the November low, with resistance then falling around $82.50 where past support coincides with the 200/233-day SMA band. A break of either may only come after the announcement but once it does happen, it could get very interesting.
USD Experiences a Downturn as EUR/USD Rises
The EUR/USD currency pair saw an uptick, reaching 1.0944 at the onset of the final week of November. This movement indicates a weakening of the US dollar against the Euro.
Key to this shift is the upcoming release of the Core Personal Consumption Expenditures (PCE) Price Index, a crucial measure watched closely by the US Federal Reserve. The Core PCE index, reflecting the primary personal spending of US citizens, is a significant indicator for the Federal Reserve in shaping its credit and monetary policies. The index had previously shown a 0.3% month-over-month increase, but expectations for October point to a potential slowdown to a 0.2% rise.
A slowdown in inflation, as indicated by the Core PCE index, could lead to a softer stance from the Federal Reserve regarding interest rate hikes. This prospect could further contribute to the weakening of the US dollar. From a broader perspective, a decrease in inflation is generally viewed positively for the economy, as it eases financial pressures on consumers and businesses.
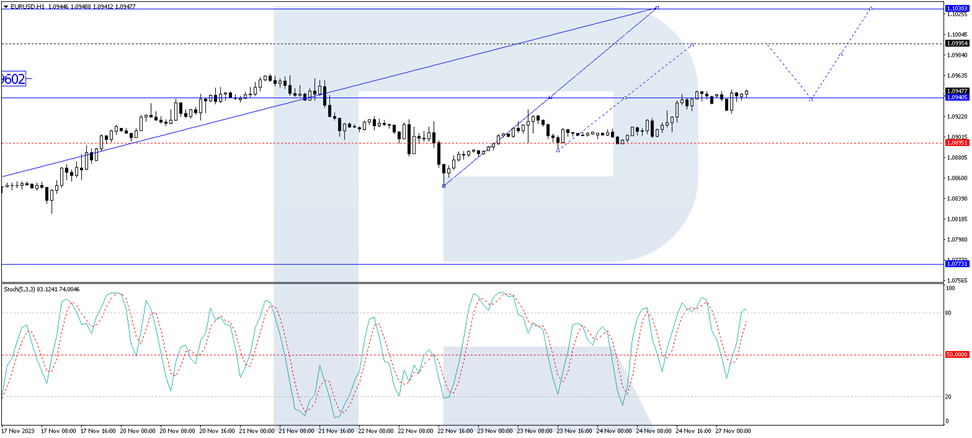
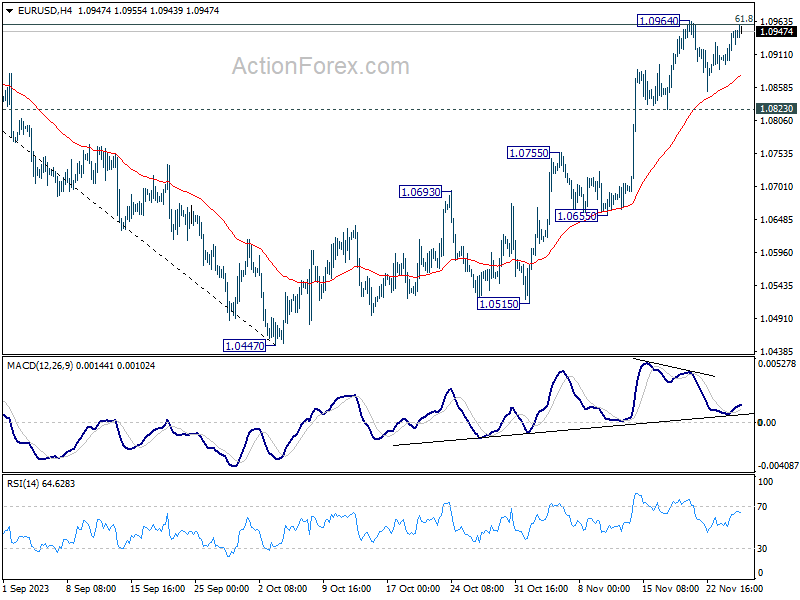
Technical Analysis of the EUR/USD Currency Pair
In the H4 chart of the EUR/USD pair, a consolidation pattern around 1.0940 has emerged, suggesting a potential breakout. The analysis predicts an upward move to 1.0990, followed by a possible pullback to 1.0940, and then another rise to 1.1030. This bullish outlook is supported by the Moving Average Convergence Divergence (MACD) indicator, which shows its signal line above zero and oriented upwards.
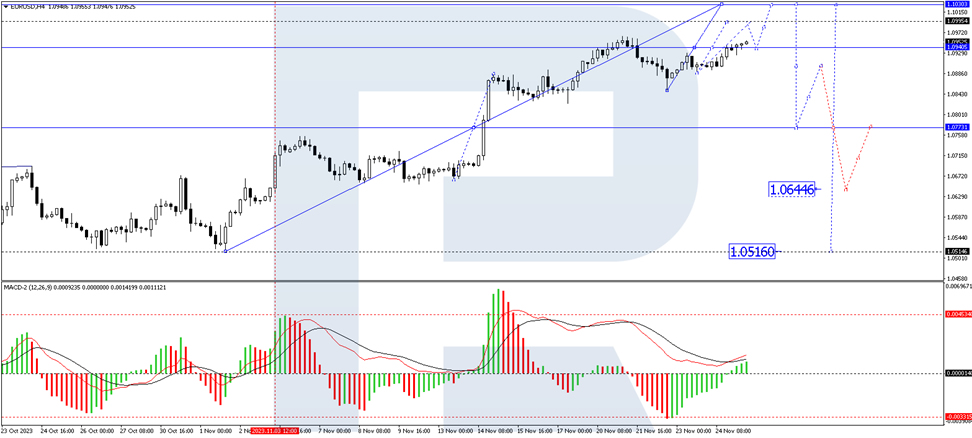
Similarly, the H1 chart for the EUR/USD pair displays a narrow consolidation around 1.0940. The market is anticipated to break upwards from this range, possibly reaching a local target of 1.0990. Upon hitting this level, a correction back to 1.0940 is expected. The Stochastic oscillator, with its signal line currently above 80, suggests the potential for a downward adjustment towards 50, supporting this forecast.
Sunset Market Commentary
Markets
Core bonds strengthened today and in doing so erased part (US) or much of the two-day losing streak at the end of last week. US Treasuries underperformed as investors await the upcoming double auction. Treasury is selling $54 bn 2-y notes and $55 bn 5-year notes in a 1.5 hour timespan later today. Yields decline 0.8-1.7 bps. The Bund was trading a bit heavy before a late-morning rally kicked in. German rates currently drop 5.3-8.2 bps with the belly outperforming the wings. ECB’s Lagarde prepared remarks for the European parliament entailed nothing new. She said the economy is likely to remain weak for the rest of the year and that the job markets is showing some signs of easing even as wage pressures remain strong. However, given the considerable uncertainty on the inflation outlook and the fact that it may tick up again in coming months, it’s not the time to declare victory yet. Lagarde did say the central bank would probably discuss PEPP “in a not too distant future”. UK gilt yields also drop several basis points, to the tune of 4.2-6.3 bps. Bank of England governor Bailey again resisted market speculation for quick rate cuts. These are “unlikely” for the “foreseeable future”. He said the recent sharp drop in inflation to 4.7% was good news but warned that getting to the 2% target is “a game of two halves”. The first half was the easy part with large base effects pushing CPI down basically automatically. “The rest of it has to be done by policy and monetary policy”, he added. Bailey aired similar comments already last week. Together with the unexpected return of the composite/services PMI in expansion territory on Friday, UK money markets pushed the timing of a first full cut further in time from June 2024 early last week to August today. Stock markets seem to no longer benefit from falling core yields with the likes of the EuroStoxx50 (-0.1%) and Wall Street (about -0.2%) trading with moderate losses.
EUR/USD’s early morning test of the 1.096 resistance level failed, triggering marginal return action lower. The pair is currently hovering around opening levels of 1.093. The trade-weighted dollar index fell to 103.32, closing in on last week’s – and by extension three-month – lows. The Japanese yen is outperforming in the G10 area. USD/JPY eases to 148.86, EUR/JPY drops to 162.74. Sterling is better bid against the two majors. Cable (GBP/USD) rises to a two-month high of 1.262. EUR/GBP is extensively testing support at the 38.2% retracement (0.866) of the Aug-Nov rally.
News & Views
The Confederation of British Industry (CBI) published the results of its quarterly CBI Distributive Trades Survey. Retail sales volumes fell in the year to November, but at a slower pace than last month (weighted balance of -11% from -36%). This trend might continue in December (-6%) and firms expect their business situation to improve slightly over the next three months (+4% from -14% in August). They are inclined to reduce investment in the year ahead (compared to the past 12 months) although at a slower pace than in August (-11% from -25%) while employment is anticipated to be broadly unchanged (+1%) in the next month following a reduction in headcount in the year to November (-11%). Retail selling prices continued to rise at a rapid pace over the past year (+73% from +73% in August) with selling prices expected to maintain a similar rate of growth next month (+72%). CBI commented that last week’s Autumn Statement by the Chancellor didn’t deliver a reprieve from next year’s hike in business rates which leaves many retailers with another increase in costs at a time when they are least able to afford them.
The Hungarian GKI economic sentiment index indicator increased from -17 to -15.4 in November. The increase was thanks to an improvement in business confidence (-7.9 from -10.5) whereas consumer confidence ticked back from an 18-month high (-36.7 from -35.6). The latter was mainly due to a deterioration in the own financial situation over the past 12 months. On the business side, firms’ employment expectations improved and their plans to raise prices declined compared to October. On a sectoral level, best improvements came in industry and especially business services.
Gold Opts for a Long-Term Trend
Gold touched six-month highs, moving into territory above $2010 at the start of the new week. Over the past three years, the price has climbed above $2000 several times but failed to hold there for a long.
Technically, gold started the week with a dash into thin air territory as the price went above the previous local highs soon after the opening bell. This is an immaculate execution of the Fibonacci pattern, where the initial momentum from $1810 to $2010 corrected to 61.8% of that move, which also coincided with a touch of the 200-day average at $1935. The breakout to new highs formally confirms a bullish scenario with a potential move to 161.8% at $2130.
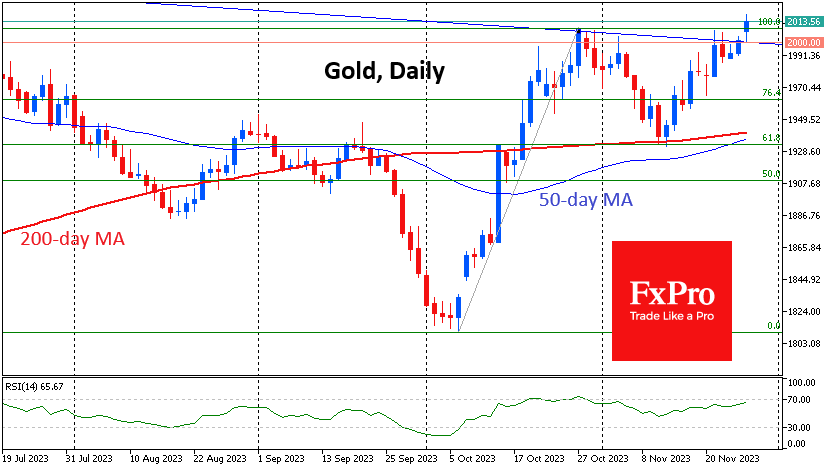
Gold will need strong tailwinds to realise such a bullish scenario. And there could be problems with that. A robust US economy and a worrisome geopolitical environment have kept interest in gold alive, as has pressure in US debt markets. For investors, government bonds look more attractive than gold because they yield, and at one point, they were down 50% from their peak.
The interest in gold at high levels in recent years may also have been fuelled by the interest of China or other emerging markets to diversify their reserves away from the dollar. Whether this was actual demand or just speculation to that effect is not essential. The big question now is whether China or Saudi Arabia will remain net buyers of gold amid shrinking trade surpluses or move into active gold sales to support the growth of their economies.
The long-term picture also points to the formation of a triple top in gold – a reversal pattern. However, its legitimacy is now in doubt amid the rapid upward reversal since the beginning of October.
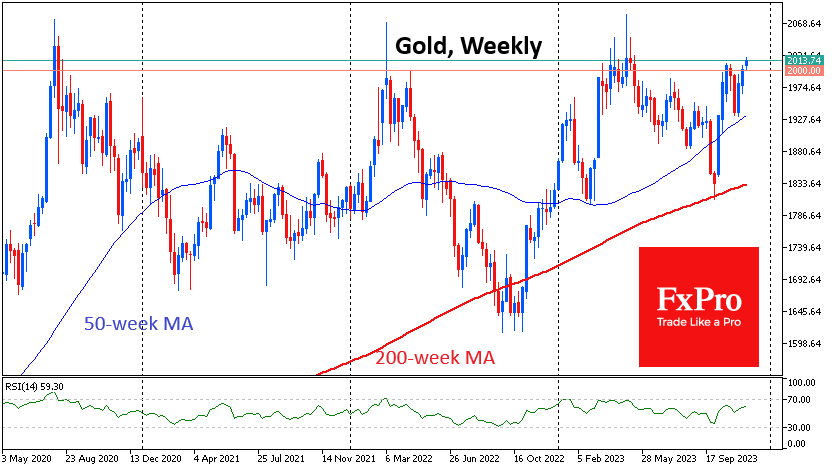
In any case, the dynamics of gold in the coming days promise to be trend-defining for many months ahead, as we may see either a breakout of long-term and psychologically important resistance or the beginning of a multi-month or even multi-year bear market.
ECB’s Lagarde on Inflation: Domestic Drivers Overtake External Sources
In her address to European Parliament's Committee on Economic and Monetary Affairs, ECB President Christine Lagarde noted that the fall in October's inflation to 2.9% was due to both "general decline" and "base effects," with non-energy and non-food inflation continuing to moderate. However, domestic inflation, less affected by imports, remains stubbornly high, indicating inflation is now "driven more by domestic sources than by external sources".
Lagarde highlighted that strong wage pressures are mainly a "catch-up" effect from past inflation, rather than a new, s"self-fulfilling dynamic". She anticipates continuation of the weakening in inflationary pressures, though a slight increase in headline inflation might occur in the near term due to base effects. Yet, she expressed that medium-term inflation outlook is clouded with "considerable uncertainty."
Regarding the broader economy, Lagarde pointed out that Eurozone activity has "stagnated" recently and is expected to "remain weak for the rest of the year," as reflected in Q3 GDP contraction. This weakness stems from higher interest rates, reduced foreign demand, and diminishing effects from economic reopening. While manufacturing output has been declining, services sector is also weakening, and there are signs that job growth may slow down by year-end.
Despite subdued short-term outlook, Lagarde believes Eurozone economy will "strengthen again over the coming years," driven by decreasing inflation, improved household incomes, and stronger demand for Euro area exports.
Finally, she reiterated the ECB's commitment to maintaining policy rates at "sufficiently restrictive levels for as long as necessary," basing future decisions on data, inflation dynamics, and the effectiveness of monetary policy transmission.
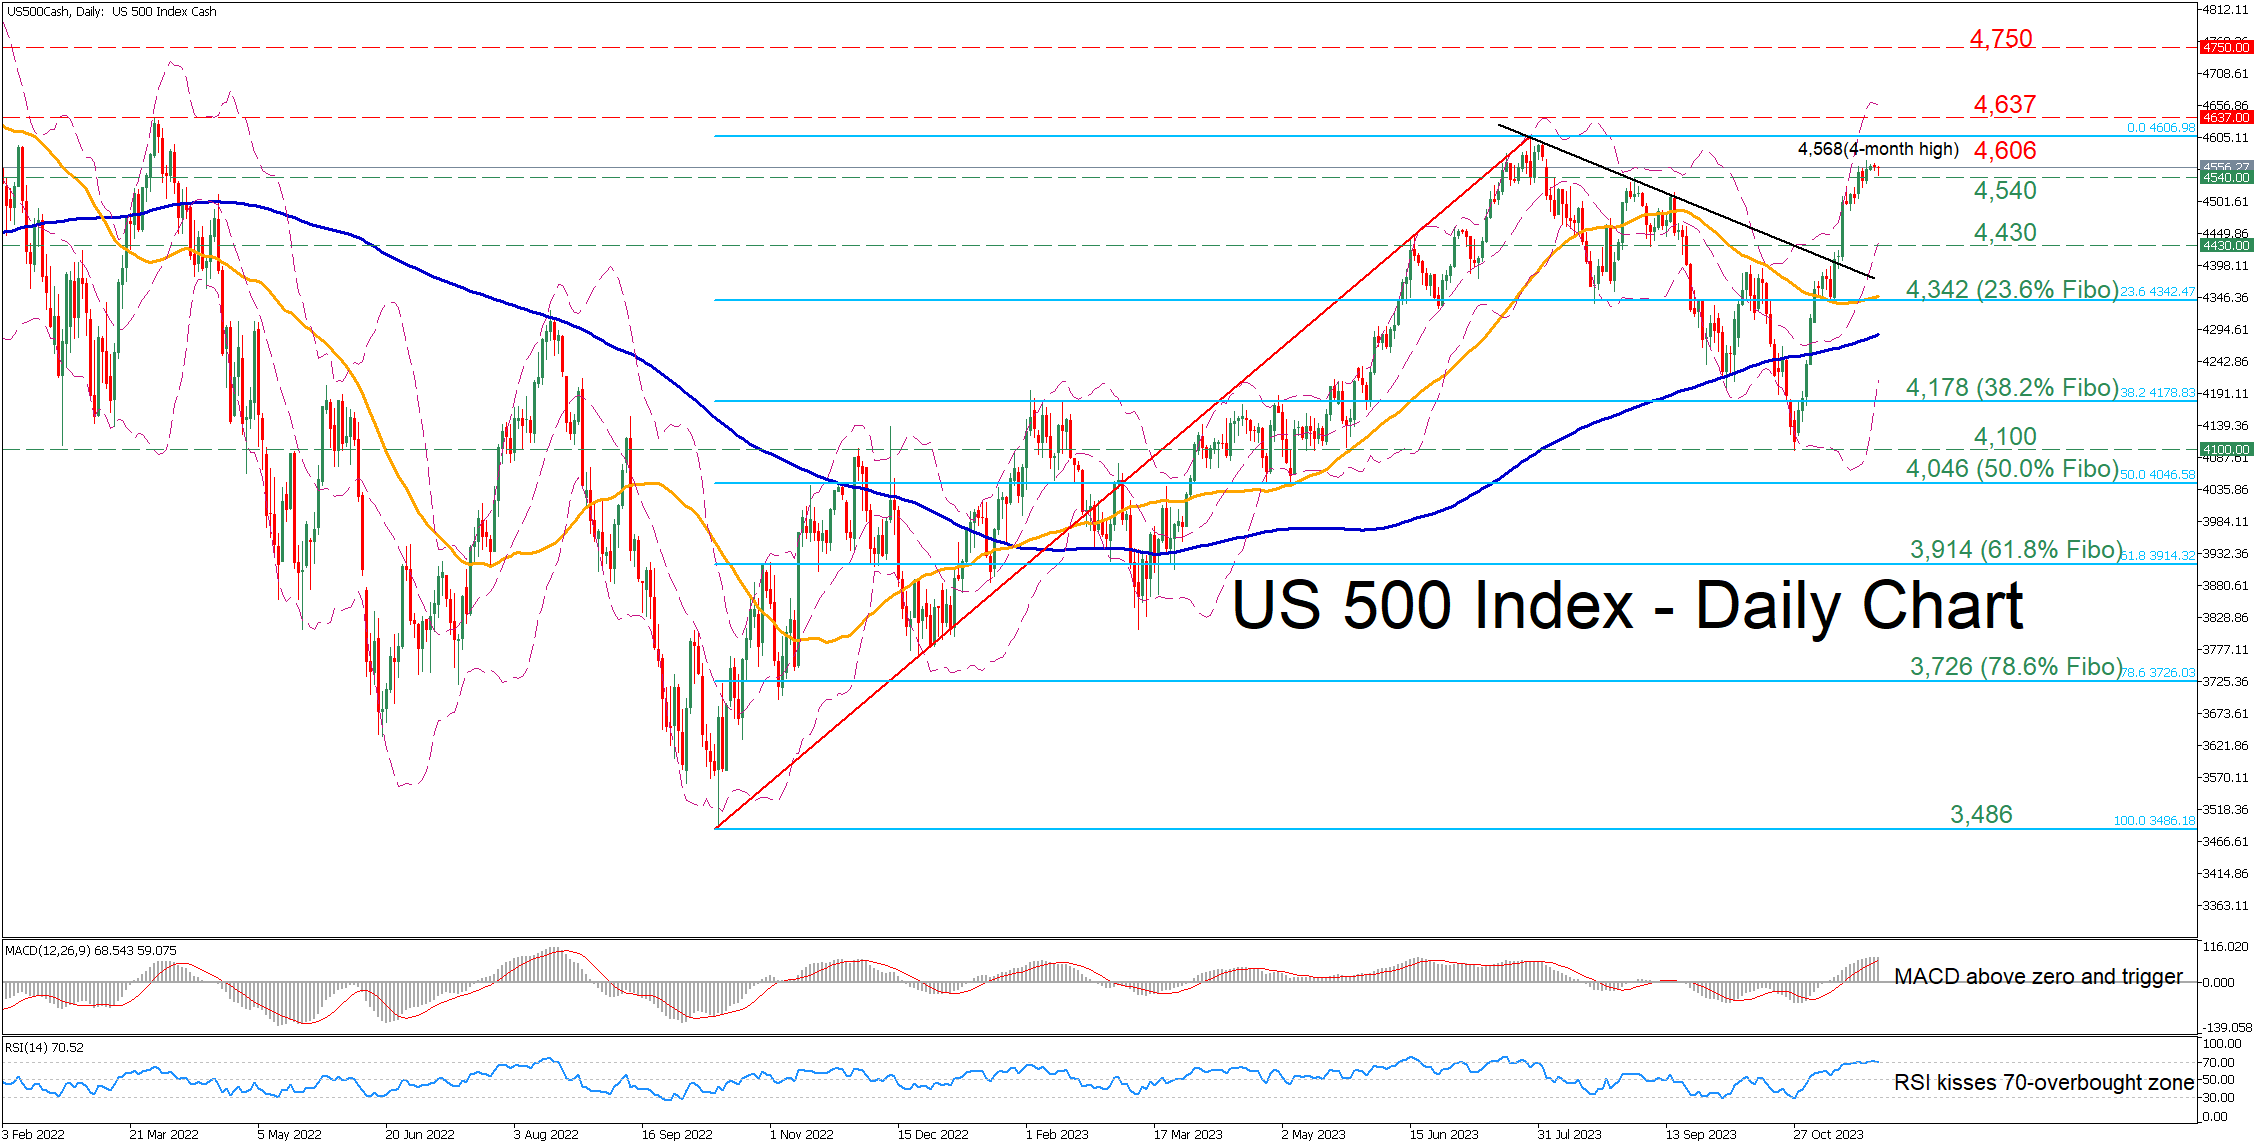
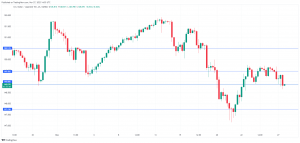
US 500 Consolidates Near 4-month Highs
- US 500 index trades sideways after posting fresh 4-month peak
- Momentum indicators approach their overbought zones
- Risk of a downside correction is increasing
The US 500 stock index (cash) has been staging an impressive rally since it bottomed out in October, piercing through the descending trendline that connects its recent lower highs. However, the uptrend appears to be on hold in the last few sessions as the short-term oscillators are pointing at overbought conditions.
Should buyers attempt to push the price even higher, immediate resistance could be found at the 2023 high of 4,606. Surpassing that zone, the index could ascend towards the March 2022 peak of 4,637. A break above that territory could open the door for the January 2022 resistance region of 4,750.
On the flipside, if the price experiences a pullback, the September peak of 4,540 could now act as the first line of defence. Should that barricade fail, the bears could attack the September support of 4,430. Failing to halt there, the price may challenge 4,342, which is the 23.6% Fibonacci retracement of the 3,486-4,606 upleg.
Overall, the US 500 index has been facing persistent upside pressures in the past three weeks. However, the price could soon experience a pullback as the momentum indicators currently suggest that the advance is pretty much overdone.
Japanese Yen Rises Ahead of BoJ Inflation
- BoJ Core CPI expected to remain unchanged at 3.4%
- US posts mixed PMI report
The Japanese yen has started the week in positive territory. In the European session, USD/JPY is trading at 148.87, down 0.39%.
Japanese yen eyes BoJ Core CPI
Japan’s core inflation rate has been moving higher. Last week, the nationwide core CPI rose to 2.9% for October, up from 2.8%. On Tuesday, we’ll get a look at BoJ Core CPI, which is one of the Bank of Japan’s preferred inflation gauge. The indicator has been steadily rising from a 2023 low of 2.7% back in February. The market consensus for October stands at 3.4%, unchanged from the September print.
Inflation has been above the BoJ’s target of 2% for months, raising speculation that the BoJ is planning to tighten policy and could even raise interest rates from -0.1% to zero early in 2024. Unlike the Federal Reserve, the BoJ is known to be very tight-lipped and investors shouldn’t expect any clear signals from the central bank about its future rate path.
The BoJ has insisted that although inflation has been persistently above target, it is not sustainable without substantial wage growth to drive domestic demand. There have been some subtle signals from the central bank that it will make a shift away from its ultra-loose policy, and inflation releases will play a key role in the BoJ’s decision at the next meeting on December 19.
The US ended the week with a mixed PMI report. Manufacturing PMI eased to 49.4, down from 50.0 and shy of the consensus estimate of 49.8. Manufacturing has posted mostly declines as the sector remains in a severe slump. Services is in better shape, with the PMI pointing to weak growth in the past few months . The PMI improved slightly to 50.8 in October, up from 50.6 a month earlier. On Thursday, the US releases ISM Manufacturing PMI, which is expected to post another decline.
USD/JPY Technical
- USD/JPY is testing support at 148.88. Below, there is support at 147.74
- There is resistance at 149.95 and 150.61
EUR/USD Mid-Day Outlook
Daily Pivots: (S1) 1.0907; (P) 1.0928; (R1) 1.0961; More...
EUR/USD is staying in range below 1.0964 and intraday bias remains neutral at this point. Further rally is in favor as long as 1.0823 support holds. Sustained break of 61.8% retracement of 1.1274 to 1.0447 at 1.0958 will resume the rise from 1.0447 to retest 1.1274 high. However, firm break of 1.0823 will indicate short term topping, and turn bias back to the downside for deeper decline.
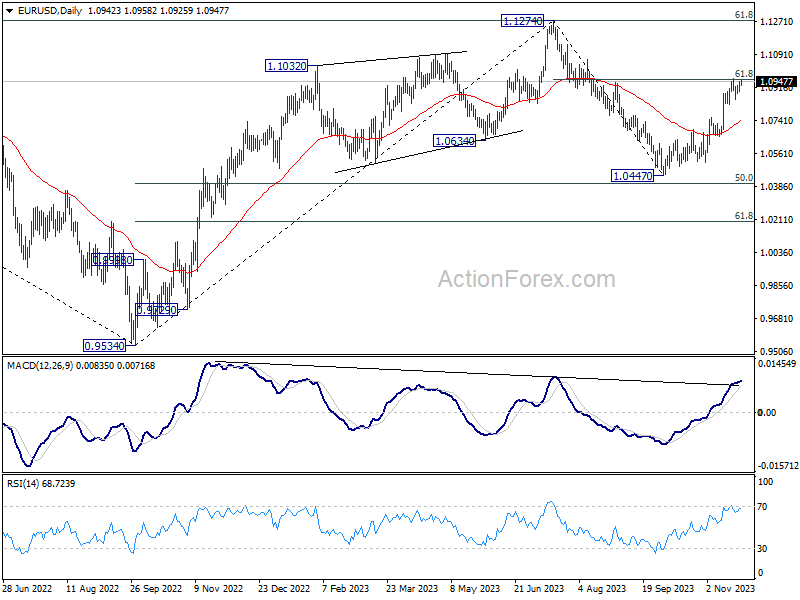
In the bigger picture, price actions from 1.1274 are viewed as a corrective pattern to rise from 0.9534 (2022 low). Rise from 1.0447 is tentatively seen as the second leg. Hence while further rally could be seen, upside should be limited by 1.1274 to bring the third leg of the pattern.
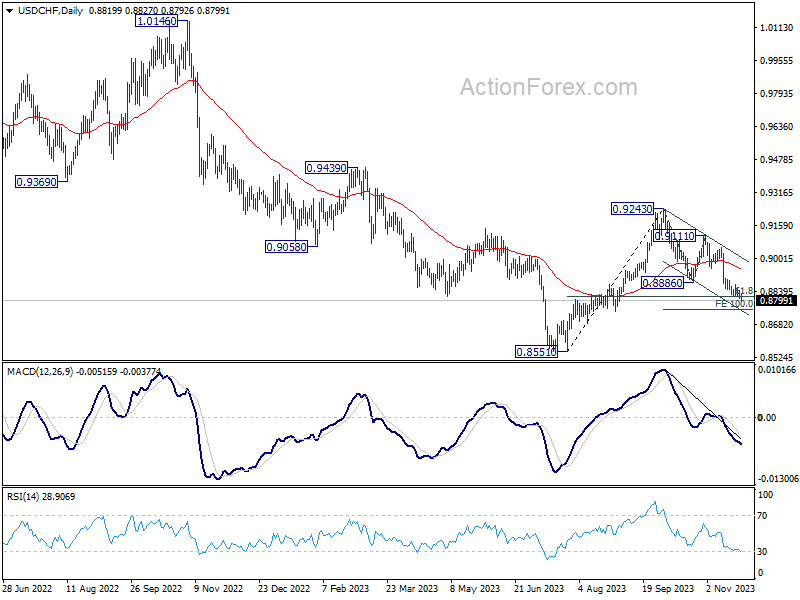
USD/CHF Mid-Day Outlook
Daily Pivots: (S1) 0.8809; (P) 0.8829; (R1) 0.8848; More....
No change in USD/CHF's outlook. Intraday bias stays on the downside for the moment. Current fall from 0.9243 should target 100% projection of 0.9243 to 0.8886 from 0.9111 at 0.8754 next. Nevertheless, break of 0.8873 resistance will turn bias to the upside for stronger rebound.
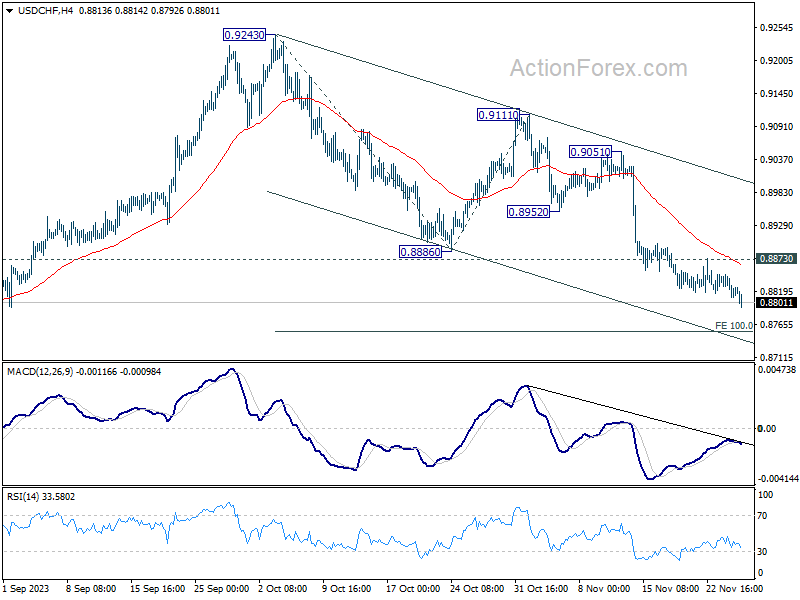
In the bigger picture, price actions from 0.8551 are currently seen as part of a corrective pattern to the decline from 1.0146 (2022 high). Fall from 0.9243 is seen as the second leg for now. 61.8% retracement of 0.8551 to 0.9243 at 0.8815 was already met. Sustained break there will bring retest of 0.8551 low. For now, this will remain the favored case as long as 0.9111 resistance holds.