Sample Category Title
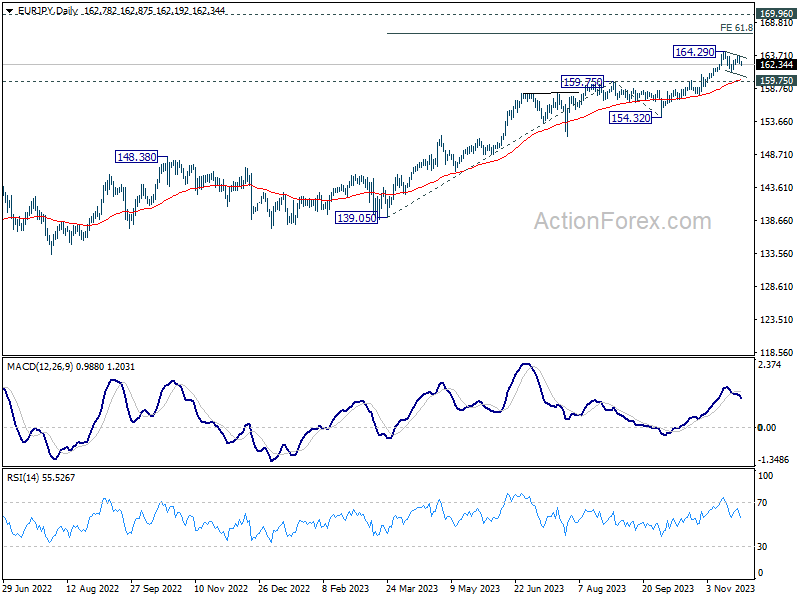
EUR/JPY Daily Outlook
Daily Pivots: (S1) 162.37; (P) 163.04; (R1) 163.55; More....
EUR/JPY's break of 162.42 minor support suggest that rebound from 161.22 has completed. Intraday bias is back on the downside to extend the corrective pattern from 164.29, with a third leg. Deeper fall should be seen through 161.22 to 100% projection of 164.29 tot 161.22 from 163.77 at 160.63. But strong support should be seen from 159.75 resistance turned support to bring rebound. Nevertheless, for now, risk will stay on the downside as long as 163.70 resistance holds, in case of recovery.
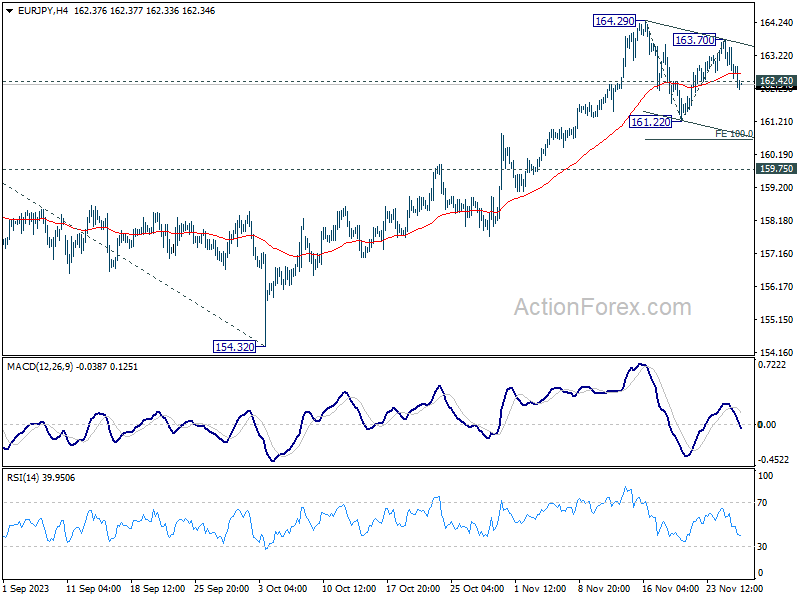
In the bigger picture, rise from 114.42 (2020 low) is in progress. Next target is 169.96 (2008 high). On the downside, break of 159.75 resistance turned support is needed to be the first sign of medium term topping. Otherwise, outlook will remain bullish even in case of deep pullback.
EUR/GBP Mid-Day Outlook
Daily Pivots: (S1) 0.8659; (P) 0.8674; (R1) 0.8689; More....
Intraday bias in EUR/GBP remains on the downside for 0.8648 support. Decisive break there will argue that whole rise from 0.8491 has completed and turn near term outlook bearish. Nevertheless, break of 0.8706 minor resistance will retain near term bullishness and bring retest of 0.8764 instead.

In the bigger picture, down trend from 0.9267 (2022 high) should have completed completed with three down to to 0.8491. Rise from 0.8491 is seen as another leg inside that pattern from 0.9499 (2020 high). Further rally should be seen to 0.8977 resistance and above. However, firm break of 0.8648 support will dampen this view, and open up the case for another medium term decline through 0.8941.

EUR/AUD Daily Outlook
Daily Pivots: (S1) 1.6539; (P) 1.6602; (R1) 1.6643; More...
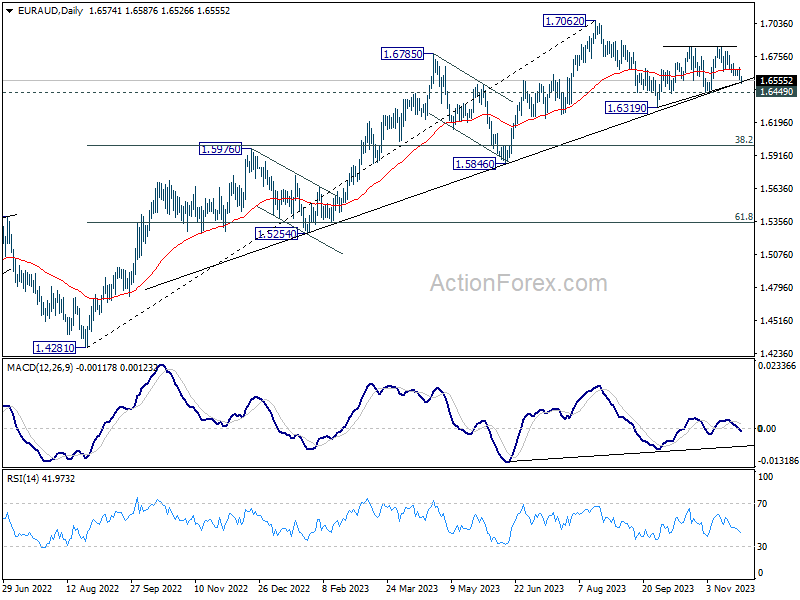
No change in EUR/AUD's outlook and intraday bias remains on the downside for 1.6449 support. Firm break there will argue that the pattern from 1.6319 has completed at 1.6844 as a corrective move, and fall from 1.7062 is ready to resume through 1.6319. On the upside, above 1.6662 minor resistance will turn intraday bias neutral first.
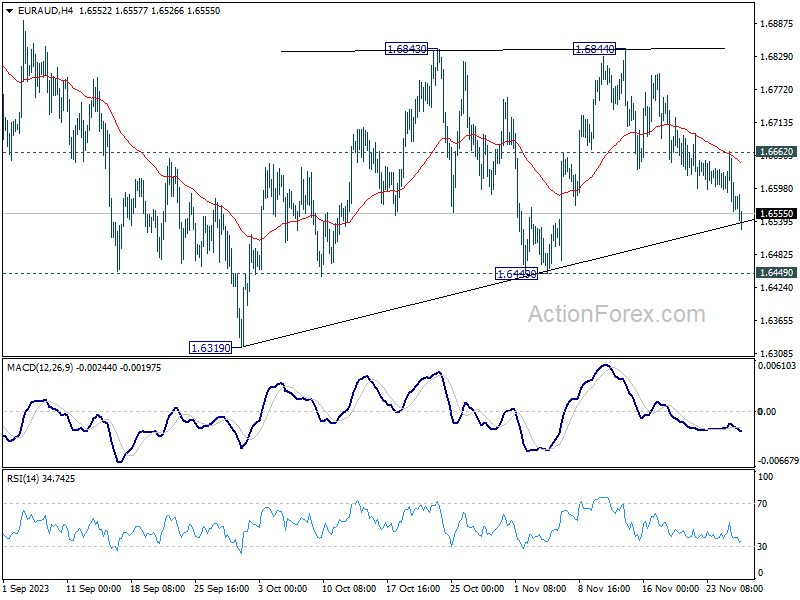
In the bigger picture, while 1.7062 is a medium term top, there is no clear sign of trend reversal as EUR/AUD continues to draw strong support from the medium term trend line. Break of 1.7062 will resume the larger up trend from 1.4281 (2022 low) to 1.7691 fibonacci level. Nevertheless, break of 1.6449 support will argue that deeper correction is underway to 38.2% retracement of 1.4281 to 1.7062 at 1.6000.
EUR/CHF Daily Outlook
Daily Pivots: (S1) 0.9624; (P) 0.9642; (R1) 0.9660; More...
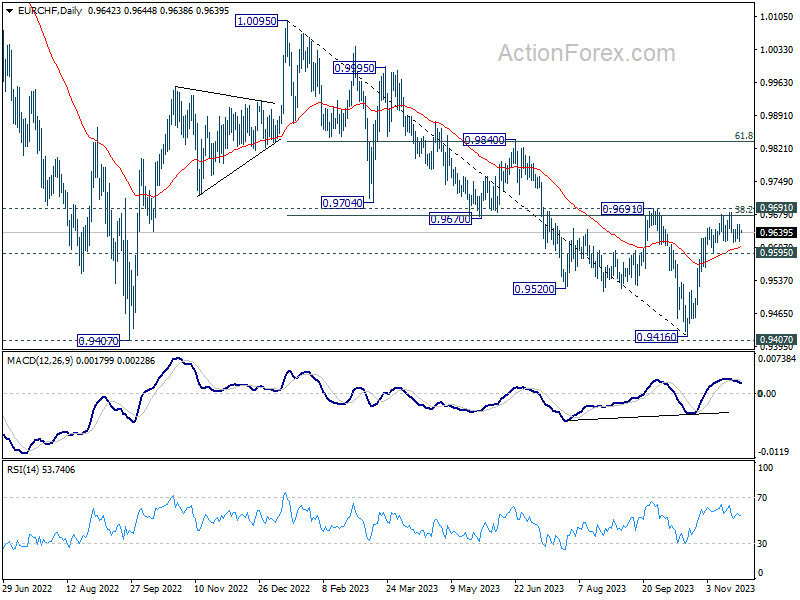
Sideway trading continues in EUR/CHF and intraday bias stays neutral. Further rally is still expected and decisive break of 0.9691 resistance will carry larger bullish implication, and target 0.9840 resistance next. However, break of 0.9595 support will indicate short term topping, and turn bias back to the downside for deeper pull back.
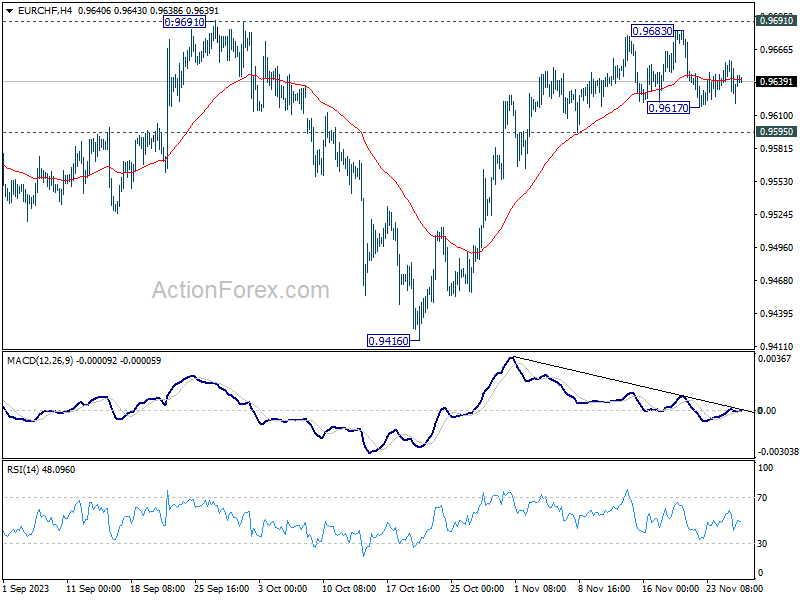
In the bigger picture, fall from 1.0095 (2023 high) might have completed at 0.9416, just ahead of 0.9407 support (2022 low). Sustained break of 0.9691 cluster resistance (38.2% retracement of 1.0095 to 0.9416 at 0.9675) will pave the way to 61.8% retracement at 0.9836 and above. However, rejection by 0.9691 will maintain medium term bearishness for another test on 0.9407 at least.
USD/CAD Daily Outlook
Daily Pivots: (S1) 1.3599; (P) 1.3631; (R1) 1.3647; More...
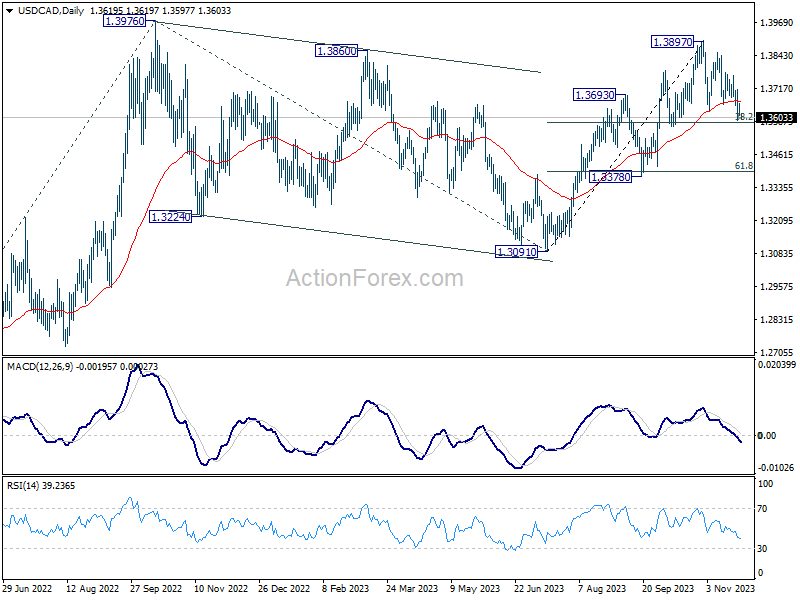
At this point, strong support is still expected from 38.2% retracement of 1.3091 to 1.3897 at 1.3589 to contain downside and bring rebound. Break of 1.3711 minor resistance will turn bias back to the upside for retesting 1.3897. However, sustained break of 1.3589 will indicate that deeper correction is underway to 61.8% retracement at 1.3399 next.
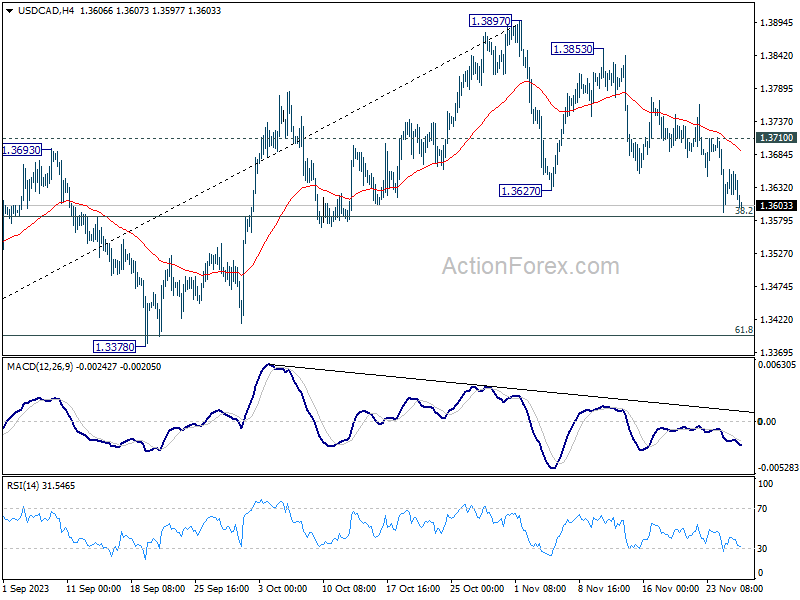
In the bigger picture, corrective pattern from 1.3976 (2022 high) should have completed with three waves down to 1.3091. Decisive break of 1.3976 high will confirm resumption of up trend from 1.2005 (2021 low). Next target is 61.8% projection of 1.2401 to 1.3976 from 1.3091 at 1.4064. This will remain the favored case as long as 1.3378 support holds.
AUD/USD Daily Report
Daily Pivots: (S1) 0.6559; (P) 0.6576; (R1) 0.6601; More...
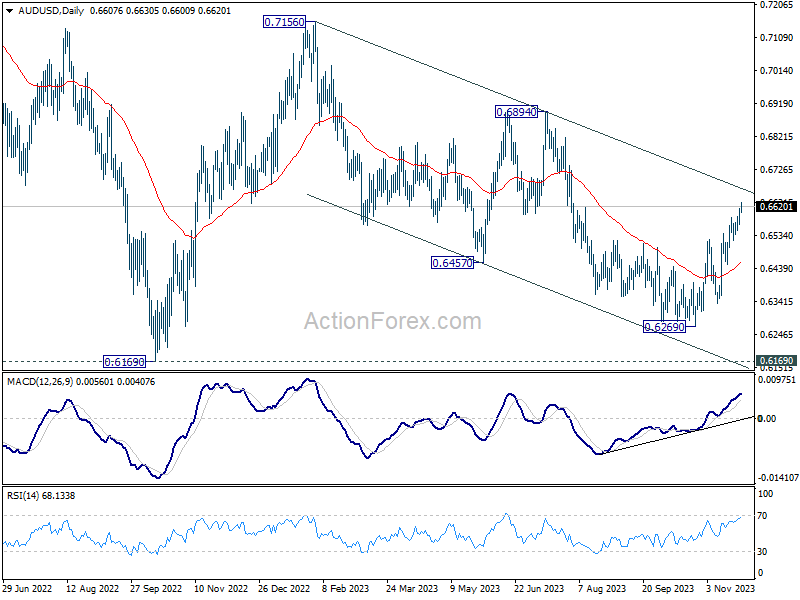
Intraday bias in AUD/USD remains on the upside for the moment. Current rally from 0.6269 should extend to channel resistance (now at 0.6665). Sustained break there will pave the way to 0.6894 resistance next. On the downside, below 0.6585 minor support will turn intraday bias neutral and bring consolidations first. But further rise will remain in favor as long as 0.6521 resistance turned support holds.
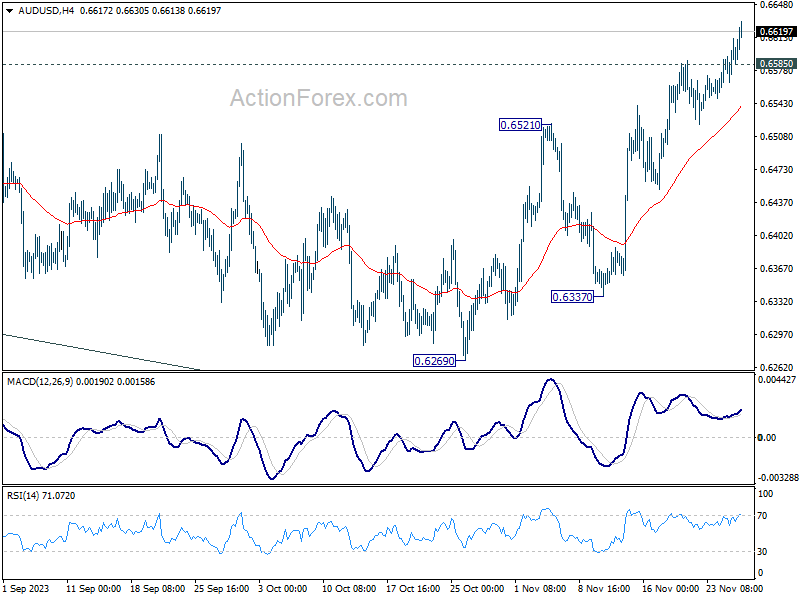
In the bigger picture, there is no confirmation that down trend from 0.8006 (2021 high) has completed. While current rebound from 0.6269 might extend higher, it could be the third leg of the corrective pattern from 0.6169 (2022 low) only. For now, medium term bearishness will remain as long as 0.6894 resistance holds.
EUR/USD Daily Outlook
Daily Pivots: (S1) 1.0933; (P) 1.0946; (R1) 1.0967; More...
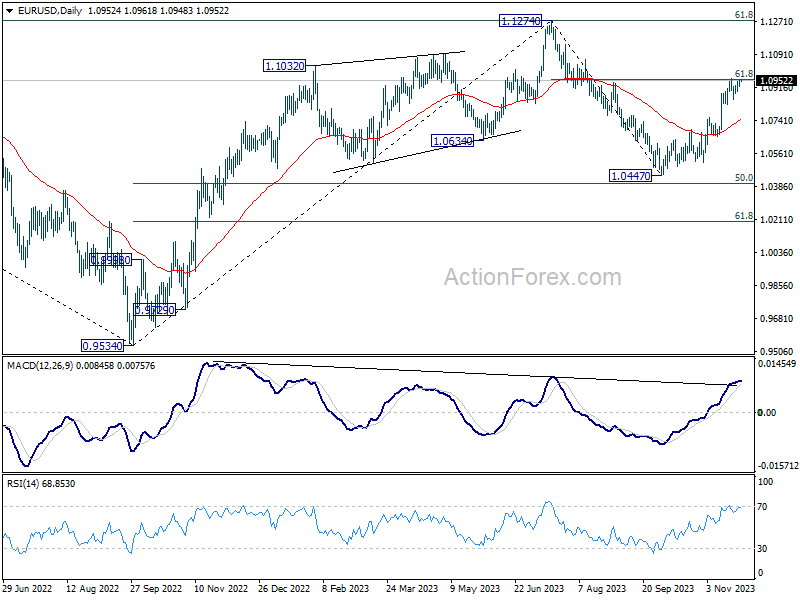
EUR/USD is still bounded in range below 1.0964. Intraday bias stays neutral for the moment. Further rally is in favor as long as 1.0823 support holds. Sustained break of 61.8% retracement of 1.1274 to 1.0447 at 1.0958 will resume the rise from 1.0447 to retest 1.1274 high. However, firm break of 1.0823 will indicate short term topping, and turn bias back to the downside for deeper decline.
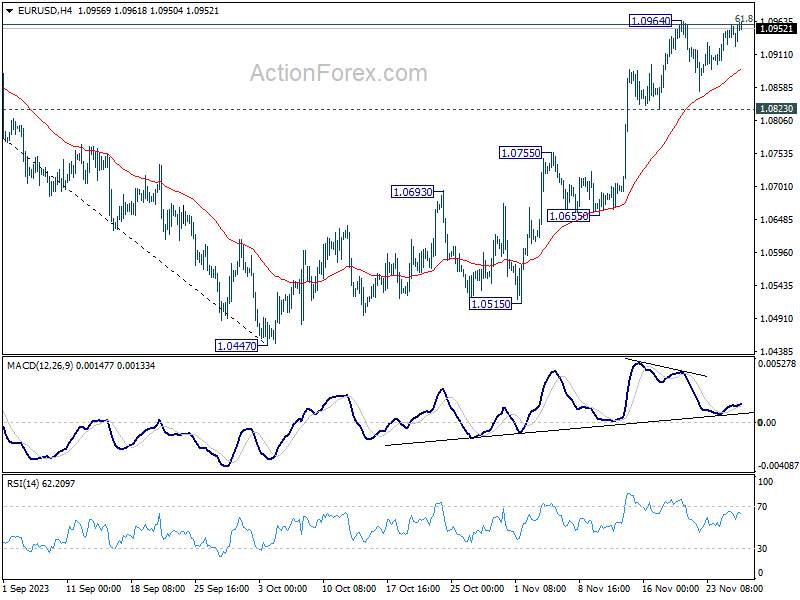
In the bigger picture, price actions from 1.1274 are viewed as a corrective pattern to rise from 0.9534 (2022 low). Rise from 1.0447 is tentatively seen as the second leg. Hence while further rally could be seen, upside should be limited by 1.1274 to bring the third leg of the pattern.
GBP/USD Daily Outlook
Daily Pivots: (S1) 1.2597; (P) 1.2621; (R1) 1.2650; More...
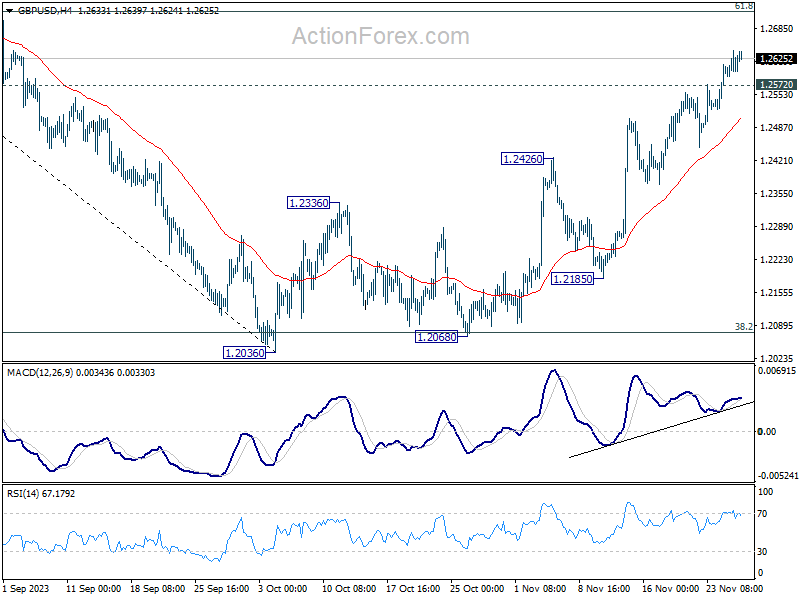
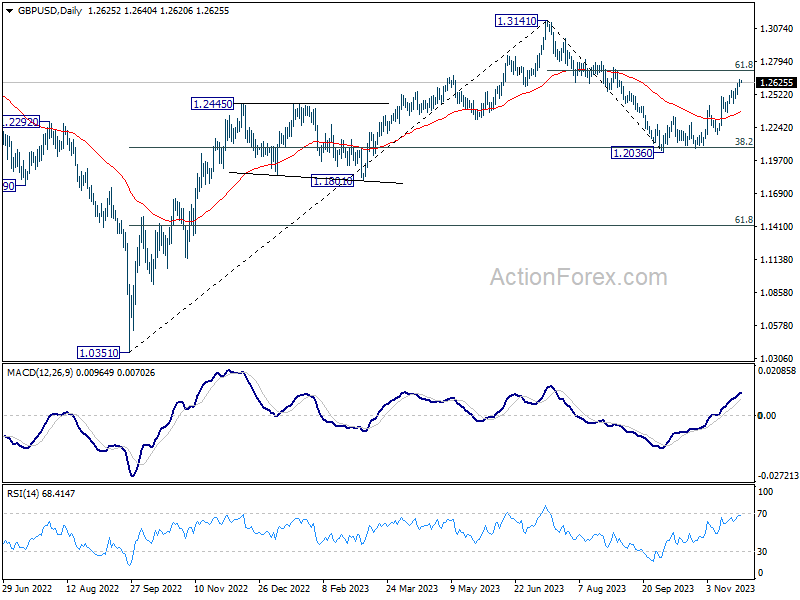
Intraday bias in GBP/USD remains on the upside for the moment. Rise from 1.2036 should target 61.8% retracement of 1.3141 to 1.2036 at 1.2716. On the downside, below 1.2572 minor support will turn intraday bias neutral first. But further rally will now remain in favor as long as 1.2426 resistance turned support holds.
In the bigger picture, price actions from 1.3141 are seen as a corrective pattern to rise from 1.0351 (2022 low). Strong rebound from 38.2% retracement of 1.0351 (2022 low) to 1.3141 at 1.2075 suggests that current rise from 1.2036 is already the second leg. However, while further rally could be seen, upside should be limited by 1.3141 to bring the third leg of the pattern.
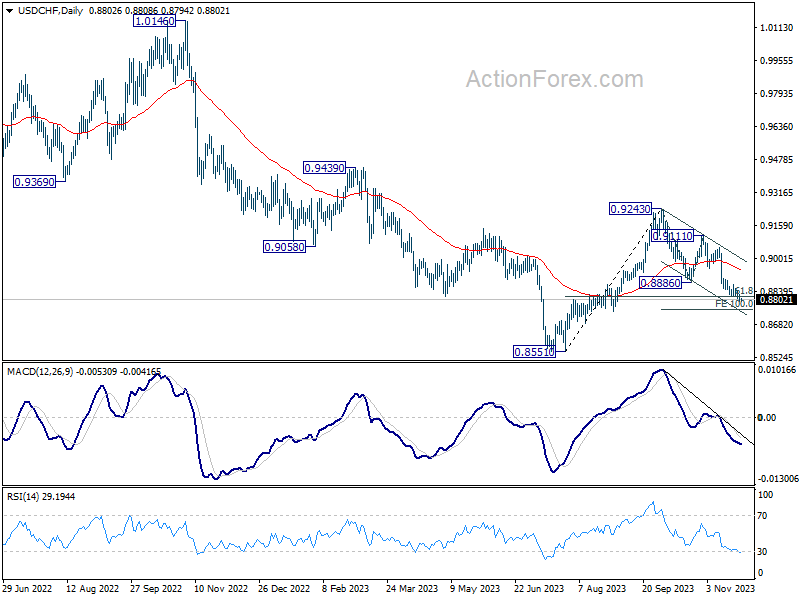
USD/CHF Daily Outlook
Daily Pivots: (S1) 0.8790; (P) 0.8809; (R1) 0.8824; More....
Intraday bias in USD/CHF remains on the downside at this point. Current fall from 0.9243 should target 100% projection of 0.9243 to 0.8886 from 0.9111 at 0.8754 next. Nevertheless, break of 0.8873 resistance will turn bias to the upside for stronger rebound.
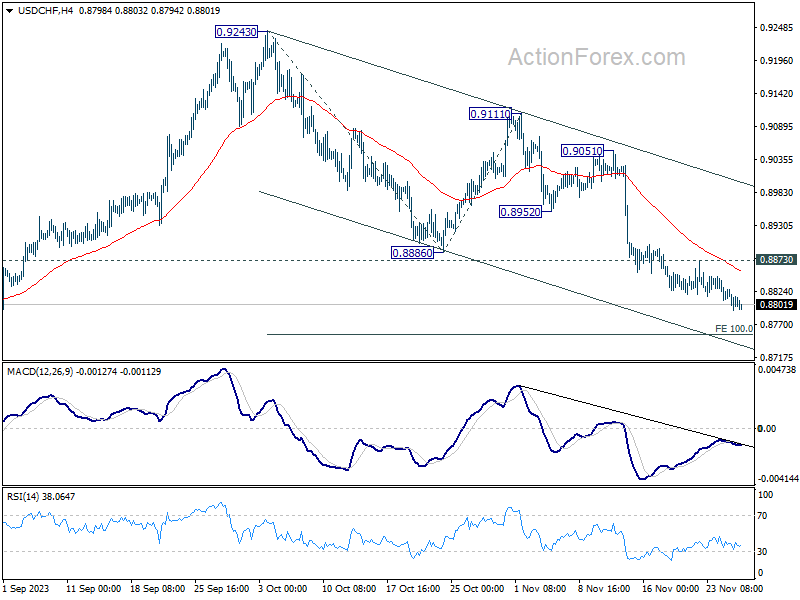
In the bigger picture, price actions from 0.8551 are currently seen as part of a corrective pattern to the decline from 1.0146 (2022 high). Fall from 0.9243 is seen as the second leg for now. 61.8% retracement of 0.8551 to 0.9243 at 0.8815 was already met. Sustained break there will bring retest of 0.8551 low. For now, this will remain the favored case as long as 0.9111 resistance holds.
Technical Outlook and Review
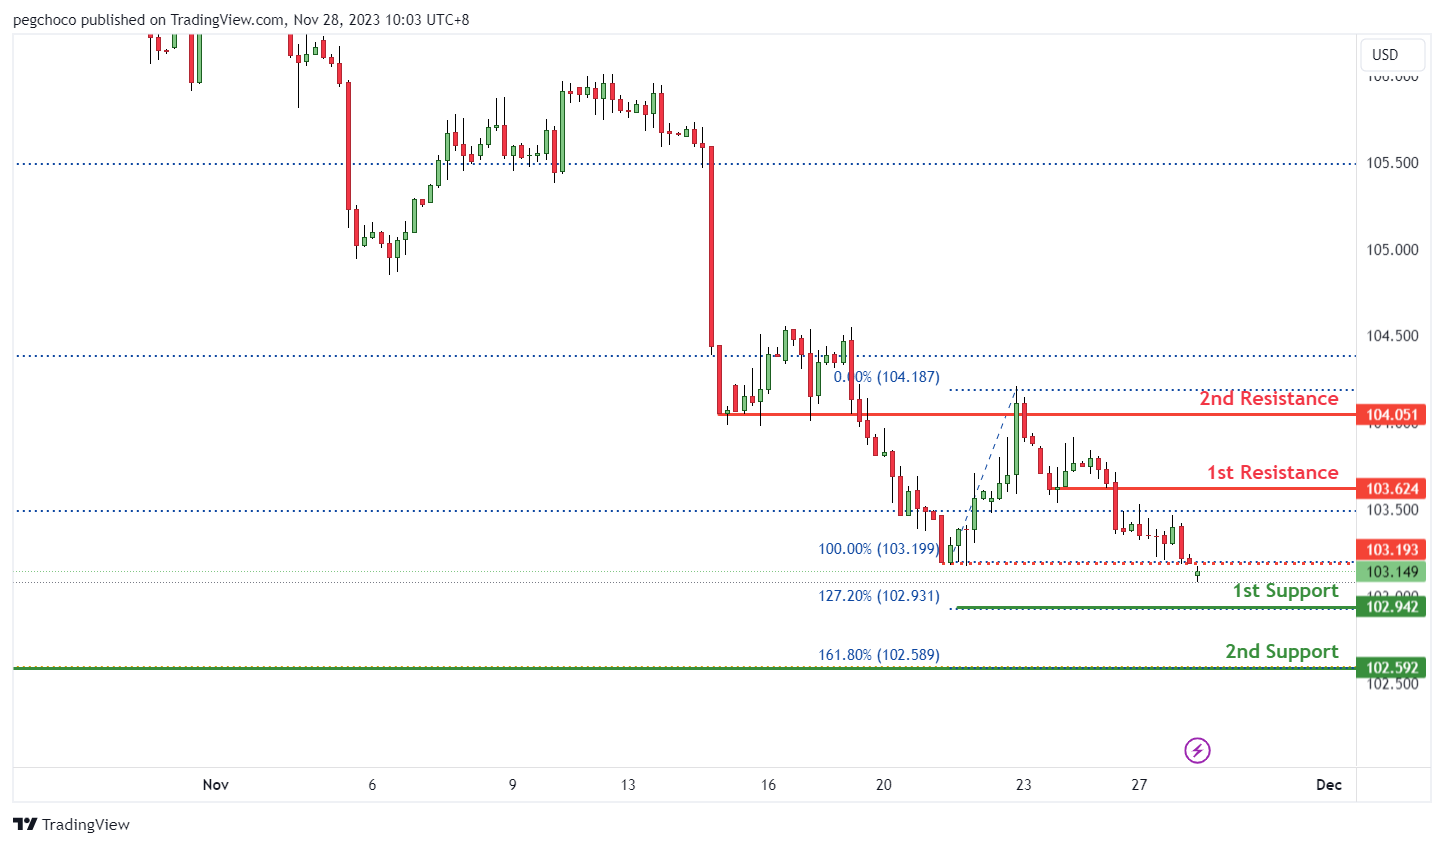
DXY:
The DXY (US Dollar Index), the overall momentum of the chart is bearish, indicating a downward trend. The price could potentially continue its bearish movement towards the 1st support.
The 1st support at 102.94 is identified as an overlap support, and it also coincides with the 127.20% Fibonacci Extension level. This suggests that it’s a significant level where buying interest may emerge, providing support for the US Dollar Index.
The 2nd support at 102.59 is another overlap support level, and it aligns with the 161.80% Fibonacci Extension. This adds further significance to this support level, indicating it as a potential area where buyers might become active.
On the resistance side, The 1st resistance at 103.62 is categorized as a pullback resistance, implying that it’s a level where selling pressure may increase, acting as a potential barrier to further upward price movement.
The 2nd resistance at 104.05 is noted as an overlap resistance, which suggests it’s another significant level where selling interest could intensify.
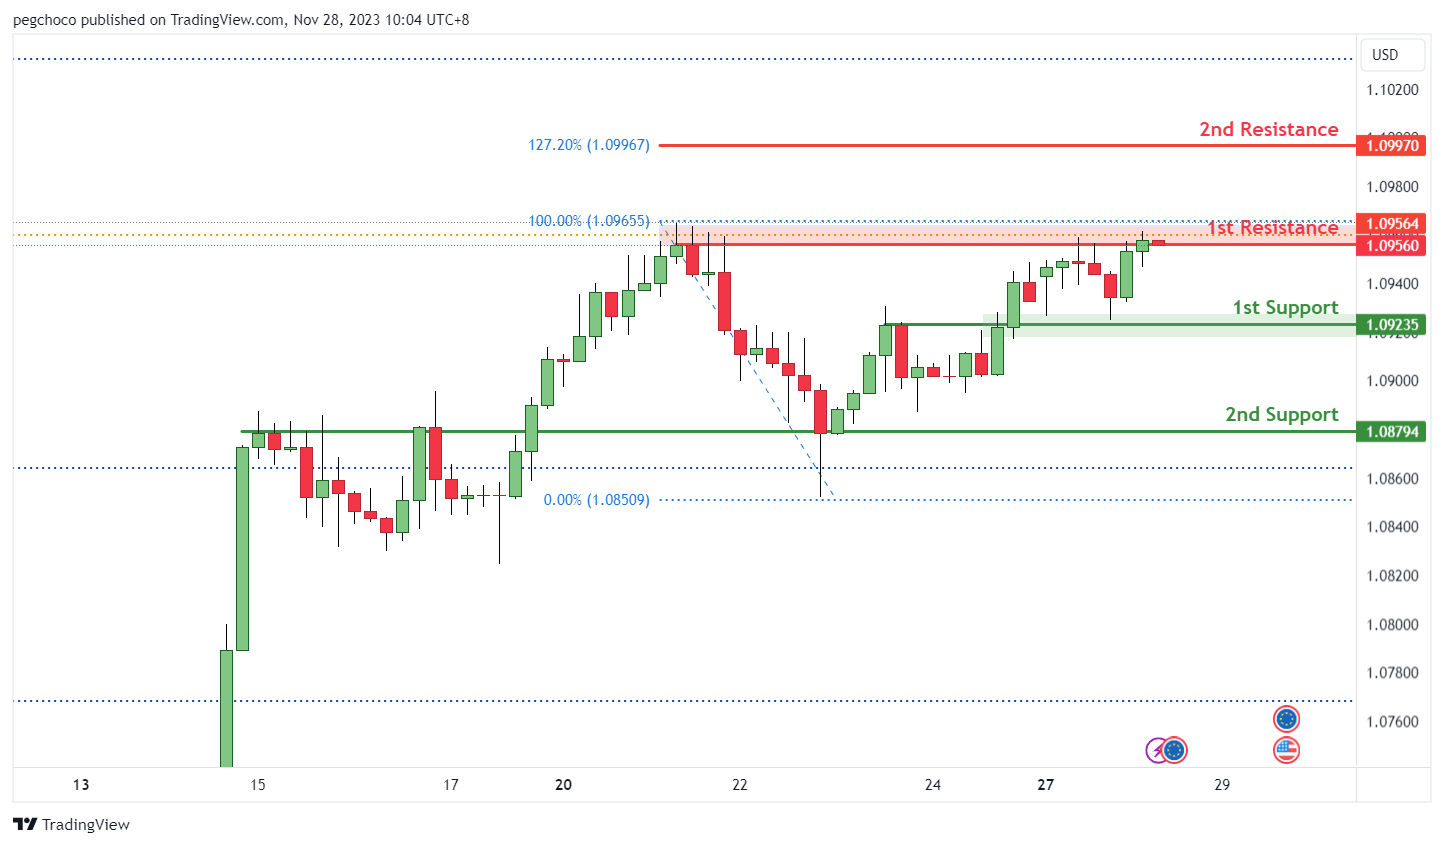
EUR/USD:
EUR/USD, the overall momentum of the chart is bearish, indicating a downward trend. There is a potential scenario where the price could react bearishly off the 1st resistance and decline towards the 1st support.
The 1st support at 1.0923 is considered an overlap support, suggesting it’s a significant level where buying interest may emerge, potentially providing support for the currency pair.
The 2nd support at 1.0879 is also an overlap support level, indicating another potential area where buyers could become active and offer support.
On the resistance side, The 1st resistance at 1.0956 is categorized as a multi-swing high resistance. This level represents a significant barrier to upward price movement.
The 2nd resistance at 1.0997 is noted as a level where selling pressure may intensify, as it aligns with the 127.20% Fibonacci Extension.
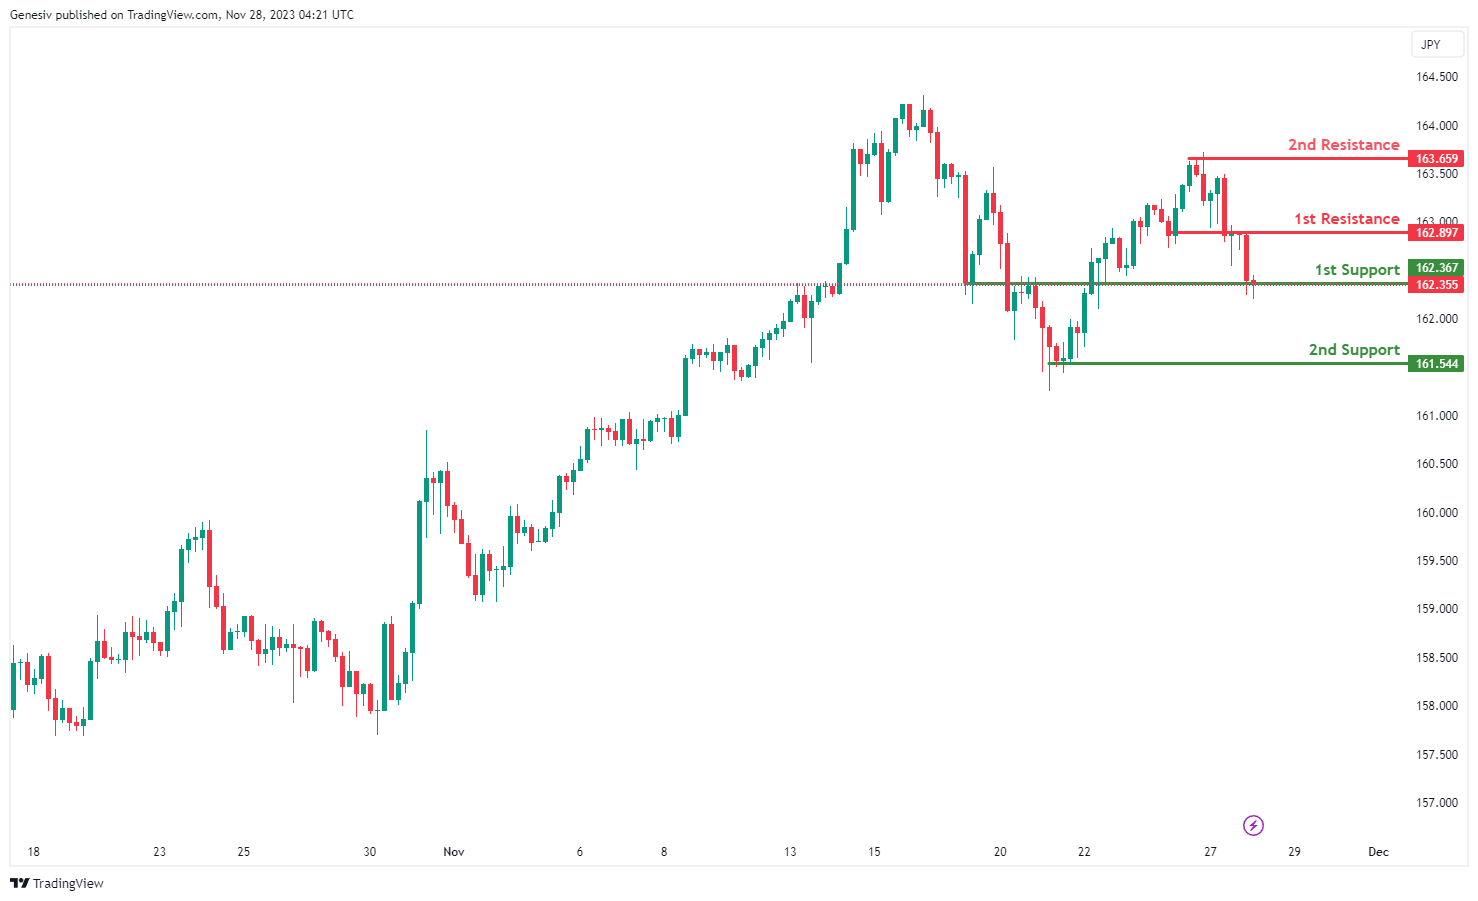
EUR/JPY:
The analyzed instrument is EUR/JPY, and the overall momentum of the chart is currently bearish.
There is a potential for the price to make a short-term rise towards the 1st resistance before reversing off it and dropping towards the 1st support.
The 1st support level is identified at 162.36, and its favorable characteristic is attributed to being a pullback support.
The 2nd support level is situated at 161.54, and its favorable aspect is derived from being a swing low support.
On the resistance side, the 1st resistance is positioned at 162.89, and it is considered significant due to being an overlap resistance.
The 2nd resistance is located at 163.65, and its significance is derived from being a swing high resistance.
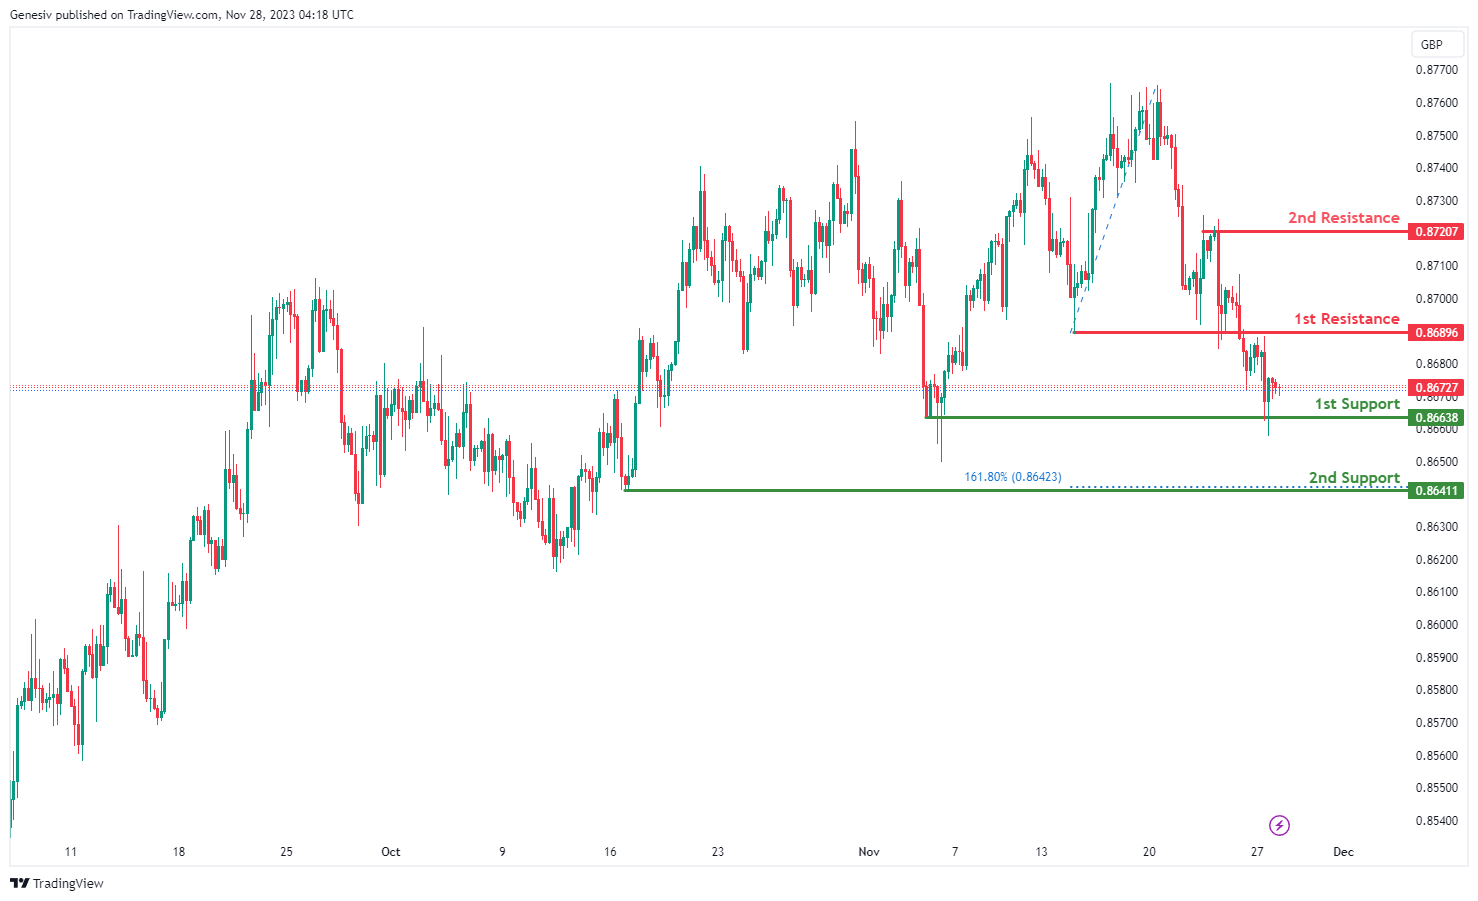
EUR/GBP:
The analyzed instrument is EUR/GBP, and the overall momentum of the chart is currently bearish.
There is a potential for the price to make a bearish continuation towards the 1st support.
The 1st support level is identified at 0.8663, and its favorable characteristic is attributed to being a multi-swing low support.
The 2nd support level is situated at 0.8641, and its favorable aspect is derived from being a swing low support and coinciding with the 161.80% Fibonacci Extension.
On the resistance side, the 1st resistance is positioned at 0.8689, and it is considered significant due to being an overlap resistance.
The 2nd resistance is located at 0.8720, and its significance is derived from being a swing high resistance.
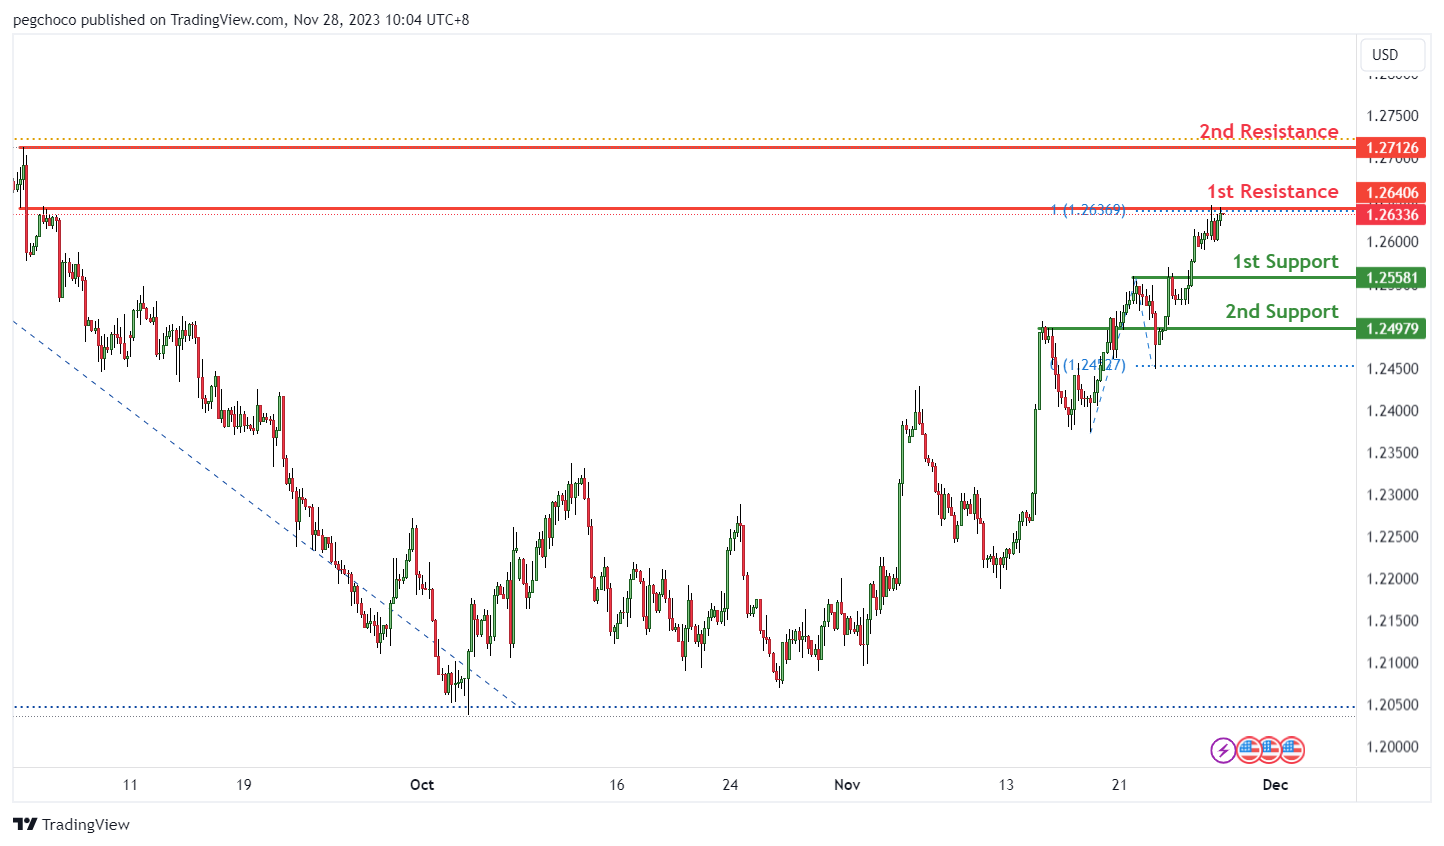
GBP/USD:
The GBP/USD, the overall momentum of the chart is bearish, indicating a downward trend. There’s a potential scenario where the price could react bearishly off the 1st resistance and drop towards the 1st support.
The 1st support at 1.2558 is considered a pullback support, suggesting it’s a level where buying interest may emerge and provide support for the currency pair.
The 2nd support at 1.2497 is also an overlap support level, indicating another potential area where buyers could become active and offer support.
On the resistance side, the 1st resistance at 1.2633 is categorized as an overlap resistance. This level is significant as it aligns with the 100% Fibonacci Projection, which adds further significance to the resistance level.
The 2nd resistance at 1.2712 is noted as a swing high resistance, which suggests it’s a point where selling pressure may increase.
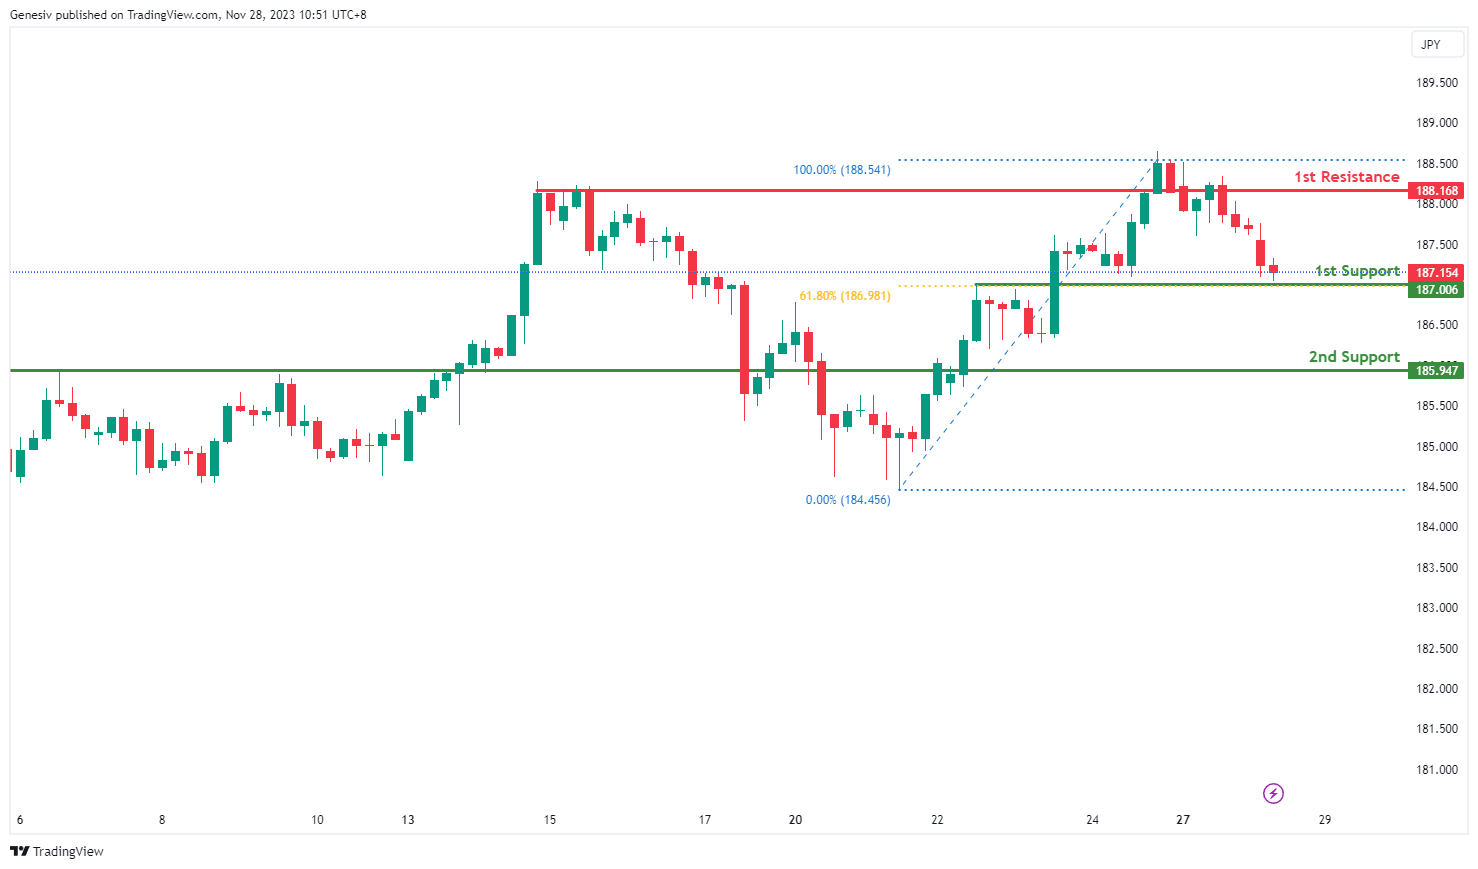
GBP/JPY:
The overall momentum of GBP/JPY is bearish,indicating a downward trend.The price could potentially react bearishly off the 1st resistance level and drop towards the 1st support.
The 1st support at 187.01 is considered a pullback support, and it coincides with the 61.80% Fibonacci retracement level. This convergence of technical factors makes it a significant level where buying interest may emerge, potentially providing support for the currency pair.
The 2nd support at 185.95 is characterized as a multi-swing low support, indicating another area where buyers might become active.
The 1st resistance at 188.17 is identified as a pullback resistance, suggesting a level where selling pressure could intensify and act as a barrier to further upward price movement.
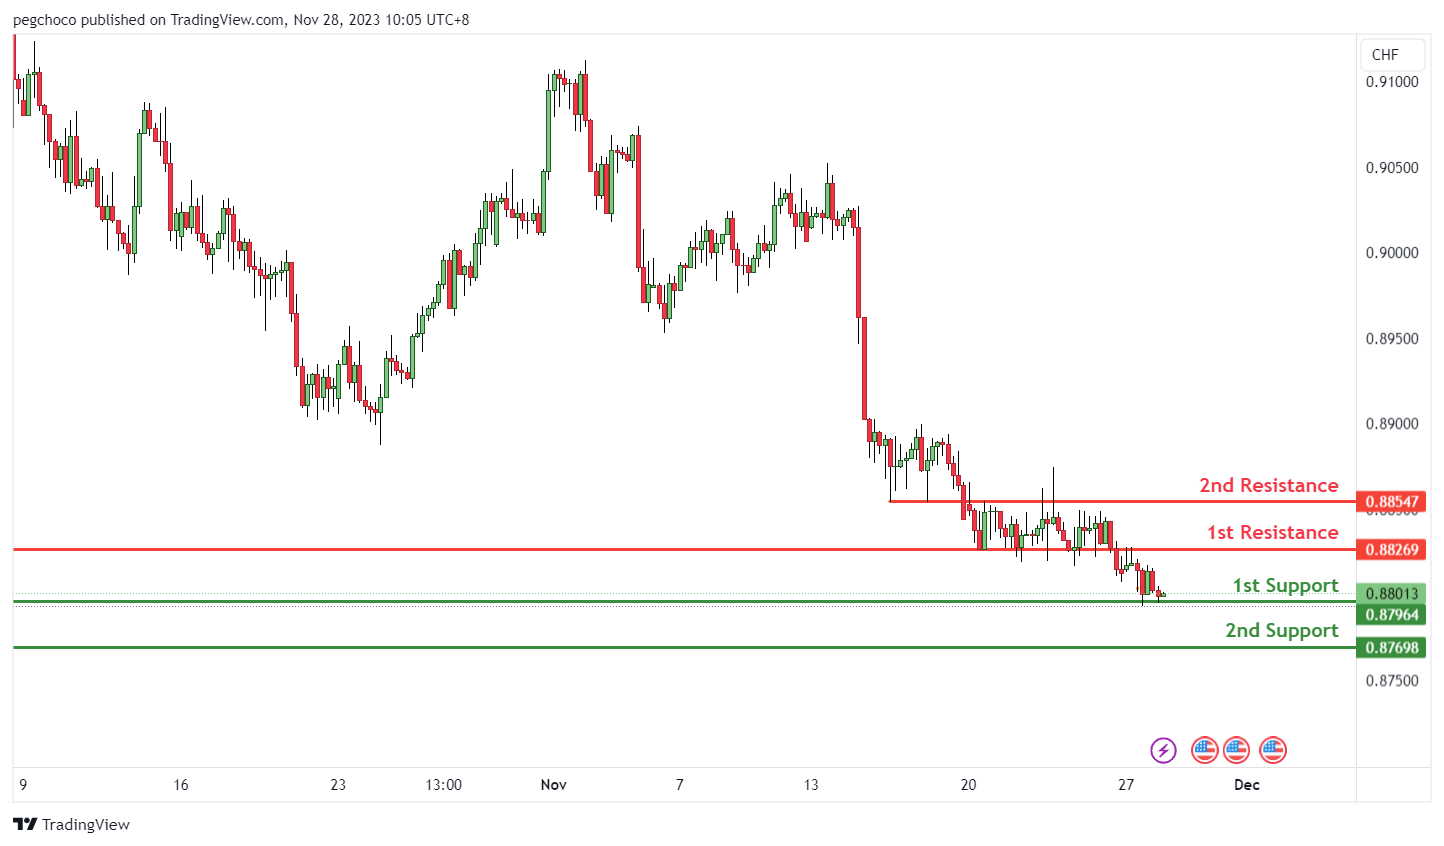
USD/CHF:
USD/CHF, the overall momentum of the chart is bullish, indicating an upward trend. There’s a potential scenario where the price could make a bullish bounce off the 1st support and head towards the 1st resistance.
The 1st support at 0.8796 is considered an overlap support, suggesting that it’s a level where buying interest may emerge and provide support for the currency pair.
The 2nd support at 0.8769 is a swing low support, indicating another level where buyers could potentially become active and offer support.
On the resistance side, the 1st resistance at 0.8826 is categorized as an overlap resistance, suggesting that it’s a level where selling pressure may intensify and act as a potential barrier to further upward price movement.
The 2nd resistance at 0.8854 is also an overlap resistance, reinforcing the potential resistance at this level.
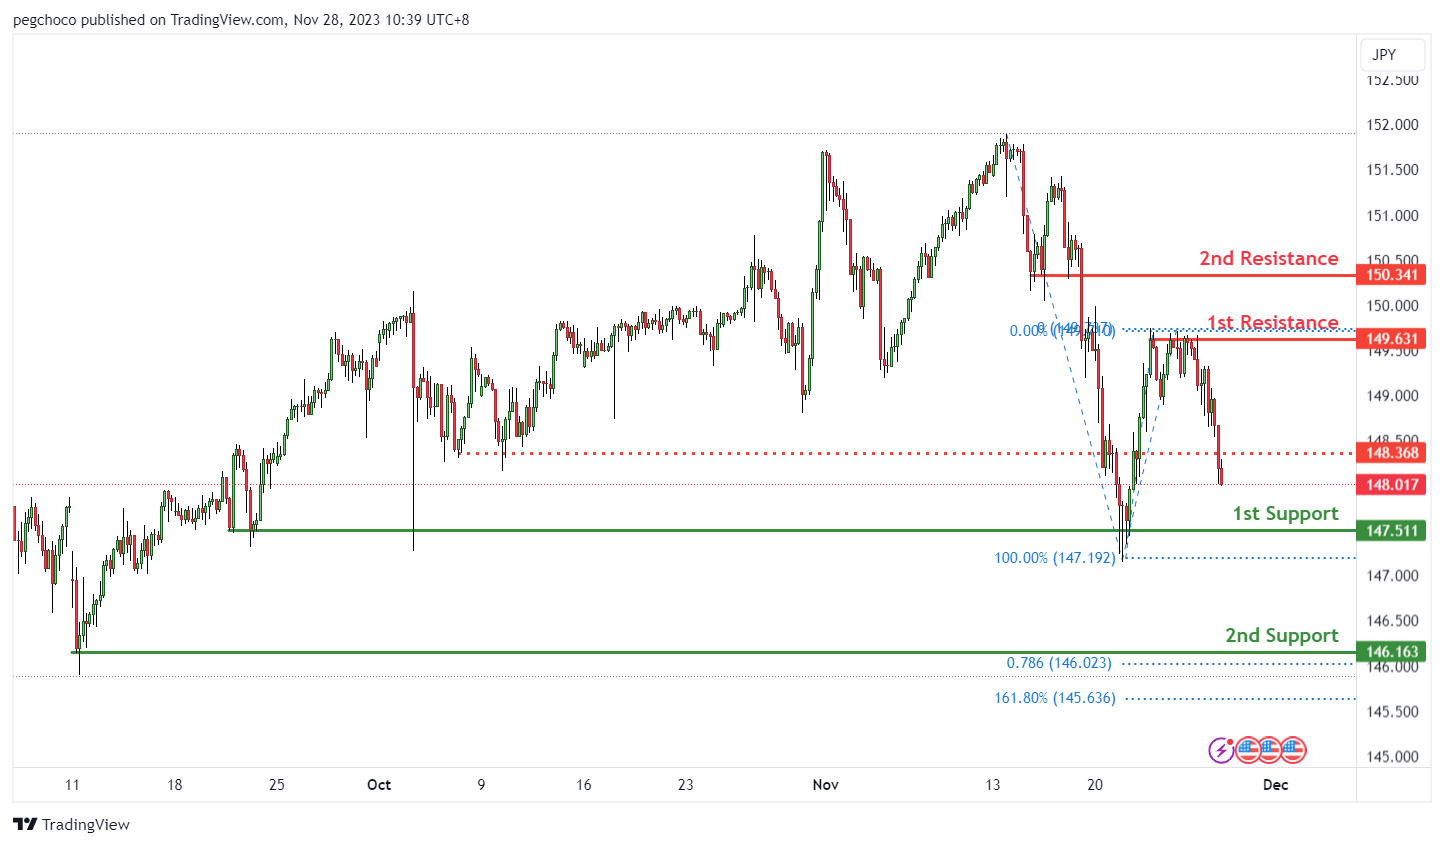
USD/JPY:
The USD/JPY, the overall momentum of the chart is bearish, indicating a downward trend. There’s a potential scenario where the price could continue its bearish movement towards the 1st support.
The 1st support at 147.51 is considered a multi-swing low support, suggesting that it’s a significant level where buying interest may emerge and provide support for the currency pair.
The 2nd support at 146.16 is a swing low support, and it also coincides with the 78.60% Fibonacci Projection, making it a strong potential support level.
On the resistance side, the 1st resistance at 149.63 is categorized as a multi-swing high resistance, indicating a level where selling pressure may intensify and act as a barrier to further upward price movement.
The 2nd resistance at 150.34 is a pullback resistance, suggesting another potential point where sellers could enter the market.
There’s also an intermediate resistance at 148.36, which is another level to watch for potential pullback resistance.
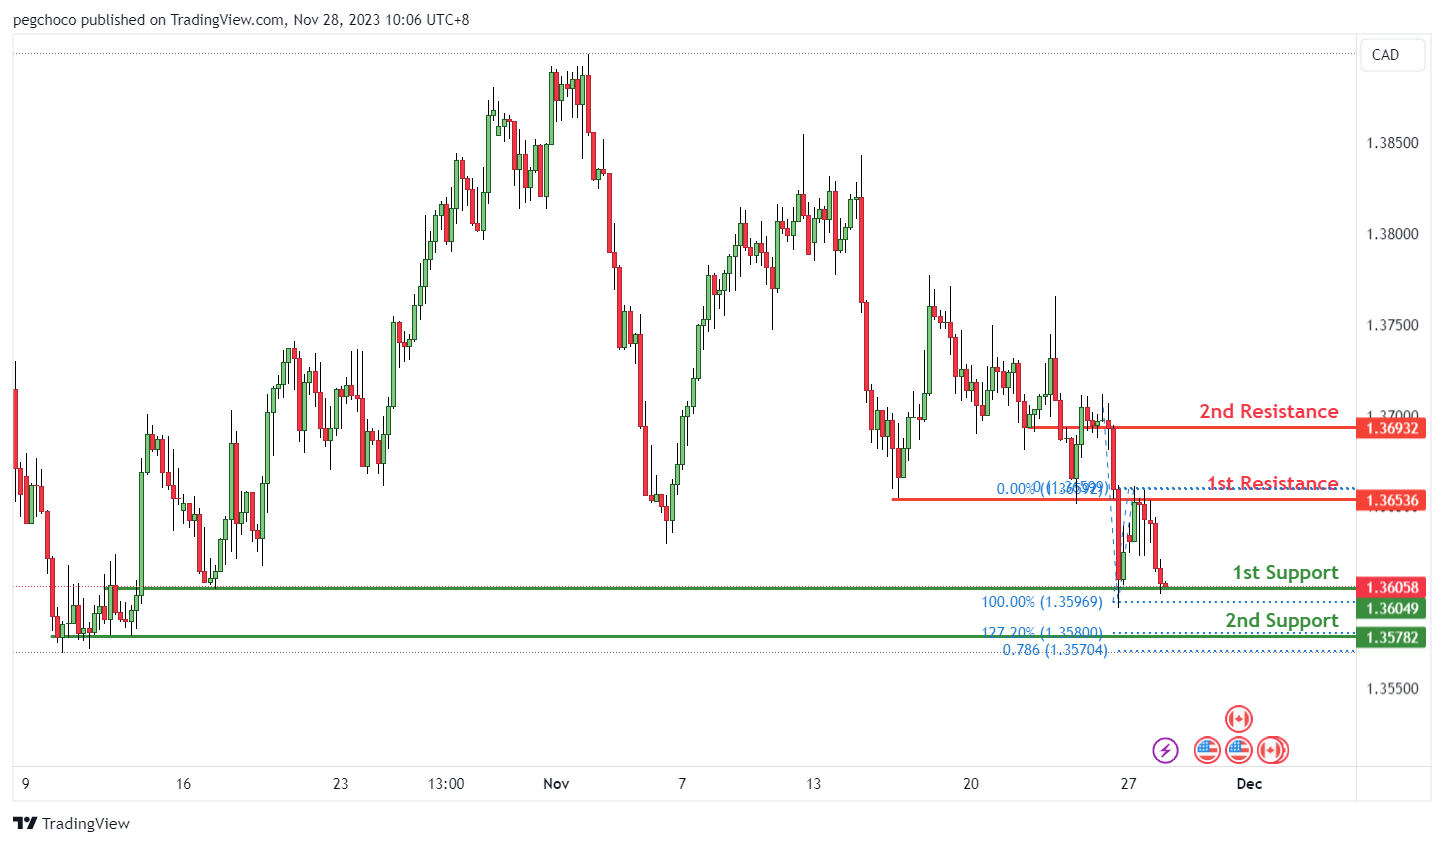
USD/CAD:
The USD/CAD, the overall momentum of the chart is currently bullish, suggesting a potential upward movement in price. In this scenario, there is a possibility that the price could experience a bullish bounce off the 1st support level and head towards the 1st resistance.
Here are the key levels and reasons for their significance:
1st support at 1.3604: This level is identified as an overlap support, indicating it has previously acted as a price point where buyers have shown interest and provided support.
2nd support at 1.3578: The 2nd support level is another critical level, as it aligns with the 127.20% Fibonacci Extension, making it a potential zone where buyers might become active.
On the resistance side, the 1st resistance at 1.3653: The 1st resistance is characterized as an overlap resistance, suggesting a level where selling pressure may intensify.
2nd resistance at 1.3693: The 2nd resistance is identified as a pullback resistance, indicating a point where sellers may enter the market.
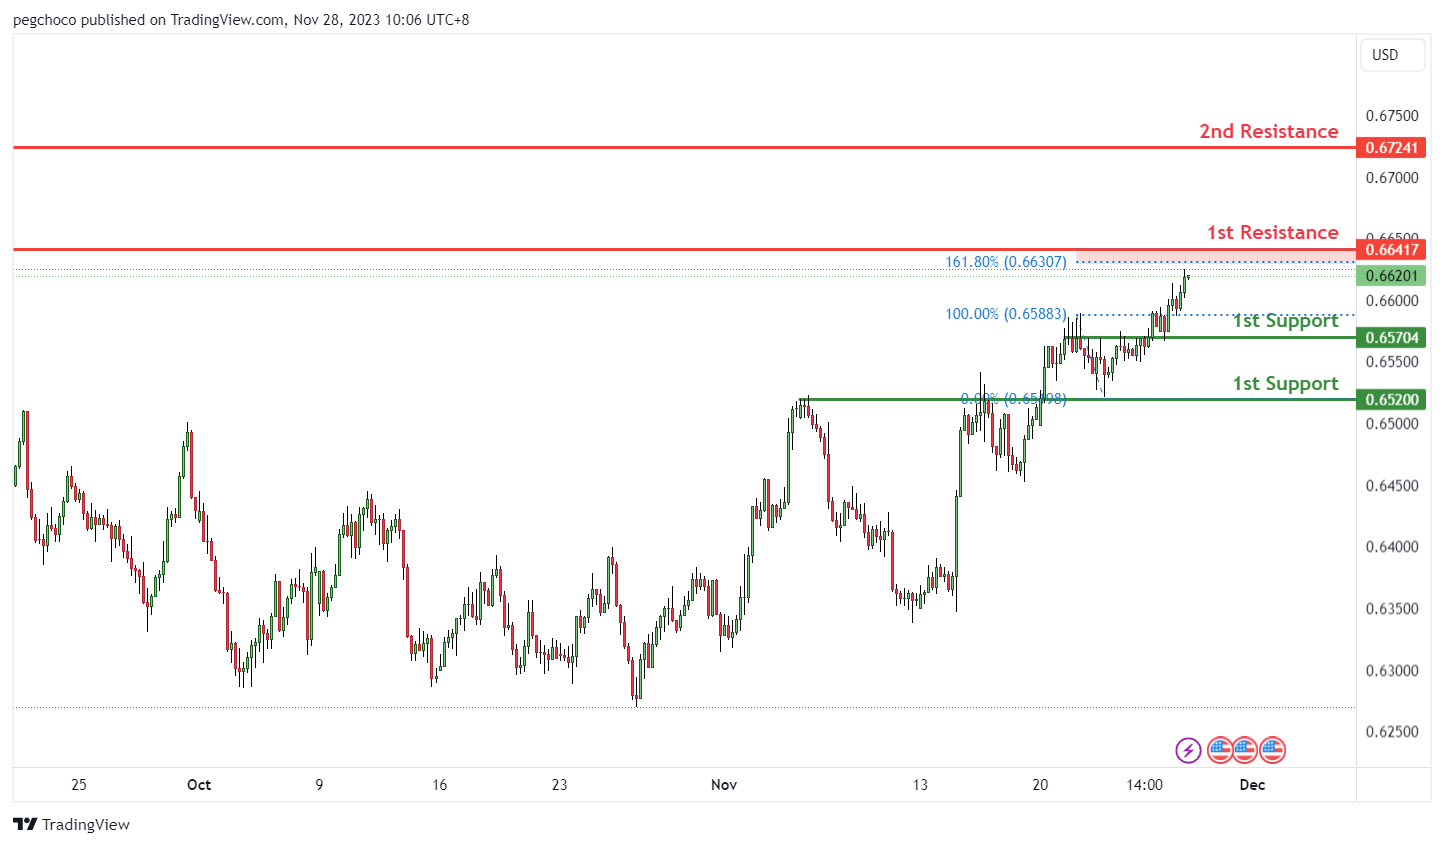
AUD/USD:
AUD/USD, the overall momentum of the chart is currently bearish, suggesting a potential downward movement in price. In this scenario, there is a possibility that the price could react bearishly off the 1st resistance and drop towards the 1st support.
Here are the key levels and reasons for their significance:
1st support at 0.6570: This level is identified as an overlap support, indicating it has previously acted as a price point where buyers have shown interest and provided support.
2nd support at 0.6520: Similar to the 1st support, this is also an overlap support, reinforcing its significance as a potential area where buyers might step in.
On the resistance side, the 1st resistance at 0.6641: The 1st resistance is characterized as a pullback resistance, and it also aligns with the 161.80% Fibonacci Extension level. This confluence suggests a strong resistance zone where selling pressure may intensify.
2nd resistance at 0.6724: The 2nd resistance is another overlap resistance level, further adding to its potential as a strong resistance point.
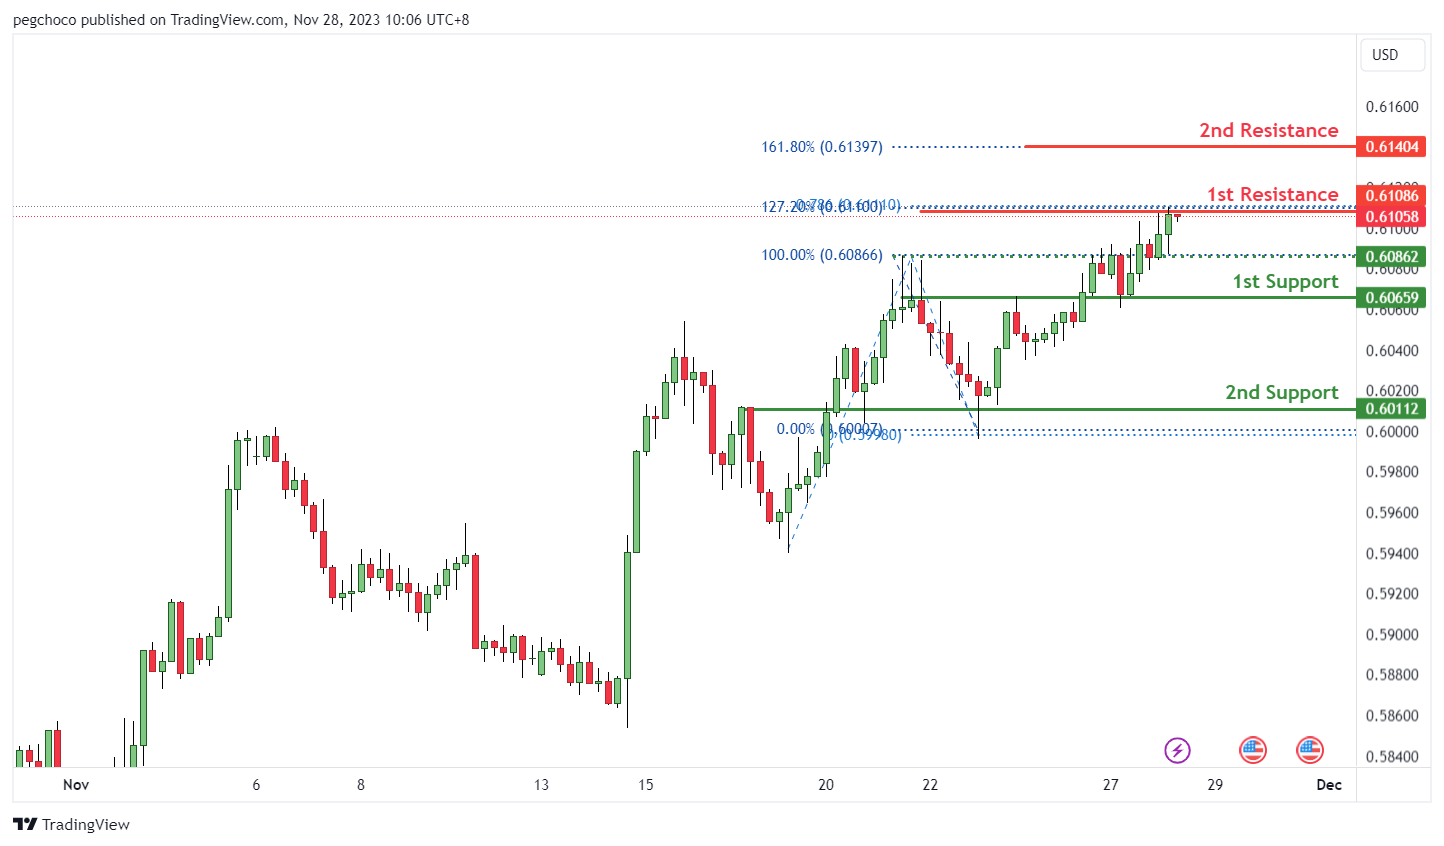
NZD/USD
NZD/USD, the overall momentum of the chart is currently bearish, indicating a potential downward movement in the price. In this scenario, there is a possibility that the price could react bearishly off the 1st resistance and drop towards the 1st support.
Here are the key levels and reasons for their significance:
1st support at 0.6065: This level is identified as an overlap support, suggesting that it’s a price point where buyers have previously shown interest and may provide support again.
2nd support at 0.6011: This level is also an overlap support, reinforcing its significance as a potential area where buyers might step in.
On the resistance side, 1st resistance at 0.6105: The 1st resistance is characterized as a swing high resistance. This level is important because it has confluence with both the 78.60% Fibonacci Projection and the 127.20% Fibonacci Extension, indicating a strong resistance zone.
2nd resistance at 0.6140: The 2nd resistance level is associated with the 161.80% Fibonacci Extension, adding further weight to its potential as a strong resistance point.
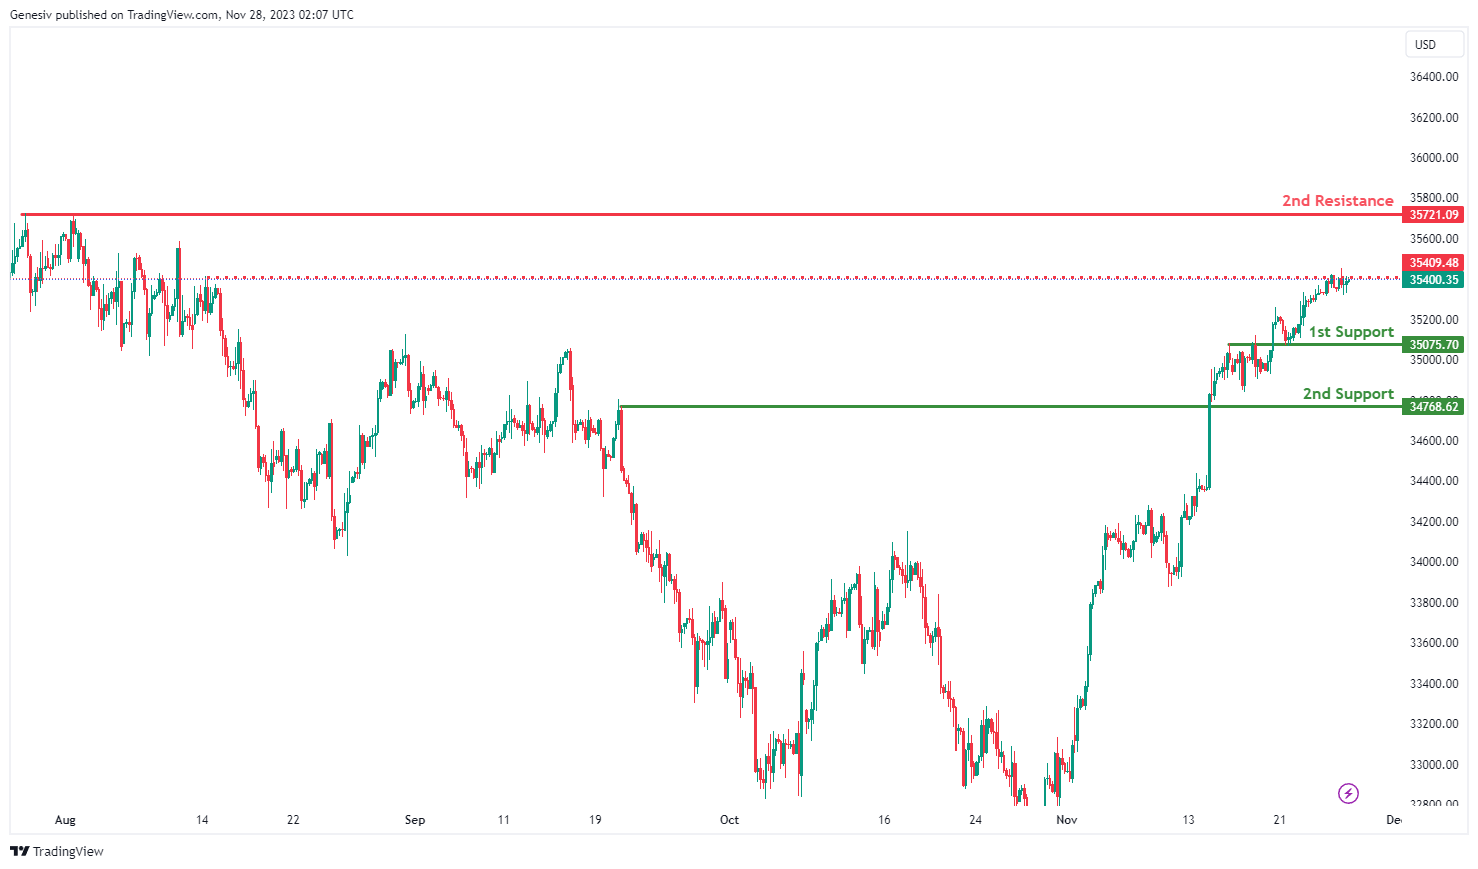
DJ30:
The DJ30,the momentum of the chart is bearish, indicating a downward trend. The price could potentially continue its bearish movement towards the 1st support level.
The 1st support at 35075.70 is identified as an overlap support, which implies that it’s a significant level where buying interest may emerge, providing support for the DJ30 index.
The 2nd support at 34768.62 is categorized as a pullback support, suggesting that it’s a level where buyers might be more inclined to step in.
Intermediate resistance at 35409.48 is noted as a pullback resistance, signifying a level where selling pressure could mount, acting as a potential obstacle to further upward price movement.
The 2nd resistance at 35721.09 is categorized as a multi-swing high resistance, indicating that it’s a point where sellers might engage in the market.
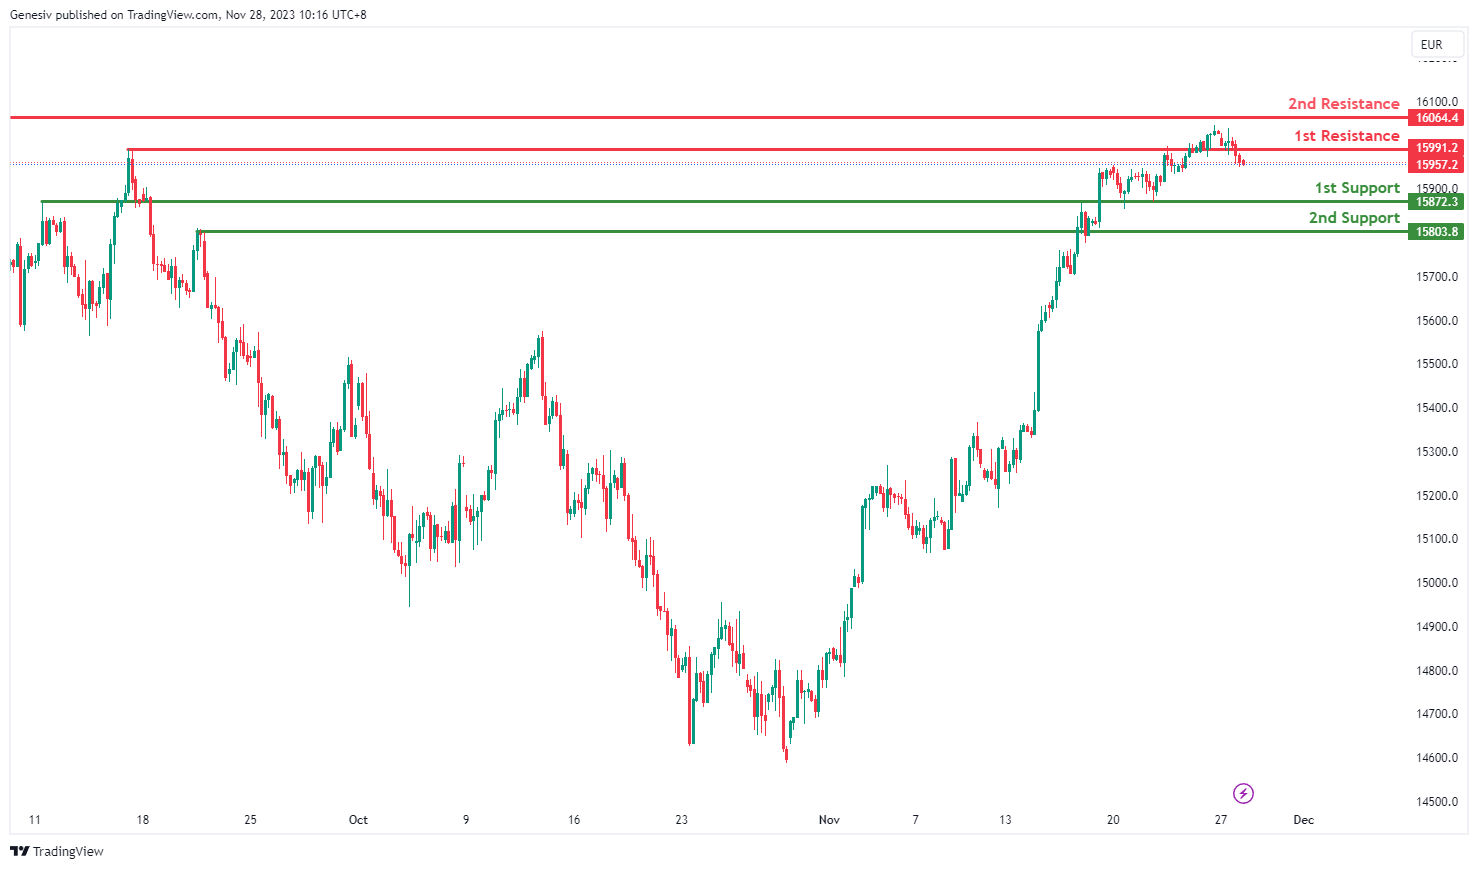
GER40:
The GER40 overall momentum is overall bearish, indicating a downward trend. The price could potentially continue its bearish movement towards the 1st support level.
The 1st support at 15872.3 is identified as an overlap support, suggesting that it’s a significant level where buying interest may emerge and provide support for the GER40 index.
The 2nd support at 15803.8 is also categorized as an overlap support level, indicating another potential area where buyers could become active.
The 1st resistance at 15991.2 is noted as a pullback resistance, signifying a level where selling pressure could intensify, serving as a potential barrier to further upward price movement.
The 2nd resistance at 16064.4 is categorized as a swing high resistance, suggesting that it’s a point where sellers may engage in the market.
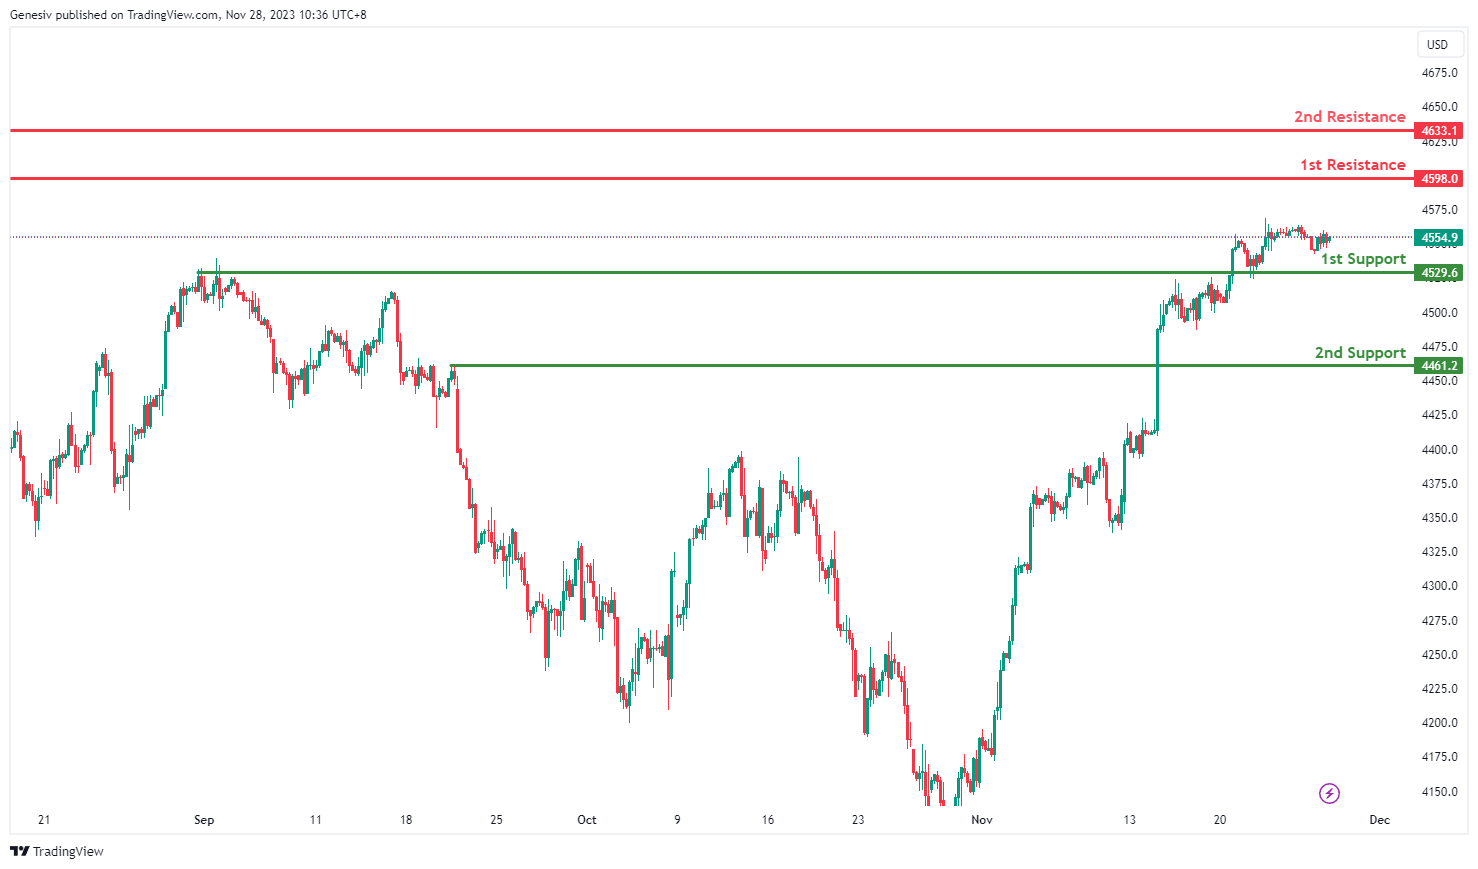
US500:
The overall momentum of US500 is bullish. The price could potentially continue its bullish movement towards the 1st resistance level.
The 1st support at 4529.6 is identified as an overlap support, suggesting that it’s a significant level where buying interest may provide support for the S&P 500 index.
The 2nd support at 4461.2 is categorized as a pullback support level, indicating another area where buyers could become active after a retracement.
The 1st resistance at 4598.0 is noted as a pullback resistance, signifying a level where selling pressure may intensify and act as a potential barrier to further upward price movement.
The 2nd resistance at 4633.1 is also categorized as a pullback resistance, suggesting that it’s a point where sellers may become more active.
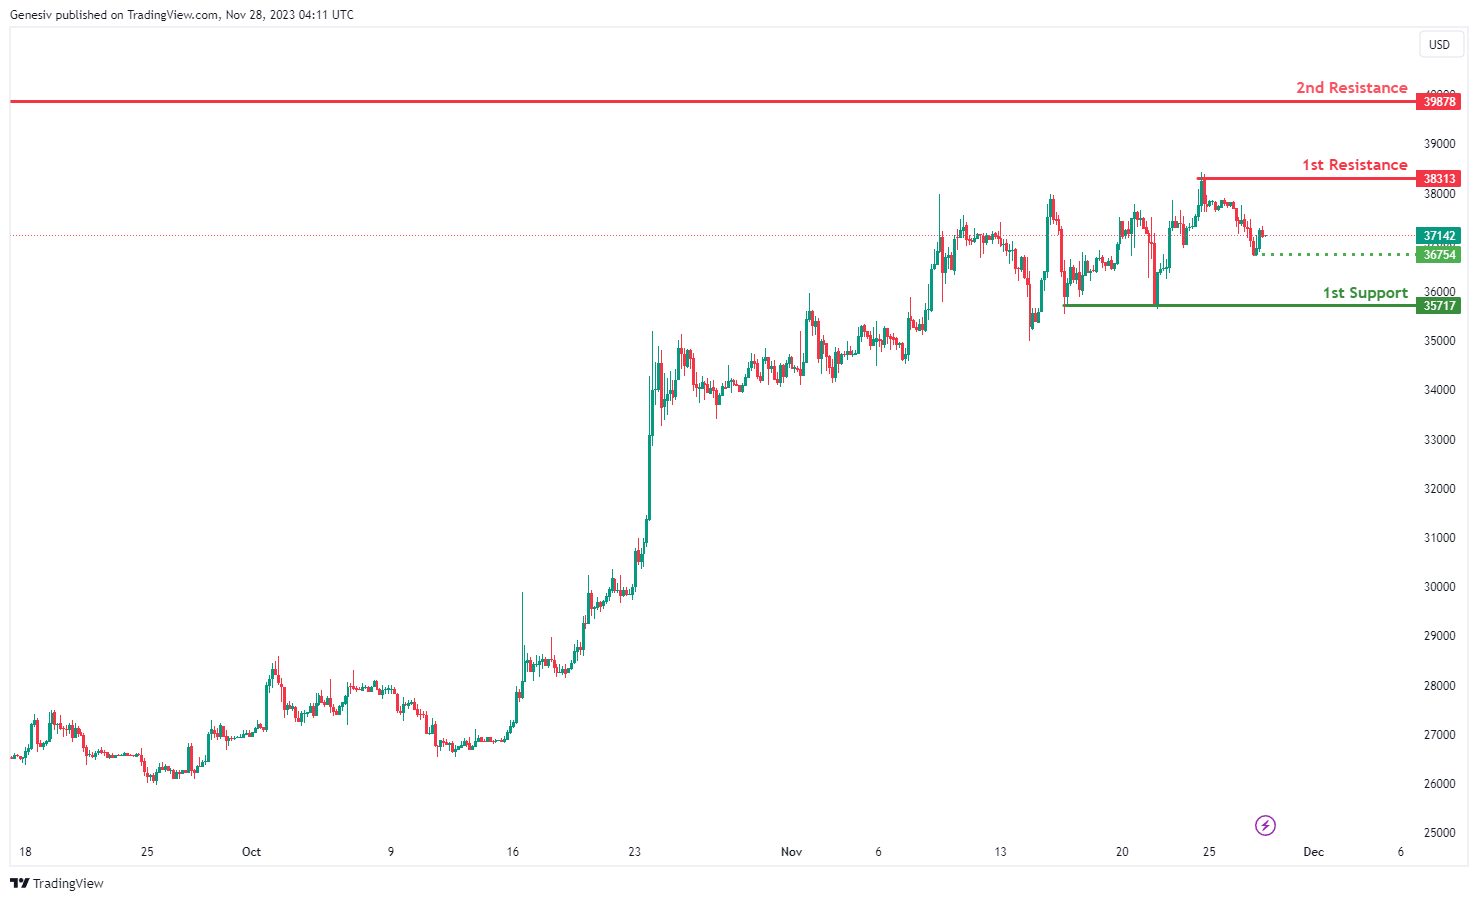
BTC/USD:
The analyzed instrument is BTC/USD, and the overall momentum of the chart is currently bearish.
There is a potential for the price to make a bearish continuation towards the 1st support.
The 1st support level is identified at 35717, and its favorable characteristic is attributed to being a multi-swing low support.
An intermediate support is also noted at 36754, and its significance is derived from being a swing low support.
On the resistance side, the 1st resistance is positioned at 38313, and it is considered significant due to being a swing high resistance.
The 2nd resistance is located at 39878, and its significance is derived from being a swing high resistance.
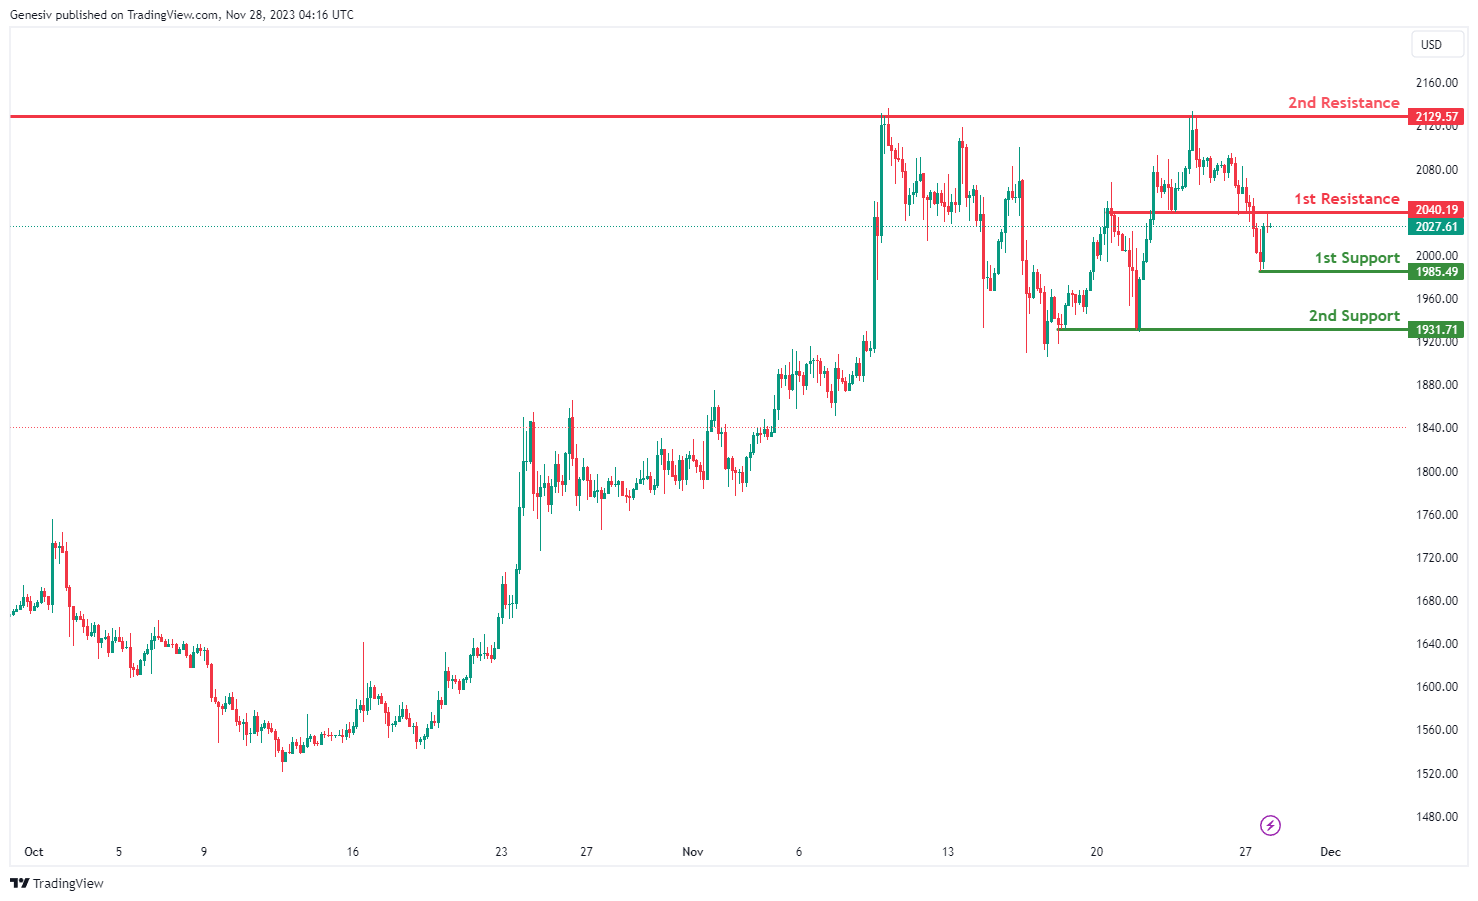
ETH/USD:
The analyzed instrument is ETH/USD, and the overall momentum of the chart is currently bearish.
There is a potential for the price to make a bearish reaction off the 1st resistance and drop to the 1st support.
The 1st support level is identified at 1985.49, and its favorable characteristic is attributed to being a swing low support.
The 2nd support level is situated at 1931.71, and its favorable aspect is derived from being a multi-swing low support.
On the resistance side, the 1st resistance is positioned at 2040.19, and it is considered significant due to being an overlap resistance.
The 2nd resistance is located at 2129.57, and its significance is derived from being a multi-swing high resistance.
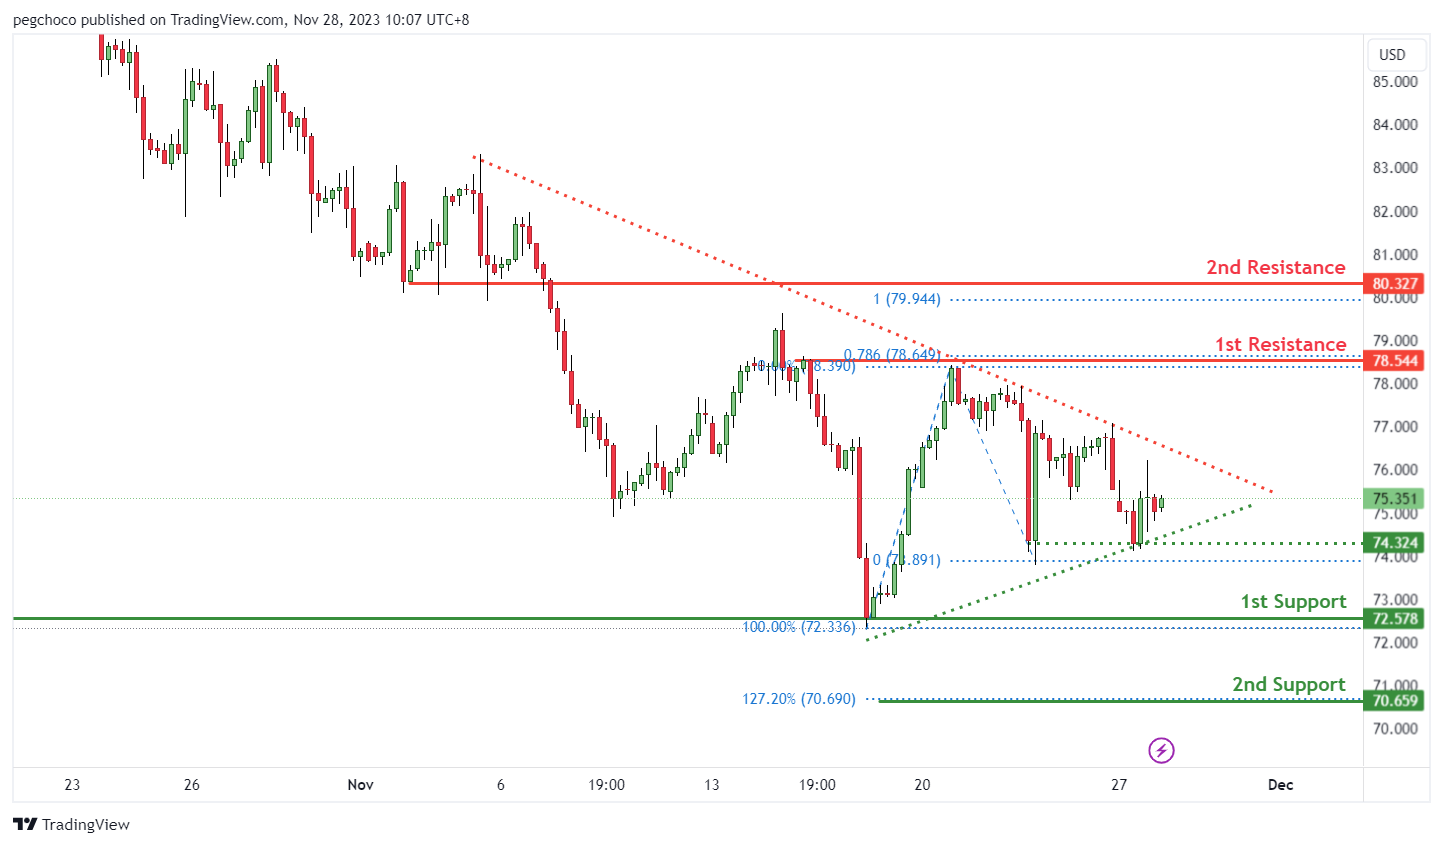
WTI/USD:
The WTI (West Texas Intermediate) crude oil, the overall momentum of the chart is currently neutral, suggesting a lack of a clear bullish or bearish trend. In this situation, there is a potential scenario where the price could fluctuate between the 1st resistance and 1st support levels.
The 1st support at 72.57 is identified as an overlap support, implying that it’s a level where buyers may show interest and provide support for the price.
The 2nd support at 70.65 is associated with the 127.20% Fibonacci Extension, which adds to its significance as a potential support level.
On the resistance side, the 1st resistance at 78.54 is categorized as a swing high resistance. This level could attract selling interest and act as a barrier to further upward price movement.
The 2nd resistance at 80.32 is considered a pullback resistance.
In addition, a symmetrical triangle chart pattern. Symmetrical triangles are indeed consolidation patterns that indicate a period of indecision in the market. A break above the upper trendline of the symmetrical triangle could signal a bullish breakout. Conversely, a break below the lower trendline might indicate a bearish breakdown.
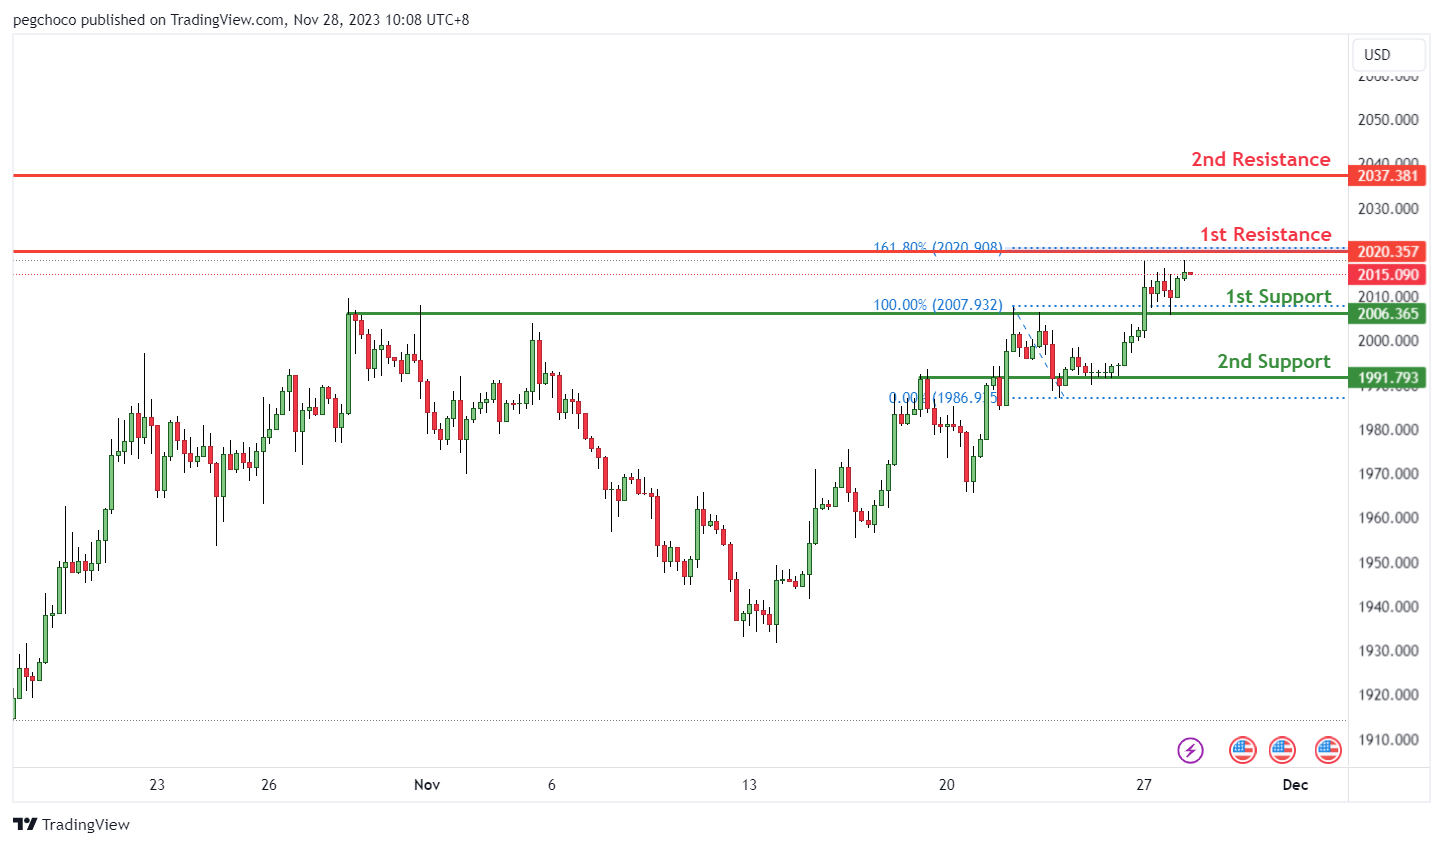
XAU/USD (GOLD):
The XAU/USD, the overall momentum of the chart is currently neutral, indicating a lack of a clear bullish or bearish trend. In this situation, there is a potential scenario where the price could fluctuate between the 1st resistance and 1st support levels.
The 1st support at 2006.36 is identified as an overlap support, implying that it’s a level where buyers may show interest and provide support for the price.
The 2nd support at 1991.79 is also an overlap support level, suggesting another area where buyers might become active.
On the resistance side, the 1st resistance at 2020.35 is categorized as a multi-swing high resistance. This level is significant as it could attract selling interest and act as a barrier to further upward price movement. Additionally, it coincides with the 161.80% Fibonacci Extension, adding to its significance.
The 2nd resistance at 2037.38 is another multi-swing high resistance level.