Sample Category Title
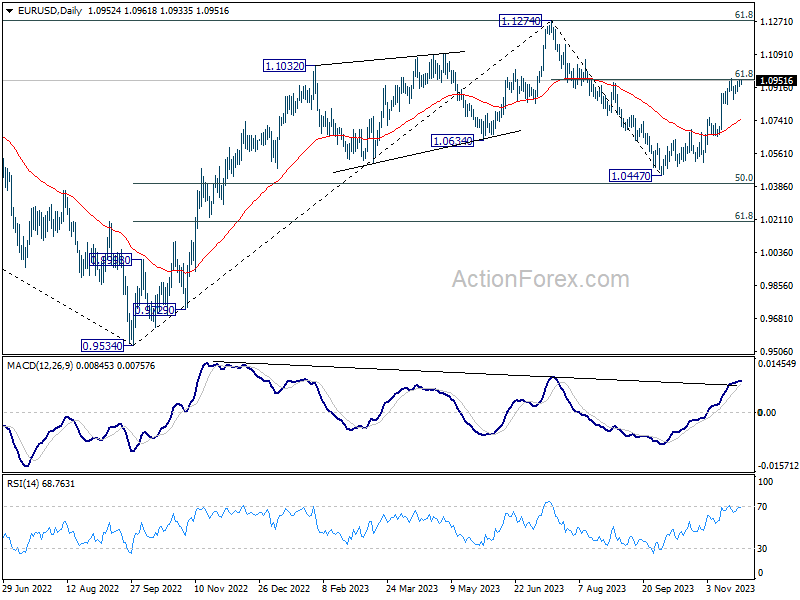
EUR/USD Mid-Day Outlook
Daily Pivots: (S1) 1.0933; (P) 1.0946; (R1) 1.0967; More...
Intraday bias in EUR/USD remains neutral at this point. Consolidation pattern from 1.0964 could still extend further. But after all. further rally is in favor as long as 1.0823 support holds. Sustained break of 61.8% retracement of 1.1274 to 1.0447 at 1.0958 will resume the rise from 1.0447 to retest 1.1274 high. However, firm break of 1.0823 will indicate short term topping, and turn bias back to the downside for deeper decline.
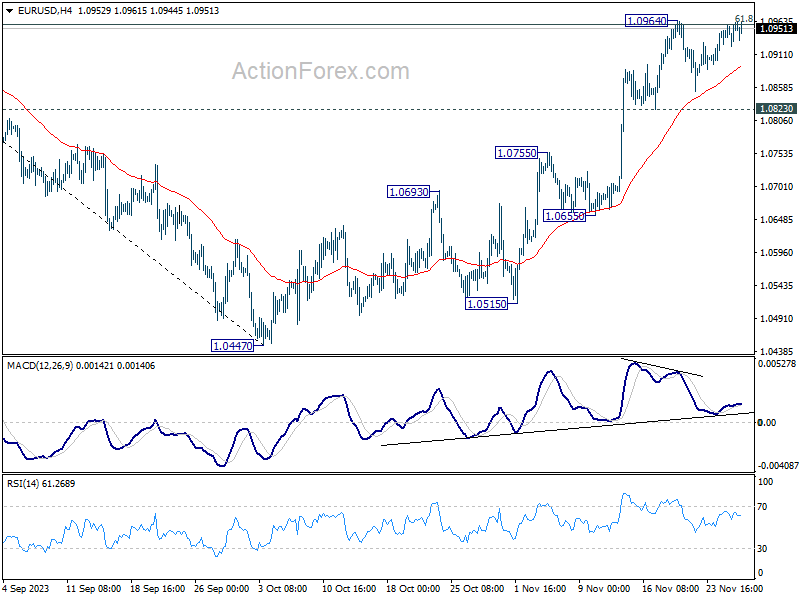
In the bigger picture, price actions from 1.1274 are viewed as a corrective pattern to rise from 0.9534 (2022 low). Rise from 1.0447 is tentatively seen as the second leg. Hence while further rally could be seen, upside should be limited by 1.1274 to bring the third leg of the pattern.
Hesitant Dollar Sellers In Search of Clear Signals for Further Action
The forex markets today are characterized by a lack of decisive direction. Dollar remains generally weak, yet there seems to be a reluctance among sellers to push it further down. Market focus is now shifting to comments from several Fed officials scheduled for today and the rest of the week, as Fed's blackout period approaches this weekend. However, these comments might not provide significant guidance as officials are likely waiting for more economic data, such as PCE inflation, ISM figures, and next week's non-farm payrolls, before forming a more defined view on the interest rate path.
Yen's rally experienced an interruption in European session, although it continues to be one of the strongest performers of the day. This rally has been fuelled by expectations that BoJ will exit its negative interest rate policy in the first half of next year. However, the market's reaction has been somewhat muted after initial move, as this view aligns with the general understanding that Japan's wage negotiations next year will play a crucial role in shaping monetary policy.
In other currency market movements, Canadian Dollar emerges as the strongest today, followed by Yen and Australian Dollar. On the weaker side, Swiss Franc is lagging, followed by New Zealand Dollar and Sterling. Euro and Dollar are showing mixed performances.
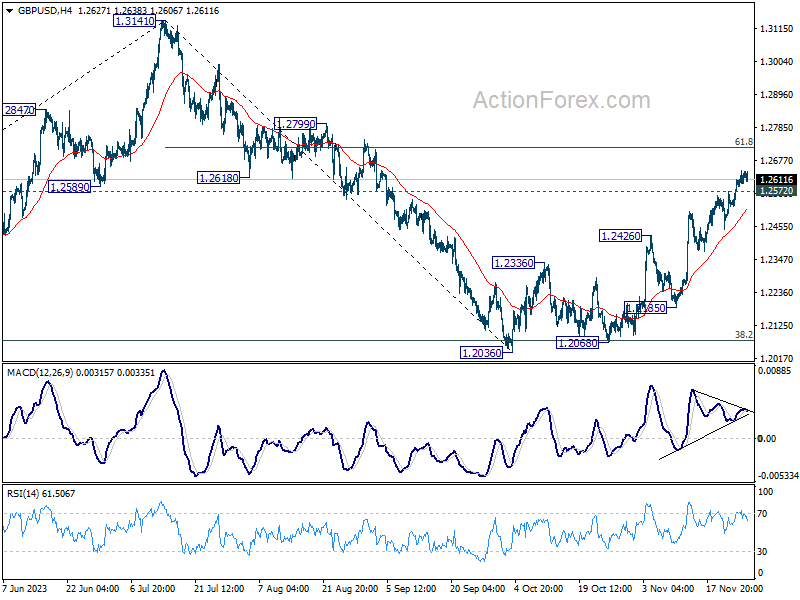
Technically, GBP/USD is losing momentum as seen in 4H MACD. While another rise cannot be ruled out, upside would likely be limited by 61.8% retracement of 1.3141 to 1.2036 at 1.2716 on first attempt. Meanwhile, break of 1.2572 minor support should now indicate short term topping, and bring deeper retreat, and lengthier consolidations. Still, outlook will stay cautiously bullish as long as 1.2426 resistance turned support holds.
In Europe, at the time of writing, FTSE is down -0.41%. DAX is down -0.18%. CAC is down -0.65%. Germany 10-year yield is up 0.0007 at 2.558. Earlier in Asia, Nikkei fell -0.12%. Hong Kong HSI fell -0.98%. China Shanghai SSE rose 0.23%. Singapore Strait Times fell -0.66%. Japan 10-year JGB yield fell -0.0205 to 0.755.
BoE's Ramsden: Inflation to stay stubbornly high through next year
In an interview with Bloomberg TV today, BoE Deputy Governor Dave Ramsden highlighted that services inflation, accounting for 45% of the consumer basket for CPI inflation, has been unexpectedly resilient at 6.6%. This figure, he noted, is an indication that UK inflation is increasingly becoming "home-grown."
Ramsden expressed concern over the stubborn nature of inflation, attributing it to factors such as high wage growth, which remains above 7%. Given the labor-intensive nature of UK's service sector, these wage pressures are a significant contributor to persistent inflation. This situation leads BoE to anticipate that inflation "is going to stay stubbornly high through next year."
Regarding monetary policy, Ramsden stated that it would need to remain "restrictive for an extended period of time" to effectively bring inflation down from its current level of 4.6% to the Bank's target of 2%.
Bundesbank's Nagel: Encouraging inflation outlook doesn't mean hike cycle is over
In a speech in Cyprus today, Joachim Nagel, ECB Governing Council member and Bundesbank President, described the inflation outlook as "encouraging". But he was quick to caution that this "that does not necessarily mean that the current hike cycle is now over."
Nagel emphasized the potential need to raise rates again if the "inflation outlook worsened"
He mentioned that a downside surprise, where price growth returns to ECB's 2% target quicker than anticipated, is "much less probable." As a result, Nagel believes it is too soon to even consider the possibility of rate cuts.
On the economic growth front, Nagel projected a rebound next year. He noted that wage growth remains robust and pointed out that the disinflationary effect of falling energy prices has faded.
Nagel also specifically advocated for a "significantly" smaller balance sheet. He stressed his preference to "err on the side of caution" to ensure a timely return to price stability.
Germany's Gfk consumer sentiment ticks up to -27.8, mood still characterized by uncertainty and concern
Germany's Gfk consumer sentiment index for December showed a marginal improvement, rising from -28.3 to -27.8, slightly better than expected -28.5. This slight uptick indicates a subtle shift in consumer sentiment as the year ends.
In November, economic expectations had a minor increase from -2.4 to -2.3. However, income expectations dropped from -15.3 to -16.7. There was a slight rise in willingness to buy, from -16.3 to -15.0, while willingness to save decreased from 8.5 to 5.3.
Rolf Bürkl, consumer expert at NIM,noted that "after three consecutive months of decline, consumer sentiment is stabilizing as the year draws to a close."
Despite this stabilization, Bürkl pointed out that consumer confidence remains at a very low level, with no indications of a sustainable recovery in the upcoming months. He emphasized that the overall mood is still "characterized by uncertainty and concern."
Australia retail sales down -0.2% mom in Oct, strategic delay for Black Friday
Australia's retail sales turnover in October displayed an unexpected downturn, falling by -0.2% mom, contrary to the anticipated rise of 0.1% mom. This decline follows a period of growth, with 0.9% mom increase in September and 0.2% mom rise in August.
Ben Dorber, head of retail statistics at ABS, noted "Retail turnover fell in October after a short-lived boost in spending in September." This downturn was seen across all retail categories except food retailing.
Dorber attributed this pause in consumer spending to a strategic delay by consumers, who are likely waiting to capitalize on Black Friday sales events in November. He observed that this has become a recurring pattern in recent years, with Black Friday sales gaining increasing popularity among consumers.
RBA's Bullock: we have to be a little bit careful in this period
In a central bank conference held in Hong Kong, RBA Governor Michele Bullock said that monetary policy is currently restrictive, a necessary stance to moderate demand and anchor inflation expectations.
Bullock highlighted the need to be "a little bit careful," in this period, aiming to control inflation and bring it back within target range of 2-3%, while also being mindful of not overly burdening the economy or causing a significant rise in unemployment rates.
Bullock also pointed out the emergence of "second-round effects" in areas like wages, observing that businesses are currently able to pass on increased costs to maintain profit margins, a trend reflecting sufficient demand.
EUR/USD Mid-Day Outlook
Daily Pivots: (S1) 1.0933; (P) 1.0946; (R1) 1.0967; More...
Intraday bias in EUR/USD remains neutral at this point. Consolidation pattern from 1.0964 could still extend further. But after all. further rally is in favor as long as 1.0823 support holds. Sustained break of 61.8% retracement of 1.1274 to 1.0447 at 1.0958 will resume the rise from 1.0447 to retest 1.1274 high. However, firm break of 1.0823 will indicate short term topping, and turn bias back to the downside for deeper decline.
In the bigger picture, price actions from 1.1274 are viewed as a corrective pattern to rise from 0.9534 (2022 low). Rise from 1.0447 is tentatively seen as the second leg. Hence while further rally could be seen, upside should be limited by 1.1274 to bring the third leg of the pattern.
Economic Indicators Update
| GMT | Ccy | Events | Actual | Forecast | Previous | Revised |
|---|---|---|---|---|---|---|
| 00:01 | GBP | BRC Shop Price Index Y/Y Oct | 4.30% | 5.20% | ||
| 00:30 | AUD | Retail Sales M/M Oct | -0.20% | 0.10% | 0.90% | |
| 07:00 | EUR | Germany Gfk Consumer Confidence Dec | -27.8 | -28.5 | -28.1 | -28.3 |
| 09:00 | EUR | Eurozone M3 Money Supply Y/Y Oct | -1.00% | -0.90% | -1.20% | |
| 14:00 | USD | S&P/Case-Shiller Home Price Indices Y/Y Sep | 4.20% | 2.20% | ||
| 14:00 | USD | Housing Price Index M/M Sep | 0.40% | 0.60% | ||
| 15:00 | USD | Consumer Confidence Nov | 101 | 102.6 |
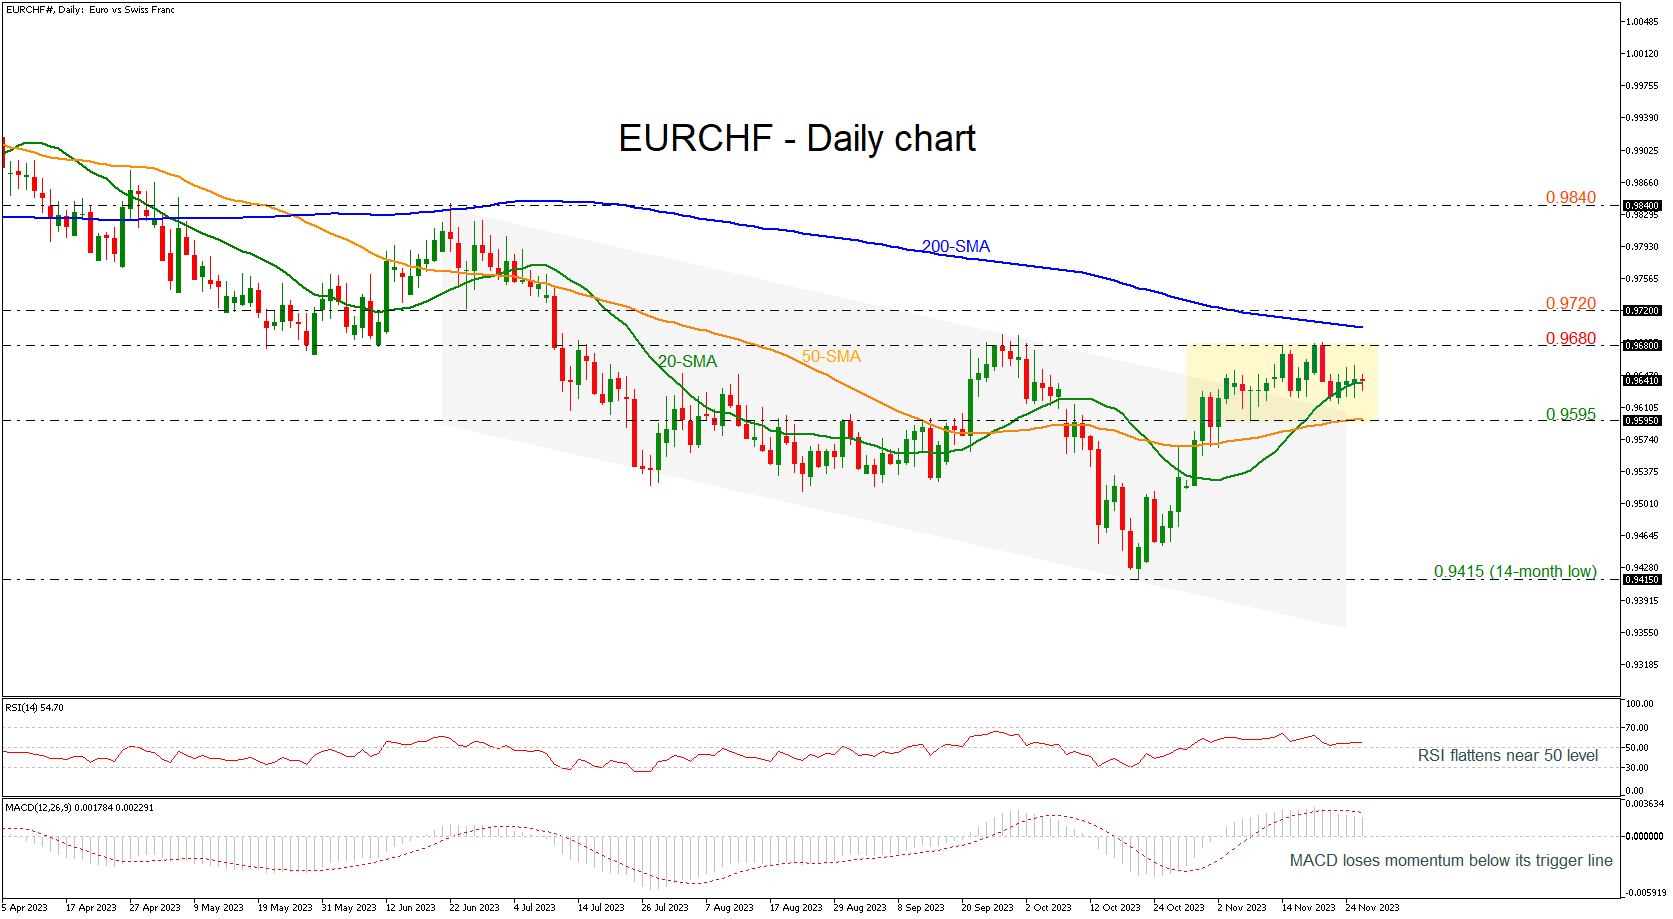
EURCHF Holds Within Narrow Range
- EURCHF breaks downward sloping channel to the upside
- Price’s momentum is weak for further upward move
- MACD and RSI lose momentum
EURCHF penetrated the medium-term descending channel to the upside, but the momentum is too weak as the price is consolidating withing a tight range of 0.9595 – 0.9680.
To attract new buyers, the bulls will have to surpass the nearby resistance of 0.9680 and move beyond the 200-day simple moving average (SMA) at 0.9700. In this case, the price could pick up steam towards the important resistance area at 0.9720. Another successful battle there could see the price jumping to the 0.9840 barrier.
However, the muted technical indicators do not currently confirm the recent bullish scenario. The narrowing SMAs are indicating a potential explosive move but the direction is unclear as the flattening RSI has recently escaped a drop below its 50 neutral mark, whereas the MACD keeps lacking power below its trigger line.
Hence, a downside correction could still be possible in the coming sessions. If the pair slumps below the 50-day SMA and the 0.9595 support level, it could stabilize near the 14-month low of 0.9415.
Summing up, EURCHF has not eliminated downside risks yet, despite the upside break of the downward sloping channel. To boost buying confidence, the pair will need to crawl above 0.9680, and more importantly, strengthen its uptrend above the 200-day SMA.
EUR/USD: Pivotal Barrier Under Increased Pressure, Economic Data Eyed for Fresh Signals
EURUSD remains steady and holding near 3 ½ month high on Tuesday, with little impact from weaker than expected EU economic data.
Bulls continue to pressure cracked Fibo resistance at 1.0559 (61.8% of 1.1275/1.0448, which proved to be significant barrier, after rsisting two attacks.
Bulls remain firmly in play on daily chart, with strong positive momentum, moving averages in bullish configuration and converging 20/200DMA’s about to form a golden cross and reinforce signal, while the action remains supported by rising thick weekly Ichimoku cloud.
Rising 10DMA, which tracks the price action for almost one month, offers initial support at 1.0909, where downticks should find firm ground, to keep bulls intact and guard lower pivots at 1.0862/52 (broken Fibo 50% / Nov 17 higher low.
Firm break of 1.0959 barrier to generate initial signal of bullish continuation and expose next targets at 1.1000/80 (psychological/Fibo 76.4% of 1.1275/1.0448).
Caution on possible extended consolidation/shallow pullback as daily studies are entering overbought territory.
Expect stronger signals from economic data (EU CPI/US GDP and PCE) due on Wed/Thu.
Res: 1.0965; 1.1000; 1.1065; 1.1080.
Sup: 1.0925; 1.0909; 1.0862; 1.0852.

AUD/USD: Bullish Breakout Ahead of Monthly AU CPI Data
- AUD/USD has cleared above the key 200-day moving average now acting as a near-term support of 0.6595.
- Consensus estimates are expecting a softer AU monthly CPI for October (5.2% vs. 5.6% Sep) for tomorrow, 29 November.
- Recent hawkish rhetoric from newly appointed RBA governor Bullock has narrowed the discount yield spread between the 2-year AU sovereign bond over the US Treasury note.
- Watch the key short-term support of 0.6570 on the AUD/USD.
The AUD/USD has staged the expected rally right above the 0.6330 key short-term support as highlighted in our analysis where it printed an intraday low of 0.6339 on 10 November 2023 and hit the 0.6520 resistance on 15 November 2023.
Thereafter, its price actions continued its short-term bullish momentum as it cleared above 0.6520 and the long-term 200-day moving average (acting as a resistance at 0.6595) yesterday, 27 November 2023.
The recent impulsive upmove in the AUD/USD in place since 26 October 2023 has been primarily driven by renewed hawkish rhetoric of the Australian central bank, RBA under the helm of a newly appointed governor Michele Bullock who has a more hawkish vibe than her predecessor.
RBA governor Bullock highlighted in her recent speech last week that Australia’s inflation has been driven by domestic factors rather than imported goods such as oil, hence it is likely a challenging task for RBA to bring such elevated domestic inflationary pressure down which in turn may require higher interest rates.
Narrowing of the discount spread between the 2-year AU sovereign bond over US Treasury note
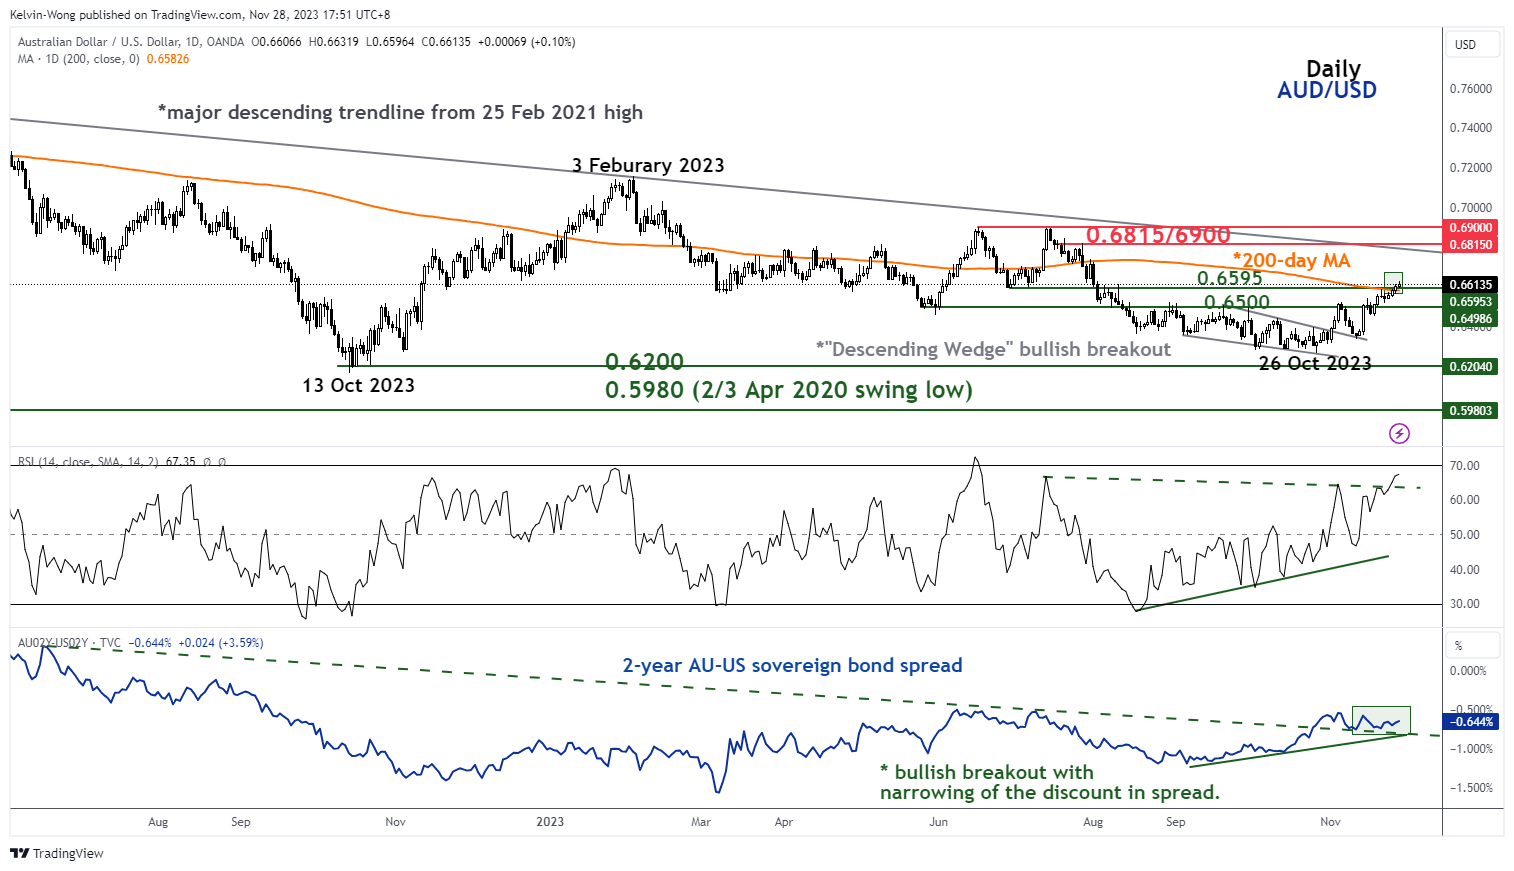
Fig 1: AUD/USD medium-term trend as of 28 Nov 2023 (Source: TradingView, click to enlarge chart)
The current hawkish RBA resurgence has led to the discount yield spread of the 2-year Australian government bond over the 2-year US Treasury note to narrow since late October 2023 which in turn supports the ongoing bullish momentum of the AUD/USD.
In addition, the release of the latest Australian monthly CPI indicator for October tomorrow, 30 November is likely to be pivotal as the consensus estimates have indicated an annualized slowdown to 5.2% from September’s five-month high of 5.6%; in line with decelerating inflationary pressures seen globally.
Hence, if October’s monthly CPI surprises to the upside, it is likely to reinforce the current hawkish stance of RBA which in turn supports the ongoing short-term uptrend of AUD/USD.
Watch the key short-term support at 0.6570
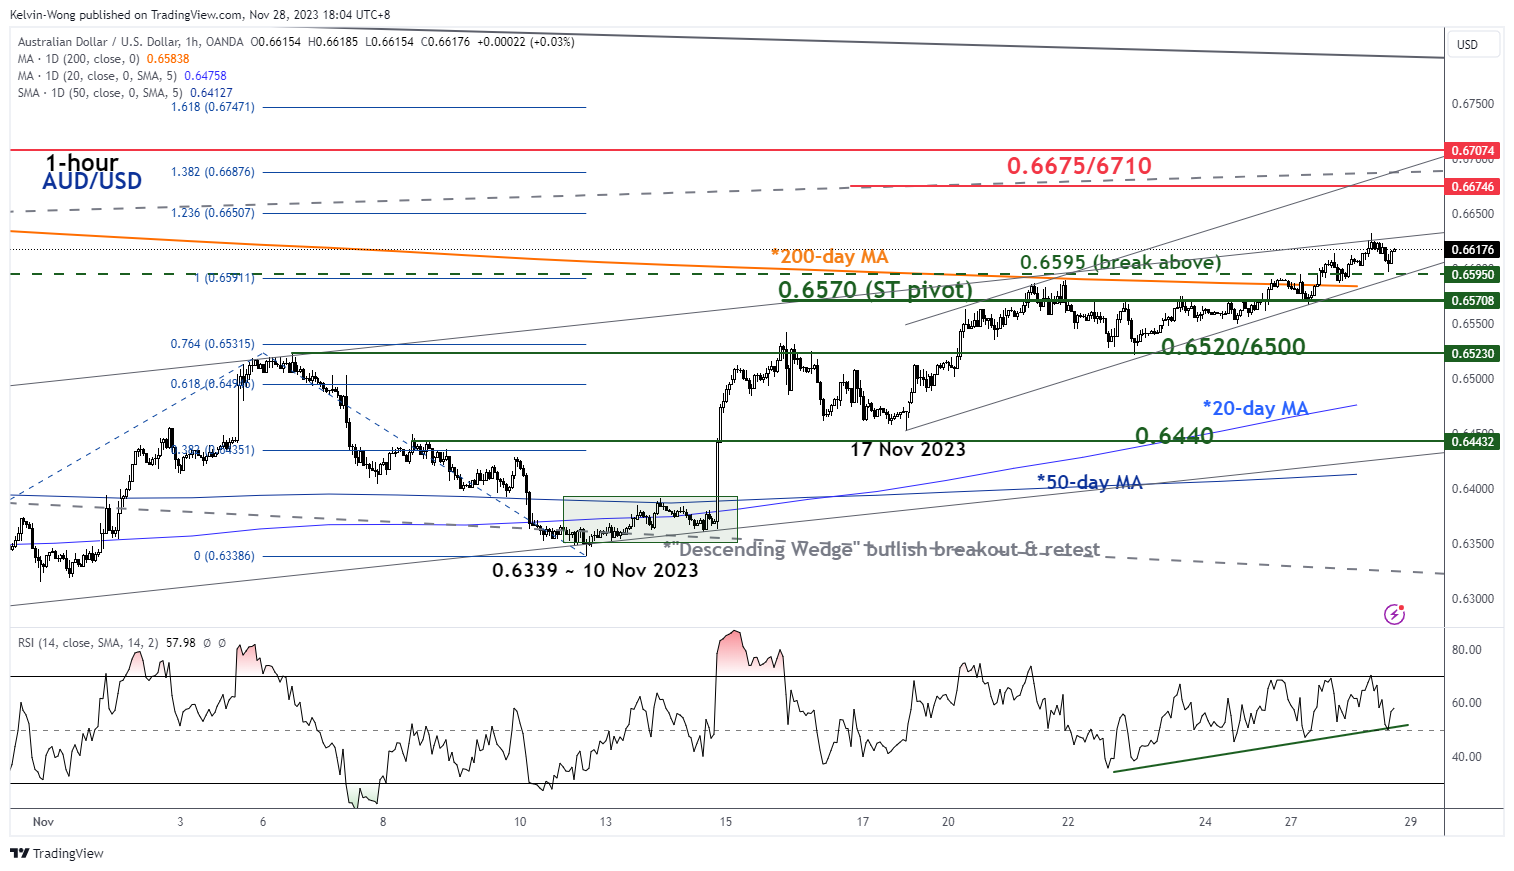
Fig 2: AUD/USD minor short-term trend as of 28 Nov 2023 (Source: TradingView, click to enlarge chart)
Today’s current pull-back of 35 pips from its intraday high of 0.6632 at this time of the writing has managed to hold at the 200-day moving average now acting as a near-term support of 0.6595.
In addition, the hourly RSI momentum indicator has managed to bounce off its parallel support at the 50 level which indicates that short-term bullish momentum may be intact.
If the 0.6570 key short-term pivotal support is not broken to the downside, the AUD/USD may continue its short-term impulsive upmove sequence with the next intermediate resistances coming in at 0.6675 and 0.6710.
However, failure to hold at 0.6570 negates the bullish tone to expose the next immediate support at 0.6520/6500 (also close to the upward-sloping 20-day moving average).
BoE’s Ramsden: Inflation to stay stubbornly high through next year
In an interview with Bloomberg TV today, BoE Deputy Governor Dave Ramsden highlighted that services inflation, accounting for 45% of the consumer basket for CPI inflation, has been unexpectedly resilient at 6.6%. This figure, he noted, is an indication that UK inflation is increasingly becoming "home-grown."
Ramsden expressed concern over the stubborn nature of inflation, attributing it to factors such as high wage growth, which remains above 7%. Given the labor-intensive nature of UK's service sector, these wage pressures are a significant contributor to persistent inflation. This situation leads BoE to anticipate that inflation "is going to stay stubbornly high through next year."
Regarding monetary policy, Ramsden stated that it would need to remain "restrictive for an extended period of time" to effectively bring inflation down from its current level of 4.6% to the Bank's target of 2%.
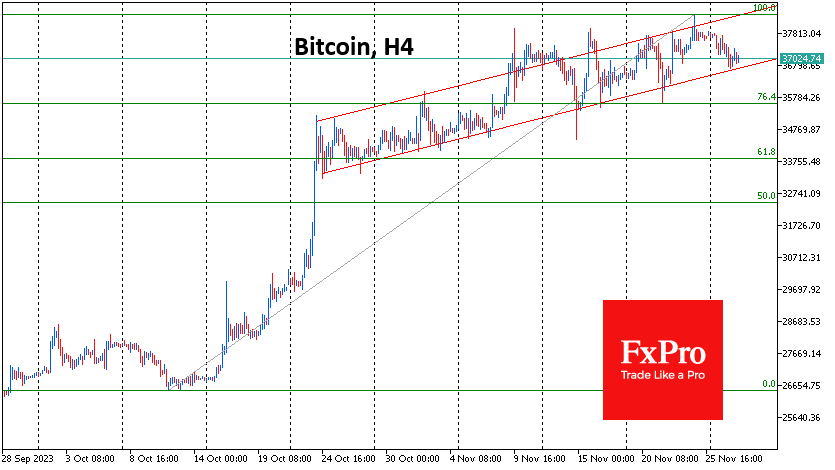
Crypto Deepens Correction
Market Picture
The crypto market has lost 1.5% in the last 24 hours to capitalisation of $1.42 trillion. Traditional markets have also seen a slight pullback from the last week’s peak. Investors appear to be looking to lock in profits after the booming gains in October and November. The rally in crypto was stronger, so the correction is deeper.
Bitcoin was down 0.5% overnight to $37.0K, approaching the lower boundary of one month’s ascending channel. A classic upside correction from the October lows suggests a pullback to $34K. Higher turning points could be the $36.7K area (recent local lows) and $35.6K (76.4% support and last week’s low).
According to CoinShares data, crypto fund investments rose sharply last week, by $346 million at once; significant inflows continued for the fifth week in a row and the ninth week overall. Bitcoin investments increased by $312 million, Ethereum by $34 million, and Solana by $3.5 million.
News background
Growing optimism over the approval of spot bitcoin ETFs has led to the largest inflows since the bull market at the end of 2021. The combination of rising prices and capital inflows pushed total assets under management (AuM) to $45.3bn, the highest in a year and a half, CoinShares noted.
Ethereum could reach $36,800 by 2030, Token Terminal predicts. ETH leads in terms of DeFi protocols and NFT projects. Its closest competitors Solana and Cardano do not have such high bandwidth and more flexible software.
Ex-Binance CEO Changpeng Zhao should remain at large pending the court’s verdict but not leave US territory due to a “manageable flight risk”, the country’s Justice Department said in a new motion.
At the Devconnect event in Turkey, Vitalik Buterin presented a strategy aimed at improving the Ethereum network’s betting mechanism and the performance of the entire blockchain. The Ethereum co-founder is concerned about the risks of centralising liquidity solutions for ETH network staking, especially considering the activity of companies like Lido Finance.
A user under the nickname 83_5BTC, from whose address a record $3.1 million commission was paid on 23rd of November, said he was the victim of a hacker. According to him, the attacker stole more than 139 BTC ($5.2 million) from him, including transaction fees of 83.65 BTC ($3.1 million).
Natural Gas Prices Fall to More than 2-month Lows
Yesterday, XNG/USD quotes dropped below the 2,900 level for the first time since mid-September. This was helped by the fact that the NatGasWeather weather forecasting model late last week showed a cooling trend in December in the US, but this was replaced by warming over the weekend.
According to analyst forecasts from Analysts Tudor, Pickering, Holt & Co., published on Monday:
→ natural gas reserves at the end of winter could be 2 trillion cubic feet (previously forecast 1.9 trillion);
→ price could be USD 2.75 (previous forecast was USD 3 or less).
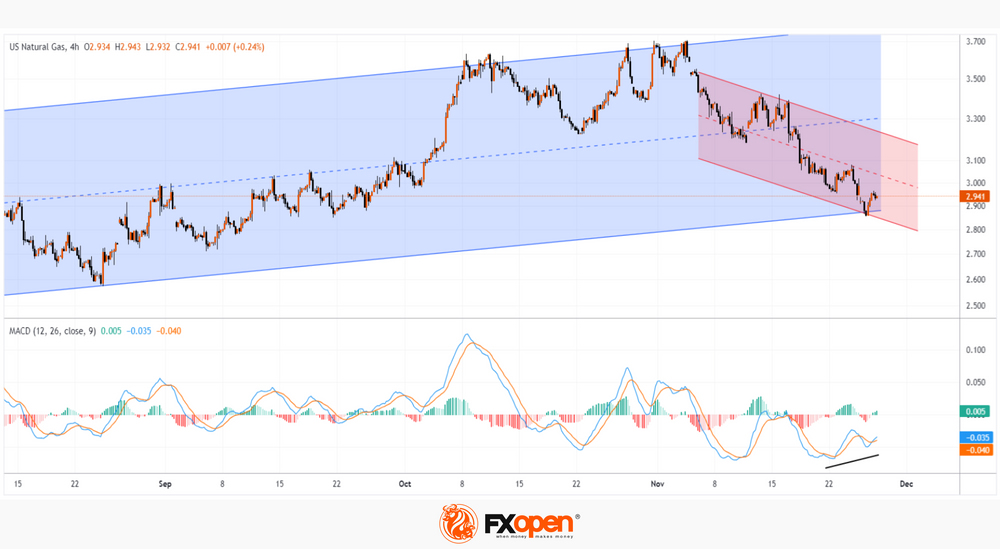
Meanwhile, the US Natural Gas price chart shows that:
→ the price of natural gas is near the lower border of the channel (shown in blue), which can provide support;
→ the MACD indicator indicates divergence (a sign of weakening selling pressure).
Thus, although the market has been in a bearish trend since the beginning of November (shown in red), the chart shows bullish signs — it is possible that the price in the short term may rise to the upper limit of the red channel. The likelihood of this scenario will increase if the weather forecasting model indicates a cold snap.
This article represents the opinion of the Companies operating under the FXOpen brand only. It is not to be construed as an offer, solicitation, or recommendation with respect to products and services provided by the Companies operating under the FXOpen brand, nor is it to be considered financial advice.
Euro Shrugs after Lagarde Comments
- ECB’s Lagarde says inflation fight not over
- US PMIs paint a mixed picture
The euro is almost unchanged on Tuesday. In the North American session, EUR/USD is trading at 1.0948, down 0.05%.
Lagarde says inflation fight not over
The week started with no eurozone releases, giving investors plenty of time to focus on remarks from ECB President Lagarde to an EU parliamentary committee. Lagarde said that inflation was expected to continue falling but there was considerable uncertainty and “this is not the time to start declaring victory” over inflation. Lagarde’s caution is understandable, as the ECB does not want to convey a message that the battle against inflation is over when inflation is running at a 4.2% clip, more than twice the ECB’s 2% target. Eurozone inflation data will be released on Thursday and is expected to continue falling, with a consensus estimate of 3.9%.
The ECB has raised rates to 4.0% but has signalled a “higher for longer” policy for the next several quarters. The markets are more dovish and are looking for a rate cut sometime in mid-2024. The ECB hasn’t made mention of any plans to cut rates, and Lagarde didn’t shed any light on rate policy today, as she merely repeated that rates would remain “sufficiently restrictive” for as long as necessary.
The US ended the week with a mixed PMI report. Manufacturing PMI eased to 49.4, down from 50.0 and shy of the consensus estimate of 49.8. Manufacturing has posted mostly declines as the sector remains in a severe slump. Services is in better shape, with the PMI pointing to weak growth in the past few months. The PMI improved slightly to 50.8 in October, up from 50.6 a month earlier. On Thursday, the US releases ISM Manufacturing PMI, which is expected to post another decline.
EUR/USD Technical
- There is resistance at 1.0943 and 1.0997
- 1.0831 and 1.0748 are providing support
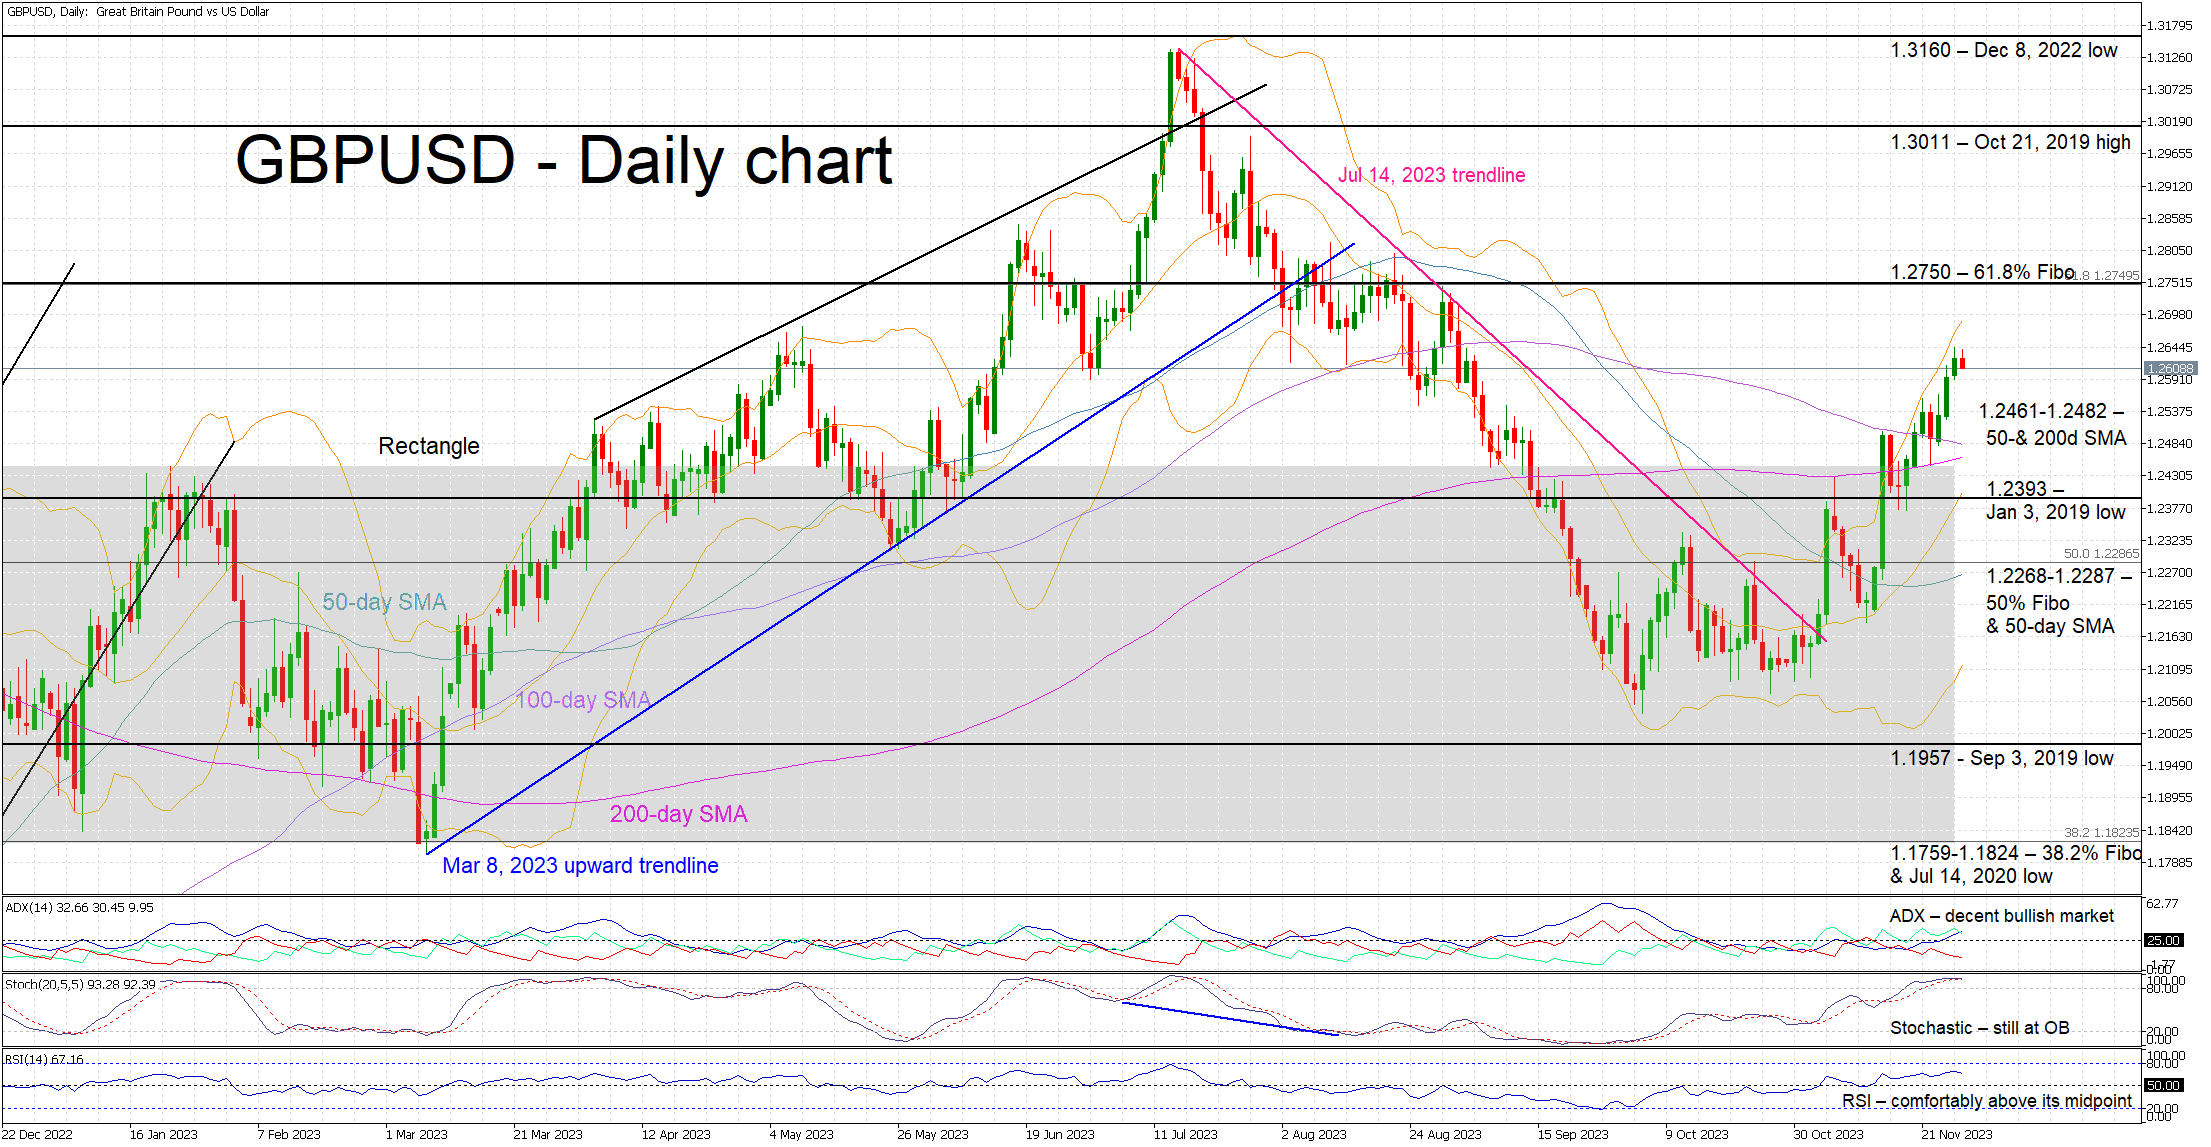
Has GBPUSD Rally Run Its Course?
- GBPUSD tries to record another green candle
- The strong move from the October lows continues undaunted
- Momentum indicators remain favourable for the current move
GBPUSD is trying to register its fourth consecutive green candle as the strong upmove from the October lows continues after GBPUSD managed to surpass the resistance set by the 50- and 200- simple moving averages (SMAs). The bulls' appetite appears to be undeterred, especially as the convergence of the aforementioned SMAs is potentially opening the door to another sizeable move.
Momentum indicators support the current rally. The RSI is trading at its highest level since mid-July 2023, and the Average Directional Movement Index (ADX) is steadily edging higher, above its threshold and thus signaling the presence of a decent bullish trend in the market. More interestingly, the stochastic oscillator is hovering at the upper part of its overbought territory (OB) and battling with its moving average. While it can stay there for a while, the current move could also be seen as an early exhaustion signal.
Should the bulls remain confident, they could try to stage a move towards the 61.8% Fibonacci retracement of the June 1, 2021 – September 26, 2022 downtrend at 1.2750. If successful in overcoming this level, the path then looks clear until the October 21, 2019 high at 1.3011. Even higher, the December 8, 2022 low at 1.3160 appears to be a strong resistance level.
On the flip side, the bears are trying to regain market control and appear keen to push GBPUSD back below the 1.2461-1.2482 area that is defined by the 50- and 200-day SMAs. They could then test the support set by the January 3, 2019 low at 1.2393, a tad above the busier 1.2268-1.2287 range, which is populated by the 50-day SMA and the 50% Fibonacci retracement level.
To conclude, GBPUSD bulls remain in control of the market but their hard-earned gains could be under threat if the stochastic oscillator decides to edge below both its moving average and OB territory.