

Sample Category Title
Next Leg in US 500 Cash Index Could be Critical
- US 500 cash index trades sideways after recent upleg
- Strong rebound from late-October lows amidst key market events
- Mixed momentum indicators complicate the short-term outlook
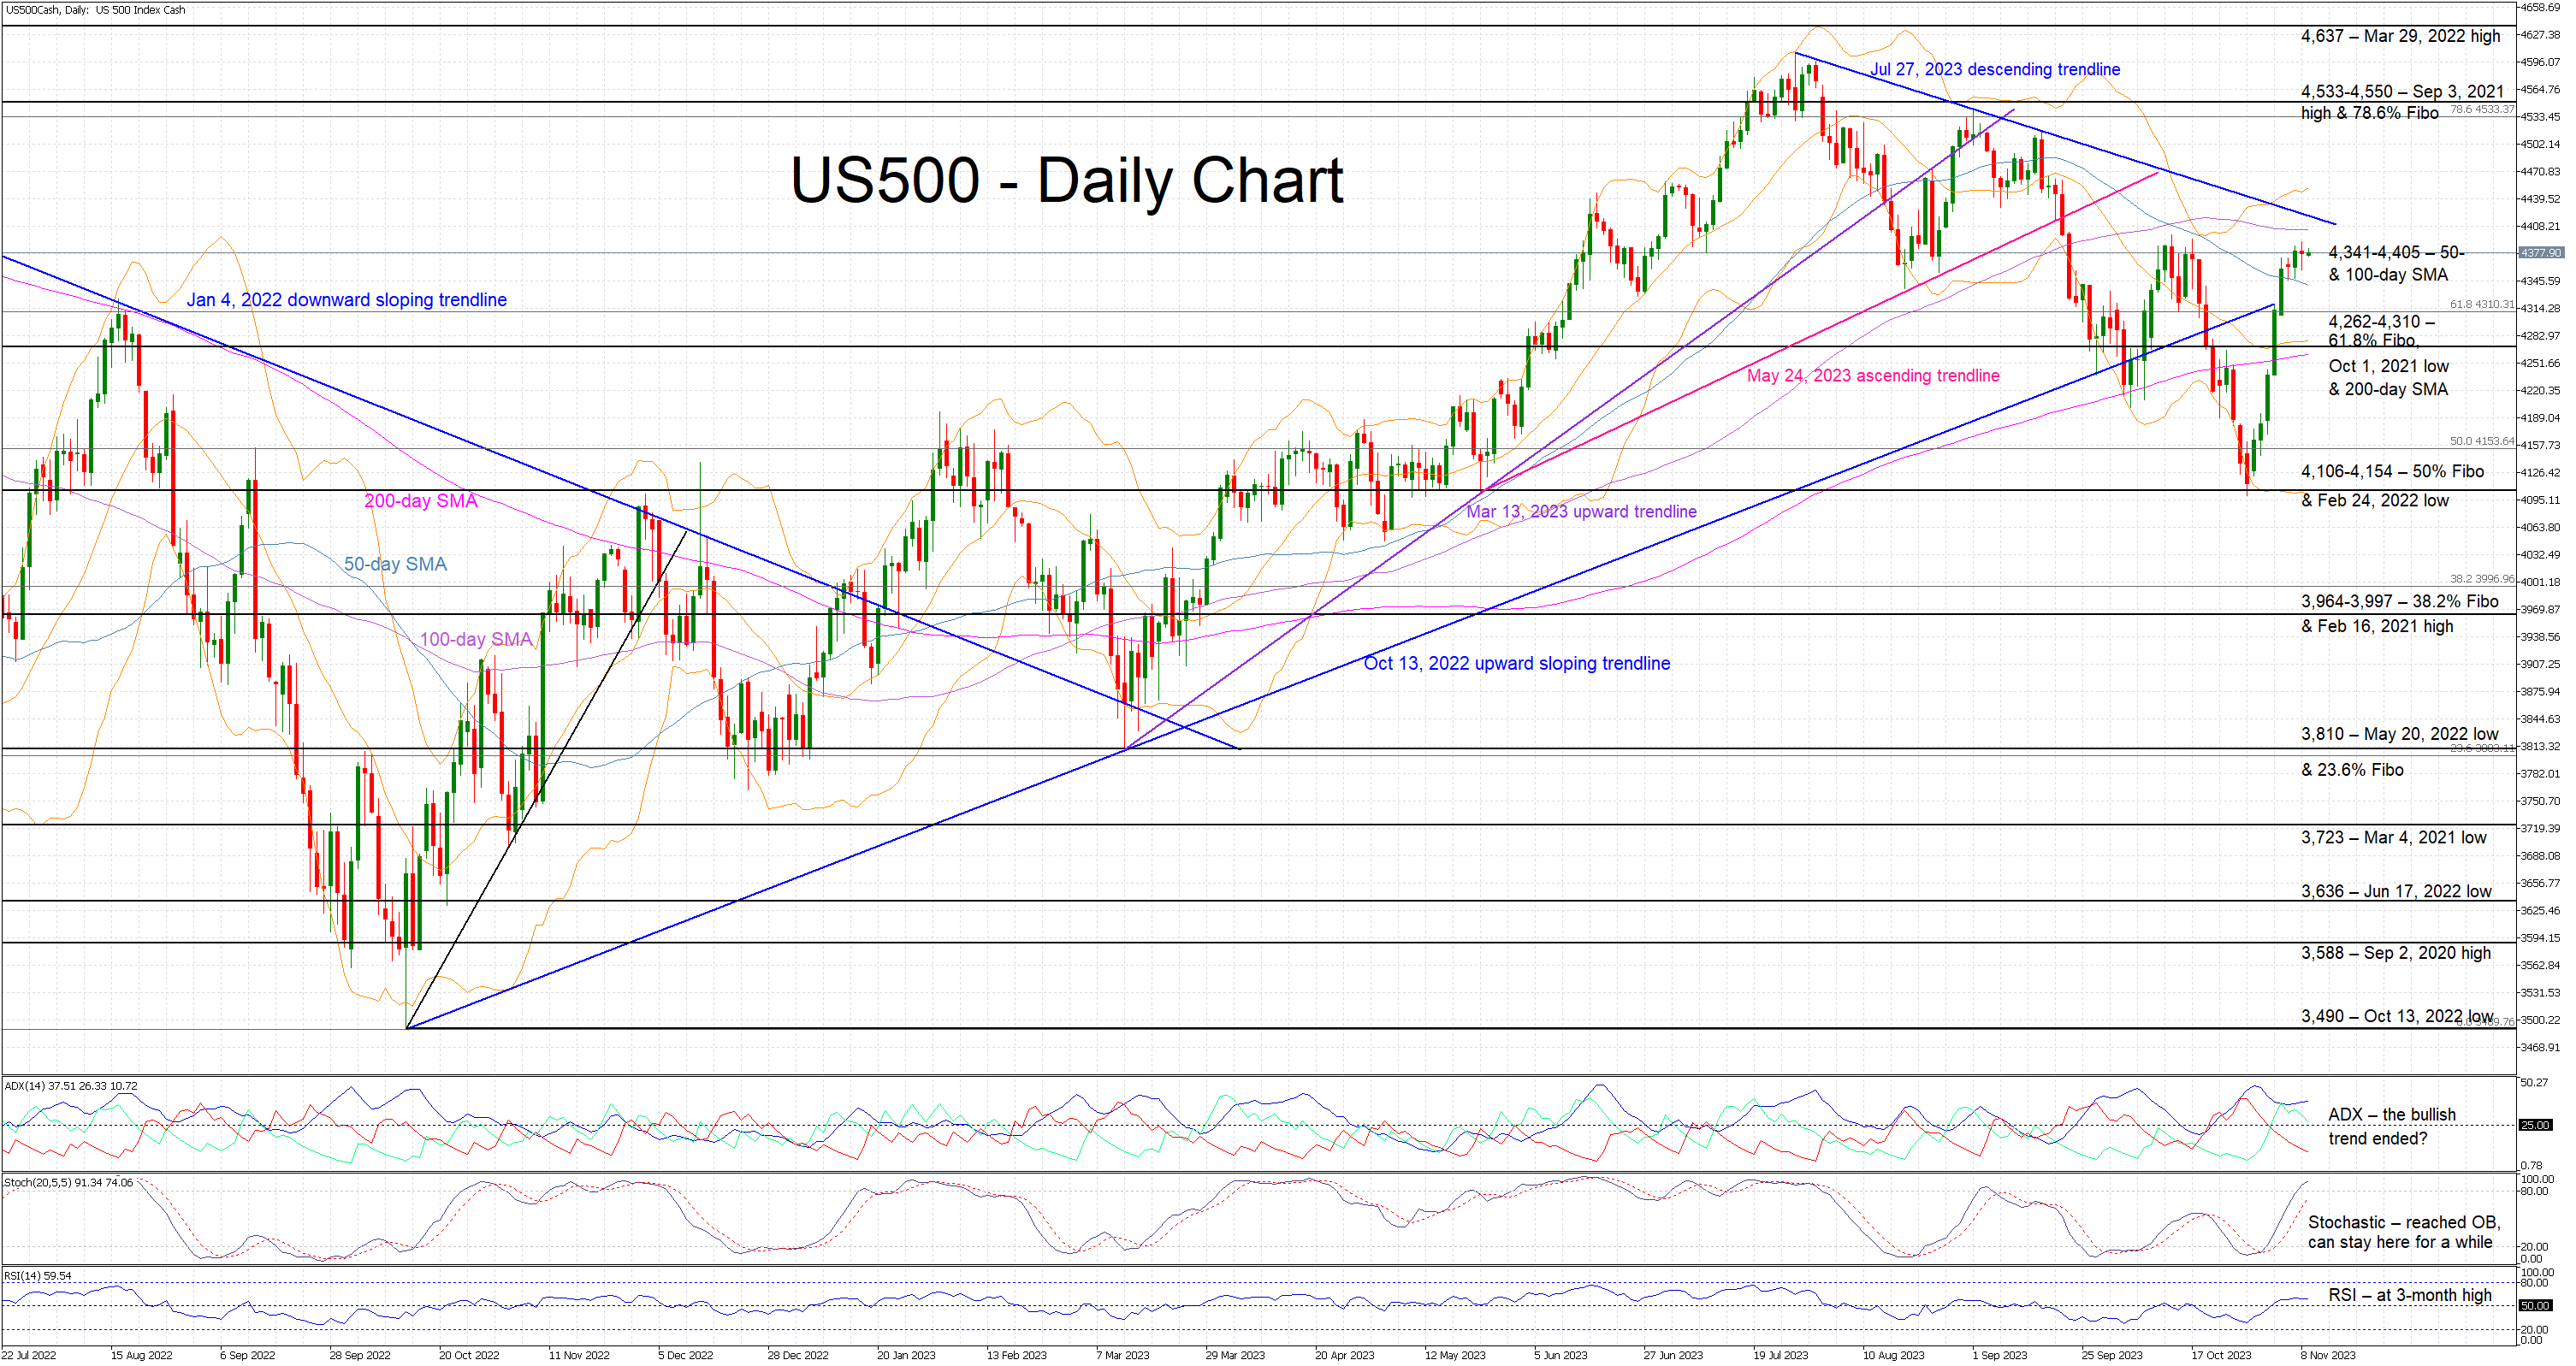
The US 500 cash index is trying to record a green candle today as it trades between the 50- and 100-day simple moving averages (SMAs). It currently stands around 7% higher than the October 27 low with the rally stopping, potentially temporarily, a tad below the previous peak recorded on October 12. Thus, the US 500 index has failed, up to now, to record a higher high and cancel out the bearish pattern of lower lows and lower highs that has been in place since July 27.
The bulls are probably looking at the momentum indicators for clues on the next leg in the US 500 index. The Average Directional Movement Index (ADX) is trading sideways and thus pointing to a weakening bullish trend. Similarly, the RSI is trading at a 3-month high but appears unwilling to move higher. More importantly, the stochastic oscillator has reached its overbought territory, still holding a good gap from the moving average. This is potentially an early sign that the current upleg might not have legs.
Should the bulls remain committed to pushing the US 500 index higher, they could first try to overcome the 4,341-4,405 area. They could then have a go at breaking above the July 27, 2023 descending trendline, which has proved a sizeable resistance point in the recent past. Even higher, the bulls could then set course for the busy 4,533-4,550 range.
On the flip side, the bears are trying to protect their summer gains and look ready to defend the 4,341-4,405 area. If successful, they could then come up against significant support in the 4,262-4,310 range. This is defined by the 61.8% Fibonacci retracement level of the January 4, 2022 – October 12, 2022 downtrend, the October 1, 2021 low and the 200-day SMA. Even lower, the path looks clear until the 4,106-4,154 region.
To conclude, US 500 cash index bulls have staged an impressive comeback from the October lows. However, they are still looking to record a higher high despite the potentially shrinking support from momentum indicators.
EURUSD Gets Assistance after Rejection from 200-EMA
- EURUSD decelerates below 200-EMA resistance
- Positive structure remains intact above 1.0600
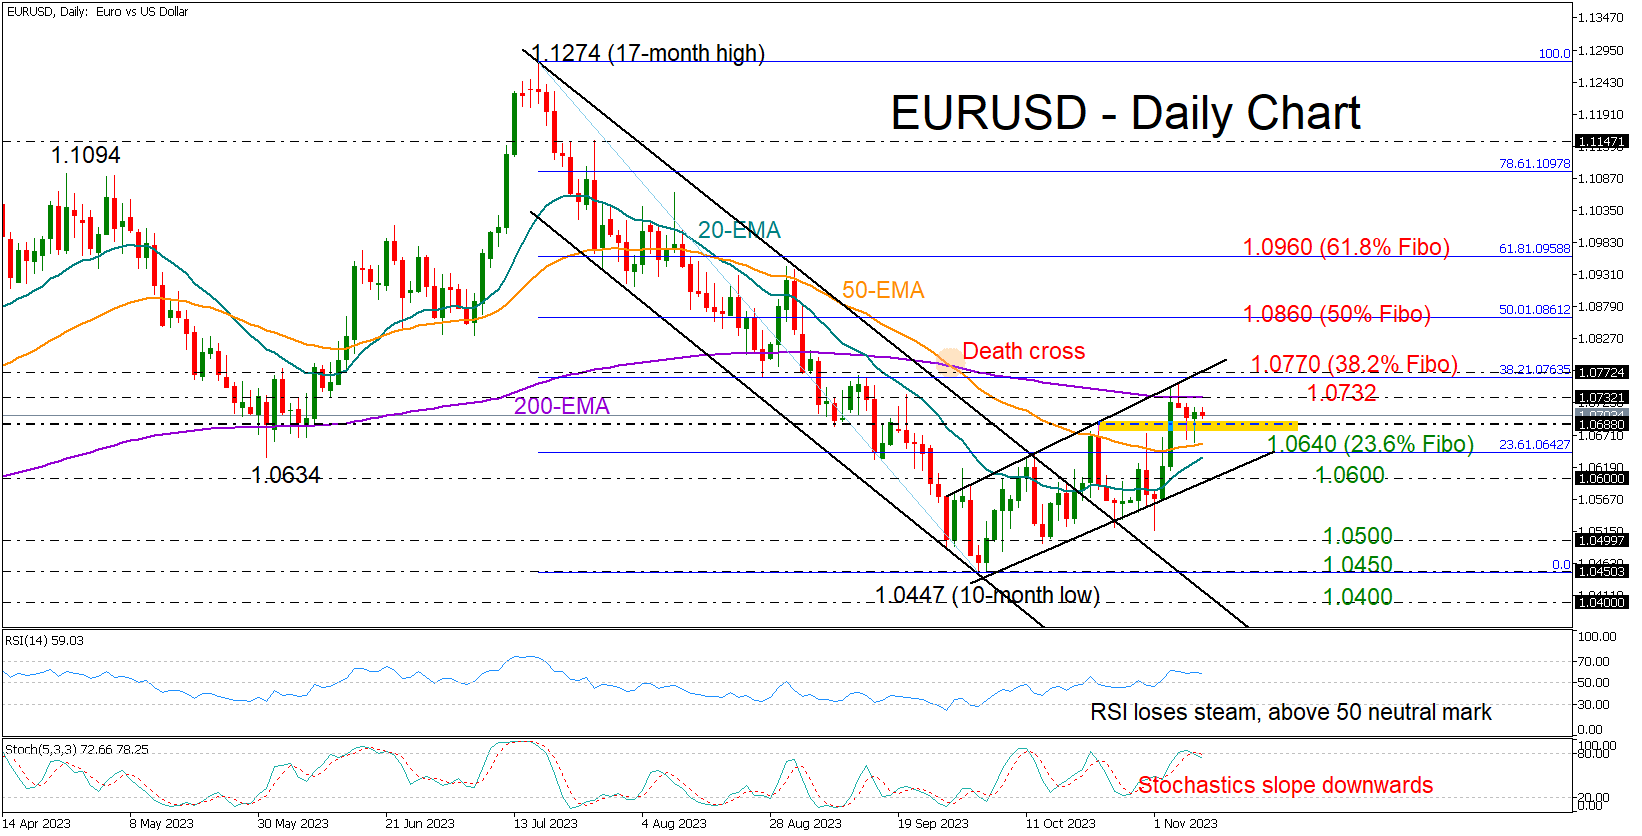
EURUSD could not carry last week’s impressive rally above its 200-day exponential moving average (EMA), but the 50-day EMA helped the pair to hold within the 1.0700 zone and above its previous high.
The market structure is positive in the short-term picture as the pair keeps fluctuating within a bullish channel. Hence, even if downside pressures resume, the pair will remain attractive unless it exits the bullish formation below 1.0600. If that bearish scenario unveils, selling forces could intensify towards the 1.0500 mark. Then, additional losses from there could retest October’s low near 1.0450 and the 1.0400 psychological mark, where the upper band of the previous bearish channel is positioned.
In the event the price stays resilient above its October high and the 1.0700 number, the bulls might push for a close above the 200-day EMA and out of the bullish channel at 1.0763. This is where the 38.2% Fibonacci retracement of the previous downleg is placed. Therefore, a successful move higher could immediately shift the attention to the 50% Fibonacci of 1.0860 and then towards the 61.8% Fibonacci of 1.0960.
Technically, the bulls might still be in the town as the RSI is still clearly above its 50 neutral mark despite losing some ground, but any gains could be short-lived as the stochastic oscillator seems to have peaked in the overbought zone above 80.
In a nutshell, EURUSD may remain supported in the coming sessions, though room for improvement could be limited before the next bearish round takes place.
Gold Technical: At the Risk of Further Corrective Decline Before Potential Recovery
- Gold’s stagflation hedge purpose has been negated after a rotation back into long-duration risk assets/equities.
- Watch the US$1,972 key short-term resistance on spot Gold (XAU/USD) to maintain on-going corrective decline structure.
- Medium-term uptrend remains intact as long as US$1,903 support holds.
In the past two weeks, the price actions of Spot Gold (XAU/USD) have started to lose some of their glitter as a safe haven play due to the “status quo” situation in the ongoing Israel-Hamas conflict without any further rise in the geopolitical risk premium at this juncture.
Also, a rotation back into long-duration risk assets such as the US mega-cap technology and growth-oriented equities ex-post FOMC Fed Chair Powell’s press conference and the lacklustre US non-farm payrolls and US ISM Services PMI data for October where the Nasdaq 100 recorded a weekly gain of +5.07% last week may have put a damper on gold’s stagflation hedge purpose.
Broke below its 20-day moving average with a minor bearish “Head & Shoulders”
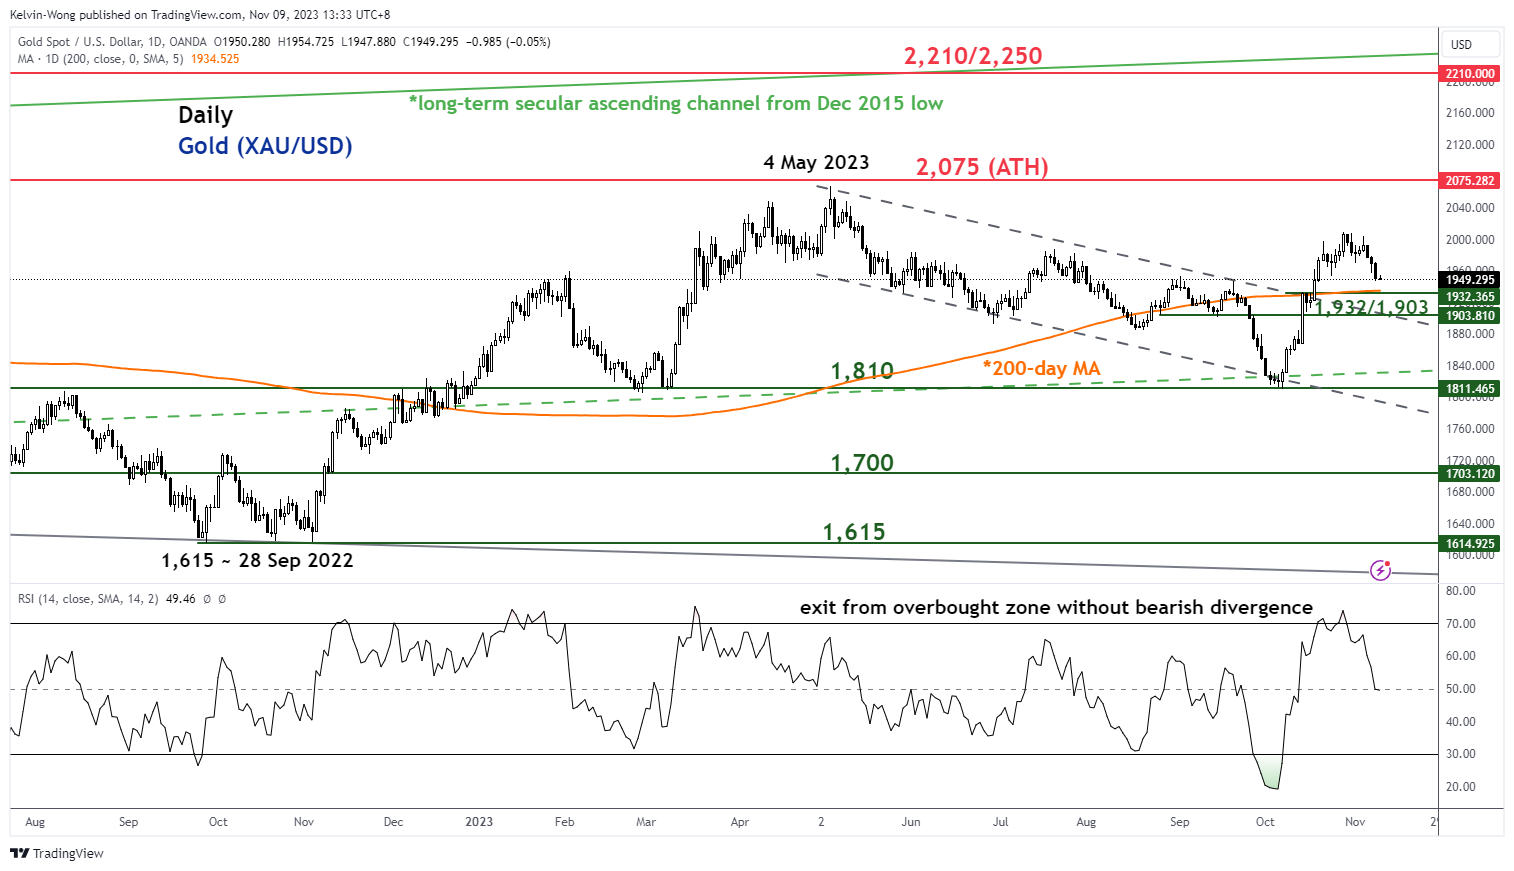
Fig 1: Spot Gold (XAU/USD) medium-term trend as of 9 Nov 2023 (Source: TradingView, click to enlarge chart)
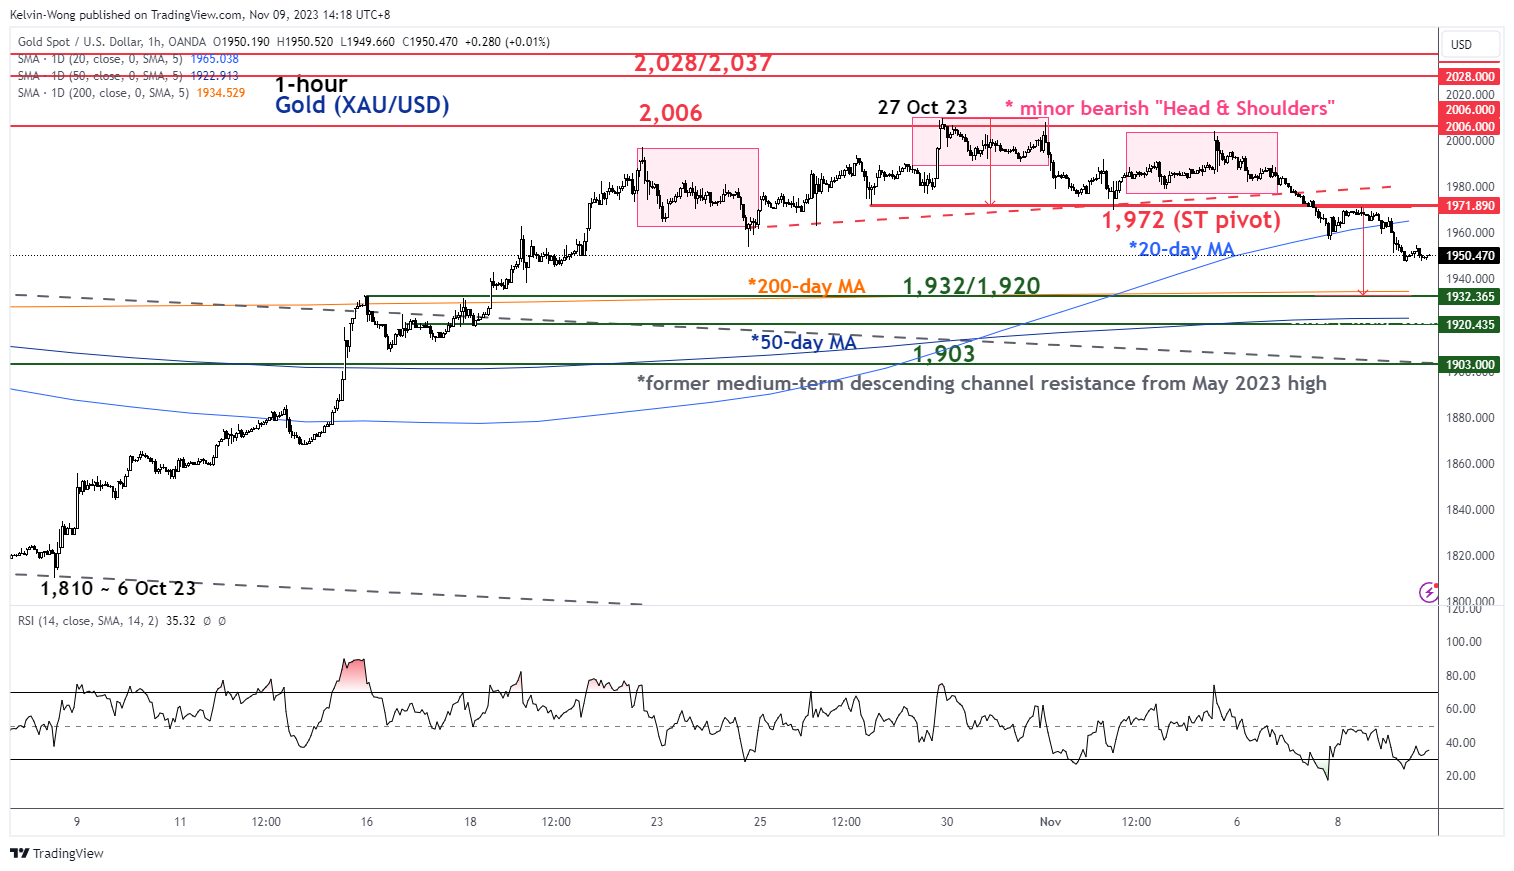
Fig 2: Spot Gold (XAU/USD) minor short-term trend as of 9 Nov 2023 (Source: TradingView, click to enlarge chart)
The medium-term uptrend phase of Gold (XAU/USD) has remained in place since its 6 October low of US$1,810 as its price actions continued to trade above its key 200-day moving average and the pull-back of its former descending channel resistance now acting as a support at US$1,903.
In the short term, Gold (XAU/USD) is likely in the process of undergoing a corrective decline or pull-back sequence to negate the overbought condition of its recent steep rally of +11% from its 6 October low to 27 October 2023 high.
Watch the US$1,972 key short-term pivotal resistance for a further potential slide toward the intermediate support zone of US$1,932/1,920 (50, 200-day moving averages & the exit target potential of the minor bearish “Head & Shoulders” breakout).
Failure to hold at US$1,920 may extend the corrective pull-back towards the key medium-term support of US$1,903 (the pull-back of the former descending channel resistance from the May 2023 high & and close to the 50% Fibonacci retracement of prior rally from 6 October low to 27 October 2230 high).
On the flip side, a clearance above US$1,972 invalidates the corrective pull-back scenario to jumpstart potentially another bullish impulsive upmove sequence towards the minor range resistance of US$2,006 before the next incoming intermediate resistance zone at US$2,028/2,037.
WTI Oil Consolidating After Strong Fall in Past Two Days
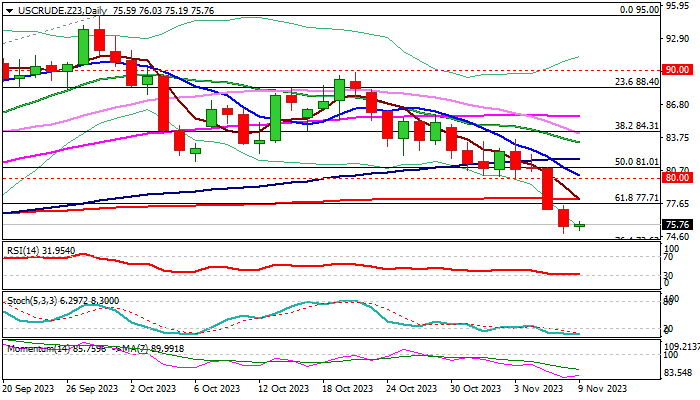
WTI oil is consolidating within a tight range on Thursday morning after falling 6.6% in past two days.
Strong sell-off was sparked by easing worries over supply disruptions in the Middle East and growing concerns about demand from the US and China, world’s two largest consumers.
Recent economic data from China were below expectations, though partially balanced by still strong oil imports, while US crude inventories increased, pointing to weakening demand.
Oil price fell to the lowest in nearly four months that weakened near-term outlook as break of key technical supports warn of further weakness.
Loss of psychological $80 support (oil registered the first daily close below $80 since Aug 28) and extension and close below next significant supports at $78.09 and $77.71 (200DMA / Fibo 61.8% retracement of $67.02/$95.00) threatens of deeper drop.
Daily studies are in full bearish configuration but oversold, which may keep bears on hold for consolidation before fresh push lower, as the WTI contract is on track for the third consecutive and strong weekly loss and about to break below thick daily Ichimoku cloud.
Broken Fibo support and 200DMA ($77.71/$78.09) reverted to solid resistances which should ideally cap and guard upper pivot at $80 (psychological, reinforced by daily Tenkan-sen) break of which would harm larger bears and sideline immediate downside risk.
Res: 76.21; 77.71; 78.09; 80.00.
Sup: 74.92; 73.62; 72.70; 70.20.
EUR/USD Daily Outlook
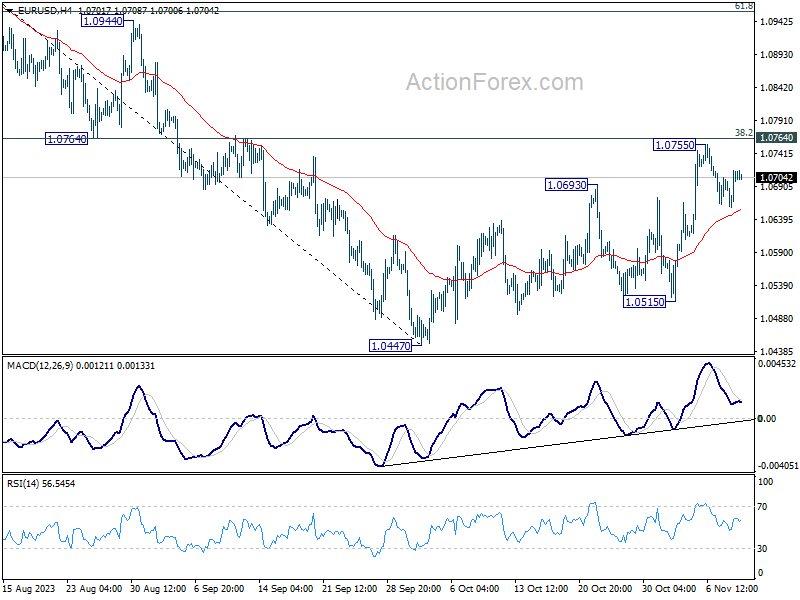
Daily Pivots: (S1) 1.0673; (P) 1.0695; (R1) 1.0730; More...
Intraday bias in EUR/USD stays neutral at this point. Further rally is in favor as long as 55 4H EMA (now at 1.0656) holds. Decisive break of 1.0764 cluster resistance (38.2% retracement of 1.1274 to 1.0447 at 1.0763) will extend the rise from 1.0447 to 61.8% retracement at 1.0958 next. However, sustained break of 55 4H EMA will argue that the rebound has completed, and target 1.0515 support, and then 1.0447 low.
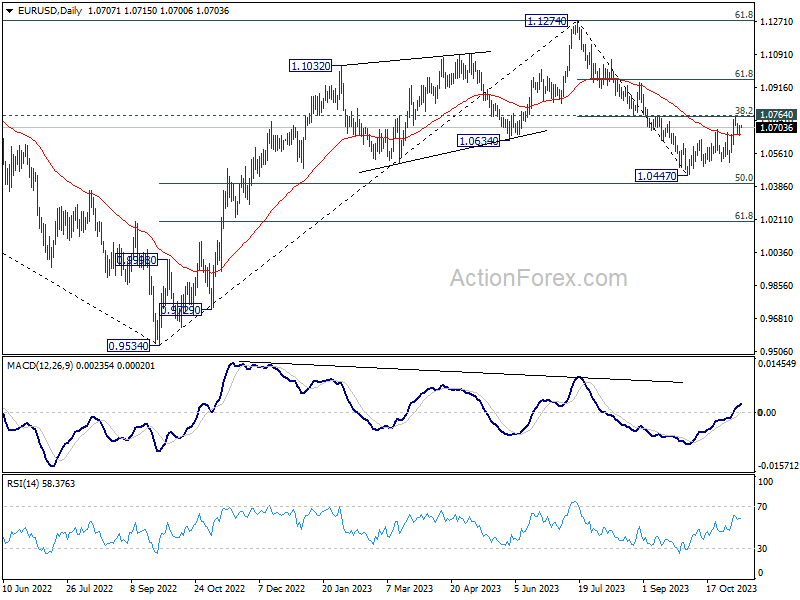
In the bigger picture, price actions from 1.1274 are viewed as a corrective pattern to rise from 0.9534 (2022 low). Rise from 1.0447 is tentatively seen as the second leg. Hence while further rally could be seen, upside should be limited by 1.1274 to bring the third leg of the pattern.
GBP/USD Daily Outlook
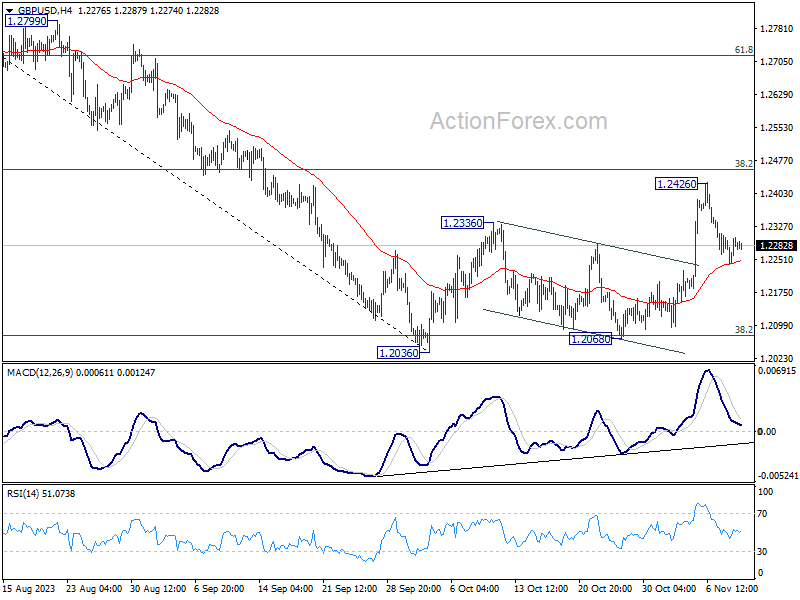
Daily Pivots: (S1) 1.2250; (P) 1.2277; (R1) 1.2313; More
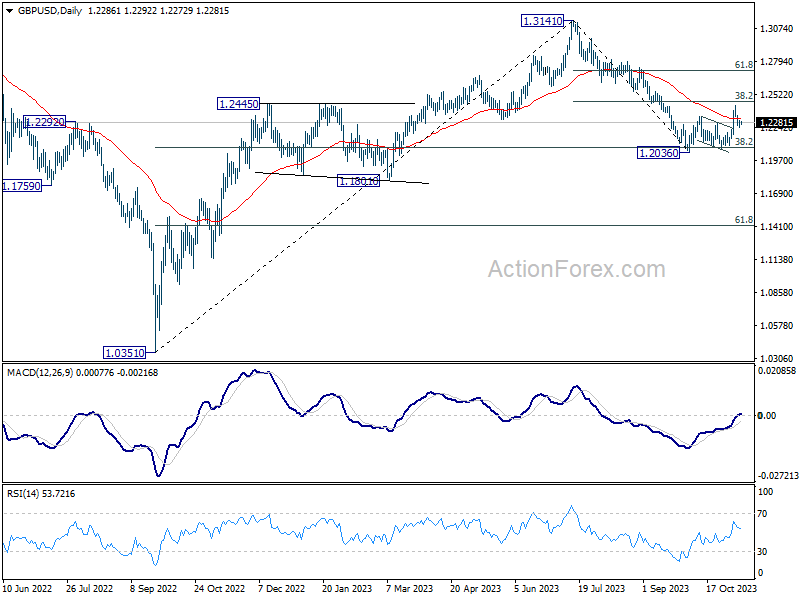
Intraday bias in GBP/USD remains neutral for the moment. Strong rebound from 55 4H EMA (now at 1.2246) will maintain near term bullishness for another rise to 38.2% retracement of 1.3141 to 1.2036 at 1.2458. However, sustained break of 4H 55 EMA will revive near term bearishness and bring retest of 1.2036 low instead.
In the bigger picture, the strong rebound from 38.2% retracement of 1.0351 to 1.3141 at 1.2075 argues that price action from 1.3141 are merely a correction to rise from 1.0351 (2022 low). Current rally from 1.2036 is tentatively seen as the second leg of the pattern. Hence, while further rally is in favor, upside should be limited by 1.3141 to start the third leg.
USD/JPY Daily Outlook
Daily Pivots: (S1) 150.51; (P) 150.79; (R1) 151.25; More...
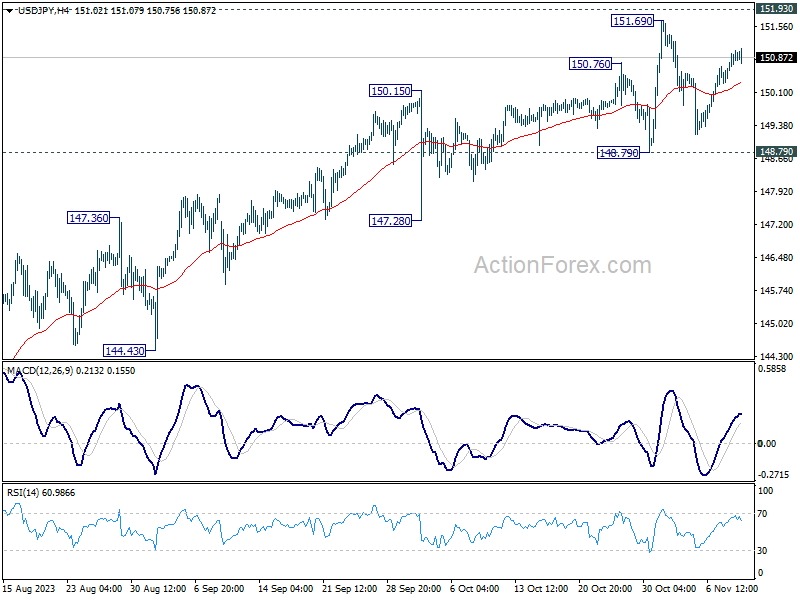
Range trading continues in USD/JPY and intraday bias remains neutral. Further rally is expected as long as 148.79 support holds. Firm break of 151.69 high will resume larger up trend. However, decisive break of 148.79 will indicate rejection by 151.93 key resistance, and bring deeper fall through 147.28 support.
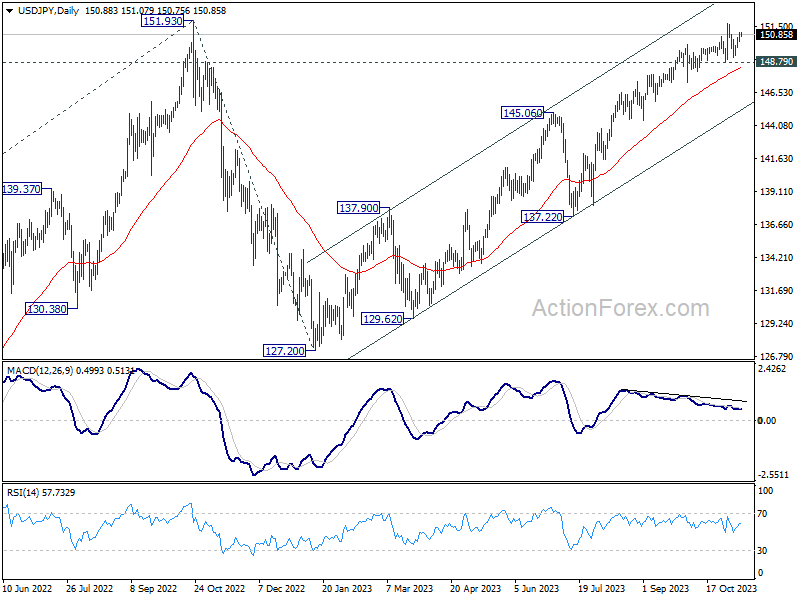
In the bigger picture, immediate focus is on 151.93 resistance (2022 high). Rejection by 151.93, followed by sustained break of 145.06 resistance turned support will argue that rise from 127.20 has completed, and turn outlook bearish for 137.22 support and below. However, sustained break of 151.93 will confirm resumption of long term up trend. Next target will be 61.8% projection of 102.58 to 151.93 from 127.20 at 157.69.
USD/CHF Daily Outlook
Daily Pivots: (S1) 0.8973; (P) 0.8998; (R1) 0.9020; More....
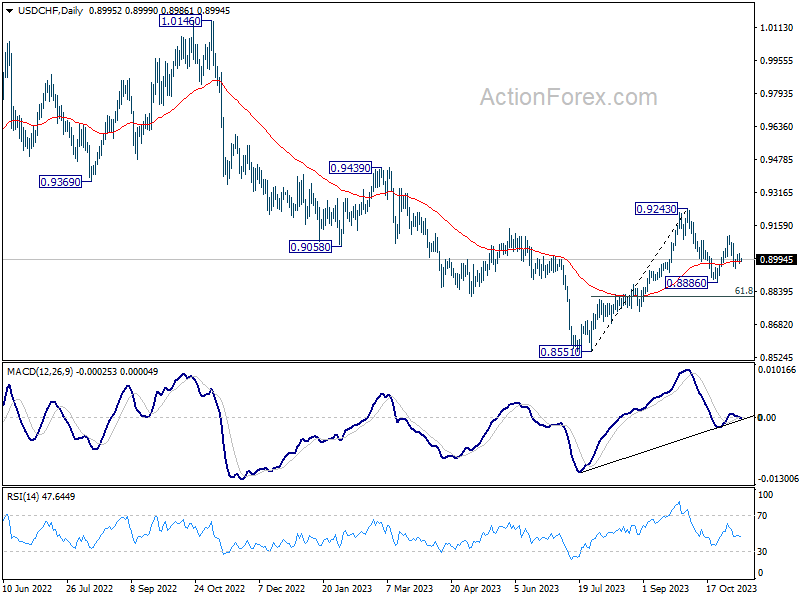
Range trading continues above 0.8952 and intraday bias in USD/CHF stays neutral. On the downside, below 0.8952 will target a test on 0.8886 support first. Break there will resume whole decline from 0.9243 to 0.8815 fibonacci level. However, break of 0.9111 will resume the rebound from 0.8886 instead, and target 0.9243 resistance.
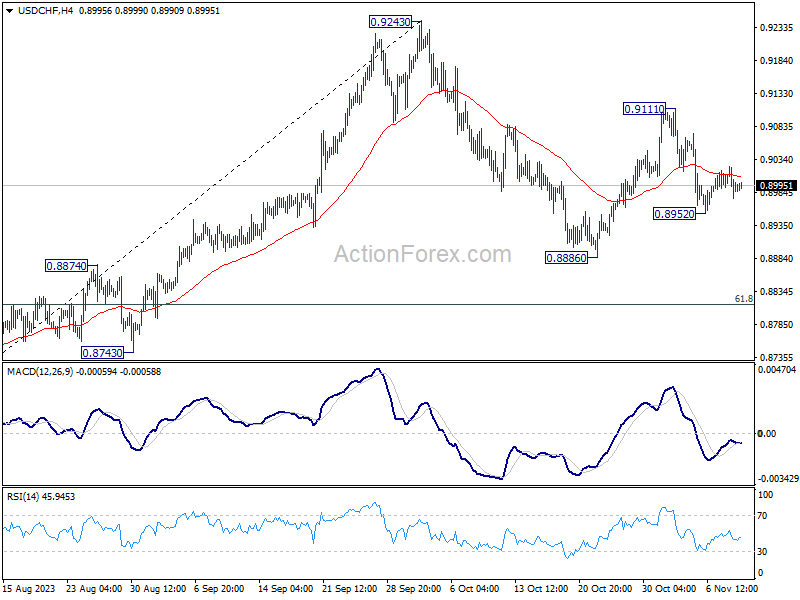
In the bigger picture, outlook is mixed up by the deeper than expected pull back from 0.9243. Yet there was no follow through selling after hitting 0.8886. On the upside, break of 0.9243 resistance will revive the case of medium term bottoming at 0.8851, and turn outlook bullish. However, sustained break of 61.8% retracement of 0.8551 to 0.9243 at 0.8815 will argue that larger decline from 1.0146 is ready to resume through 0.8551 low.
Central Bank Speak Will Again Dominate Market Headlines
Markets
Curve inversion/outperformance of the long end was the name of the game on core bond markets yesterday. US yields ceded between 1.4 bps (2-y) and 11 bps (30-y). The US 10-y yield closed near the key 4.50% reference. German yields showed a similar picture. The 2-y still gained 3.1 bps but the 30-y declined 8.1 bps. The German 10-y yield at 2.62% also closed below the 2.68% neckline, suggesting more downside might be on the cards short-term. The rise of short-term EMU yields was at least partially explained by the ECB consumer expectations survey. EMU consumers in September expected a sharp rise for the year ahead inflation at 4.0% vs 3.5% in August. If this trend persists, it gives the ECB little room to mitigate its anti-inflation campaign. At the same time, consumers turned more negative on the economy and on the labour market over the next 12 months. Uncertainty on (global) growth probably is a driver for recent rebound in bonds with long maturities. ECB speakers (Lane, Nagel, Vujcic, Makhlouf) yesterday at least kept the focus on inflation rather than on growth and indicated that it’s too early to start the debate on (potential) easing. The oil price continued its downtrend, which also might have supported momentum in bonds with longer maturities. Brent oil even closed below $80 p/b. On other markets, European equities enjoyed a constructive momentum. The EuroStoxx 50 gained 0.6% (and off the intraday peak levels). US indices showed no clear trend ending little changed. On FX markets, the dollar gave up early gains. DXY closed little changed at 105.6. After testing the 1.066 area, EUR/USD at 1.071 even closed with a small gain. USD/JPY still was the exception to the rule with the closing just below the 151 big figure. EUR/GBP regained the 0.87 barrier as markets ponder recent comments from the likes of BoE chief economist Pill on the timing of a potential BoE rate cut mid next year.
Asian equities indices mostly trade in positive territory this morning. China underperforms. China CPI (-0.2% Y/Y) and PPI (-2.6% Y/Y) moved (further) into deflation territory, suggesting a mediocre growth momentum. US Treasuries are trading little changed and so does the dollar (DXY 105.55, EUR/USD 1.071). Later today, weekly US jobless claims are interesting and might give some guidance for the intraday momentum on bond markets but evidently is no game changer. Central bank speak will again dominate market headlines, with plenty of ECB and Fed governors giving their view, including ECB Chair Lagarde and Fed Chair Powell. ECB speakers recently mostly pushed back against bets that tightening is done and we don’t expect that to change anytime soon. Fed Powell will speak at an IMF conference debating monetary policy challenges in the global economy. Markets will look out for his assessment on financial conditions after recent market repositioning. A wait-and-see attitude in current environment might extend the bond market rebound and be a tentative negative for the dollar. The US Treasury also will sell $24 bln 30-y bonds.
News & Views
Data from the US Department of Agriculture showed average prices of beef sold in US shops and supermarkets rising to nearly $8 per pound, a record high. Live cattle prices trade near $1.8 per pound at the Chicago Mercantile Exchange, also near highs ($1.87). Years of low rainfall and rising costs for hay and other feeds used for fattening in absence of grass pushed farmers to reduce their cattle stocks. Arabica coffee prices rose to their highest level since June (topping $1.7 per pound) despite good crops in top exporter Brazil. As stronger Brazilian real and port congestion (delay shipments) might be at play. Soy bean prices rose to their highest level since mid-September ($13.85 a bushel) on the back of strong Chinese demand and on fears that dry weather in the northwest of Brazil could reduce production over there.
Minutes of the previous Bank of Canada policy meeting showed that policy makers were split on the need of an additional rate hike following their October pause at 5%. They are keeping the door open as the transmission from higher rates to weaker growth and lower inflation is rather slow. Officials raised their expectations for inflation in the near term, saying higher oil prices, rent and housing costs and the slow normalization of corporate pricing are limiting the disinflation process. They also noted elevated inflation expectations and wage growth. Canadian money markets think we’ve seen peak rates with a first policy rate cut discounted by early H2 next year.
Houston, We Have a Problem
US bond traders are getting ahead of themselves, and it’s about to become a serious problem for the Federal Reserve’s (Fed) ‘last mile’ efforts – as the Fed officials should think carefully how to contain a too-early and too-high optimism from the bond markets – which will unwantedly loosen the financial conditions in the US before the Fed reaches its 2% inflation goal.
The US 10-year yield plunged below the 4.5% mark yesterday, even after a 40-billion-dollar sale of US 10-year papers saw lower-than-expected demand and resulted in a slightly higher-than-anticipated yield of 4.519%. Today, all eyes are on the $24 billion worth of US 30-year bond auction. The US 30-year bond yield plunged to 4.60% yesterday, after rising to 5.17% last month.
That’s disquieting; the US 10-year yield has now fallen more than 50bp in less than 2 weeks. Yes, a part of it is a correction of the accelerated rise that we observed starting from September. But that rise partly explains why the Fed members decided to refrain from announcing another rate hike at the latest policy meeting. As such, the recent fall in long-term yields will certainly get them back to a high alert level.
For now, investors count on the idea that the US jobs market has started slowing and that will continue. But sufficiently loose market conditions could keep the US jobs market in a health place, and spoil sentiment.
China has a different problem
China doesn’t have inflation and it can’t create it; that’s a problem. Released today, the latest Chinese CPI data came in worse than expected. The Chinese consumer prices fell 0.2% in October, on a yearly basis, versus no change expected, and producer prices fell 2.6%, slightly better than expected but not encouraging.
The soft CPI figures boost expectations for more Chinese stimulus and more interest rate cuts. And the news that high-level Chinese and US officials including Xi Jinping will wine and dine to improve their shaky relationship is encouraging, but the CSI 300 index remains poorly bid. The IMF recently rose its growth outlook for China to 5.4% this year, and 4.6% for next year, mostly on Beijing’s plans to issue more debt to get things going. But China’s severe property crisis, broken household and investor confidence warn that Beijing must either throw in mega stimulus measures or proceed with understandable structural reforms to bring investors back to China. In numbers, China recorded its first capital outflows on record, since 1998. Investors sold $11.8 billion more Chinese assets last quarter than they bought, and the outflows will continue unless something dramatically changes.
Oil’s race to the bottom
Worries regarding the Chinese economy don’t help lift sentiment in oil markets. The barrel of US crude fell to $75pb yesterday as the selloff continued at full speed. The selloff should slow as the market is now at the limit of oversold conditions, but investors are increasingly concerned about slowing global demand. Therefore, the supply side shocks, or potential supply side shocks are being mostly ignored. A fall below the $75pb level should open the door of a deeper fall to $70bp. We could however see a minor rebound to around the $78/80pb region before a deeper selloff.